Breve Análise do Conversível Dell Inspiron 7390 2-em-1 Black Edition
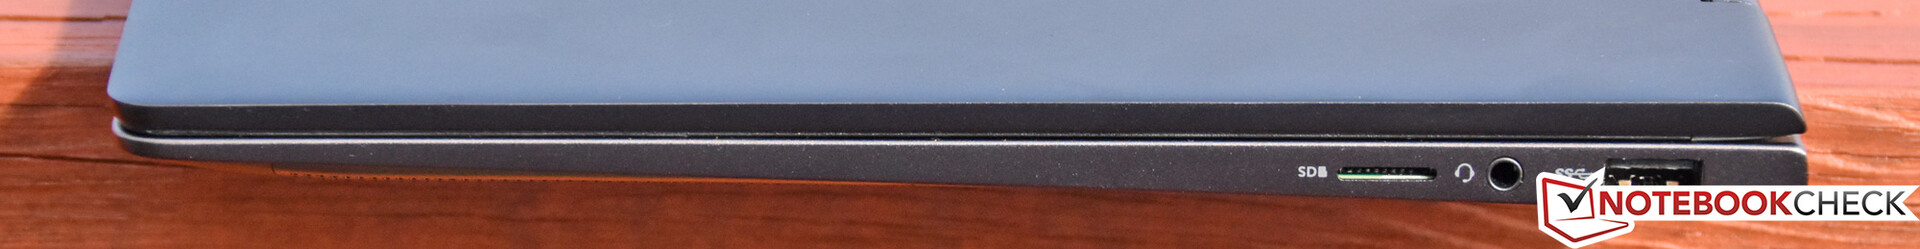
| SD Card Reader | |
| average JPG Copy Test (av. of 3 runs) | |
| Dell Latitude 7400 2-in-1 (Toshiba Exceria Pro M501 UHS-II) | |
| Lenovo ThinkPad X390 Yoga-20NQS05R00 (Toshiba Exceria Pro M501) | |
| HP Envy x360 13-ar0601ng (Toshiba Exceria Pro M501 microSDXC 64GB) | |
| Média da turma Convertible (29.4 - 141, n=20, últimos 2 anos) | |
| Dell Inspiron 7390 2-in-1 (Toshiba Exceria Pro M501 UHS-II) | |
| maximum AS SSD Seq Read Test (1GB) | |
| Dell Latitude 7400 2-in-1 (Toshiba Exceria Pro M501 UHS-II) | |
| Média da turma Convertible (67.5 - 254, n=19, últimos 2 anos) | |
| HP Envy x360 13-ar0601ng (Toshiba Exceria Pro M501 microSDXC 64GB) | |
| Lenovo ThinkPad X390 Yoga-20NQS05R00 (Toshiba Exceria Pro M501) | |
| Dell Inspiron 13 7386 (Toshiba Exceria Pro M501 microSDXC 64GB) | |
| Dell Inspiron 7390 2-in-1 (Toshiba Exceria Pro M501 UHS-II) | |
| |||||||||||||||||||||||||
iluminação: 94 %
iluminação com acumulador: 329.8 cd/m²
Contraste: 1268:1 (Preto: 0.26 cd/m²)
ΔE ColorChecker Calman: 3.05 | ∀{0.5-29.43 Ø4.71}
calibrated: 2.03
ΔE Greyscale Calman: 2.1 | ∀{0.09-98 Ø4.96}
94% sRGB (Argyll 1.6.3 3D)
61% AdobeRGB 1998 (Argyll 1.6.3 3D)
66.5% AdobeRGB 1998 (Argyll 3D)
94.2% sRGB (Argyll 3D)
65.6% Display P3 (Argyll 3D)
Gamma: 2.082
CCT: 6713 K
| Dell Inspiron 7390 2-in-1 AUO252B, IPS, 13.3", 3840x2160 | Lenovo ThinkPad X1 Yoga 2019-20QGS00A00 B140HAN05.8, IPS LED, 14", 1920x1080 | HP Envy x360 13-ar0601ng InfoVision, M133NVF3 R2, IPS, 120 Hz, 13.3", 1920x1080 | Lenovo ThinkPad X390 Yoga-20NQS05R00 LP133WF7-SPA1, IPS LED, 13.3", 1920x1080 | Dell Latitude 7400 2-in-1 SHP14A2, IPS, 14", 1920x1080 | Dell Inspiron 13 7386 Chi Mei CMN1385 / 133DCE / Dell 3GRT6, IPS, 13.3", 3840x2160 | |
|---|---|---|---|---|---|---|
| Display | 3% | -4% | 1% | 5% | 5% | |
| Display P3 Coverage (%) | 65.6 | 67.1 2% | 63 -4% | 65.2 -1% | 68.6 5% | 68.2 4% |
| sRGB Coverage (%) | 94.2 | 98.2 4% | 90.8 -4% | 97 3% | 99.6 6% | 99.8 6% |
| AdobeRGB 1998 Coverage (%) | 66.5 | 68.9 4% | 63.8 -4% | 67.3 1% | 70 5% | 70 5% |
| Response Times | -2% | 40% | 7% | 0% | 10% | |
| Response Time Grey 50% / Grey 80% * (ms) | 56.4 ? | 61.6 ? -9% | 35 ? 38% | 59.2 ? -5% | 56 ? 1% | 57 ? -1% |
| Response Time Black / White * (ms) | 37.6 ? | 35.2 ? 6% | 22 ? 41% | 30.8 ? 18% | 38 ? -1% | 30 ? 20% |
| PWM Frequency (Hz) | 4065 ? | 1667 ? | 26000 ? | |||
| Screen | -14% | -5% | -32% | -0% | -11% | |
| Brightness middle (cd/m²) | 329.8 | 372 13% | 633 92% | 319 -3% | 277.2 -16% | 318 -4% |
| Brightness (cd/m²) | 325 | 368 13% | 675 108% | 306 -6% | 263 -19% | 278 -14% |
| Brightness Distribution (%) | 94 | 88 -6% | 75 -20% | 90 -4% | 83 -12% | 81 -14% |
| Black Level * (cd/m²) | 0.26 | 0.22 15% | 0.55 -112% | 0.15 42% | 0.2 23% | 0.18 31% |
| Contrast (:1) | 1268 | 1691 33% | 1151 -9% | 2127 68% | 1386 9% | 1767 39% |
| Colorchecker dE 2000 * | 3.05 | 4.6 -51% | 3.12 -2% | 6.1 -100% | 2.1 31% | 2.91 5% |
| Colorchecker dE 2000 max. * | 5.01 | 7.8 -56% | 6.37 -27% | 9.7 -94% | 5.91 -18% | 6.11 -22% |
| Colorchecker dE 2000 calibrated * | 2.03 | 0.9 56% | 1.83 10% | 1 51% | 1.03 49% | 2.91 -43% |
| Greyscale dE 2000 * | 2.1 | 5.9 -181% | 3.89 -85% | 8.6 -310% | 3.4 -62% | 4.37 -108% |
| Gamma | 2.082 106% | 2.58 85% | 2.39 92% | 2.62 84% | 2.241 98% | 2.26 97% |
| CCT | 6713 97% | 6516 100% | 6476 100% | 6613 98% | 6030 108% | 6448 101% |
| Color Space (Percent of AdobeRGB 1998) (%) | 61 | 62.7 3% | 59 -3% | 61.9 1% | 64 5% | 70 15% |
| Color Space (Percent of sRGB) (%) | 94 | 97.8 4% | 91 -3% | 96.8 3% | 100 6% | 93 -1% |
| Média Total (Programa/Configurações) | -4% /
-9% | 10% /
1% | -8% /
-21% | 2% /
1% | 1% /
-5% |
* ... menor é melhor
Exibir tempos de resposta
| ↔ Tempo de resposta preto para branco | ||
|---|---|---|
| 37.6 ms ... ascensão ↗ e queda ↘ combinadas | ↗ 20.4 ms ascensão | 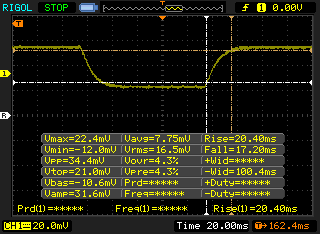 |
| ↘ 17.2 ms queda | ||
| A tela mostra taxas de resposta lentas em nossos testes e será insatisfatória para os jogadores. Em comparação, todos os dispositivos testados variam de 0.1 (mínimo) a 240 (máximo) ms. » 95 % de todos os dispositivos são melhores. Isso significa que o tempo de resposta medido é pior que a média de todos os dispositivos testados (19.8 ms). | ||
| ↔ Tempo de resposta 50% cinza a 80% cinza | ||
| 56.4 ms ... ascensão ↗ e queda ↘ combinadas | ↗ 27.6 ms ascensão | 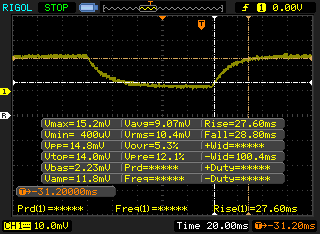 |
| ↘ 28.8 ms queda | ||
| A tela mostra taxas de resposta lentas em nossos testes e será insatisfatória para os jogadores. Em comparação, todos os dispositivos testados variam de 0.165 (mínimo) a 636 (máximo) ms. » 93 % de todos os dispositivos são melhores. Isso significa que o tempo de resposta medido é pior que a média de todos os dispositivos testados (31 ms). | ||
Cintilação da tela / PWM (modulação por largura de pulso)
| Tela tremeluzindo / PWM não detectado | 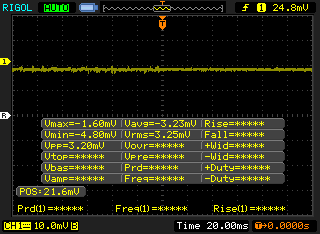 | ||
[pwm_comparison] Em comparação: 52 % de todos os dispositivos testados não usam PWM para escurecer a tela. Se PWM foi detectado, uma média de 7754 (mínimo: 5 - máximo: 343500) Hz foi medida. | |||
| PCMark 8 Home Score Accelerated v2 | 3178 pontos | |
| PCMark 8 Work Score Accelerated v2 | 4333 pontos | |
| PCMark 10 Score | 4038 pontos | |
Ajuda | ||

| Dell Inspiron 7390 2-in-1 Intel Optane Memory H10 with Solid State Storage 32GB + 512GB HBRPEKNX0202A(L/H) | Lenovo ThinkPad X1 Yoga 2019-20QGS00A00 WDC PC SN720 SDAPNTW-512G | HP Envy x360 13-ar0601ng SK Hynix BC501 HFM512GDJTNG | Dell Latitude 7400 2-in-1 Toshiba XG6 KXG60ZNV512G | Dell Inspiron 13 7386 SK Hynix BC501 HFM512GDJTNG | |
|---|---|---|---|---|---|
| AS SSD | 154% | 14% | -14% | 31% | |
| Seq Read (MB/s) | 984 | 2888 193% | 1412 43% | 2289 133% | 1122 14% |
| Seq Write (MB/s) | 320.1 | 2381 644% | 540 69% | 1163 263% | 619 93% |
| 4K Read (MB/s) | 66.2 | 45.66 -31% | 32.24 -51% | 22.29 -66% | 39.58 -40% |
| 4K Write (MB/s) | 128 | 162.4 27% | 74.7 -42% | 28.92 -77% | 108.5 -15% |
| 4K-64 Read (MB/s) | 365.9 | 1276 249% | 567 55% | 415.6 14% | 776 112% |
| 4K-64 Write (MB/s) | 673 | 1432 113% | 700 4% | 199.5 -70% | 671 0% |
| Access Time Read * (ms) | 0.065 | 0.088 -35% | 0.049 25% | 0.122 -88% | 0.045 31% |
| Access Time Write * (ms) | 0.046 | 0.023 50% | 0.048 -4% | 0.143 -211% | 0.033 28% |
| Score Read (Points) | 531 | 1610 203% | 741 40% | 667 26% | 928 75% |
| Score Write (Points) | 833 | 1832 120% | 829 0% | 345 -59% | 841 1% |
| Score Total (Points) | 1628 | 4245 161% | 1913 18% | 1300 -20% | 2228 37% |
| Copy ISO MB/s (MB/s) | 1810 | 521 | 1767 | ||
| Copy Program MB/s (MB/s) | 498.3 | 253.1 | 379.4 | ||
| Copy Game MB/s (MB/s) | 921 | 392.9 | 1055 | ||
| CrystalDiskMark 5.2 / 6 | 78% | -18% | -1% | -17% | |
| Write 4K (MB/s) | 99.7 | 194.3 95% | 88.3 -11% | 35.06 -65% | 97.4 -2% |
| Read 4K (MB/s) | 113.7 | 51.2 -55% | 34.84 -69% | 23.64 -79% | 38.05 -67% |
| Write Seq (MB/s) | 511 | 1773 247% | 740 45% | 1537 201% | 656 28% |
| Read Seq (MB/s) | 1431 | 2512 76% | 985 -31% | 1782 25% | 1043 -27% |
| Write 4K Q32T1 (MB/s) | 313.5 | 431.7 38% | 313.7 0% | 100.3 -68% | 331.5 6% |
| Read 4K Q32T1 (MB/s) | 289.1 | 539 86% | 243.1 -16% | 62.7 -78% | 253.8 -12% |
| Write Seq Q32T1 (MB/s) | 1274 | 2538 99% | 846 -34% | 2698 112% | 879 -31% |
| Read Seq Q32T1 (MB/s) | 2500 | 3489 40% | 1783 -29% | 1073 -57% | 1639 -34% |
| Write 4K Q8T8 (MB/s) | 867 | 305.7 | |||
| Read 4K Q8T8 (MB/s) | 1315 | 698 | |||
| Média Total (Programa/Configurações) | 116% /
122% | -2% /
1% | -8% /
-9% | 7% /
10% |
* ... menor é melhor

| 3DMark 11 Performance | 2131 pontos | |
| 3DMark Cloud Gate Standard Score | 8645 pontos | |
| 3DMark Fire Strike Score | 1194 pontos | |
Ajuda | ||
| Metro: Last Light | |
| 1024x768 Low (DX10) AF:4x | |
| Dell Inspiron 7390 2-in-1 | |
| Média Intel UHD Graphics 620 (23.3 - 41, n=5) | |
| 1366x768 Medium (DX10) AF:4x | |
| Dell Inspiron 7390 2-in-1 | |
| Média Intel UHD Graphics 620 (16.4 - 28, n=4) | |
| 1366x768 High (DX11) AF:16x | |
| Dell Inspiron 7390 2-in-1 | |
| Média Intel UHD Graphics 620 (13 - 16, n=3) | |
| 1920x1080 Very High (DX11) AF:16x | |
| Dell Inspiron 7390 2-in-1 | |
| Média Intel UHD Graphics 620 (6 - 8, n=3) | |
| Rise of the Tomb Raider | |
| 1024x768 Lowest Preset | |
| HP Envy x360 13-ar0601ng | |
| Lenovo ThinkPad X390 Yoga-20NQS05R00 | |
| Média Intel UHD Graphics 620 (10.4 - 110.7, n=82) | |
| Dell Inspiron 7390 2-in-1 | |
| Lenovo ThinkPad X1 Yoga 2019-20QGS00A00 | |
| 1366x768 Medium Preset AF:2x | |
| Lenovo ThinkPad X390 Yoga-20NQS05R00 | |
| Dell Inspiron 7390 2-in-1 | |
| Média Intel UHD Graphics 620 (6.5 - 49.3, n=62) | |
| 1920x1080 High Preset AA:FX AF:4x | |
| HP Envy x360 13-ar0601ng | |
| Média Intel UHD Graphics 620 (4.9 - 32, n=42) | |
| Dell Inspiron 7390 2-in-1 | |
| 1920x1080 Very High Preset AA:FX AF:16x | |
| Dell Inspiron 7390 2-in-1 | |
| Média Intel UHD Graphics 620 (3 - 14.5, n=11) | |
| baixo | média | alto | ultra | |
|---|---|---|---|---|
| BioShock Infinite (2013) | 64 | 33 | 29 | 10 |
| Metro: Last Light (2013) | 35 | 28 | 16 | 8 |
| Rise of the Tomb Raider (2016) | 21 | 13 | 7 | 6 |
| Dell Inspiron 7390 2-in-1 UHD Graphics 620, i7-8565U, Intel Optane Memory H10 with Solid State Storage 32GB + 512GB HBRPEKNX0202A(L/H) | Lenovo ThinkPad X1 Yoga 2019-20QGS00A00 UHD Graphics 620, i7-8565U, WDC PC SN720 SDAPNTW-512G | HP Envy x360 13-ar0601ng Vega 10, R7 3700U, SK Hynix BC501 HFM512GDJTNG | Lenovo ThinkPad X390 Yoga-20NQS05R00 UHD Graphics 620, i7-8565U, Intel SSD Pro 7600p SSDPEKKF512G8L | Dell Latitude 7400 2-in-1 UHD Graphics 620, i7-8665U, Toshiba XG6 KXG60ZNV512G | Dell Inspiron 13 7386 UHD Graphics 620, i7-8565U, SK Hynix BC501 HFM512GDJTNG | |
|---|---|---|---|---|---|---|
| Noise | 3% | -9% | 2% | 10% | 0% | |
| desligado / ambiente * (dB) | 28.2 | 29.3 -4% | 30.5 -8% | 29.2 -4% | 28.2 -0% | 30.3 -7% |
| Idle Minimum * (dB) | 28.2 | 29.3 -4% | 32.2 -14% | 29.2 -4% | 28.2 -0% | 30.4 -8% |
| Idle Average * (dB) | 28.2 | 29.3 -4% | 32.2 -14% | 29.2 -4% | 28.2 -0% | 30.4 -8% |
| Idle Maximum * (dB) | 28.2 | 31.1 -10% | 32.2 -14% | 29.2 -4% | 28.3 -0% | 30.4 -8% |
| Load Average * (dB) | 37.3 | 32.7 12% | 40.8 -9% | 35 6% | 28.2 24% | 34.3 8% |
| Load Maximum * (dB) | 44.4 | 32.7 26% | 41.9 6% | 35 21% | 28.8 35% | 34.2 23% |
* ... menor é melhor
Barulho
| Ocioso |
| 28.2 / 28.2 / 28.2 dB |
| Carga |
| 37.3 / 44.4 dB |
 | ||
30 dB silencioso 40 dB(A) audível 50 dB(A) ruidosamente alto |
||
min: | ||
(±) A temperatura máxima no lado superior é 42 °C / 108 F, em comparação com a média de 35.4 °C / 96 F , variando de 19.6 a 60 °C para a classe Convertible.
(-) A parte inferior aquece até um máximo de 46.6 °C / 116 F, em comparação com a média de 36.9 °C / 98 F
(+) Em uso inativo, a temperatura média para o lado superior é 28.1 °C / 83 F, em comparação com a média do dispositivo de 30.3 °C / ### class_avg_f### F.
(+) Os apoios para as mãos e o touchpad estão atingindo a temperatura máxima da pele (32.8 °C / 91 F) e, portanto, não estão quentes.
(-) A temperatura média da área do apoio para as mãos de dispositivos semelhantes foi 28 °C / 82.4 F (-4.8 °C / -8.6 F).
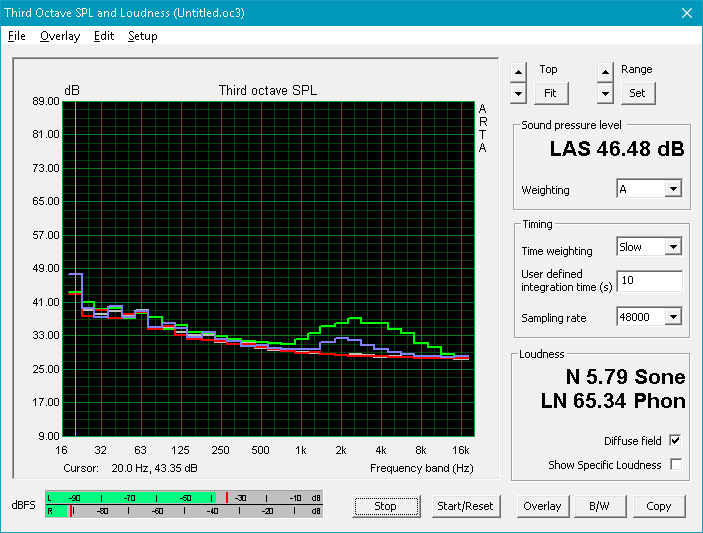
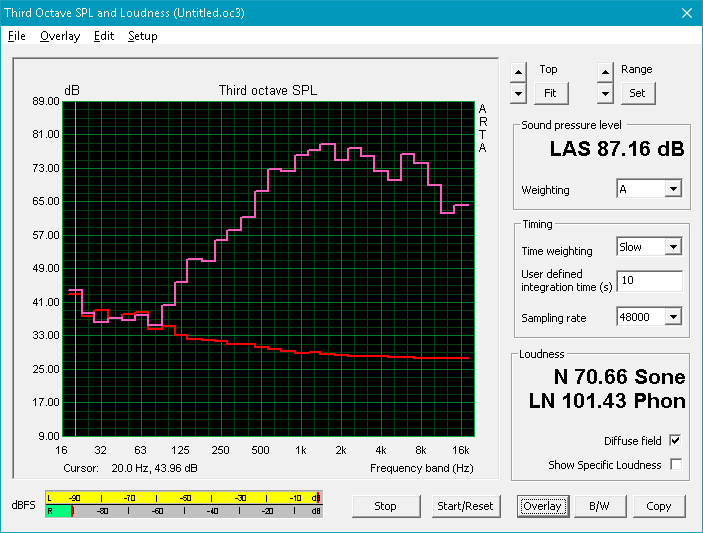
Dell Inspiron 7390 2-in-1 análise de áudio
(+) | os alto-falantes podem tocar relativamente alto (###valor### dB)
Graves 100 - 315Hz
(-) | quase nenhum baixo - em média 20.3% menor que a mediana
(±) | a linearidade dos graves é média (9.5% delta para a frequência anterior)
Médios 400 - 2.000 Hz
(±) | médios mais altos - em média 5.1% maior que a mediana
(±) | a linearidade dos médios é média (7.6% delta para frequência anterior)
Altos 2 - 16 kHz
(+) | agudos equilibrados - apenas 3.6% longe da mediana
(±) | a linearidade dos máximos é média (8.2% delta para frequência anterior)
Geral 100 - 16.000 Hz
(±) | a linearidade do som geral é média (21% diferença em relação à mediana)
Comparado com a mesma classe
» 56% de todos os dispositivos testados nesta classe foram melhores, 10% semelhantes, 34% piores
» O melhor teve um delta de 6%, a média foi 20%, o pior foi 57%
Comparado com todos os dispositivos testados
» 58% de todos os dispositivos testados foram melhores, 7% semelhantes, 35% piores
» O melhor teve um delta de 4%, a média foi 23%, o pior foi 134%
Dell Latitude 7400 2-in-1 análise de áudio
(+) | os alto-falantes podem tocar relativamente alto (###valor### dB)
Graves 100 - 315Hz
(-) | quase nenhum baixo - em média 17.3% menor que a mediana
(±) | a linearidade dos graves é média (11.7% delta para a frequência anterior)
Médios 400 - 2.000 Hz
(+) | médios equilibrados - apenas 2% longe da mediana
(+) | médios são lineares (5.3% delta para frequência anterior)
Altos 2 - 16 kHz
(+) | agudos equilibrados - apenas 2.9% longe da mediana
(±) | a linearidade dos máximos é média (7.3% delta para frequência anterior)
Geral 100 - 16.000 Hz
(±) | a linearidade do som geral é média (17.3% diferença em relação à mediana)
Comparado com a mesma classe
» 33% de todos os dispositivos testados nesta classe foram melhores, 8% semelhantes, 59% piores
» O melhor teve um delta de 6%, a média foi 20%, o pior foi 57%
Comparado com todos os dispositivos testados
» 32% de todos os dispositivos testados foram melhores, 8% semelhantes, 59% piores
» O melhor teve um delta de 4%, a média foi 23%, o pior foi 134%
| desligado | |
| Ocioso | |
| Carga |
|
Key:
min: | |
| Dell Inspiron 7390 2-in-1 i7-8565U, UHD Graphics 620, Intel Optane Memory H10 with Solid State Storage 32GB + 512GB HBRPEKNX0202A(L/H), IPS, 3840x2160, 13.3" | Lenovo ThinkPad X1 Yoga 2019-20QGS00A00 i7-8565U, UHD Graphics 620, WDC PC SN720 SDAPNTW-512G, IPS LED, 1920x1080, 14" | HP Envy x360 13-ar0601ng R7 3700U, Vega 10, SK Hynix BC501 HFM512GDJTNG, IPS, 120 Hz, 1920x1080, 13.3" | Lenovo ThinkPad X390 Yoga-20NQS05R00 i7-8565U, UHD Graphics 620, Intel SSD Pro 7600p SSDPEKKF512G8L, IPS LED, 1920x1080, 13.3" | Dell Latitude 7400 2-in-1 i7-8665U, UHD Graphics 620, Toshiba XG6 KXG60ZNV512G, IPS, 1920x1080, 14" | Dell Inspiron 13 7386 i7-8565U, UHD Graphics 620, SK Hynix BC501 HFM512GDJTNG, IPS, 3840x2160, 13.3" | |
|---|---|---|---|---|---|---|
| Power Consumption | 3% | 19% | 2% | 22% | -26% | |
| Idle Minimum * (Watt) | 4.6 | 3.8 17% | 3.2 30% | 3.46 25% | 2.6 43% | 6.5 -41% |
| Idle Average * (Watt) | 7.5 | 6.1 19% | 2.8 63% | 5.88 22% | 4.3 43% | 12.2 -63% |
| Idle Maximum * (Watt) | 7.8 | 9.1 -17% | 12.4 -59% | 9.12 -17% | 5.5 29% | 12.7 -63% |
| Load Average * (Watt) | 37.6 | 38.6 -3% | 24.2 36% | 45.6 -21% | 32 15% | 39 -4% |
| Load Maximum * (Watt) | 65.3 | 64.5 1% | 50 23% | 65.9 -1% | 78.8 -21% | 39 40% |
* ... menor é melhor
| Dell Inspiron 7390 2-in-1 i7-8565U, UHD Graphics 620, 52 Wh | Lenovo ThinkPad X1 Yoga 2019-20QGS00A00 i7-8565U, UHD Graphics 620, 51 Wh | HP Envy x360 13-ar0601ng R7 3700U, Vega 10, 53 Wh | Lenovo ThinkPad X390 Yoga-20NQS05R00 i7-8565U, UHD Graphics 620, 50 Wh | Dell Latitude 7400 2-in-1 i7-8665U, UHD Graphics 620, 78 Wh | Dell Inspiron 13 7386 i7-8565U, UHD Graphics 620, 38 Wh | |
|---|---|---|---|---|---|---|
| Duração da bateria | 2% | -0% | -3% | 85% | -39% | |
| Reader / Idle (h) | 12.7 | 10.5 -17% | 6.7 -47% | |||
| WiFi v1.3 (h) | 6.6 | 9 36% | 7.3 11% | 8.2 24% | 12.2 85% | 3.9 -41% |
| Load (h) | 2.1 | 1.4 -33% | 2.2 5% | 1.5 -29% | 1.5 -29% |
Pro
Contra
O Dell Inspiron 7390 2-em-1 Black Edition de US$ 1.249 (conforme configurado) pode não parecer muito diferente de seu antecessor, mas na verdade resolve algumas das maiores reclamações que tivemos sobre o Inspiron 7386 2-em-1. A principal delas é o consumo de energia no modo ocioso, que caiu quase para a metade, e a duração da bateria, que é 40% mais longa do que antes. Também não detectamos nenhum ruído da bobina em nossa unidade de teste, e a tela é um pouco mais brilhante do que antes. Até o desempenho da CPU também está um pouco melhor do que era anteriormente, apesar do fato de as duas máquinas serem impulsionadas pelo mesmo chip.
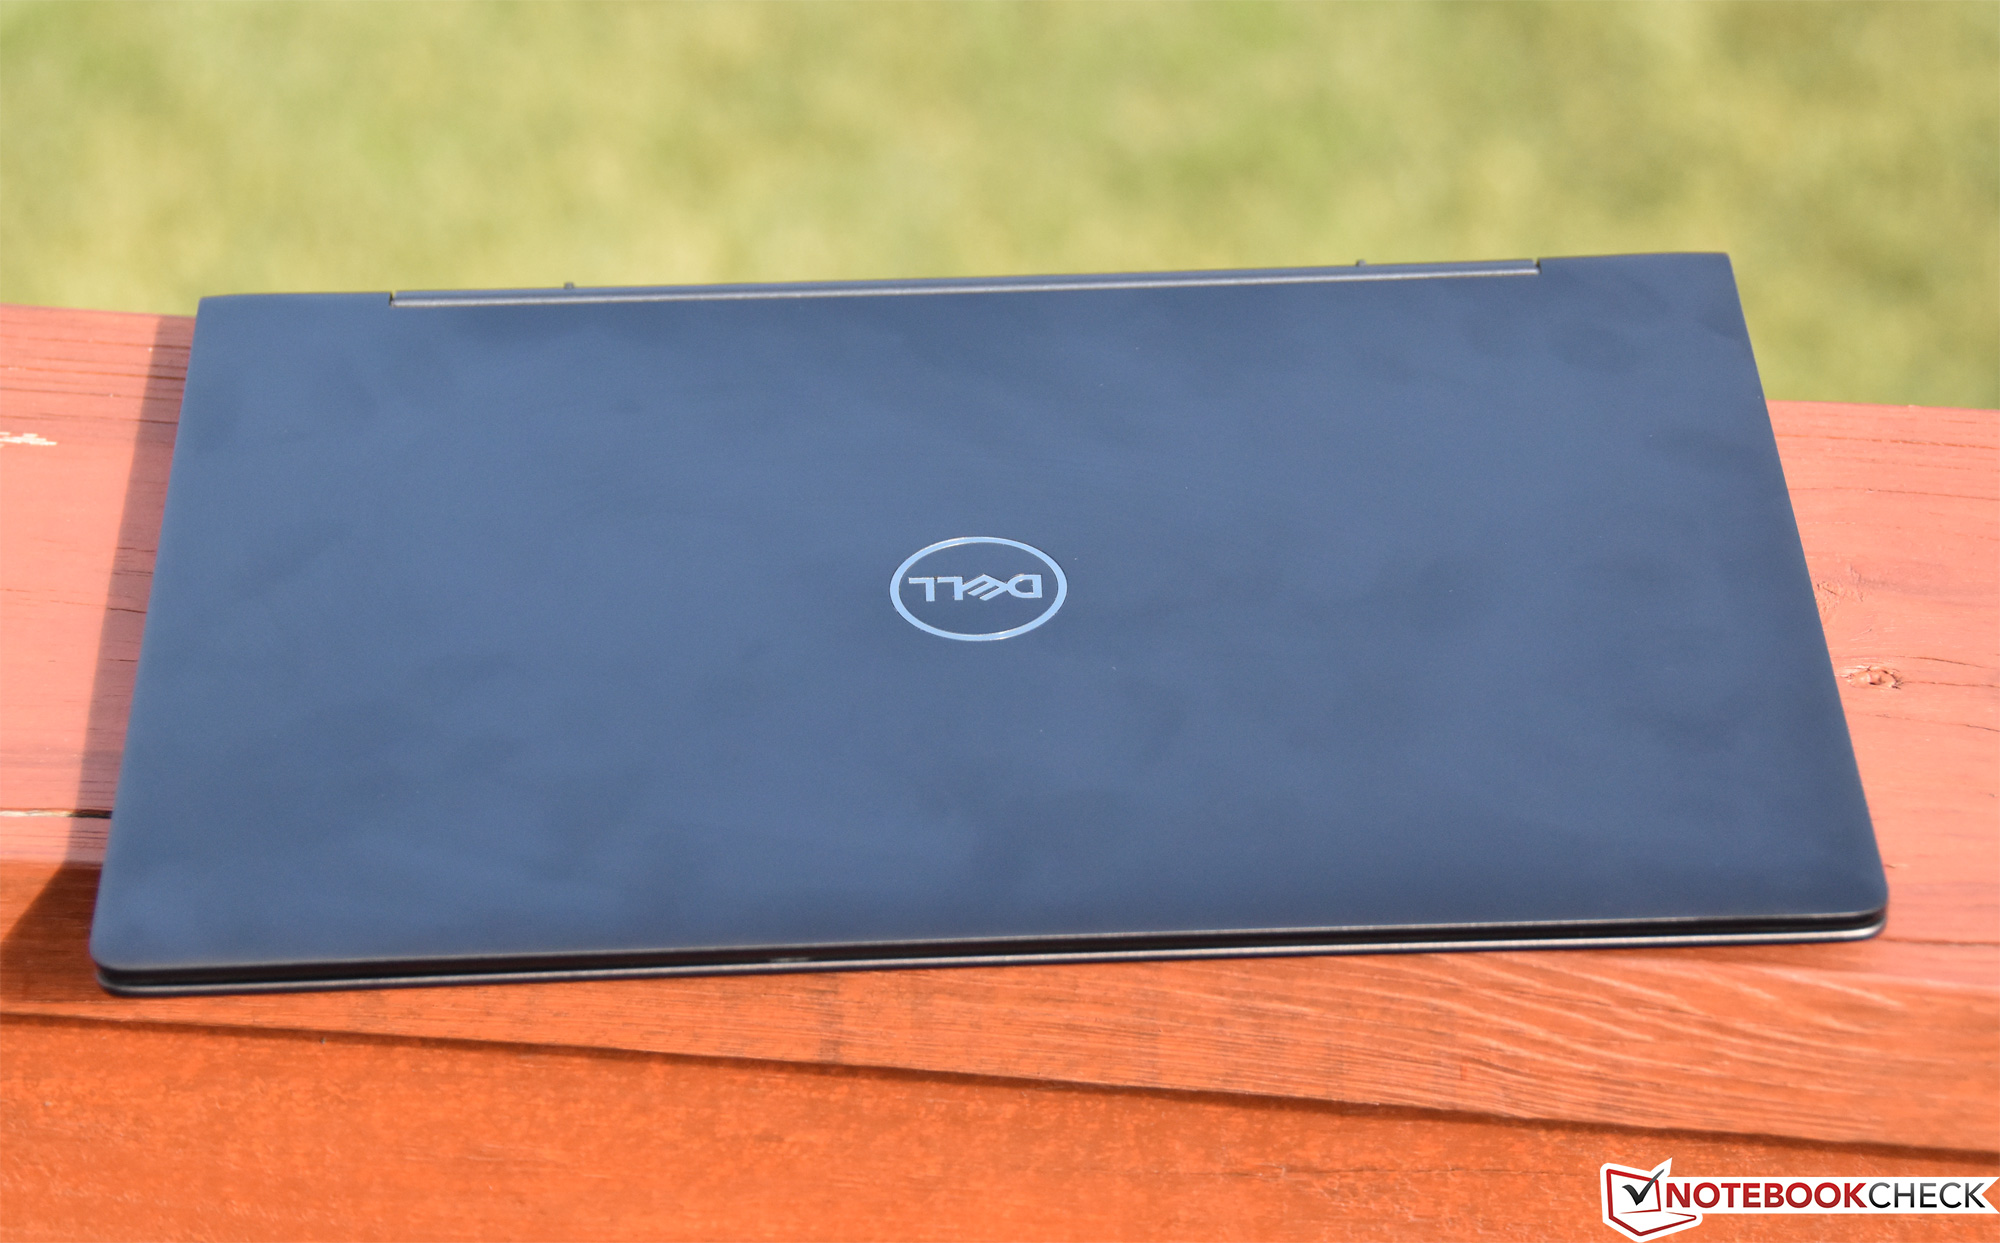
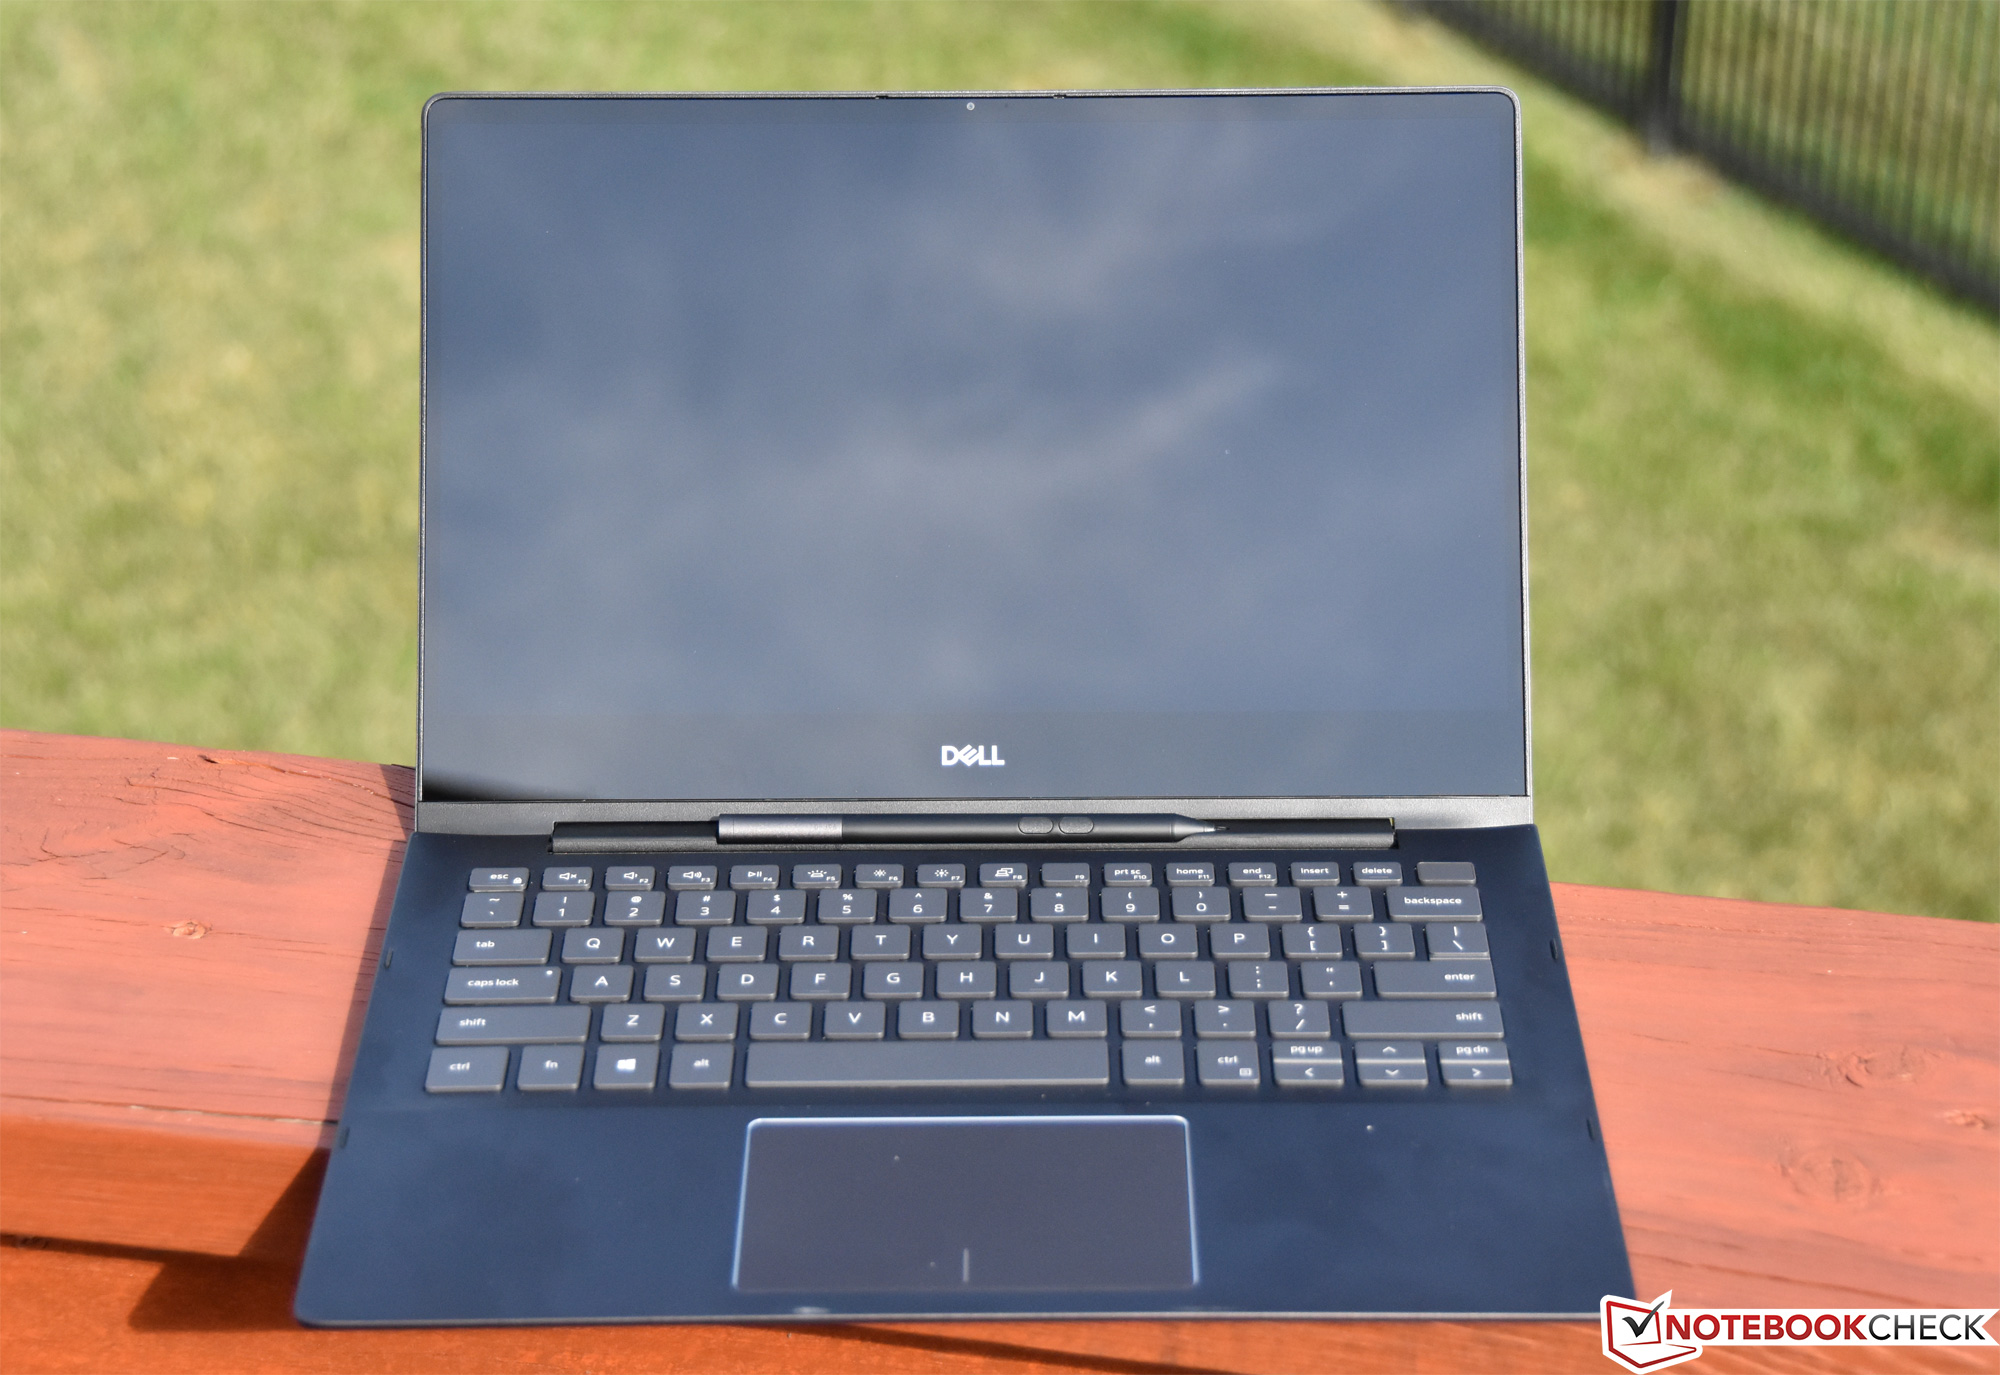
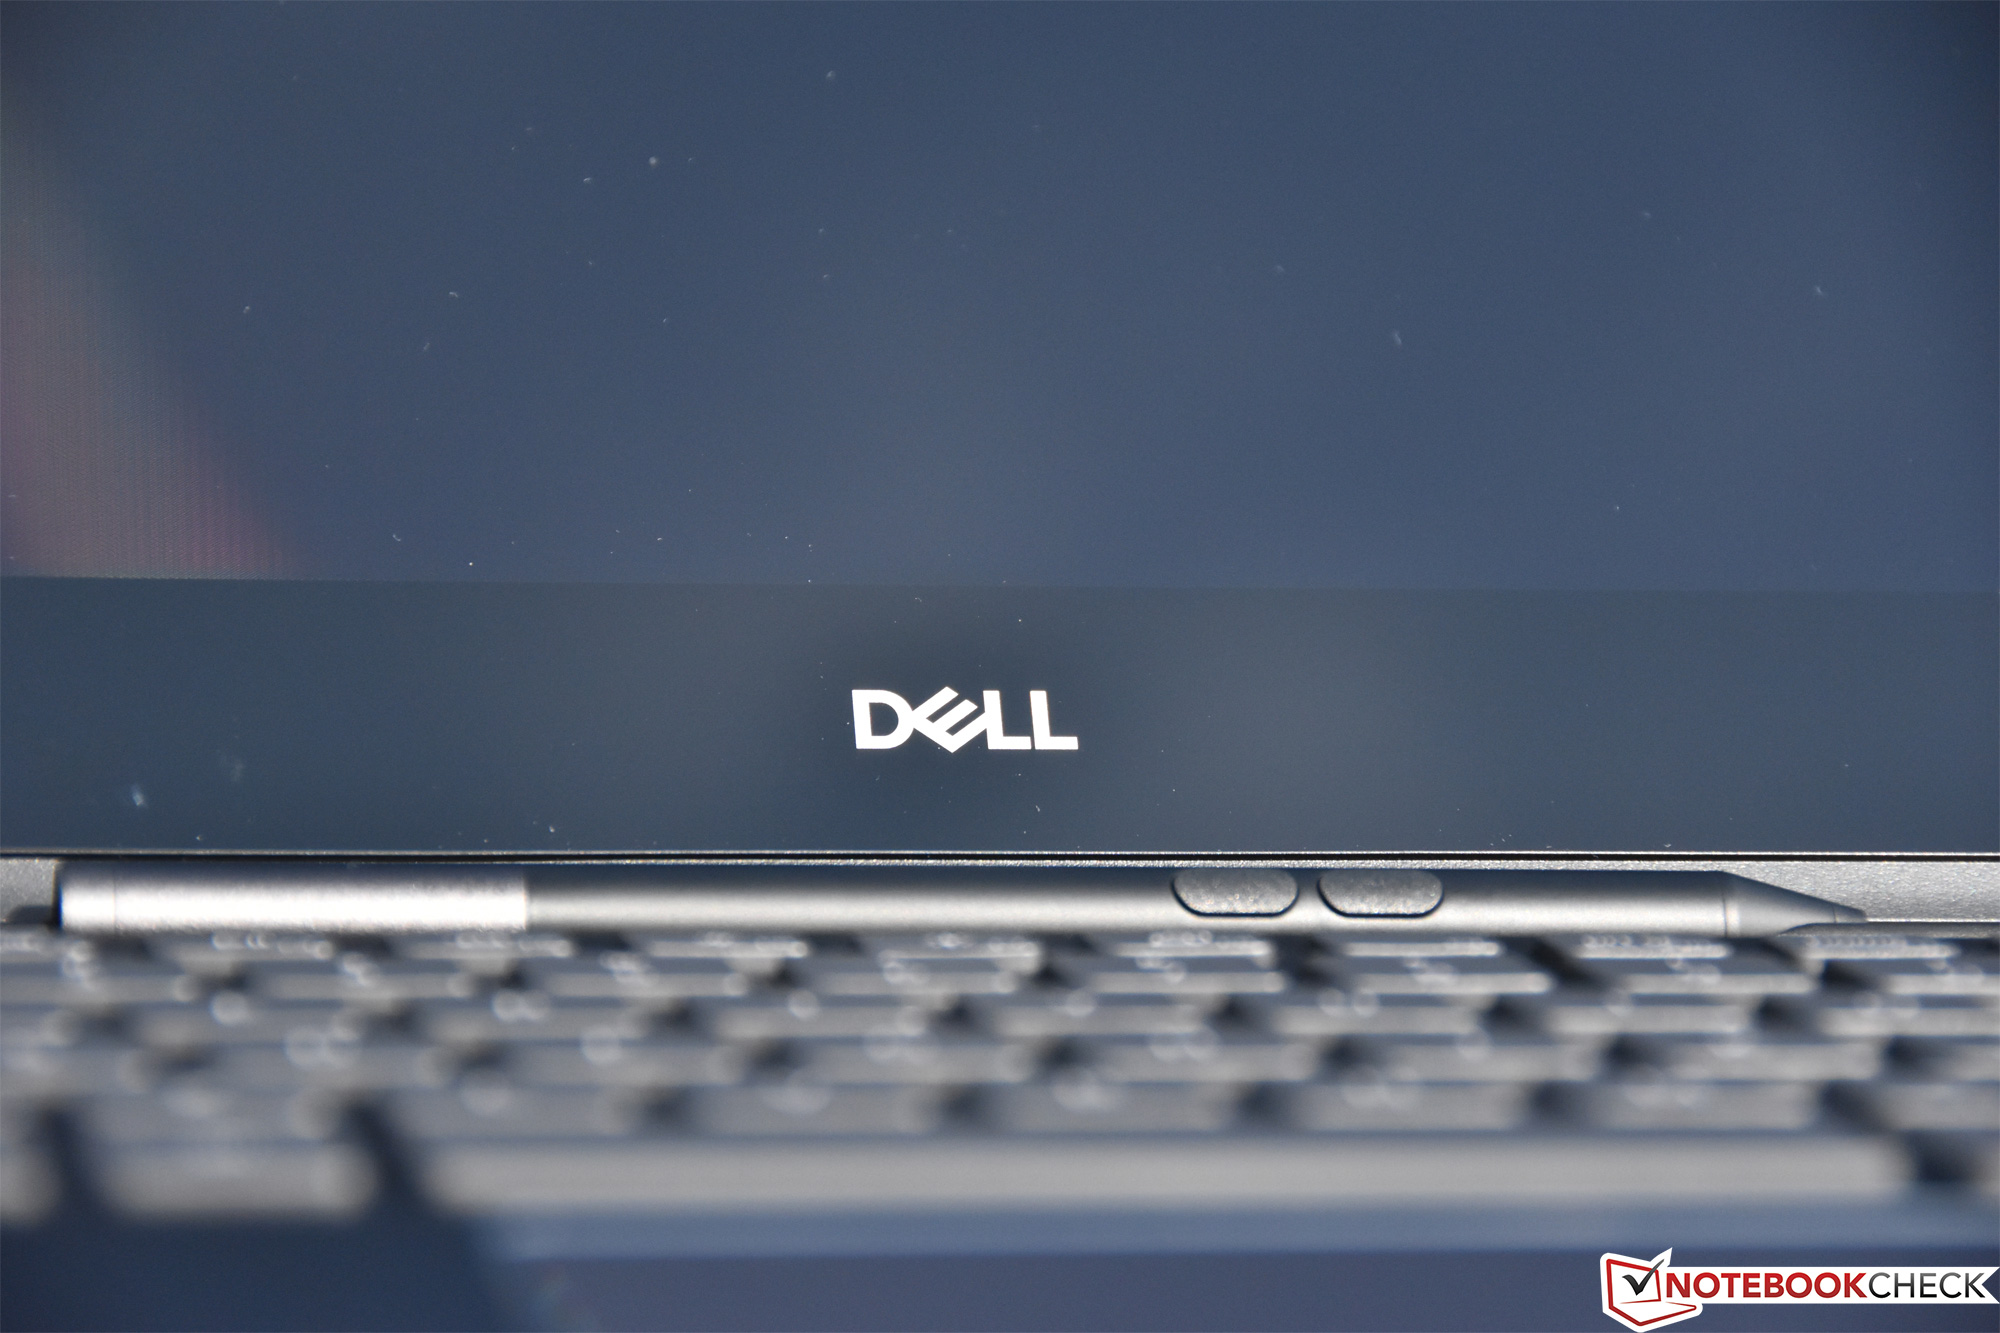
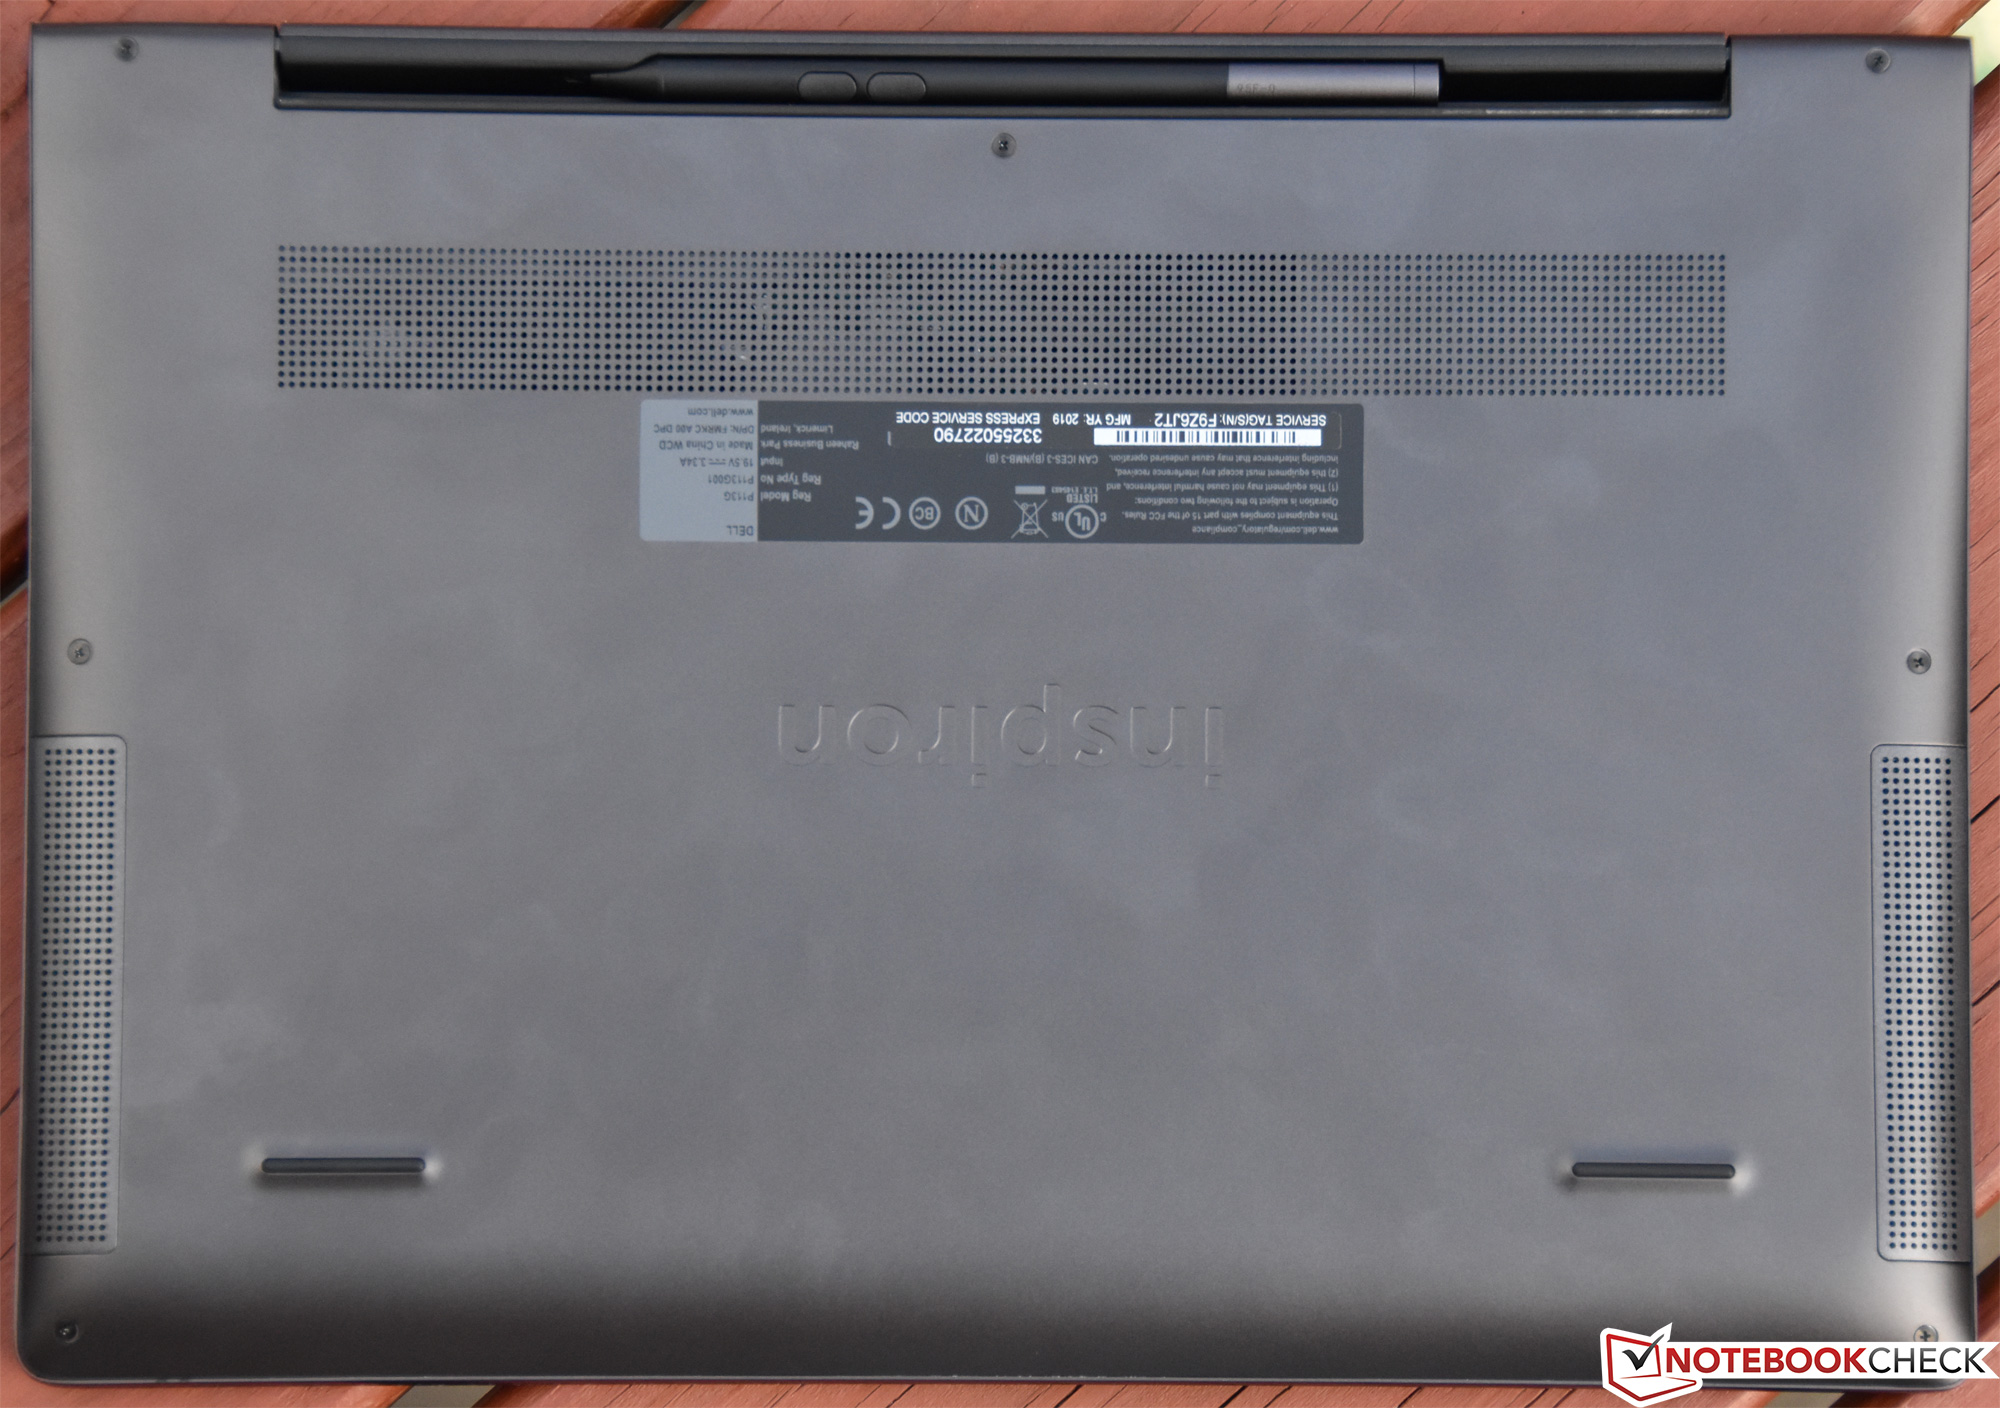
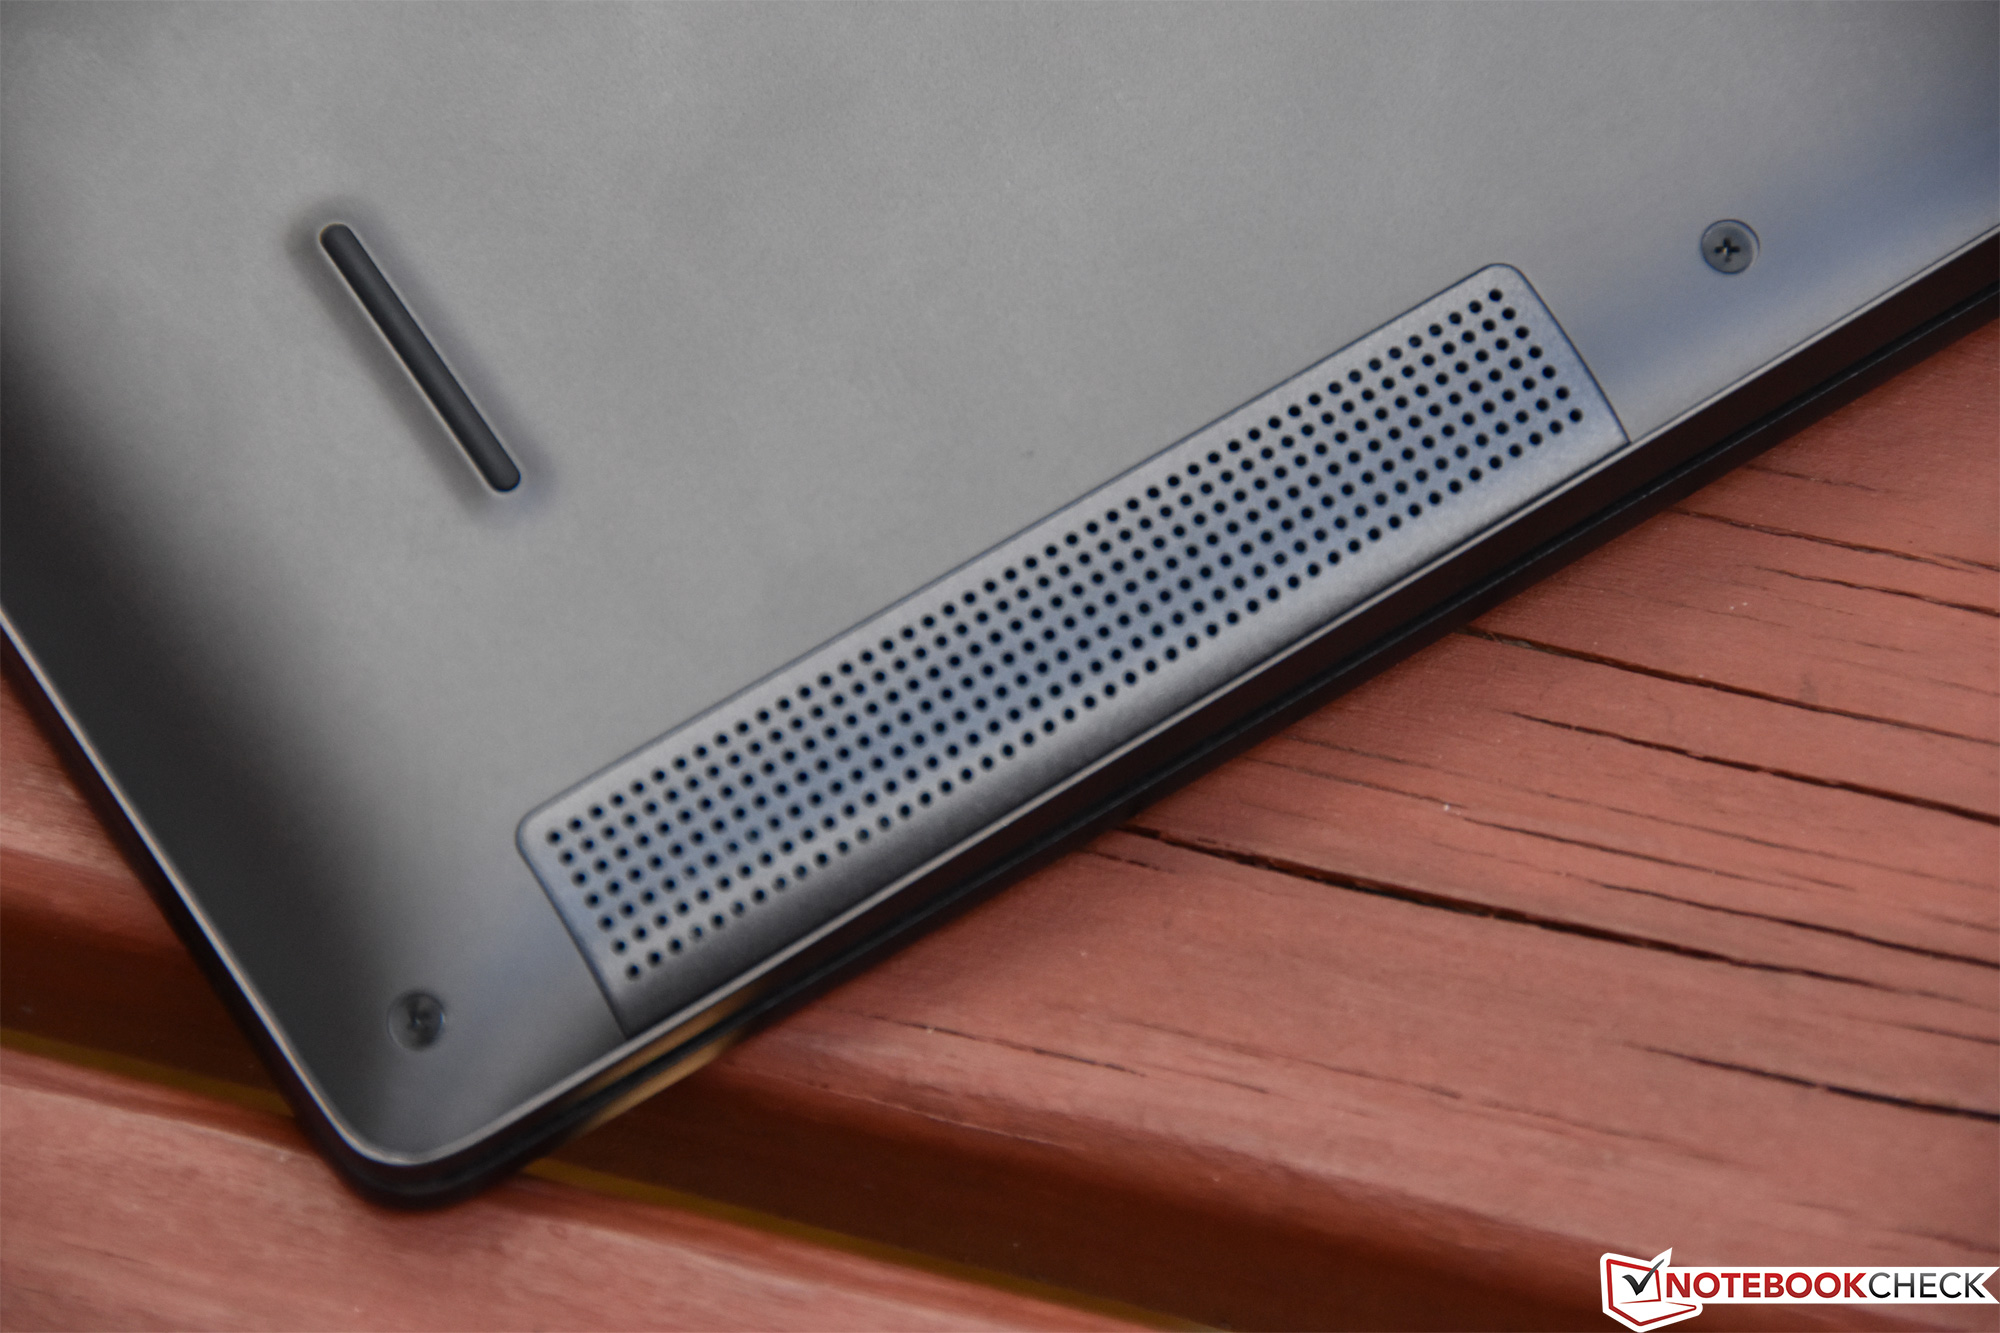
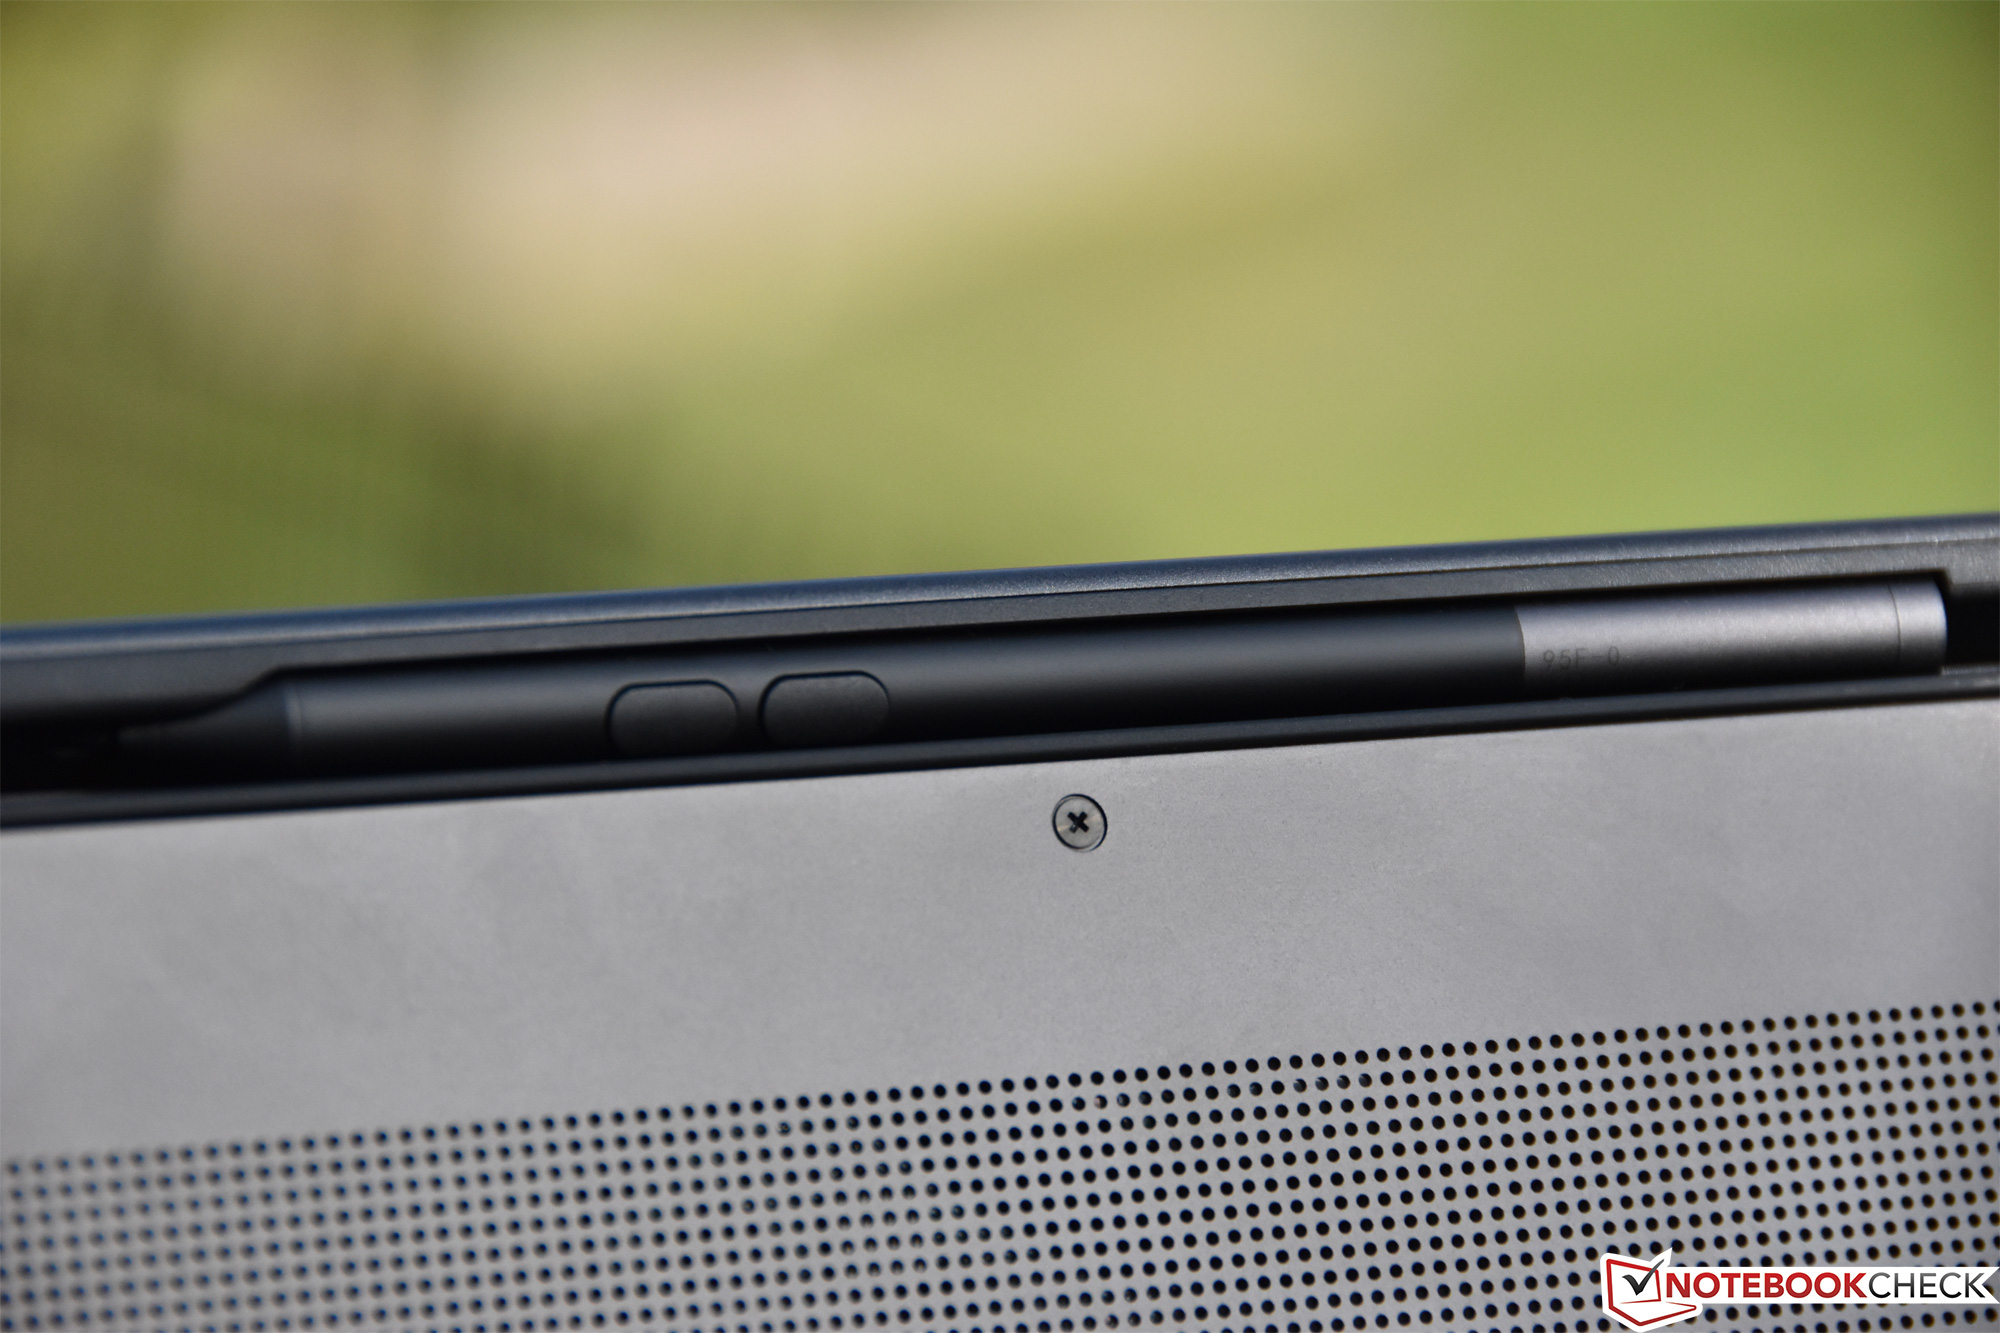
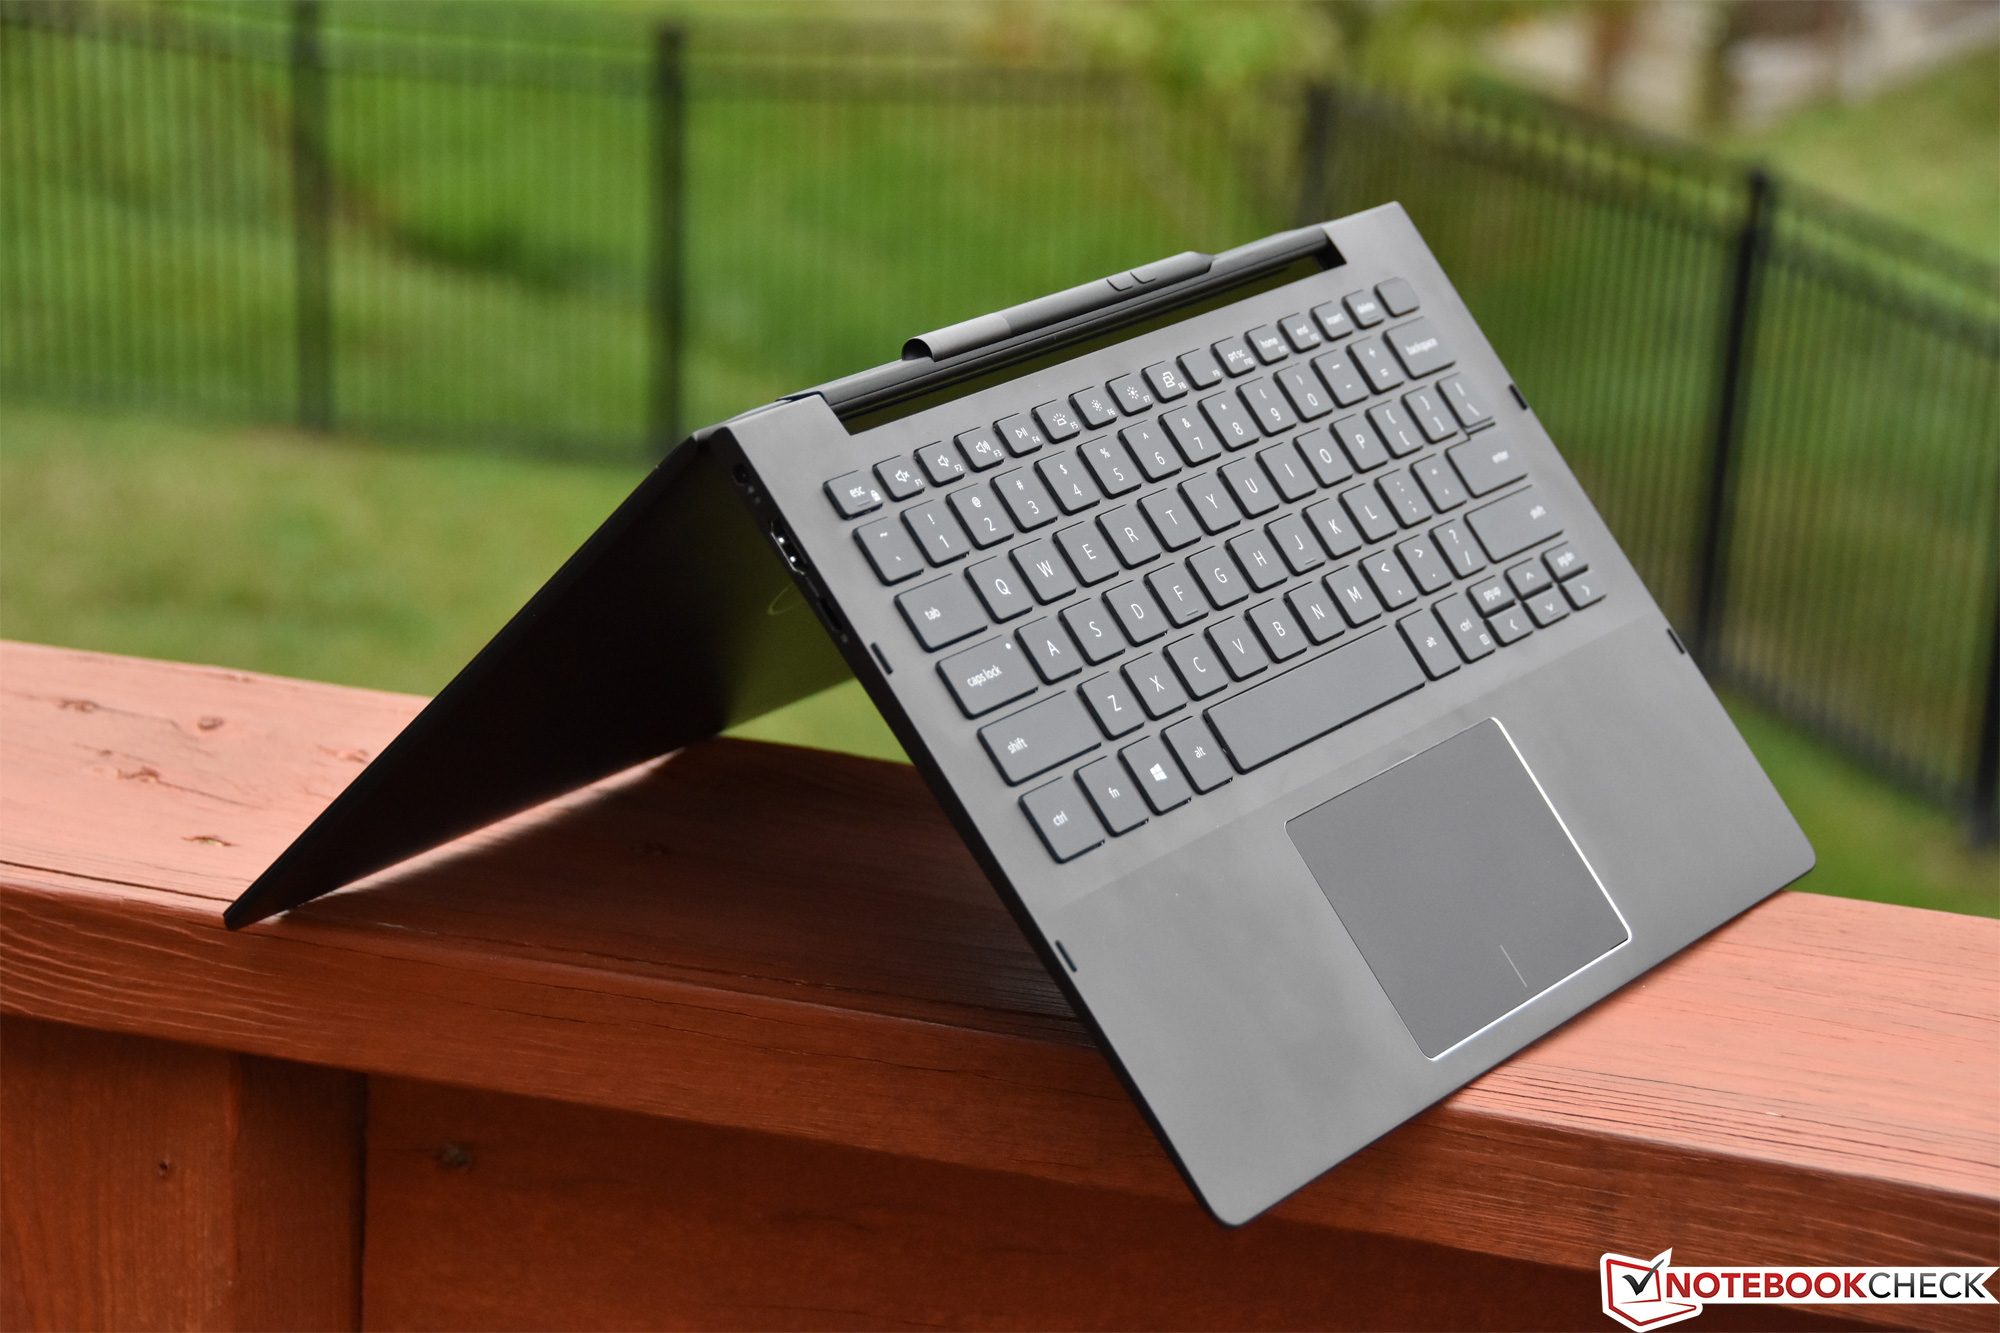
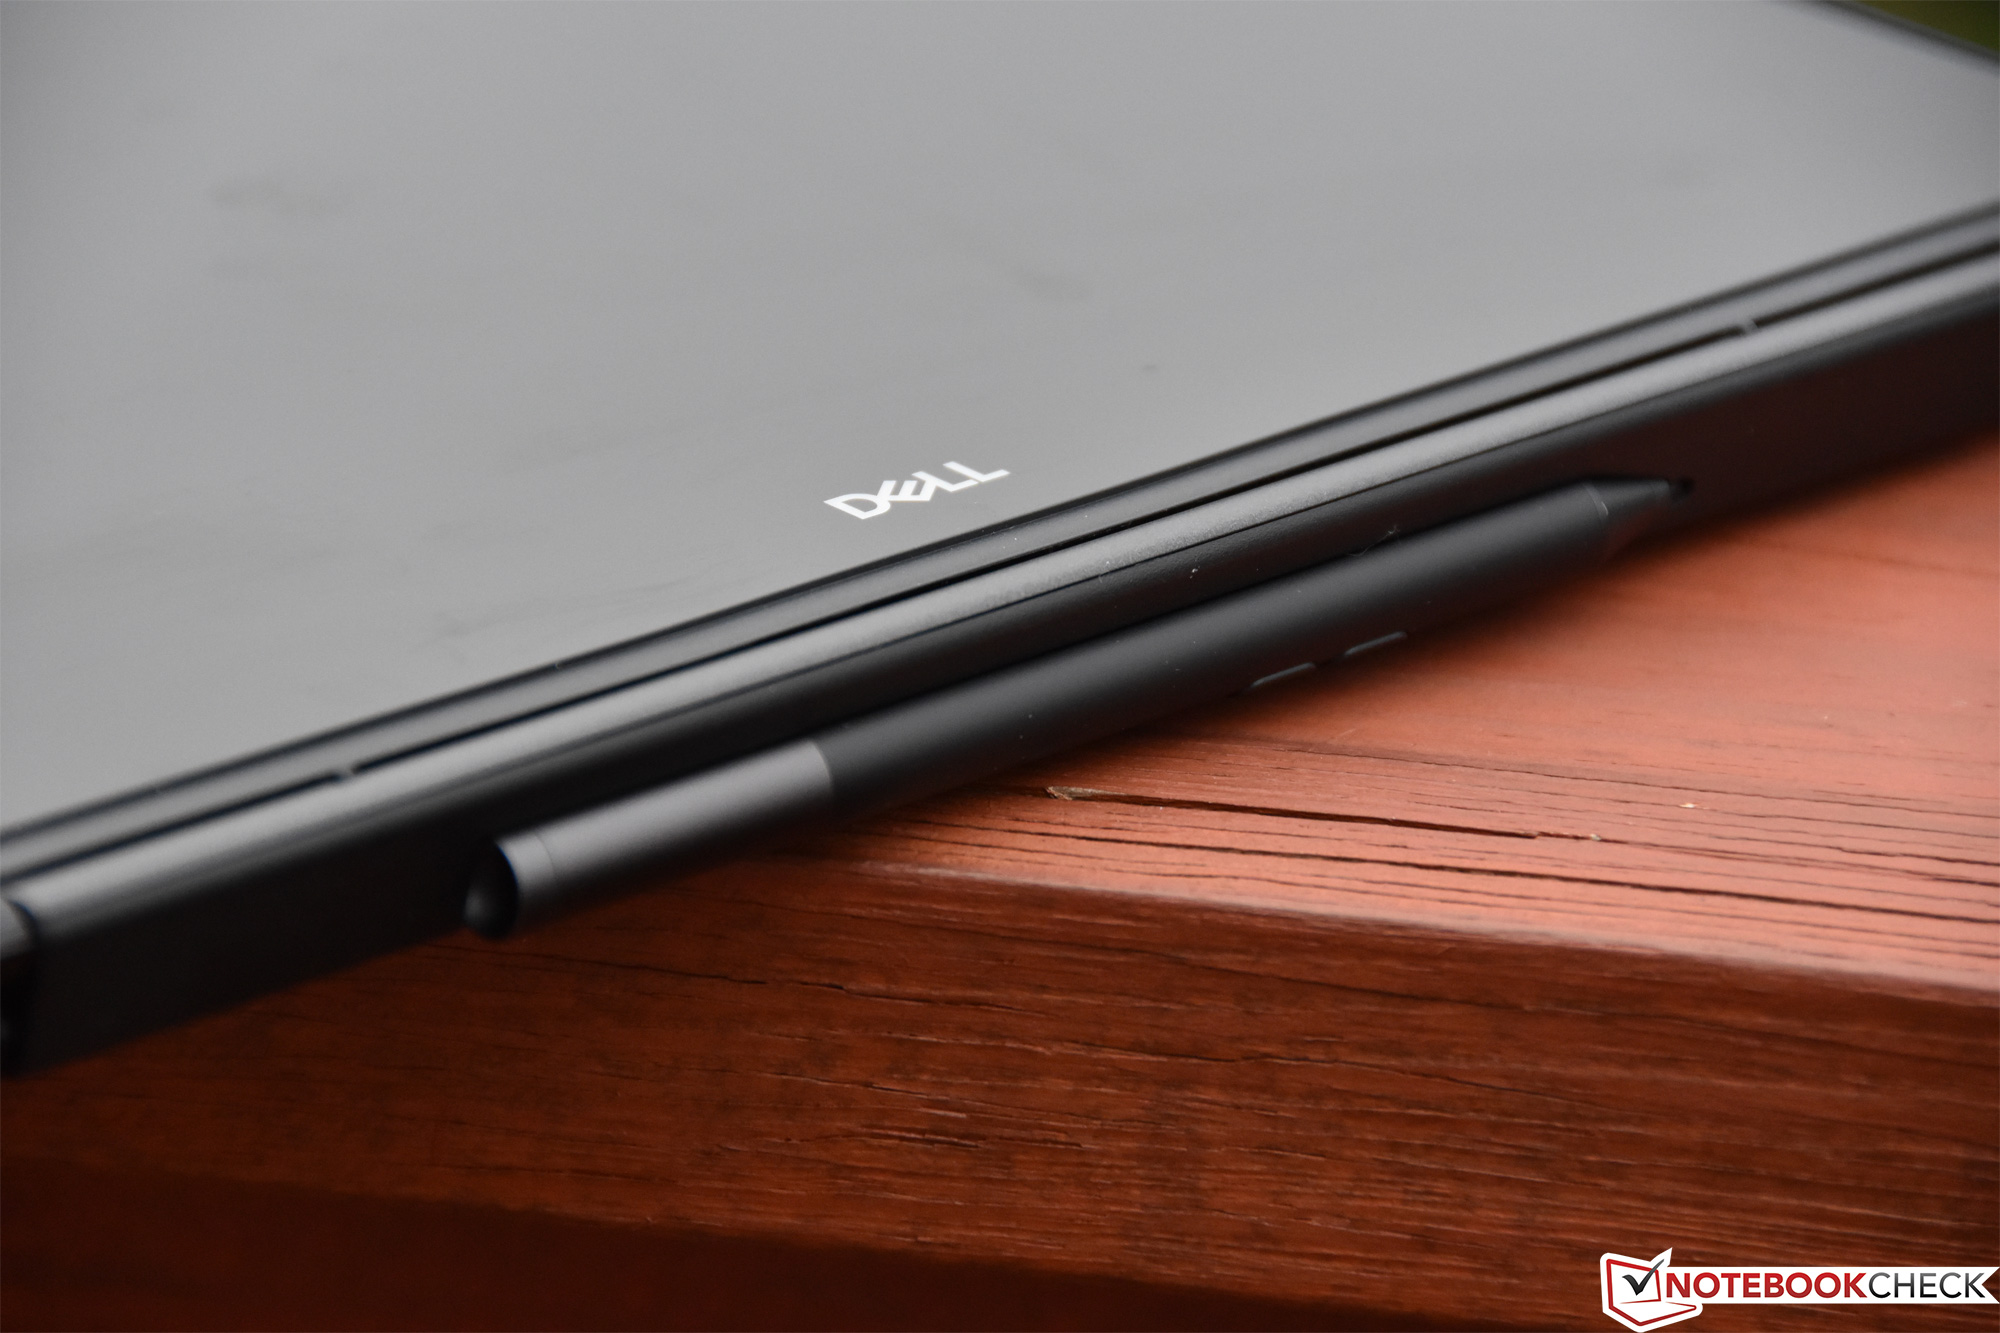
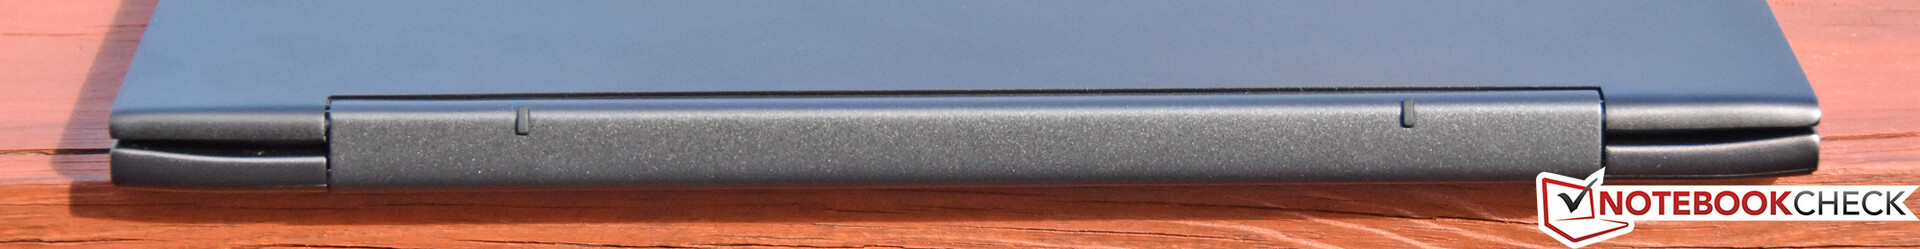
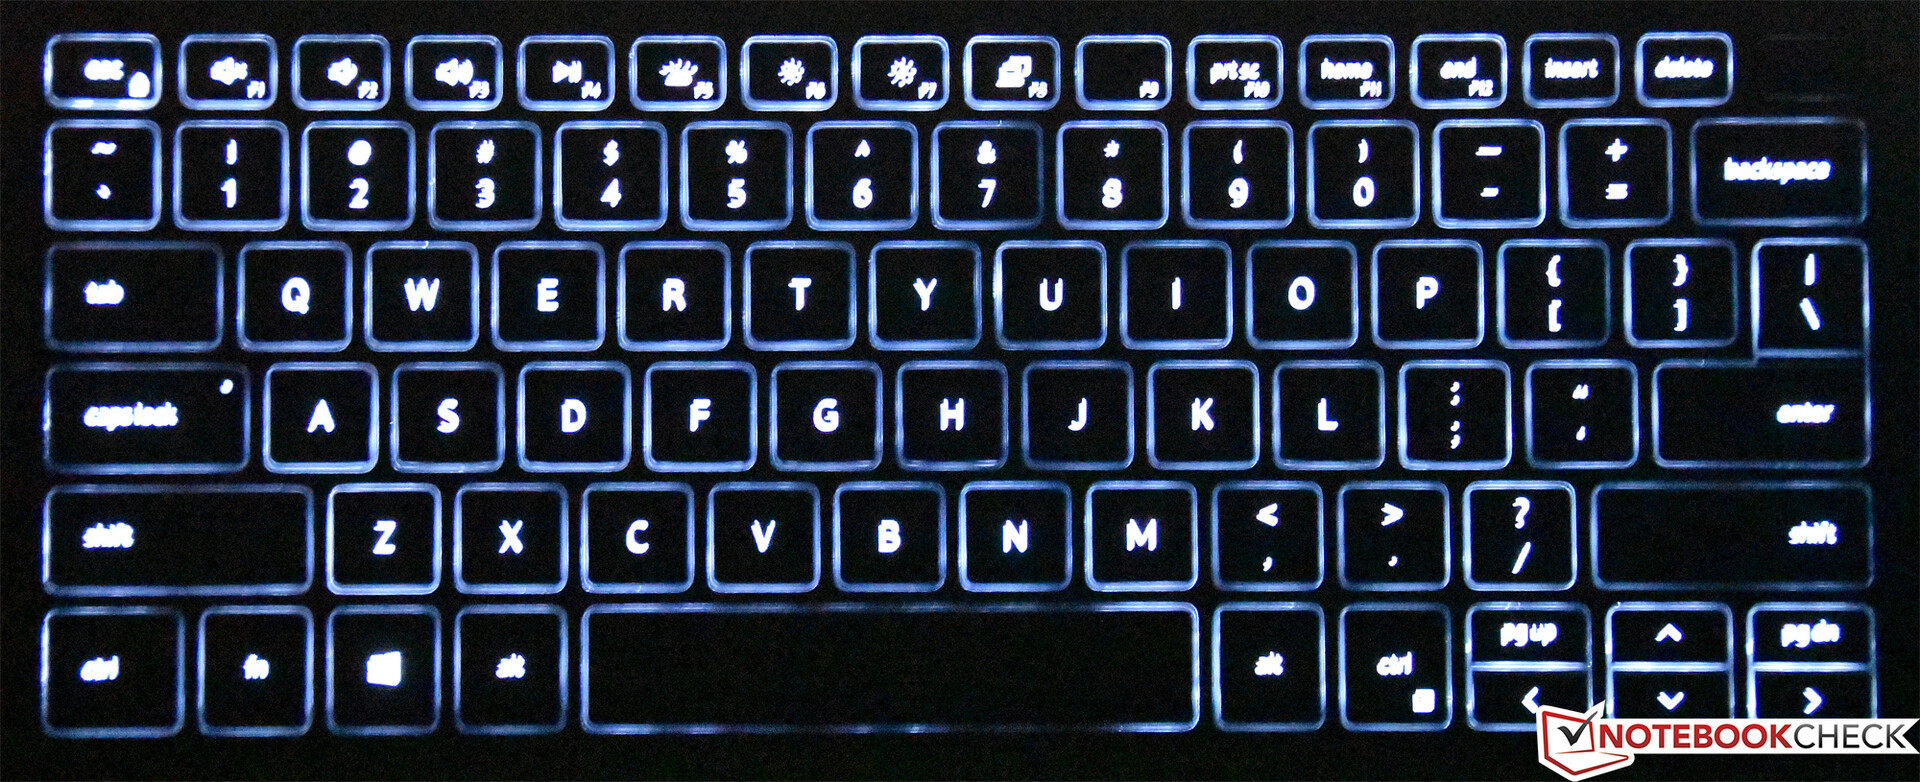
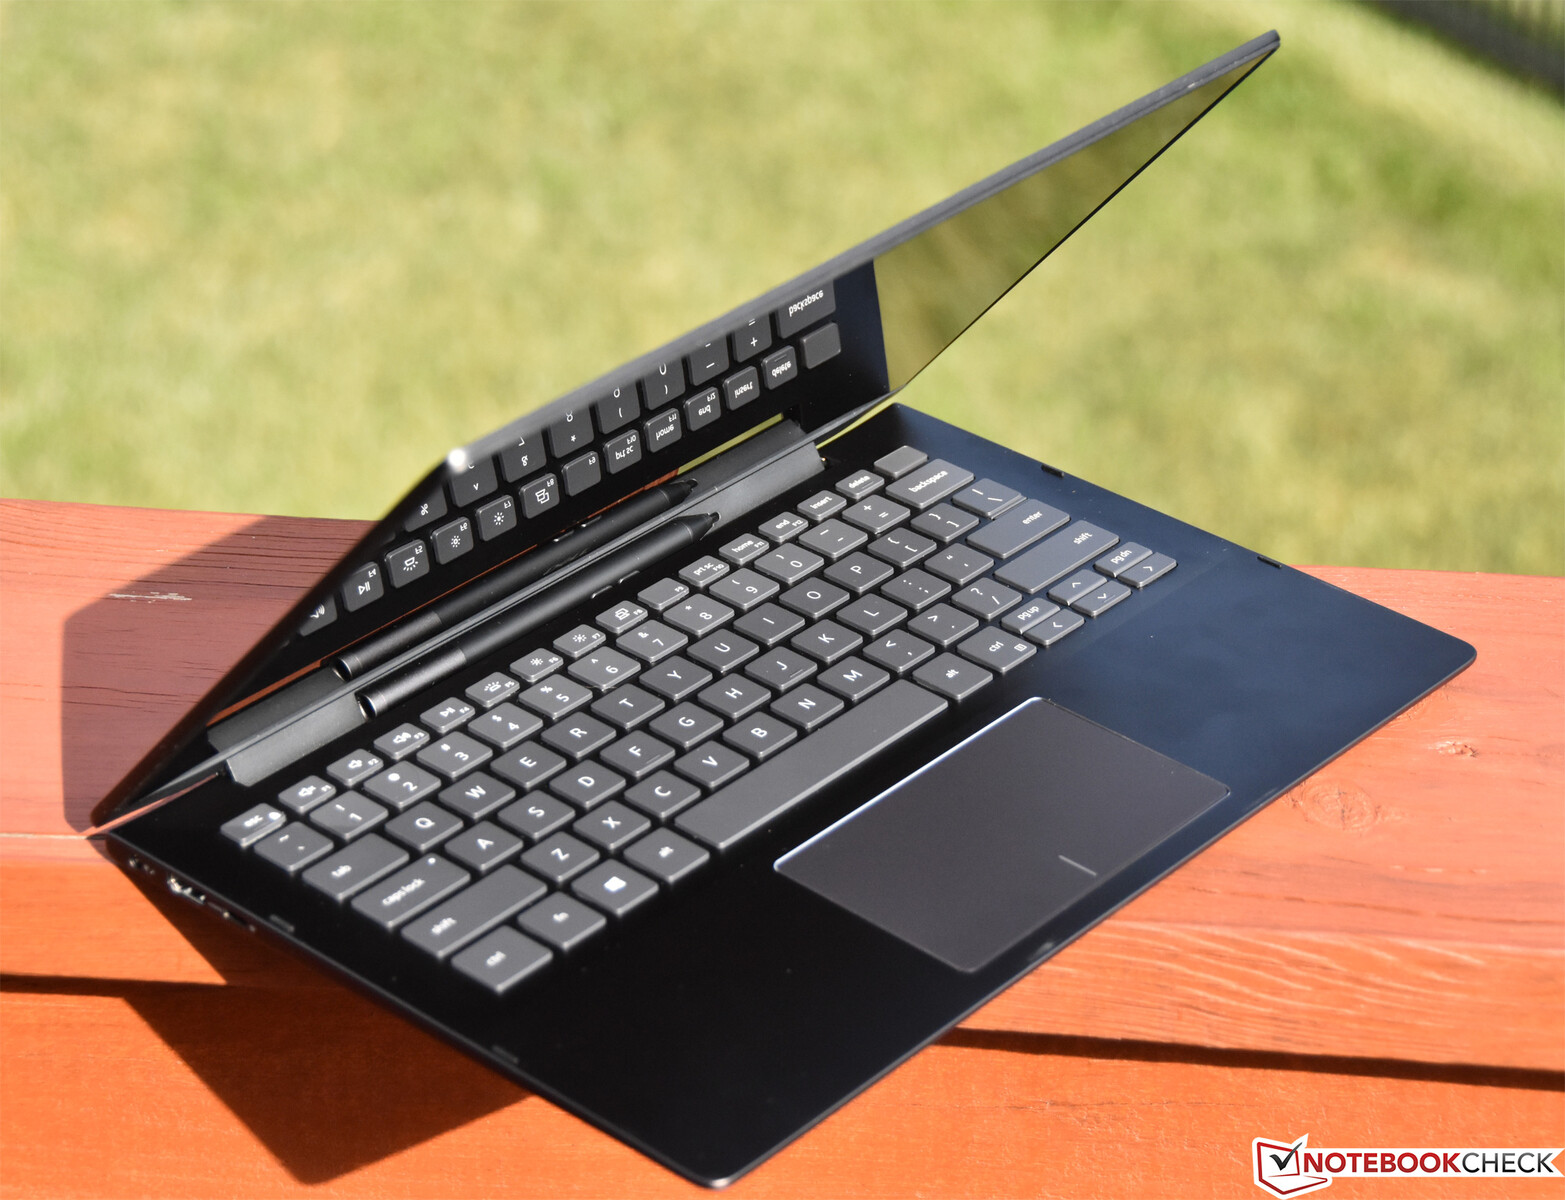
Além disso, a tela UHD é atraente, com boa reprodução e calibração de cores prontas para uso, e o botão liga/desliga redesenhado (com leitor de digitais integrado) e o layout do teclado funcionam bem em nossa opinião. O design da construção e da carcaça é bom para sua classe e parece um pouco mais resistente do que alguns dos concorrentes de metal mais finos. Por fim, o novo design inteligente da dobradiça da Dell, que incorpora uma cavidade magnética para a Dell Active Pen incluída, é uma das melhores soluções de armazenamento que vimos para uma caneta de tamanho normal.
O Inspiron 7390 2-em-1 aprimora seu antecessor de várias maneiras - mais notavelmente, duração da bateria muito melhor e desempenho ainda melhor. Apesar de algumas reclamações sobre os dispositivos de entrada e o valor questionável da CPU Core i7, ele representa uma alternativa séria aos concorrentes de fabricantes como Lenovo e HP.
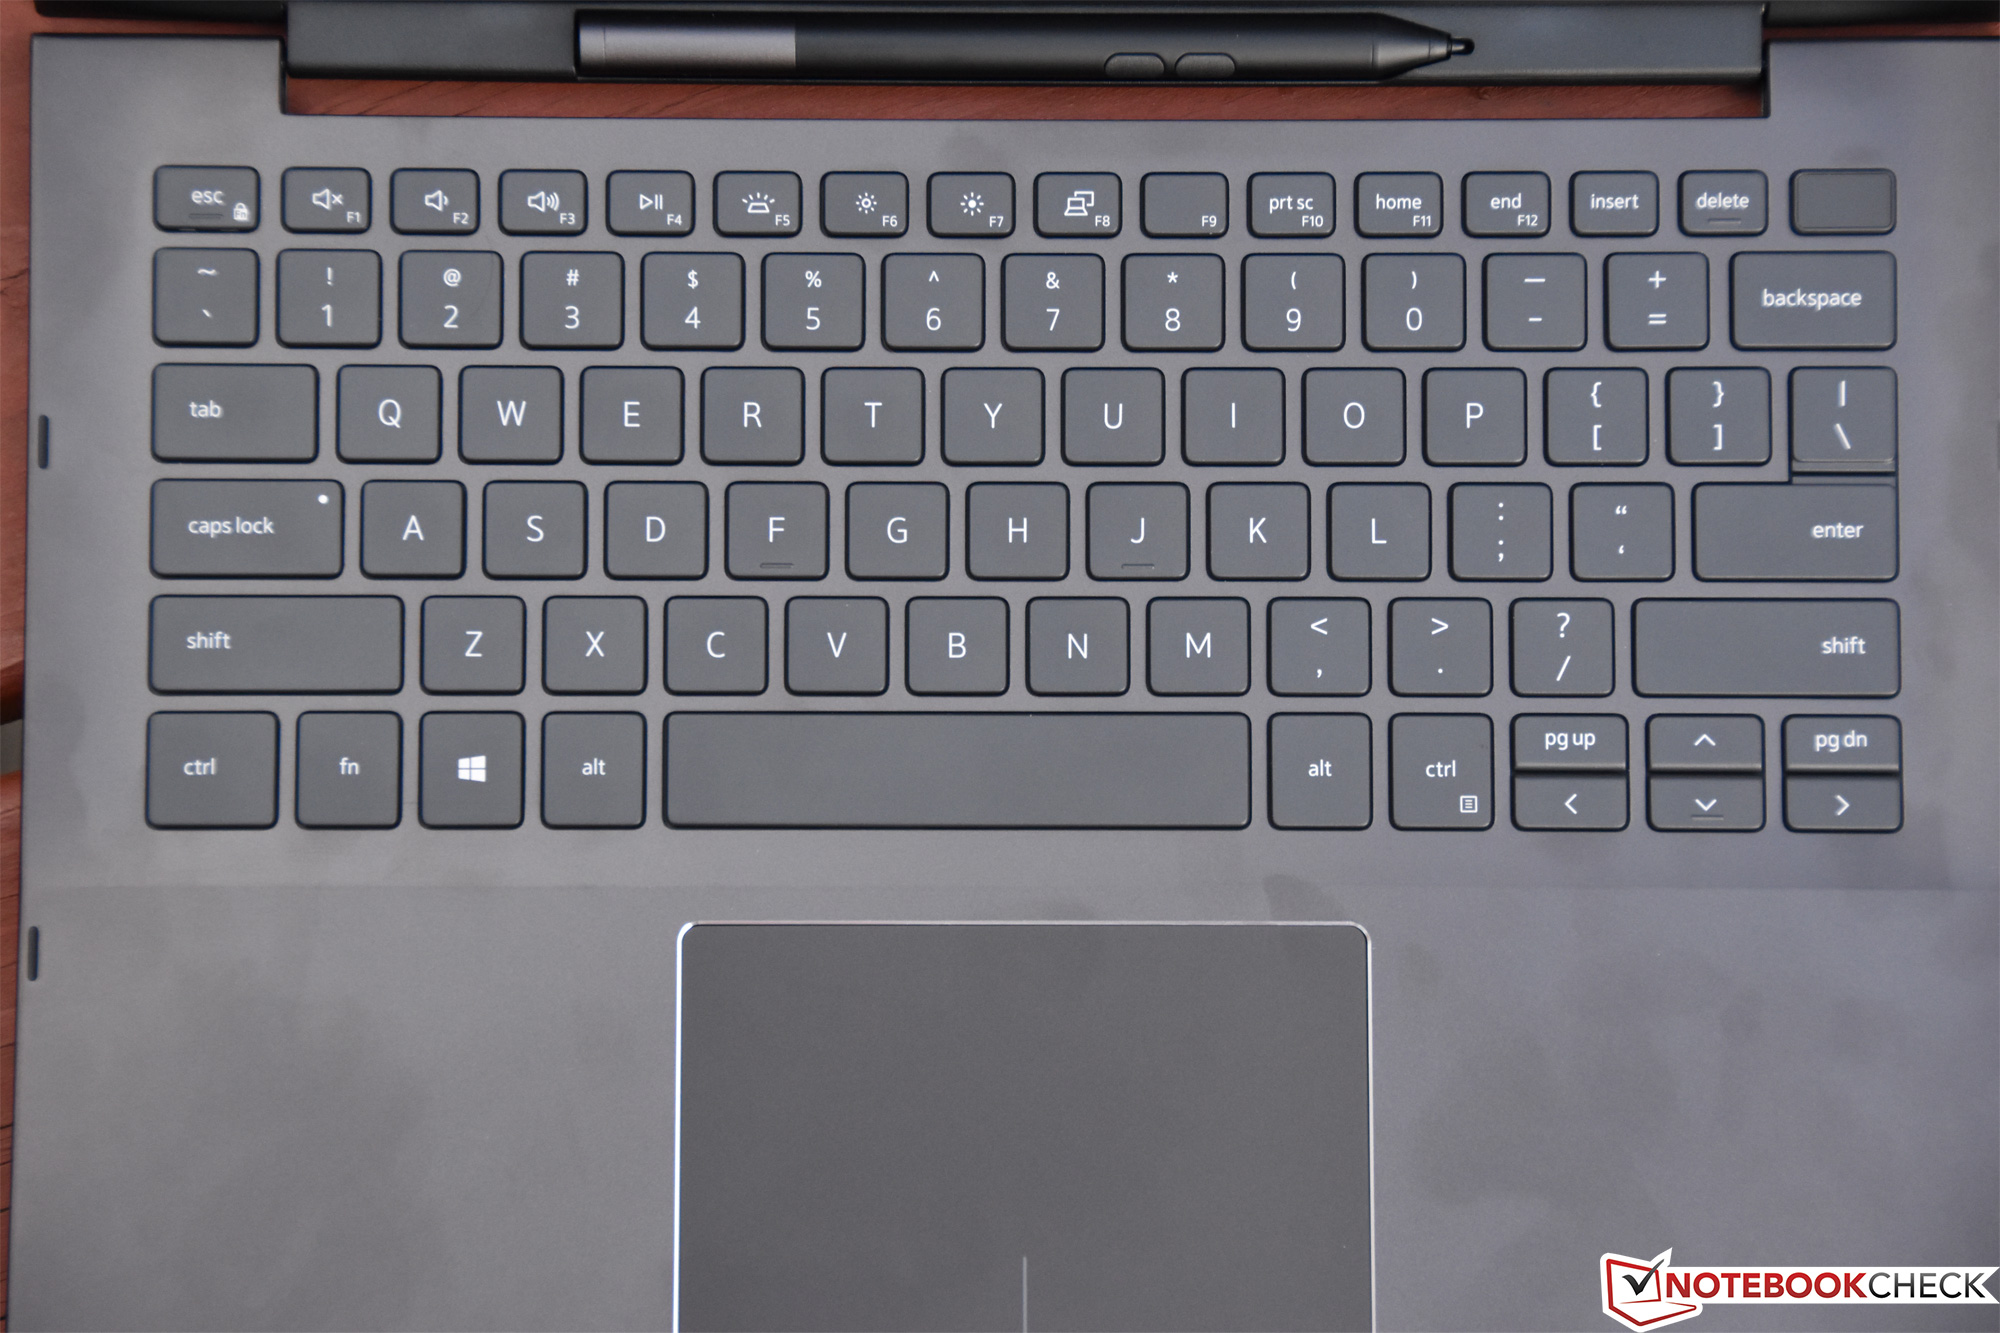
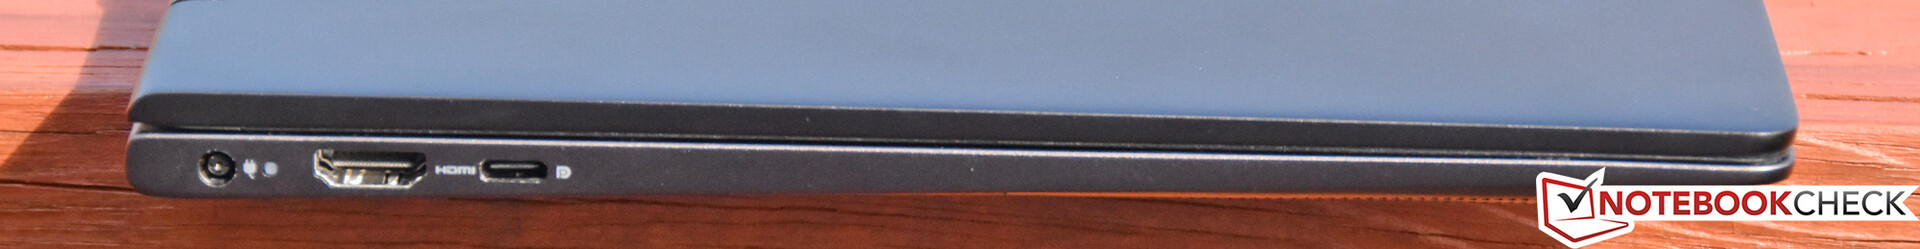
Ainda assim, algumas das mesmas queixas permanecem. O desempenho ainda é insatisfatório no contexto, com os resultados publicados pelos concorrentes do cTDP Up, como Lenovo’s ThinkBook 13s, que são realmente melhores. A seleção de portas é escassa e a falta de Thunderbolt 3 e uma porta Kensington Lock incomodará alguns usuários. O teclado é razoavelmente bom, mas a resposta e a força de atuação poderiam ser melhores. Da mesma forma, os botões do touchpad integrado exigem muita força para serem accionados e se tornam bastante cansativos para operar depois de um tempo. Por fim, embora a tela seja certamente agradável, teria sido bom ter uma opção de FHD, o que aumentaria bastante a duração da bateria.
Alguns concorrentes diretos que vale a pena considerar incluem o ThinkPad X1 Yoga, Breve Análise do Conversível HP Envy x360 13:, Uma alternativa ThinkPad X390 Yoga, e—no lado mais caro—o Latitude 7400 2-in-1. Além das preocupações sobre os dispositivos de entrada e as lamentações que cercam os chips de preço mais alto, o peso do Inspiron 7390 2-em-1 agora parece uma alternativa razoável aos populares conversíveis da série Yoga e x360 que se elevavam acima do seu antecessor.
Dell Inspiron 7390 2-in-1
- 08/23/2019 v6 (old)
Steve Schardein
Price comparison
