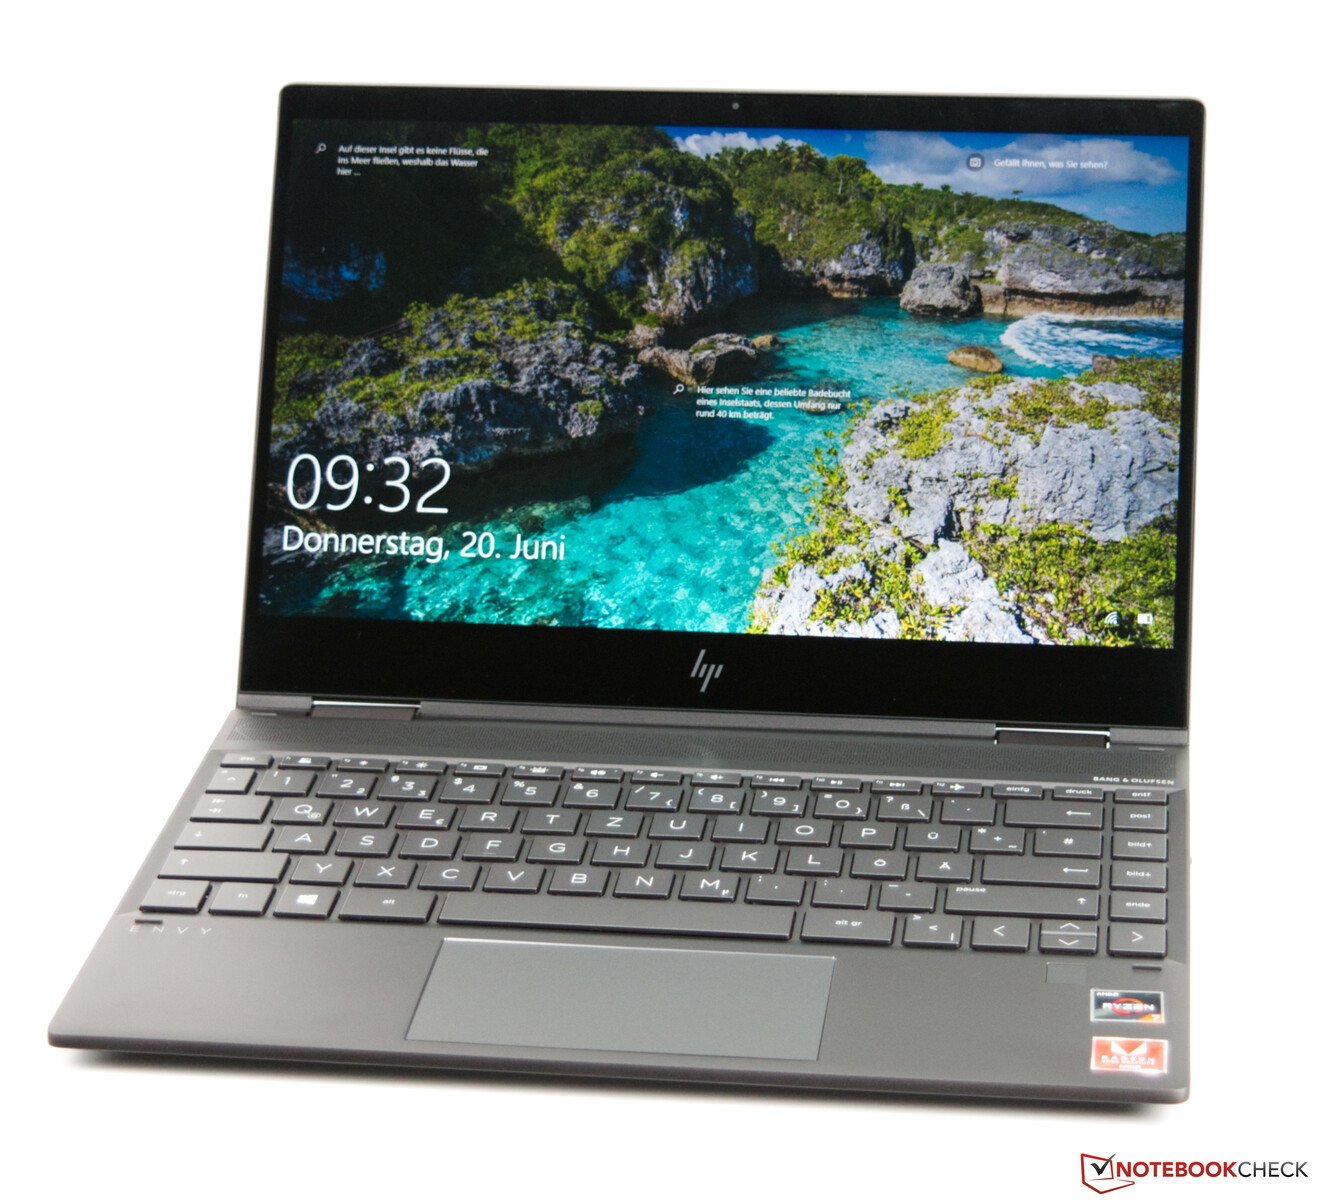
Breve Análise do Conversível HP Envy x360 13: Destaque de tela com suporte para AMD Ryzen

| SD Card Reader | |
| average JPG Copy Test (av. of 3 runs) | |
| Lenovo ThinkPad X390 Yoga-20NQS05R00 (Toshiba Exceria Pro M501) | |
| HP Envy x360 13-ar0601ng (Toshiba Exceria Pro M501 microSDXC 64GB) | |
| Lenovo ThinkPad L390 Yoga-20NT000XGE (Toshiba Exceria Pro M501 UHS-II) | |
| Média da turma Convertible (28.1 - 197, n=23, últimos 2 anos) | |
| Dell Latitude 13 3390 (Toshiba Exceria Pro SDXC 64 GB UHS-II) | |
| maximum AS SSD Seq Read Test (1GB) | |
| Média da turma Convertible (28.9 - 254, n=22, últimos 2 anos) | |
| HP Envy x360 13-ar0601ng (Toshiba Exceria Pro M501 microSDXC 64GB) | |
| Lenovo ThinkPad X390 Yoga-20NQS05R00 (Toshiba Exceria Pro M501) | |
| Lenovo ThinkPad L390 Yoga-20NT000XGE (Toshiba Exceria Pro M501 UHS-II) | |
| Dell Inspiron 13 7386 (Toshiba Exceria Pro M501 microSDXC 64GB) | |
| Dell Latitude 13 3390 (Toshiba Exceria Pro SDXC 64 GB UHS-II) | |
| |||||||||||||||||||||||||
iluminação: 75 %
iluminação com acumulador: 635 cd/m²
Contraste: 1151:1 (Preto: 0.55 cd/m²)
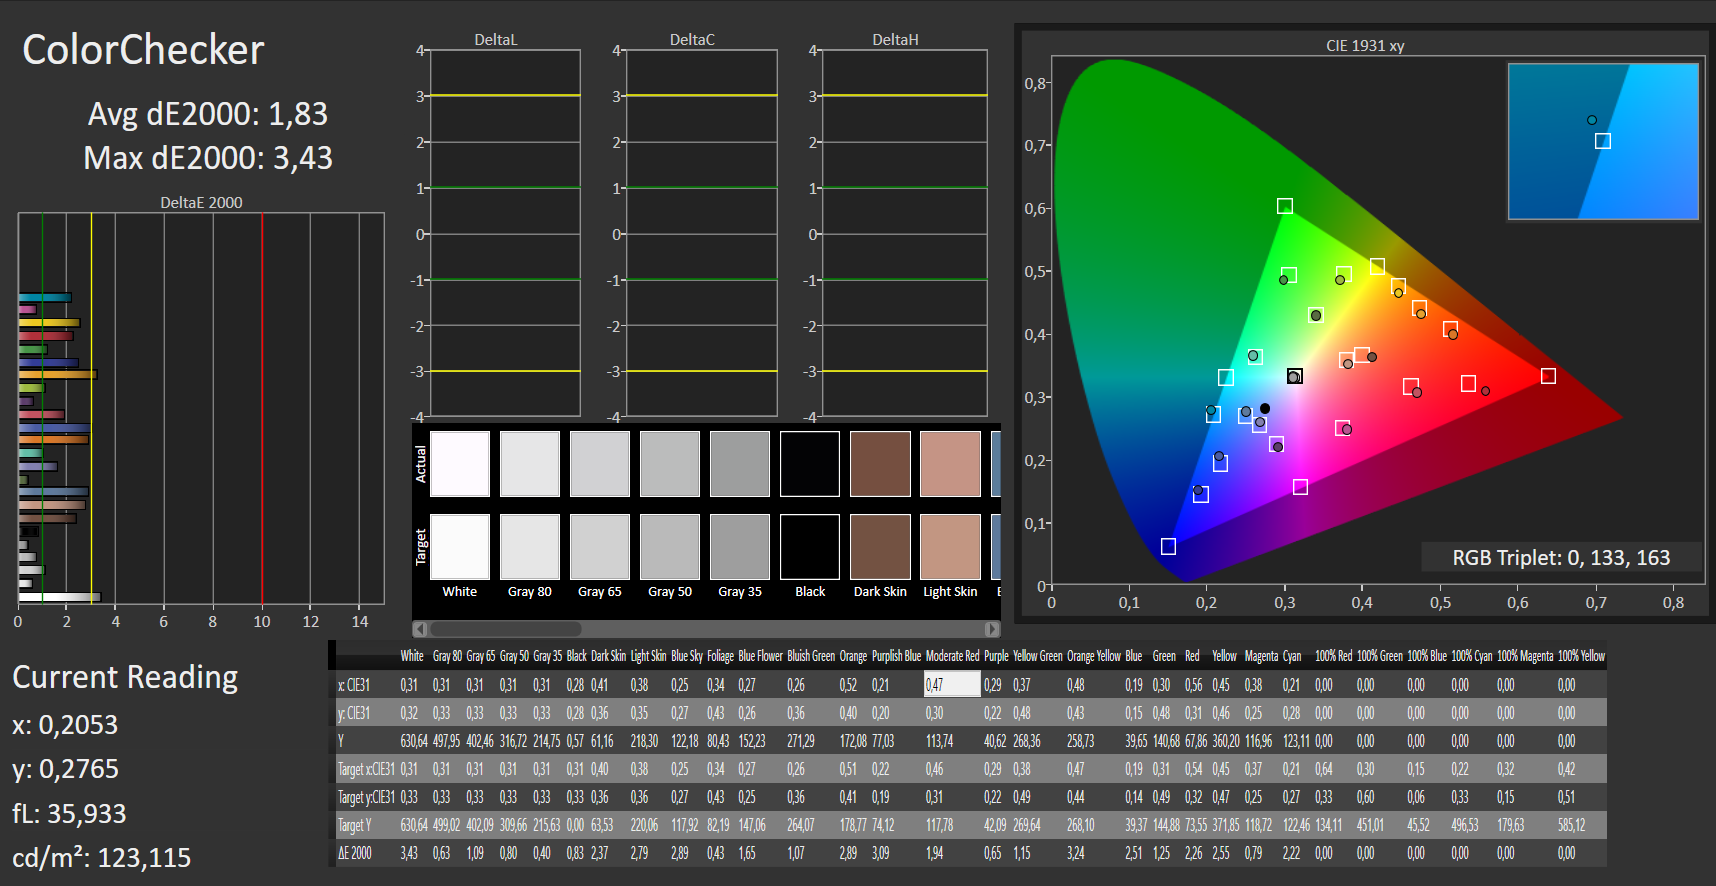
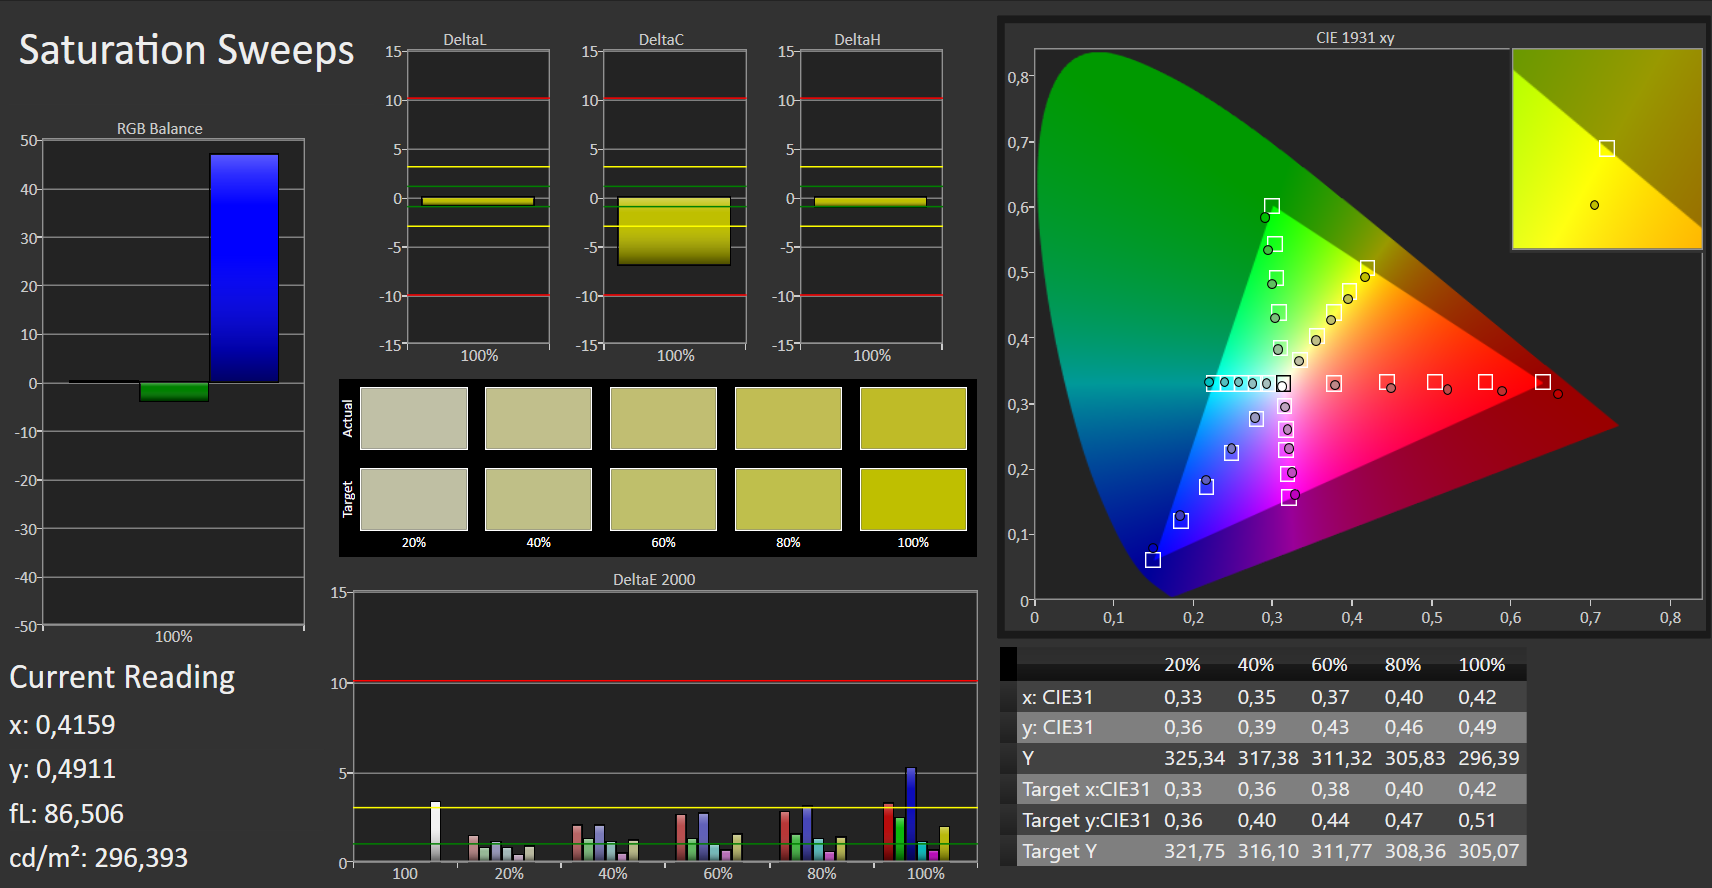
ΔE ColorChecker Calman: 3.12 | ∀{0.5-29.43 Ø4.72}
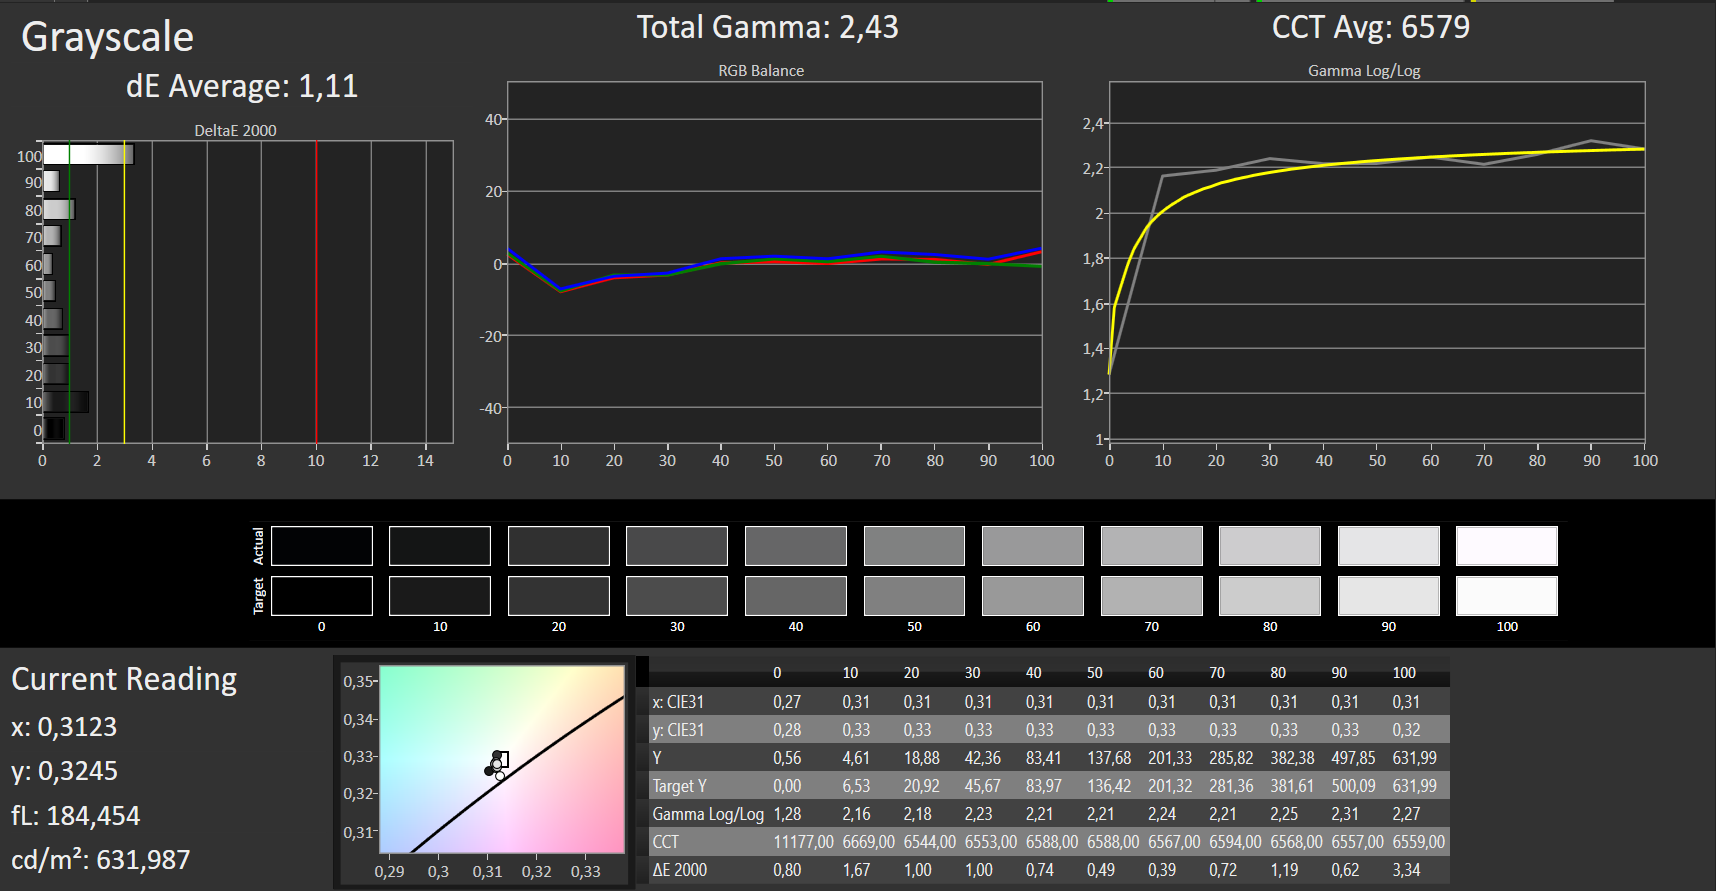
calibrated: 1.83
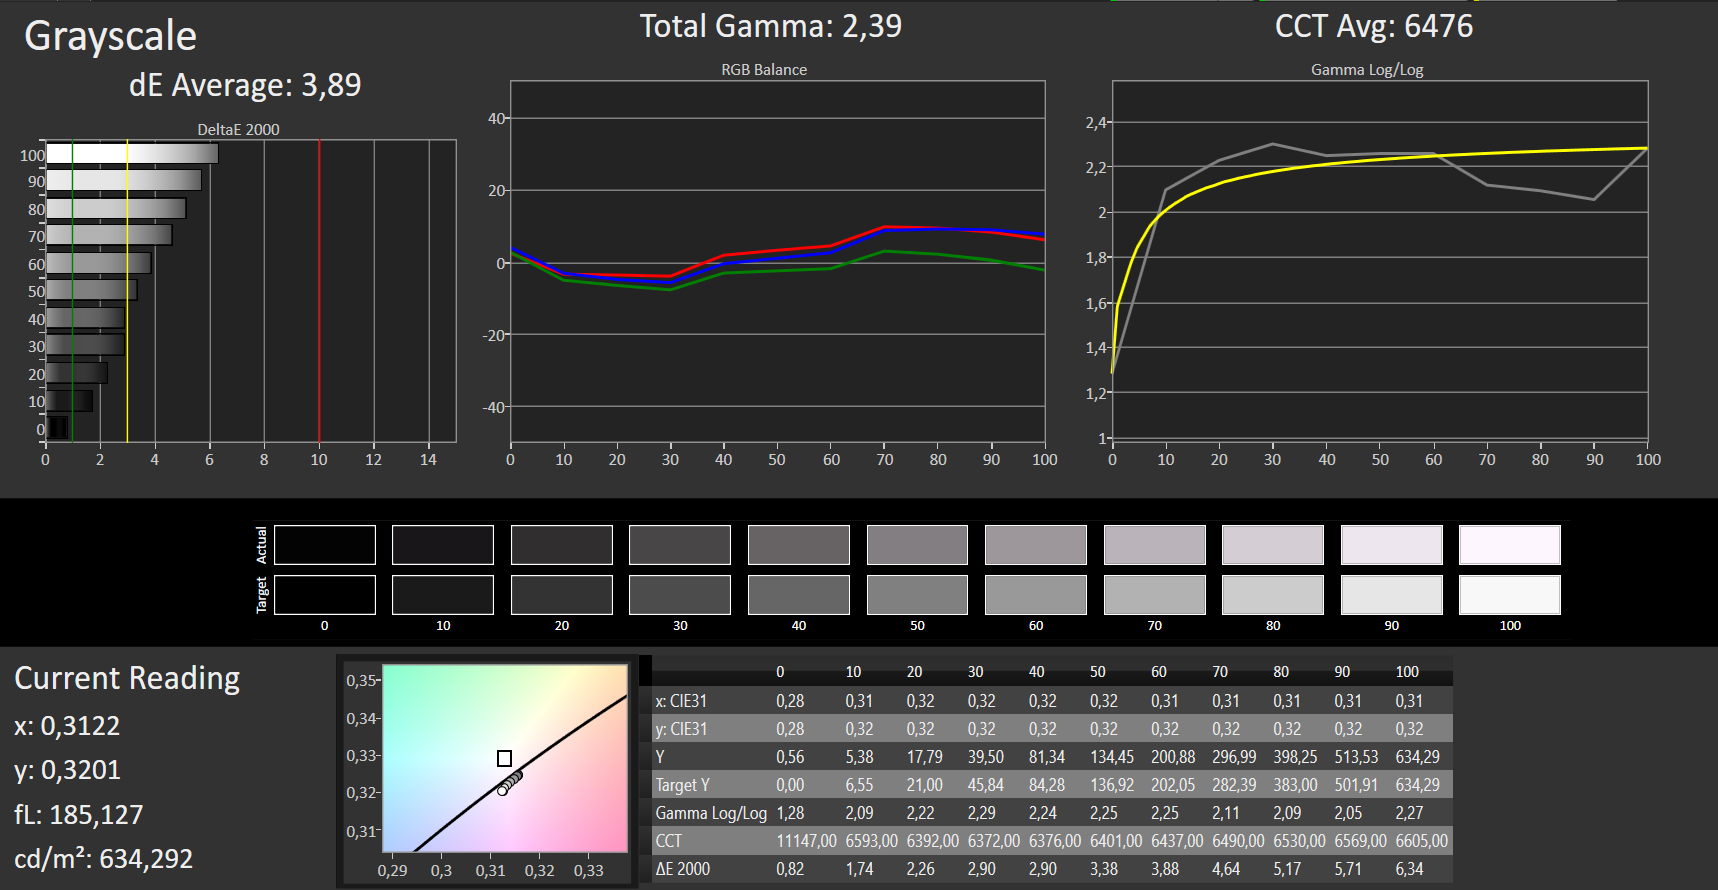
ΔE Greyscale Calman: 3.89 | ∀{0.09-98 Ø4.97}
91% sRGB (Argyll 1.6.3 3D)
59% AdobeRGB 1998 (Argyll 1.6.3 3D)
63.8% AdobeRGB 1998 (Argyll 3D)
90.8% sRGB (Argyll 3D)
63% Display P3 (Argyll 3D)
Gamma: 2.39
CCT: 6476 K
| HP Envy x360 13-ar0601ng InfoVision, M133NVF3 R2, IPS, 120 Hz, 1920x1080, 13.3" | Lenovo ThinkPad X390 Yoga-20NQS05R00 LP133WF7-SPA1, IPS LED, 1920x1080, 13.3" | Dell Latitude 13 3390 BOE06A7, NV13FHM, IPS, 1920x1080, 13.3" | Lenovo ThinkPad L390 Yoga-20NT000XGE LEN4094, NV133FHM-N5A, IPS LED, 1920x1080, 13.3" | Dell Inspiron 13 7386 Chi Mei CMN1385 / 133DCE / Dell 3GRT6, IPS, 3840x2160, 13.3" | Lenovo Yoga C930-13IKB B139HAN03_0, IPS, 1920x1080, 13.9" | |
|---|---|---|---|---|---|---|
| Display | 5% | -34% | 5% | 9% | 3% | |
| Display P3 Coverage (%) | 63 | 65.2 3% | 40.9 -35% | 69.2 10% | 68.2 8% | 64.3 2% |
| sRGB Coverage (%) | 90.8 | 97 7% | 61.3 -32% | 90.6 0% | 99.8 10% | 94.6 4% |
| AdobeRGB 1998 Coverage (%) | 63.8 | 67.3 5% | 42.29 -34% | 66.3 4% | 70 10% | 66.2 4% |
| Response Times | -55% | -33% | -57% | -50% | -21% | |
| Response Time Grey 50% / Grey 80% * (ms) | 35 ? | 59.2 ? -69% | 42 ? -20% | 51.2 ? -46% | 57 ? -63% | 40.8 ? -17% |
| Response Time Black / White * (ms) | 22 ? | 30.8 ? -40% | 32 ? -45% | 36.8 ? -67% | 30 ? -36% | 27.6 ? -25% |
| PWM Frequency (Hz) | 4065 ? | 208 ? | 1000 ? | 26000 ? | ||
| Screen | -13% | -66% | -28% | -2% | -33% | |
| Brightness middle (cd/m²) | 633 | 319 -50% | 276 -56% | 313 -51% | 318 -50% | 316 -50% |
| Brightness (cd/m²) | 675 | 306 -55% | 274 -59% | 295 -56% | 278 -59% | 291 -57% |
| Brightness Distribution (%) | 75 | 90 20% | 82 9% | 90 20% | 81 8% | 83 11% |
| Black Level * (cd/m²) | 0.55 | 0.15 73% | 0.29 47% | 0.22 60% | 0.18 67% | 0.36 35% |
| Contrast (:1) | 1151 | 2127 85% | 952 -17% | 1423 24% | 1767 54% | 878 -24% |
| Colorchecker dE 2000 * | 3.12 | 6.1 -96% | 5.84 -87% | 6.2 -99% | 2.91 7% | 5.9 -89% |
| Colorchecker dE 2000 max. * | 6.37 | 9.7 -52% | 26.72 -319% | 10.7 -68% | 6.11 4% | 12.9 -103% |
| Colorchecker dE 2000 calibrated * | 1.83 | 1 45% | 5.15 -181% | 2.5 -37% | 2.91 -59% | 1.3 29% |
| Greyscale dE 2000 * | 3.89 | 8.6 -121% | 3.54 9% | 8 -106% | 4.37 -12% | 8.6 -121% |
| Gamma | 2.39 92% | 2.62 84% | 2.43 91% | 2.38 92% | 2.26 97% | 2.1 105% |
| CCT | 6476 100% | 6613 98% | 6747 96% | 7100 92% | 6448 101% | 6854 95% |
| Color Space (Percent of AdobeRGB 1998) (%) | 59 | 61.9 5% | 39 -34% | 59.1 0% | 70 19% | 60.7 3% |
| Color Space (Percent of sRGB) (%) | 91 | 96.8 6% | 61 -33% | 90.6 0% | 93 2% | 94.5 4% |
| Média Total (Programa/Configurações) | -21% /
-15% | -44% /
-55% | -27% /
-26% | -14% /
-6% | -17% /
-25% |
* ... menor é melhor


Exibir tempos de resposta
| ↔ Tempo de resposta preto para branco | ||
|---|---|---|
| 22 ms ... ascensão ↗ e queda ↘ combinadas | ↗ 12 ms ascensão | 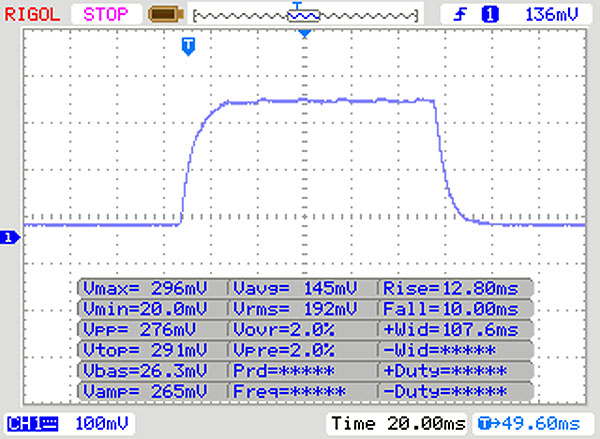 |
| ↘ 10 ms queda | ||
| A tela mostra boas taxas de resposta em nossos testes, mas pode ser muito lenta para jogadores competitivos. Em comparação, todos os dispositivos testados variam de 0.1 (mínimo) a 240 (máximo) ms. » 48 % de todos os dispositivos são melhores. Isso significa que o tempo de resposta medido é pior que a média de todos os dispositivos testados (19.8 ms). | ||
| ↔ Tempo de resposta 50% cinza a 80% cinza | ||
| 35 ms ... ascensão ↗ e queda ↘ combinadas | ↗ 18 ms ascensão | 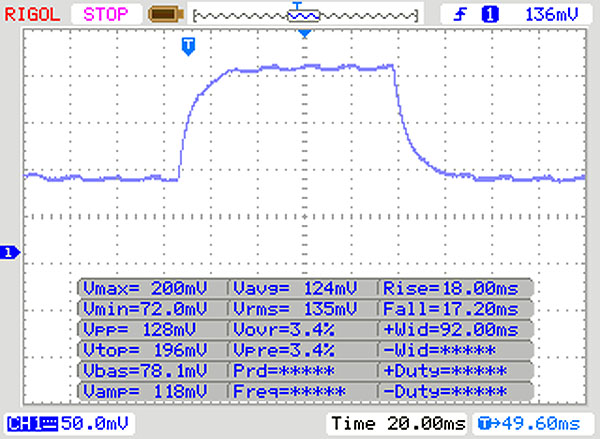 |
| ↘ 17 ms queda | ||
| A tela mostra taxas de resposta lentas em nossos testes e será insatisfatória para os jogadores. Em comparação, todos os dispositivos testados variam de 0.165 (mínimo) a 636 (máximo) ms. » 49 % de todos os dispositivos são melhores. Isso significa que o tempo de resposta medido é pior que a média de todos os dispositivos testados (31 ms). | ||
Cintilação da tela / PWM (modulação por largura de pulso)
| Tela tremeluzindo/PWM detectado | 4065 Hz | ≤ 90 % configuração de brilho | 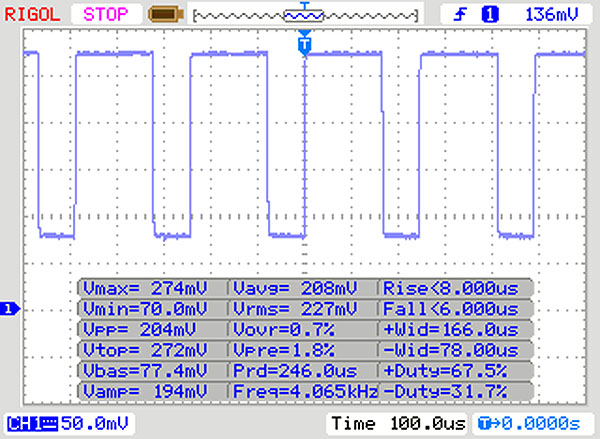 |
A luz de fundo da tela pisca em 4065 Hz (pior caso, por exemplo, utilizando PWM) Cintilação detectada em uma configuração de brilho de 90 % e abaixo. Não deve haver cintilação ou PWM acima desta configuração de brilho. A frequência de 4065 Hz é bastante alta, então a maioria dos usuários sensíveis ao PWM não deve notar nenhuma oscilação. [pwm_comparison] Em comparação: 52 % de todos os dispositivos testados não usam PWM para escurecer a tela. Se PWM foi detectado, uma média de 7781 (mínimo: 5 - máximo: 343500) Hz foi medida. | |||


* ... menor é melhor
| PCMark 8 Home Score Accelerated v2 | 3863 pontos | |
| PCMark 8 Creative Score Accelerated v2 | 4974 pontos | |
| PCMark 8 Work Score Accelerated v2 | 4869 pontos | |
| PCMark 10 Score | 3685 pontos | |
Ajuda | ||
| HP Envy x360 13-ar0601ng SK Hynix BC501 HFM512GDJTNG | Lenovo ThinkPad X390 Yoga-20NQS05R00 Intel SSD Pro 7600p SSDPEKKF512G8L | Dell Latitude 13 3390 SK hynix SC311 SATA | Lenovo ThinkPad L390 Yoga-20NT000XGE Samsung SSD PM981 MZVLB256HAHQ | Dell Inspiron 13 7386 SK Hynix BC501 HFM512GDJTNG | Lenovo Yoga C930-13IKB SK hynix PC401 HFS256GD9TNG | Média SK Hynix BC501 HFM512GDJTNG | |
|---|---|---|---|---|---|---|---|
| AS SSD | 81% | -51% | 55% | 16% | -11% | 15% | |
| Seq Read (MB/s) | 1412 | 2742 94% | 479.5 -66% | 1724 22% | 1122 -21% | 1850 31% | 1323 ? -6% |
| Seq Write (MB/s) | 540 | 1511 180% | 354.9 -34% | 1123 108% | 619 15% | 661 22% | 697 ? 29% |
| 4K Read (MB/s) | 32.24 | 66.3 106% | 23.88 -26% | 51.8 61% | 39.58 23% | 38.04 18% | 40.4 ? 25% |
| 4K Write (MB/s) | 74.7 | 175.2 135% | 51.3 -31% | 133.8 79% | 108.5 45% | 95 27% | 100.8 ? 35% |
| 4K-64 Read (MB/s) | 567 | 873 54% | 294.8 -48% | 745 31% | 776 37% | 434.3 -23% | 686 ? 21% |
| 4K-64 Write (MB/s) | 700 | 594 -15% | 217.5 -69% | 1193 70% | 671 -4% | 266.3 -62% | 660 ? -6% |
| Access Time Read * (ms) | 0.049 | 0.035 29% | 0.093 -90% | 0.041 16% | 0.045 8% | 0.069 -41% | 0.06071 ? -24% |
| Access Time Write * (ms) | 0.048 | 0.021 56% | 0.071 -48% | 0.028 42% | 0.033 31% | 0.056 -17% | 0.037 ? 23% |
| Score Read (Points) | 741 | 1213 64% | 367 -50% | 969 31% | 928 25% | 657 -11% | 858 ? 16% |
| Score Write (Points) | 829 | 920 11% | 304 -63% | 1440 74% | 841 1% | 427 -48% | 830 ? 0% |
| Score Total (Points) | 1913 | 2712 42% | 860 -55% | 2889 51% | 2228 16% | 1373 -28% | 2107 ? 10% |
| Copy ISO MB/s (MB/s) | 521 | 1725 231% | 294 -44% | 1025 97% | 539 3% | 802 ? 54% | |
| Copy Program MB/s (MB/s) | 253.1 | 418.3 65% | 137.4 -46% | 322.1 27% | 209.7 -17% | 265 ? 5% | |
| Copy Game MB/s (MB/s) | 392.9 | 687 75% | 202.2 -49% | 637 62% | 340 -13% | 487 ? 24% |
* ... menor é melhor

| 3DMark 11 Performance | 3737 pontos | |
| 3DMark Ice Storm Standard Score | 69242 pontos | |
| 3DMark Cloud Gate Standard Score | 9802 pontos | |
| 3DMark Fire Strike Score | 1669 pontos | |
| 3DMark Fire Strike Extreme Score | 813 pontos | |
| 3DMark Time Spy Score | 647 pontos | |
Ajuda | ||
| baixo | média | alto | ultra | |
|---|---|---|---|---|
| BioShock Infinite (2013) | 113 | 14 | ||
| Dota 2 Reborn (2015) | 67.4 | 43.8 | 23.3 | 22.3 |
| Rise of the Tomb Raider (2016) | 45.9 | 8.3 | ||
| X-Plane 11.11 (2018) | 23.4 | 16.8 | 14.8 |
Barulho
| Ocioso |
| 32.2 / 32.2 / 32.2 dB |
| Carga |
| 40.8 / 41.9 dB |
 | ||
30 dB silencioso 40 dB(A) audível 50 dB(A) ruidosamente alto |
||
min: | ||
| HP Envy x360 13-ar0601ng Vega 10, R7 3700U, SK Hynix BC501 HFM512GDJTNG | Lenovo ThinkPad X390 Yoga-20NQS05R00 UHD Graphics 620, i7-8565U, Intel SSD Pro 7600p SSDPEKKF512G8L | Dell Latitude 13 3390 UHD Graphics 620, i5-8250U, SK hynix SC311 SATA | Lenovo ThinkPad L390 Yoga-20NT000XGE UHD Graphics 620, i5-8265U, Samsung SSD PM981 MZVLB256HAHQ | Dell Inspiron 13 7386 UHD Graphics 620, i7-8565U, SK Hynix BC501 HFM512GDJTNG | Lenovo Yoga C930-13IKB UHD Graphics 620, i5-8250U, SK hynix PC401 HFS256GD9TNG | |
|---|---|---|---|---|---|---|
| Noise | 10% | 9% | 13% | 9% | 12% | |
| desligado / ambiente * (dB) | 30.5 | 29.2 4% | 30.6 -0% | 29.5 3% | 30.3 1% | 29.3 4% |
| Idle Minimum * (dB) | 32.2 | 29.2 9% | 30.6 5% | 29.5 8% | 30.4 6% | 29.3 9% |
| Idle Average * (dB) | 32.2 | 29.2 9% | 30.6 5% | 29.5 8% | 30.4 6% | 29.3 9% |
| Idle Maximum * (dB) | 32.2 | 29.2 9% | 30.6 5% | 29.5 8% | 30.4 6% | 29.7 8% |
| Load Average * (dB) | 40.8 | 35 14% | 33.3 18% | 30.6 25% | 34.3 16% | 31.8 22% |
| Load Maximum * (dB) | 41.9 | 35 16% | 33 21% | 30.6 27% | 34.2 18% | 32.7 22% |
* ... menor é melhor
(±) A temperatura máxima no lado superior é 43 °C / 109 F, em comparação com a média de 35.4 °C / 96 F , variando de 19.6 a 60 °C para a classe Convertible.
(±) A parte inferior aquece até um máximo de 43.6 °C / 110 F, em comparação com a média de 36.9 °C / 98 F
(+) Em uso inativo, a temperatura média para o lado superior é 30.7 °C / 87 F, em comparação com a média do dispositivo de 30.3 °C / ### class_avg_f### F.
(+) Os apoios para as mãos e o touchpad estão atingindo a temperatura máxima da pele (33.3 °C / 91.9 F) e, portanto, não estão quentes.
(-) A temperatura média da área do apoio para as mãos de dispositivos semelhantes foi 28 °C / 82.4 F (-5.3 °C / -9.5 F).
| HP Envy x360 13-ar0601ng Vega 10, R7 3700U, SK Hynix BC501 HFM512GDJTNG | Lenovo ThinkPad X390 Yoga-20NQS05R00 UHD Graphics 620, i7-8565U, Intel SSD Pro 7600p SSDPEKKF512G8L | Dell Latitude 13 3390 UHD Graphics 620, i5-8250U, SK hynix SC311 SATA | Lenovo ThinkPad L390 Yoga-20NT000XGE UHD Graphics 620, i5-8265U, Samsung SSD PM981 MZVLB256HAHQ | Dell Inspiron 13 7386 UHD Graphics 620, i7-8565U, SK Hynix BC501 HFM512GDJTNG | Lenovo Yoga C930-13IKB UHD Graphics 620, i5-8250U, SK hynix PC401 HFS256GD9TNG | |
|---|---|---|---|---|---|---|
| Heat | 3% | 11% | 6% | 13% | 14% | |
| Maximum Upper Side * (°C) | 43 | 41.7 3% | 40 7% | 46.7 -9% | 40.5 6% | 41.8 3% |
| Maximum Bottom * (°C) | 43.6 | 50.1 -15% | 46.1 -6% | 50.7 -16% | 41.6 5% | 40.9 6% |
| Idle Upper Side * (°C) | 33.1 | 27.8 16% | 25.7 22% | 23.8 28% | 26.3 21% | 25.6 23% |
| Idle Bottom * (°C) | 32.5 | 30.2 7% | 26 20% | 25.6 21% | 26.2 19% | 24.5 25% |
* ... menor é melhor
HP Envy x360 13-ar0601ng análise de áudio
(-) | alto-falantes não muito altos (###valor### dB)
Graves 100 - 315Hz
(-) | quase nenhum baixo - em média 19.5% menor que a mediana
(±) | a linearidade dos graves é média (12.6% delta para a frequência anterior)
Médios 400 - 2.000 Hz
(+) | médios equilibrados - apenas 4.3% longe da mediana
(±) | a linearidade dos médios é média (7.2% delta para frequência anterior)
Altos 2 - 16 kHz
(+) | agudos equilibrados - apenas 3.1% longe da mediana
(+) | os máximos são lineares (4.7% delta da frequência anterior)
Geral 100 - 16.000 Hz
(±) | a linearidade do som geral é média (21.2% diferença em relação à mediana)
Comparado com a mesma classe
» 57% de todos os dispositivos testados nesta classe foram melhores, 11% semelhantes, 32% piores
» O melhor teve um delta de 6%, a média foi 20%, o pior foi 57%
Comparado com todos os dispositivos testados
» 59% de todos os dispositivos testados foram melhores, 7% semelhantes, 34% piores
» O melhor teve um delta de 4%, a média foi 24%, o pior foi 134%
| desligado | |
| Ocioso | |
| Carga |
|
Key:
min: | |
| HP Envy x360 13-ar0601ng R7 3700U, Vega 10, SK Hynix BC501 HFM512GDJTNG, IPS, 120 Hz, 1920x1080, 13.3" | Lenovo ThinkPad X390 Yoga-20NQS05R00 i7-8565U, UHD Graphics 620, Intel SSD Pro 7600p SSDPEKKF512G8L, IPS LED, 1920x1080, 13.3" | Dell Latitude 13 3390 i5-8250U, UHD Graphics 620, SK hynix SC311 SATA, IPS, 1920x1080, 13.3" | Lenovo ThinkPad L390 Yoga-20NT000XGE i5-8265U, UHD Graphics 620, Samsung SSD PM981 MZVLB256HAHQ, IPS LED, 1920x1080, 13.3" | Dell Inspiron 13 7386 i7-8565U, UHD Graphics 620, SK Hynix BC501 HFM512GDJTNG, IPS, 3840x2160, 13.3" | Lenovo Yoga C930-13IKB i5-8250U, UHD Graphics 620, SK hynix PC401 HFS256GD9TNG, IPS, 1920x1080, 13.9" | Média AMD Radeon RX Vega 10 | Média da turma Convertible | |
|---|---|---|---|---|---|---|---|---|
| Power Consumption | -42% | -24% | -41% | -96% | -41% | -45% | -54% | |
| Idle Minimum * (Watt) | 3.2 | 3.46 -8% | 3.9 -22% | 4 -25% | 6.5 -103% | 3.3 -3% | 4.73 ? -48% | 4.24 ? -33% |
| Idle Average * (Watt) | 2.8 | 5.88 -110% | 6.5 -132% | 7.1 -154% | 12.2 -336% | 6.8 -143% | 7.61 ? -172% | 7.03 ? -151% |
| Idle Maximum * (Watt) | 12.4 | 9.12 26% | 8.6 31% | 10.7 14% | 12.7 -2% | 9.5 23% | 9.63 ? 22% | 8.61 ? 31% |
| Load Average * (Watt) | 24.2 | 45.6 -88% | 25 -3% | 33.8 -40% | 39 -61% | 40.8 -69% | 33.3 ? -38% | 43.9 ? -81% |
| Load Maximum * (Watt) | 50 | 65.9 -32% | 48.1 4% | 48.8 2% | 39 22% | 57 -14% | 45.1 ? 10% | 67.2 ? -34% |
* ... menor é melhor
| HP Envy x360 13-ar0601ng R7 3700U, Vega 10, 53 Wh | Lenovo ThinkPad X390 Yoga-20NQS05R00 i7-8565U, UHD Graphics 620, 50 Wh | Dell Latitude 13 3390 i5-8250U, UHD Graphics 620, 42 Wh | Lenovo ThinkPad L390 Yoga-20NT000XGE i5-8265U, UHD Graphics 620, 45 Wh | Dell Inspiron 13 7386 i7-8565U, UHD Graphics 620, 38 Wh | Lenovo Yoga C930-13IKB i5-8250U, UHD Graphics 620, 60 Wh | Média da turma Convertible | |
|---|---|---|---|---|---|---|---|
| Duração da bateria | 11% | 6% | 8% | -33% | 53% | 87% | |
| Reader / Idle (h) | 10.5 | 16.7 59% | 15.8 50% | 6.7 -36% | 23.9 128% | 27.7 ? 164% | |
| H.264 (h) | 6.5 | 10 54% | 5.9 -9% | 7.4 14% | 5.5 -15% | 10.5 62% | 15.3 ? 135% |
| WiFi v1.3 (h) | 7.3 | 8.2 12% | 6.7 -8% | 7.2 -1% | 3.9 -47% | 9.2 26% | 12.1 ? 66% |
| Load (h) | 2.2 | 1.5 -32% | 1.8 -18% | 1.5 -32% | 1.5 -32% | 2.1 -5% | 1.779 ? -19% |
Pro
Contra
Verdict - A good display and an AMD APU
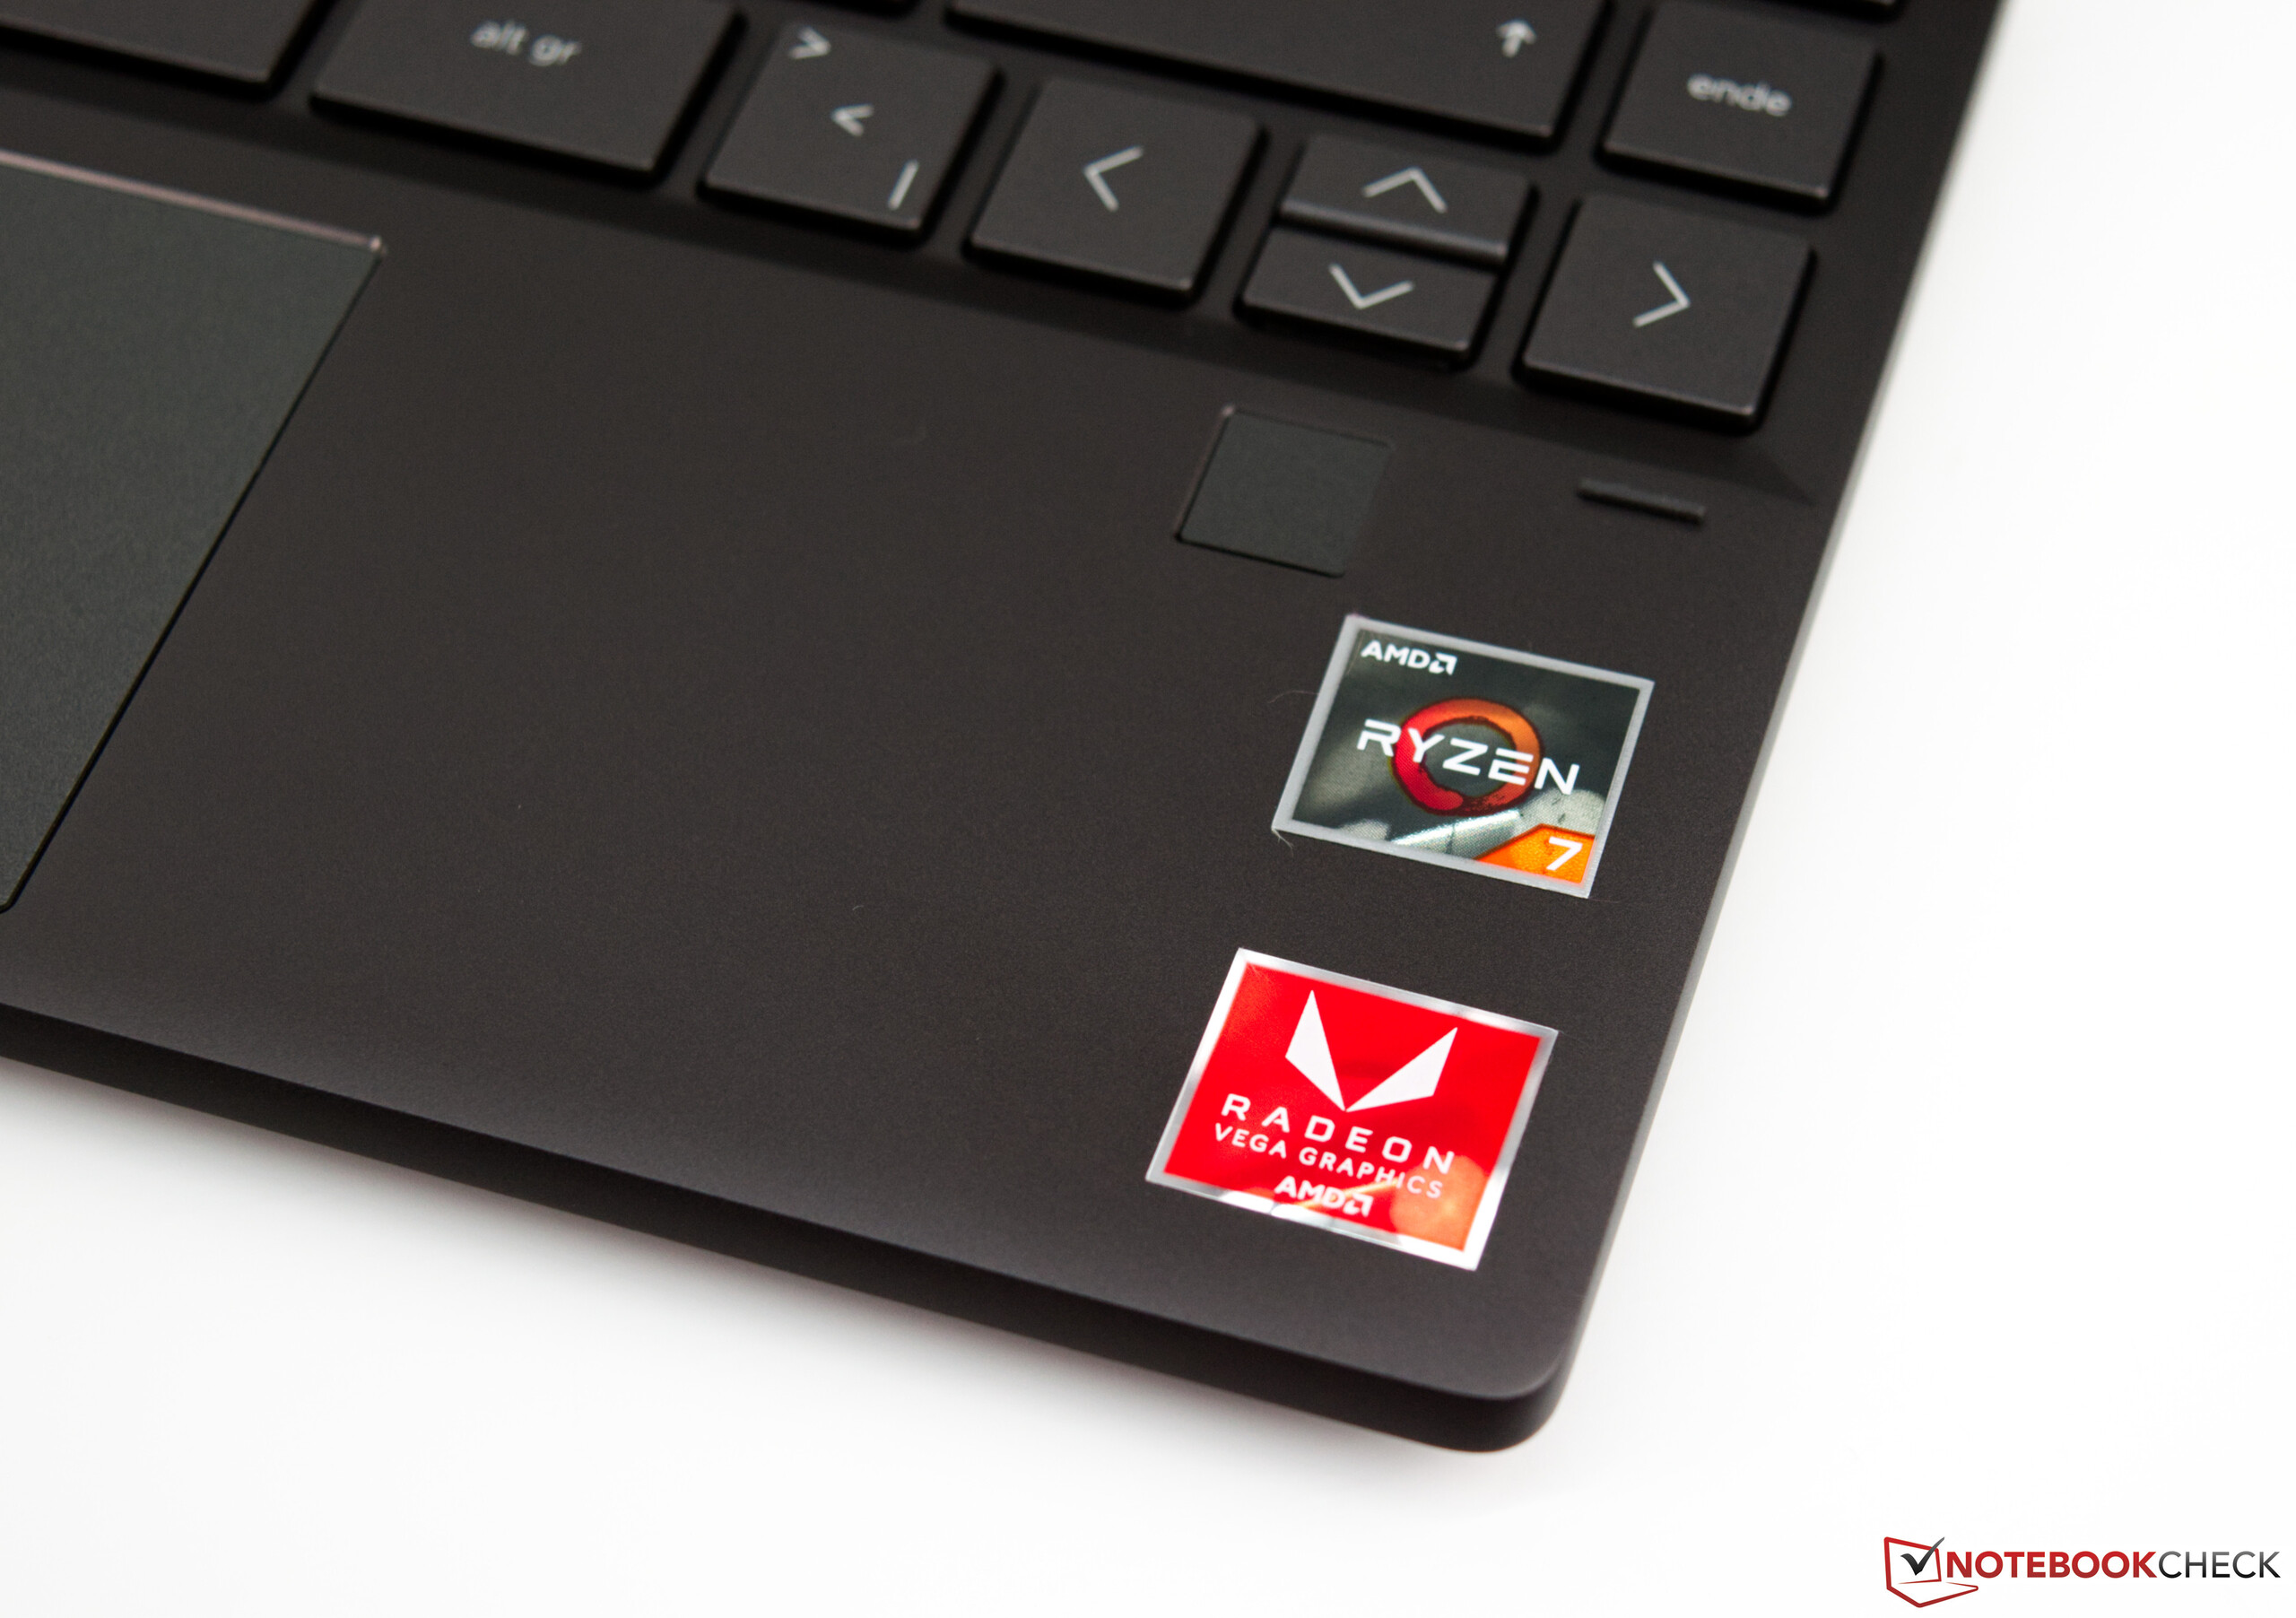
O HP Envy x360 13 é um conversível acessível por menos de 1.000 Euros (~$ 1.138). Com sua AMD Ryzen 7 3700U e AMD Radeon RX Vega 10, o dispositivo 2-em-1 oferece um bom desempenho para tarefas do dia a dia. Você também pode jogar jogos antigos sem problemas com a iGPU do SoC AMD. Afinal, essa combinação oferece um melhor desempenho 3D do que um SoC atual da Intel.
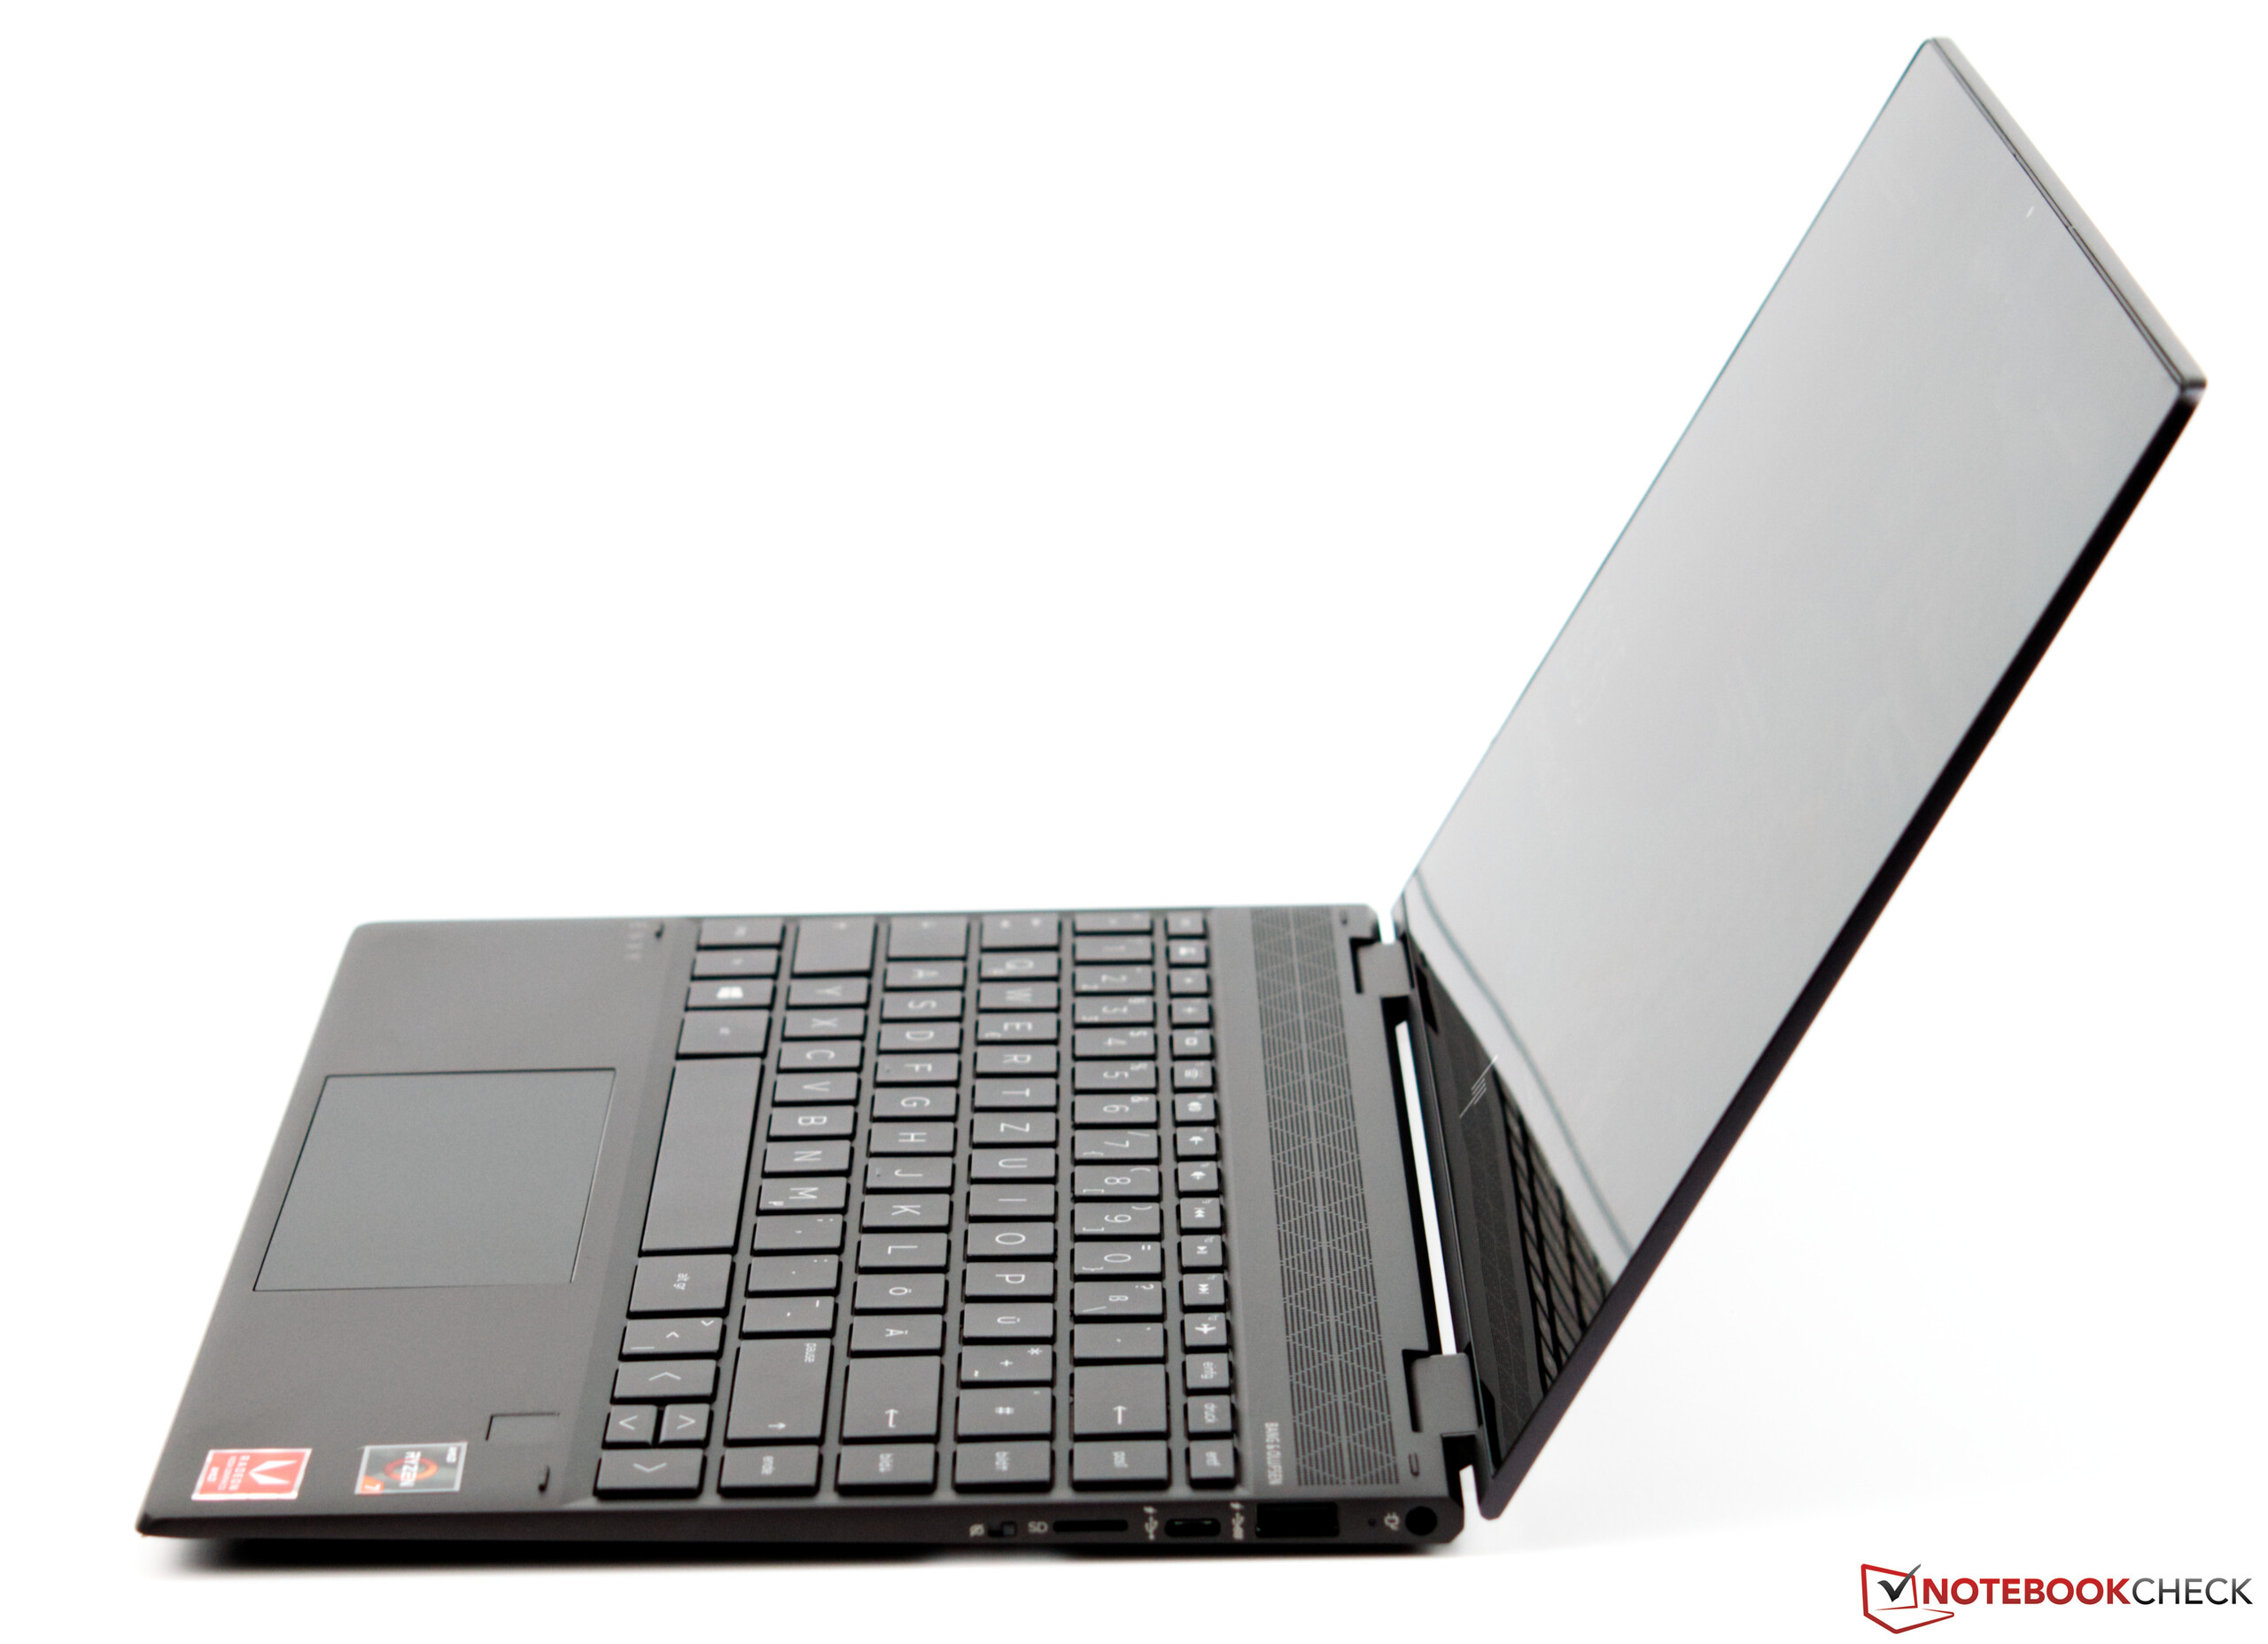
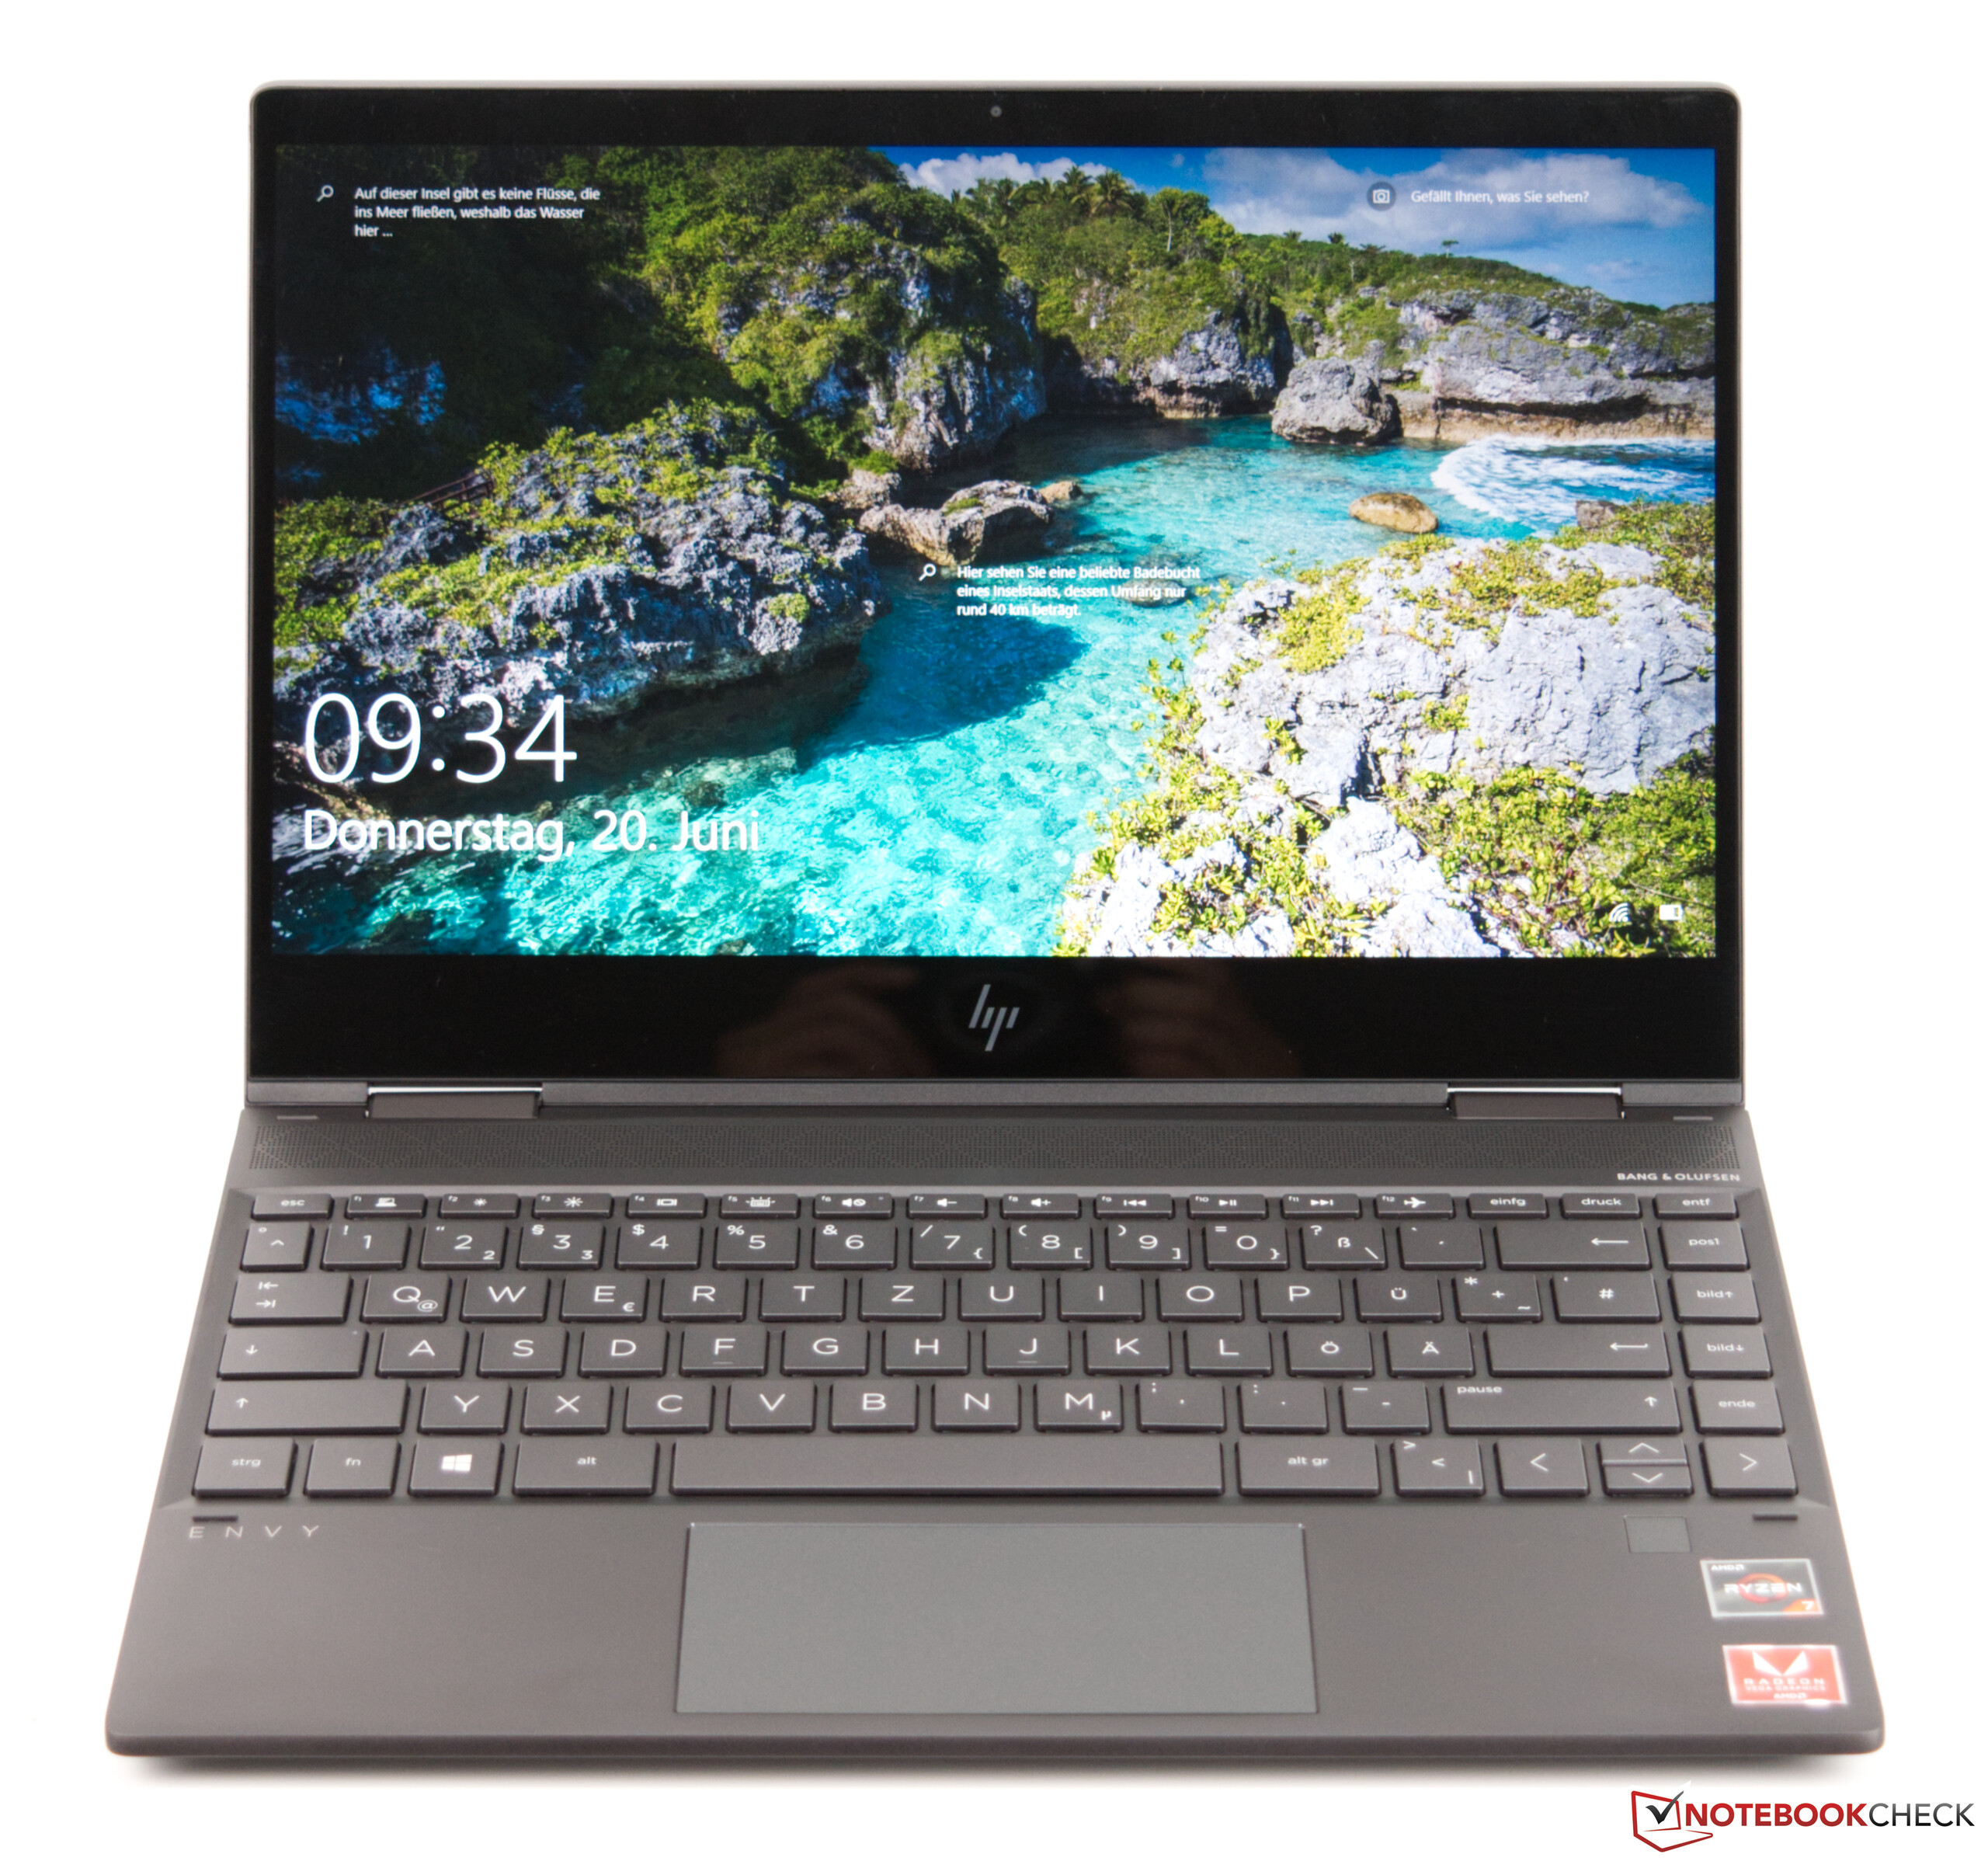
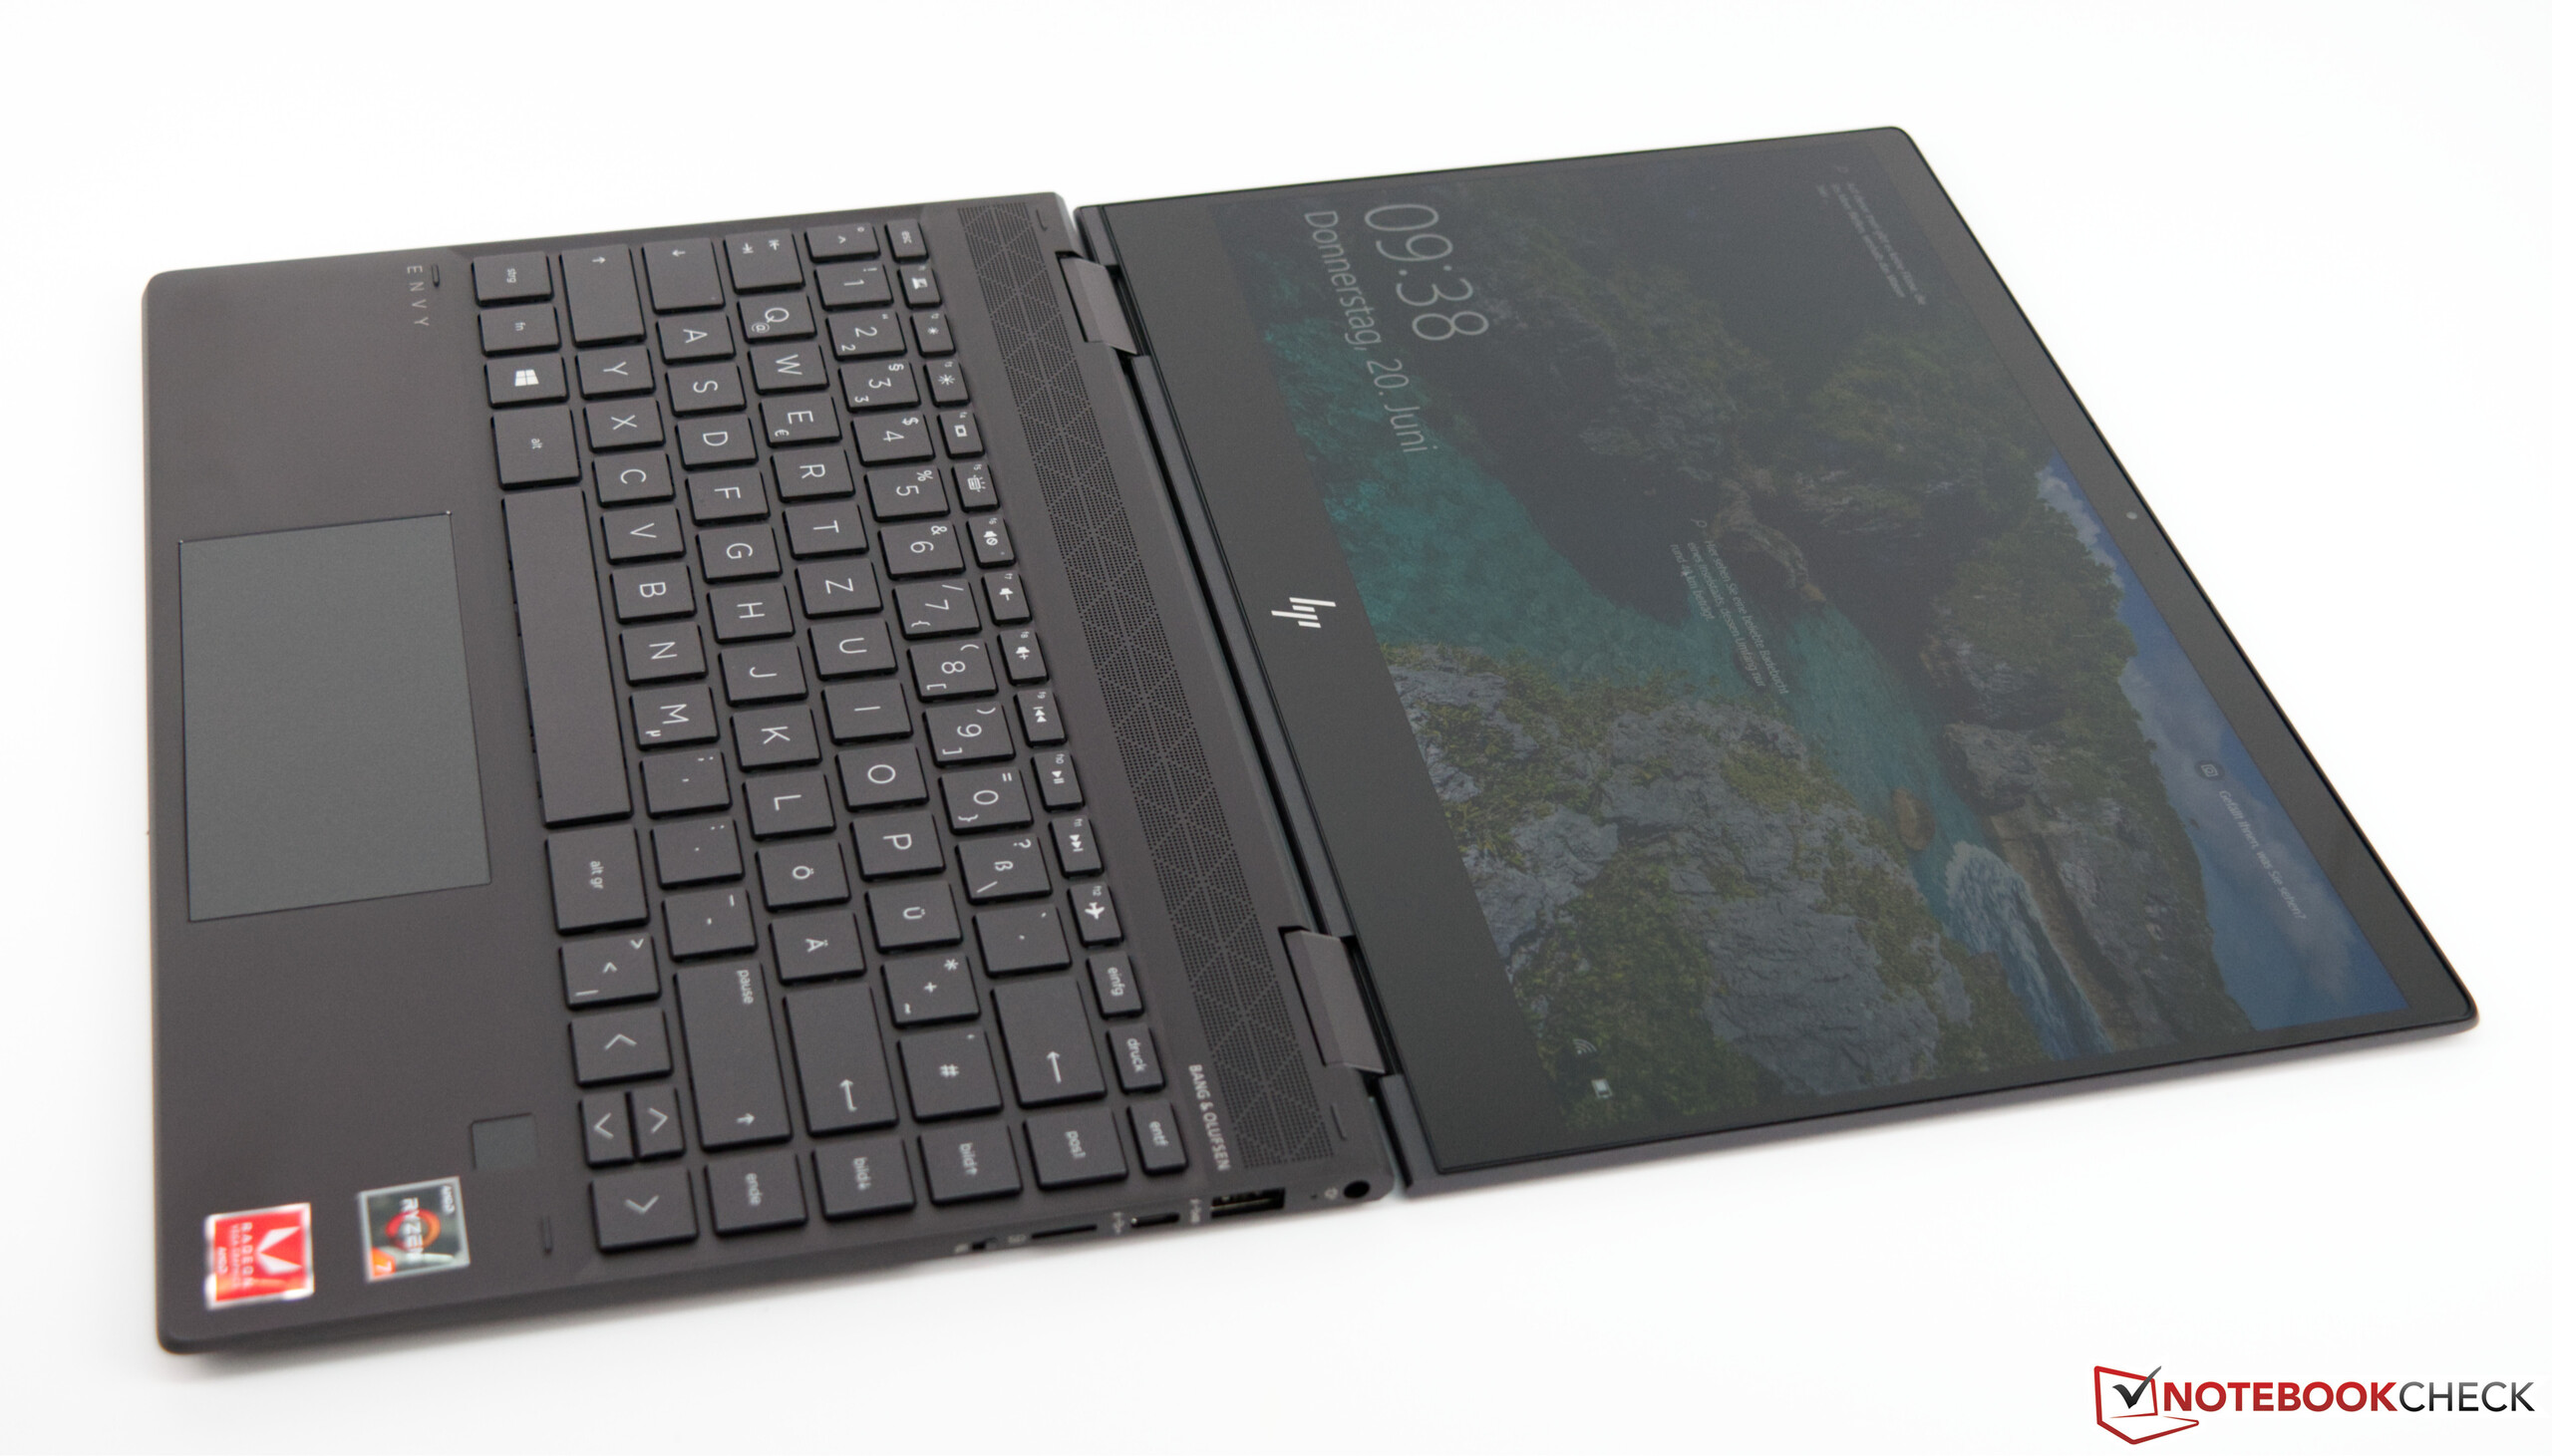
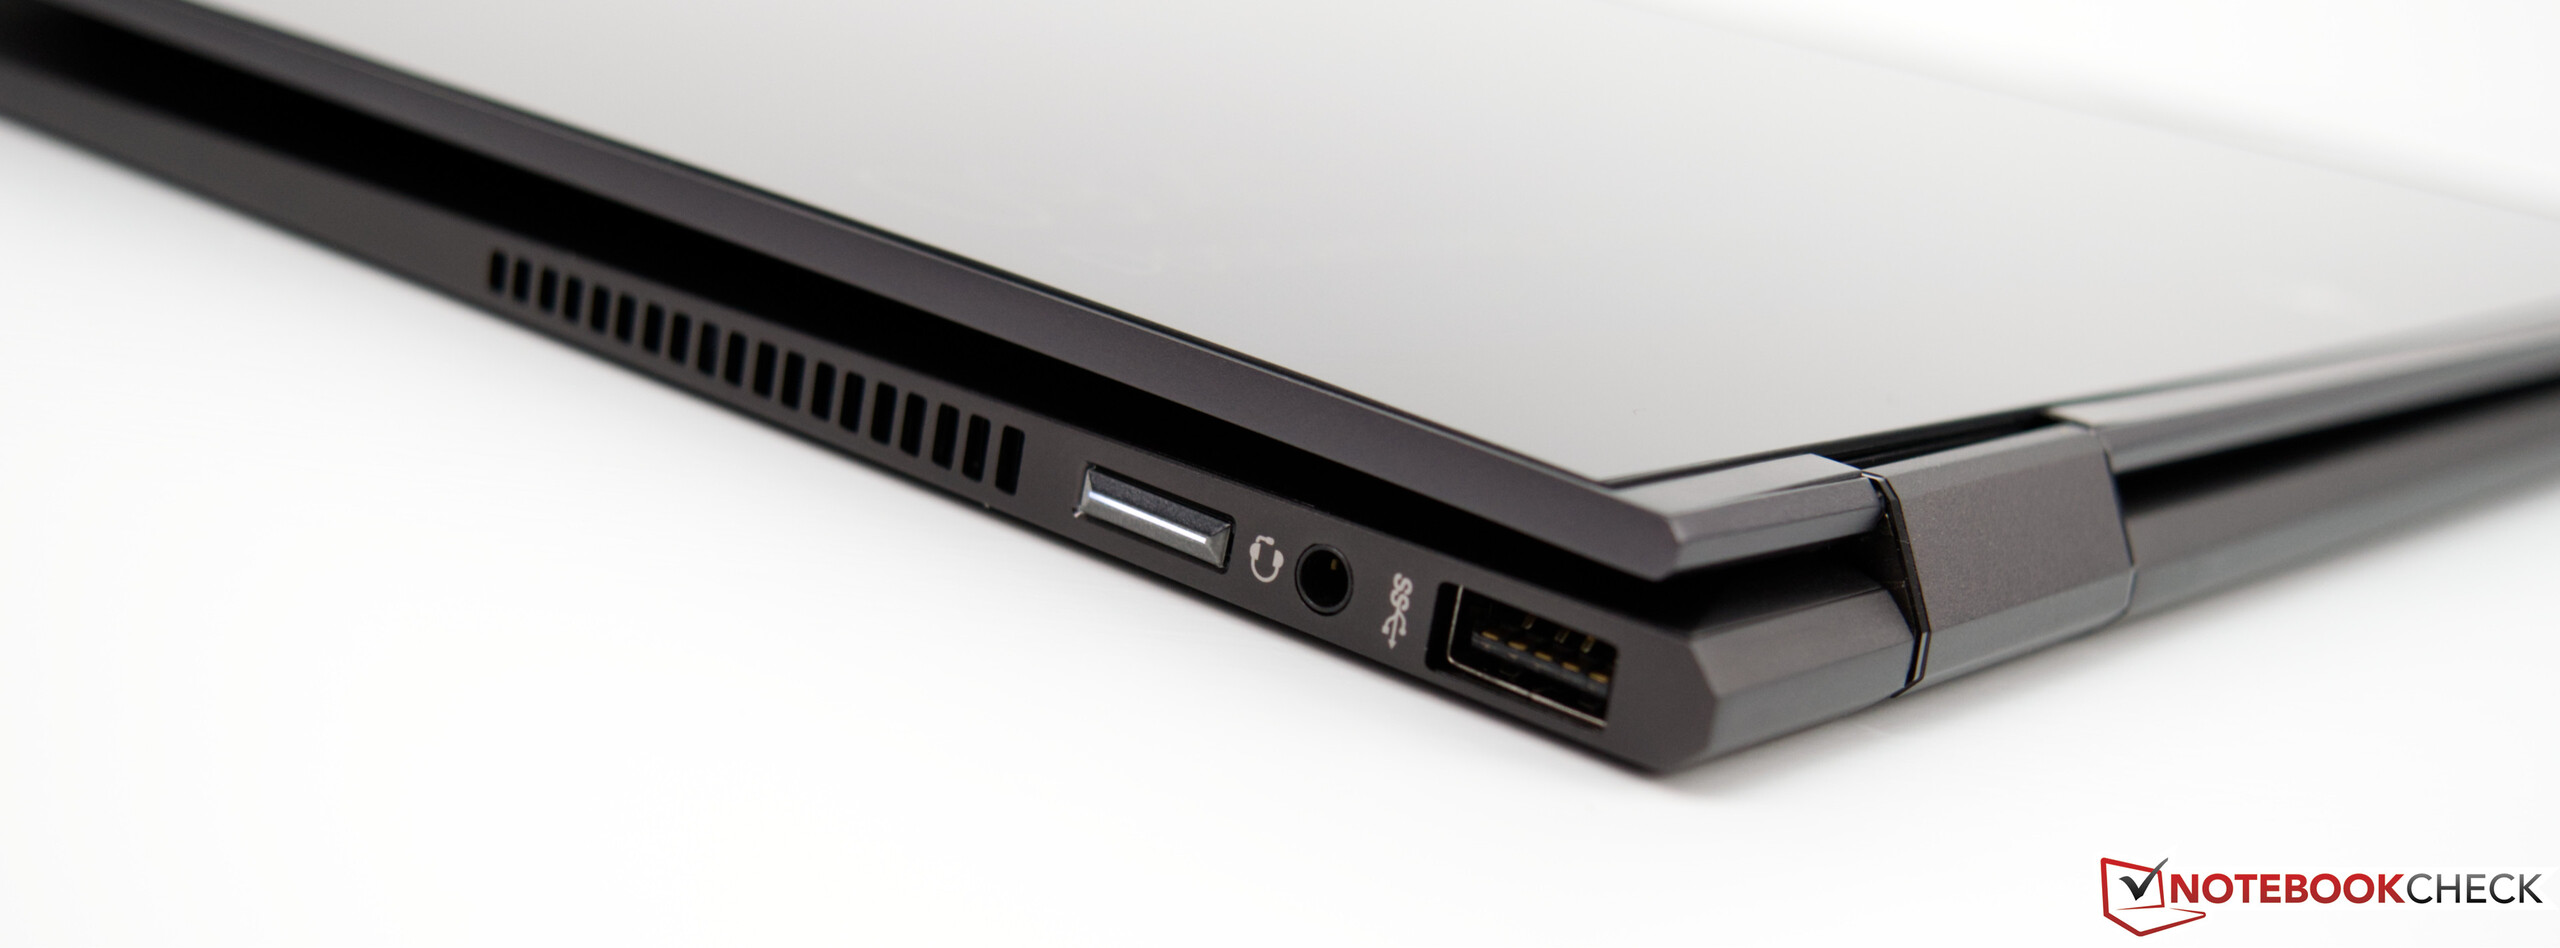
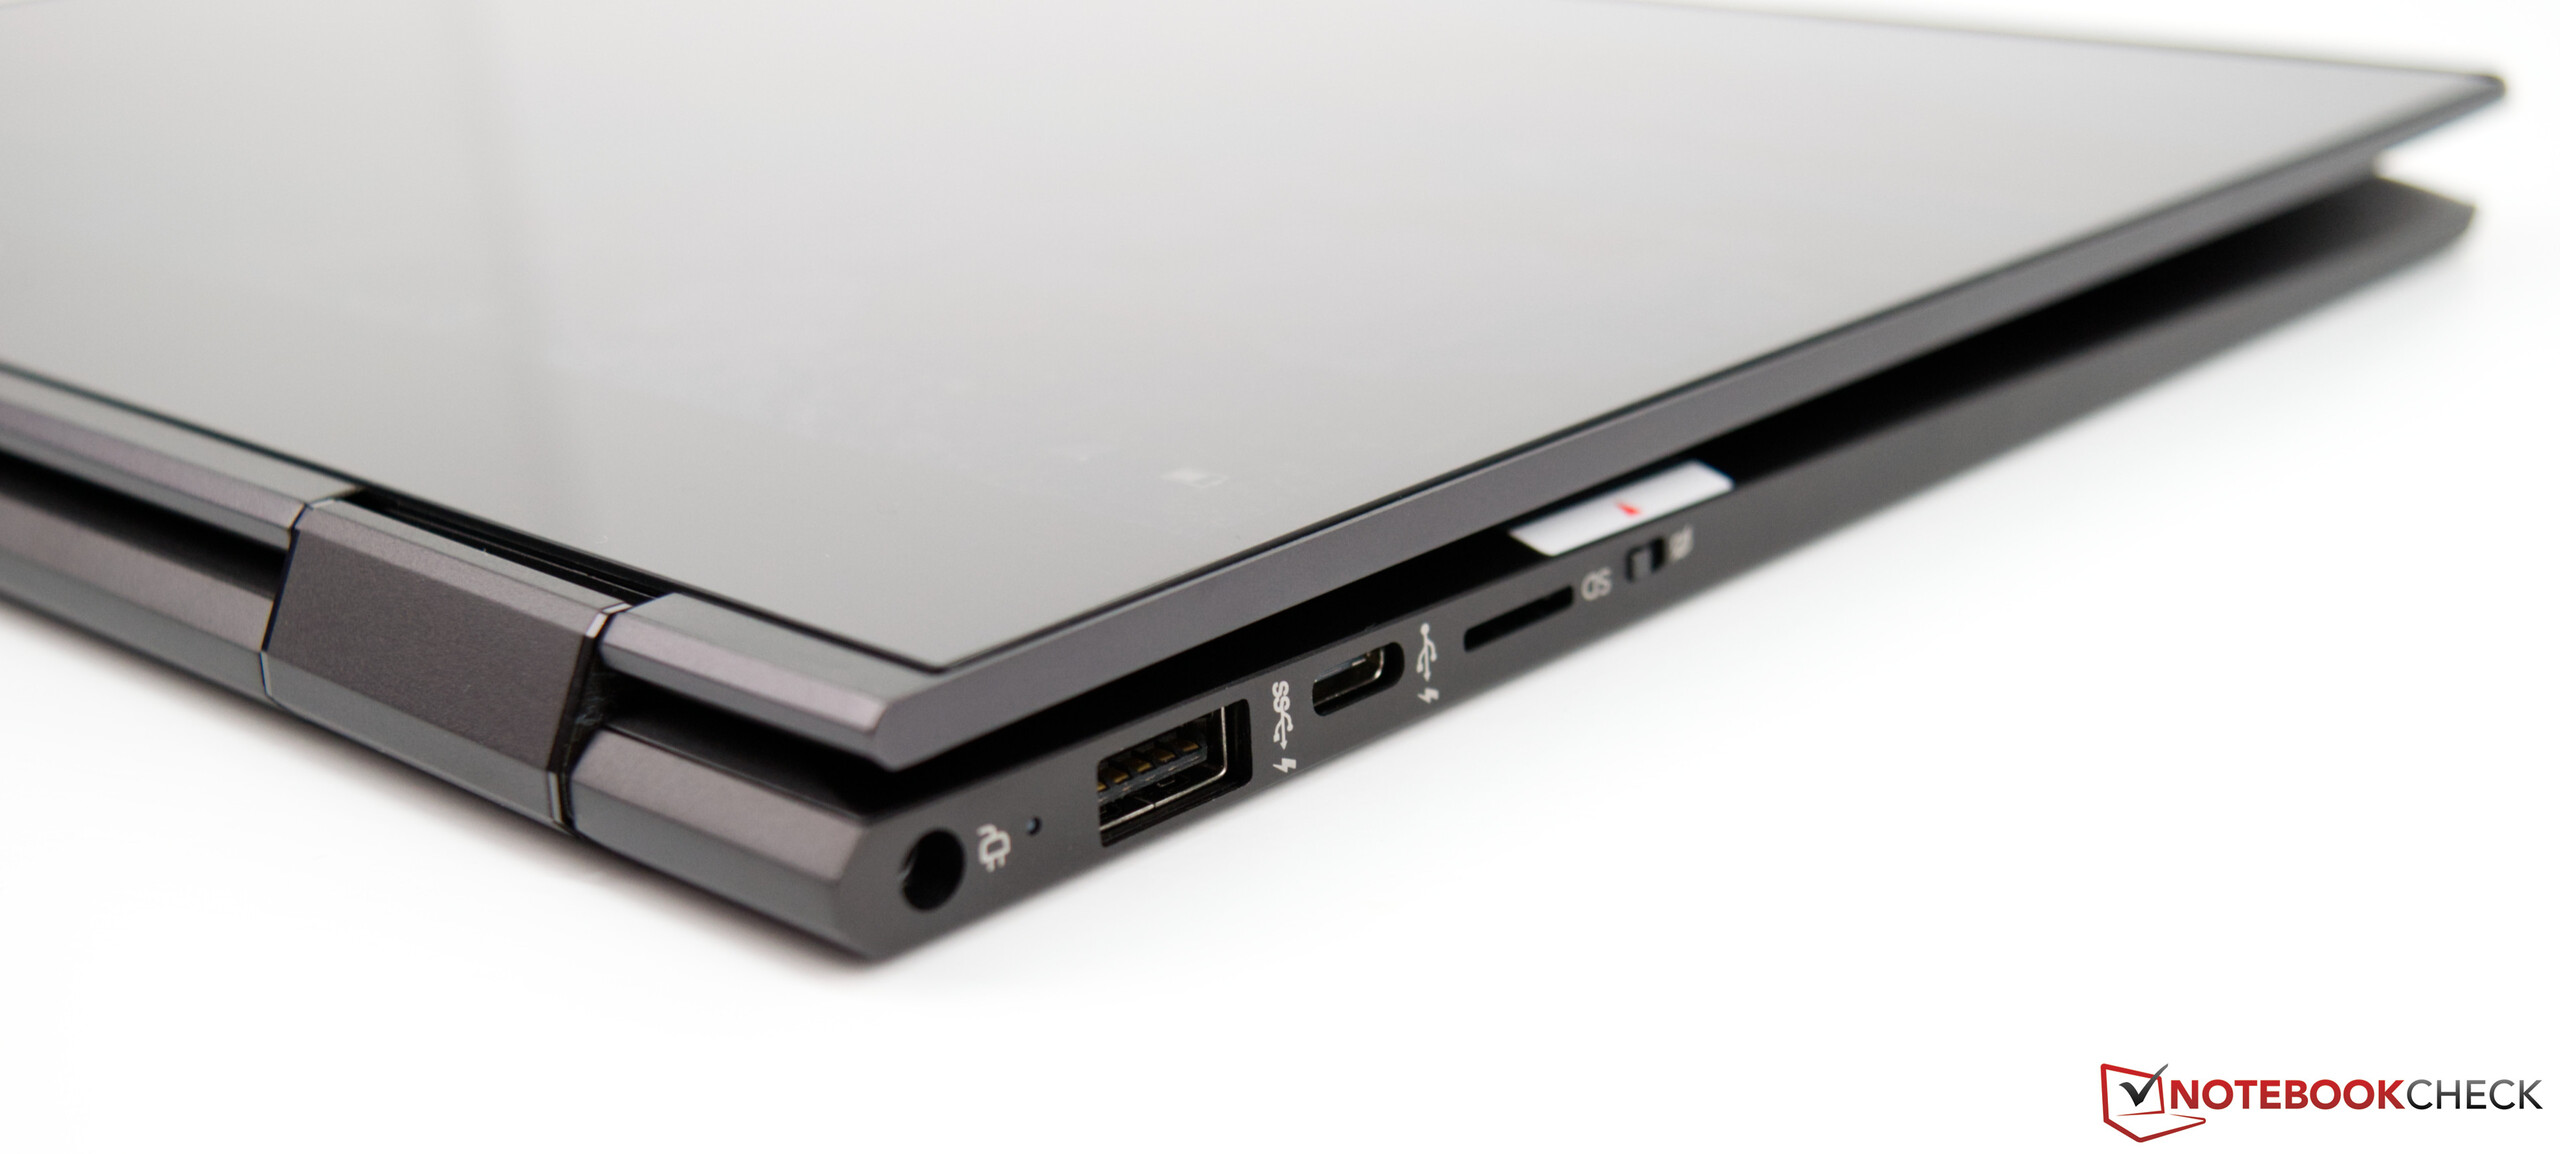
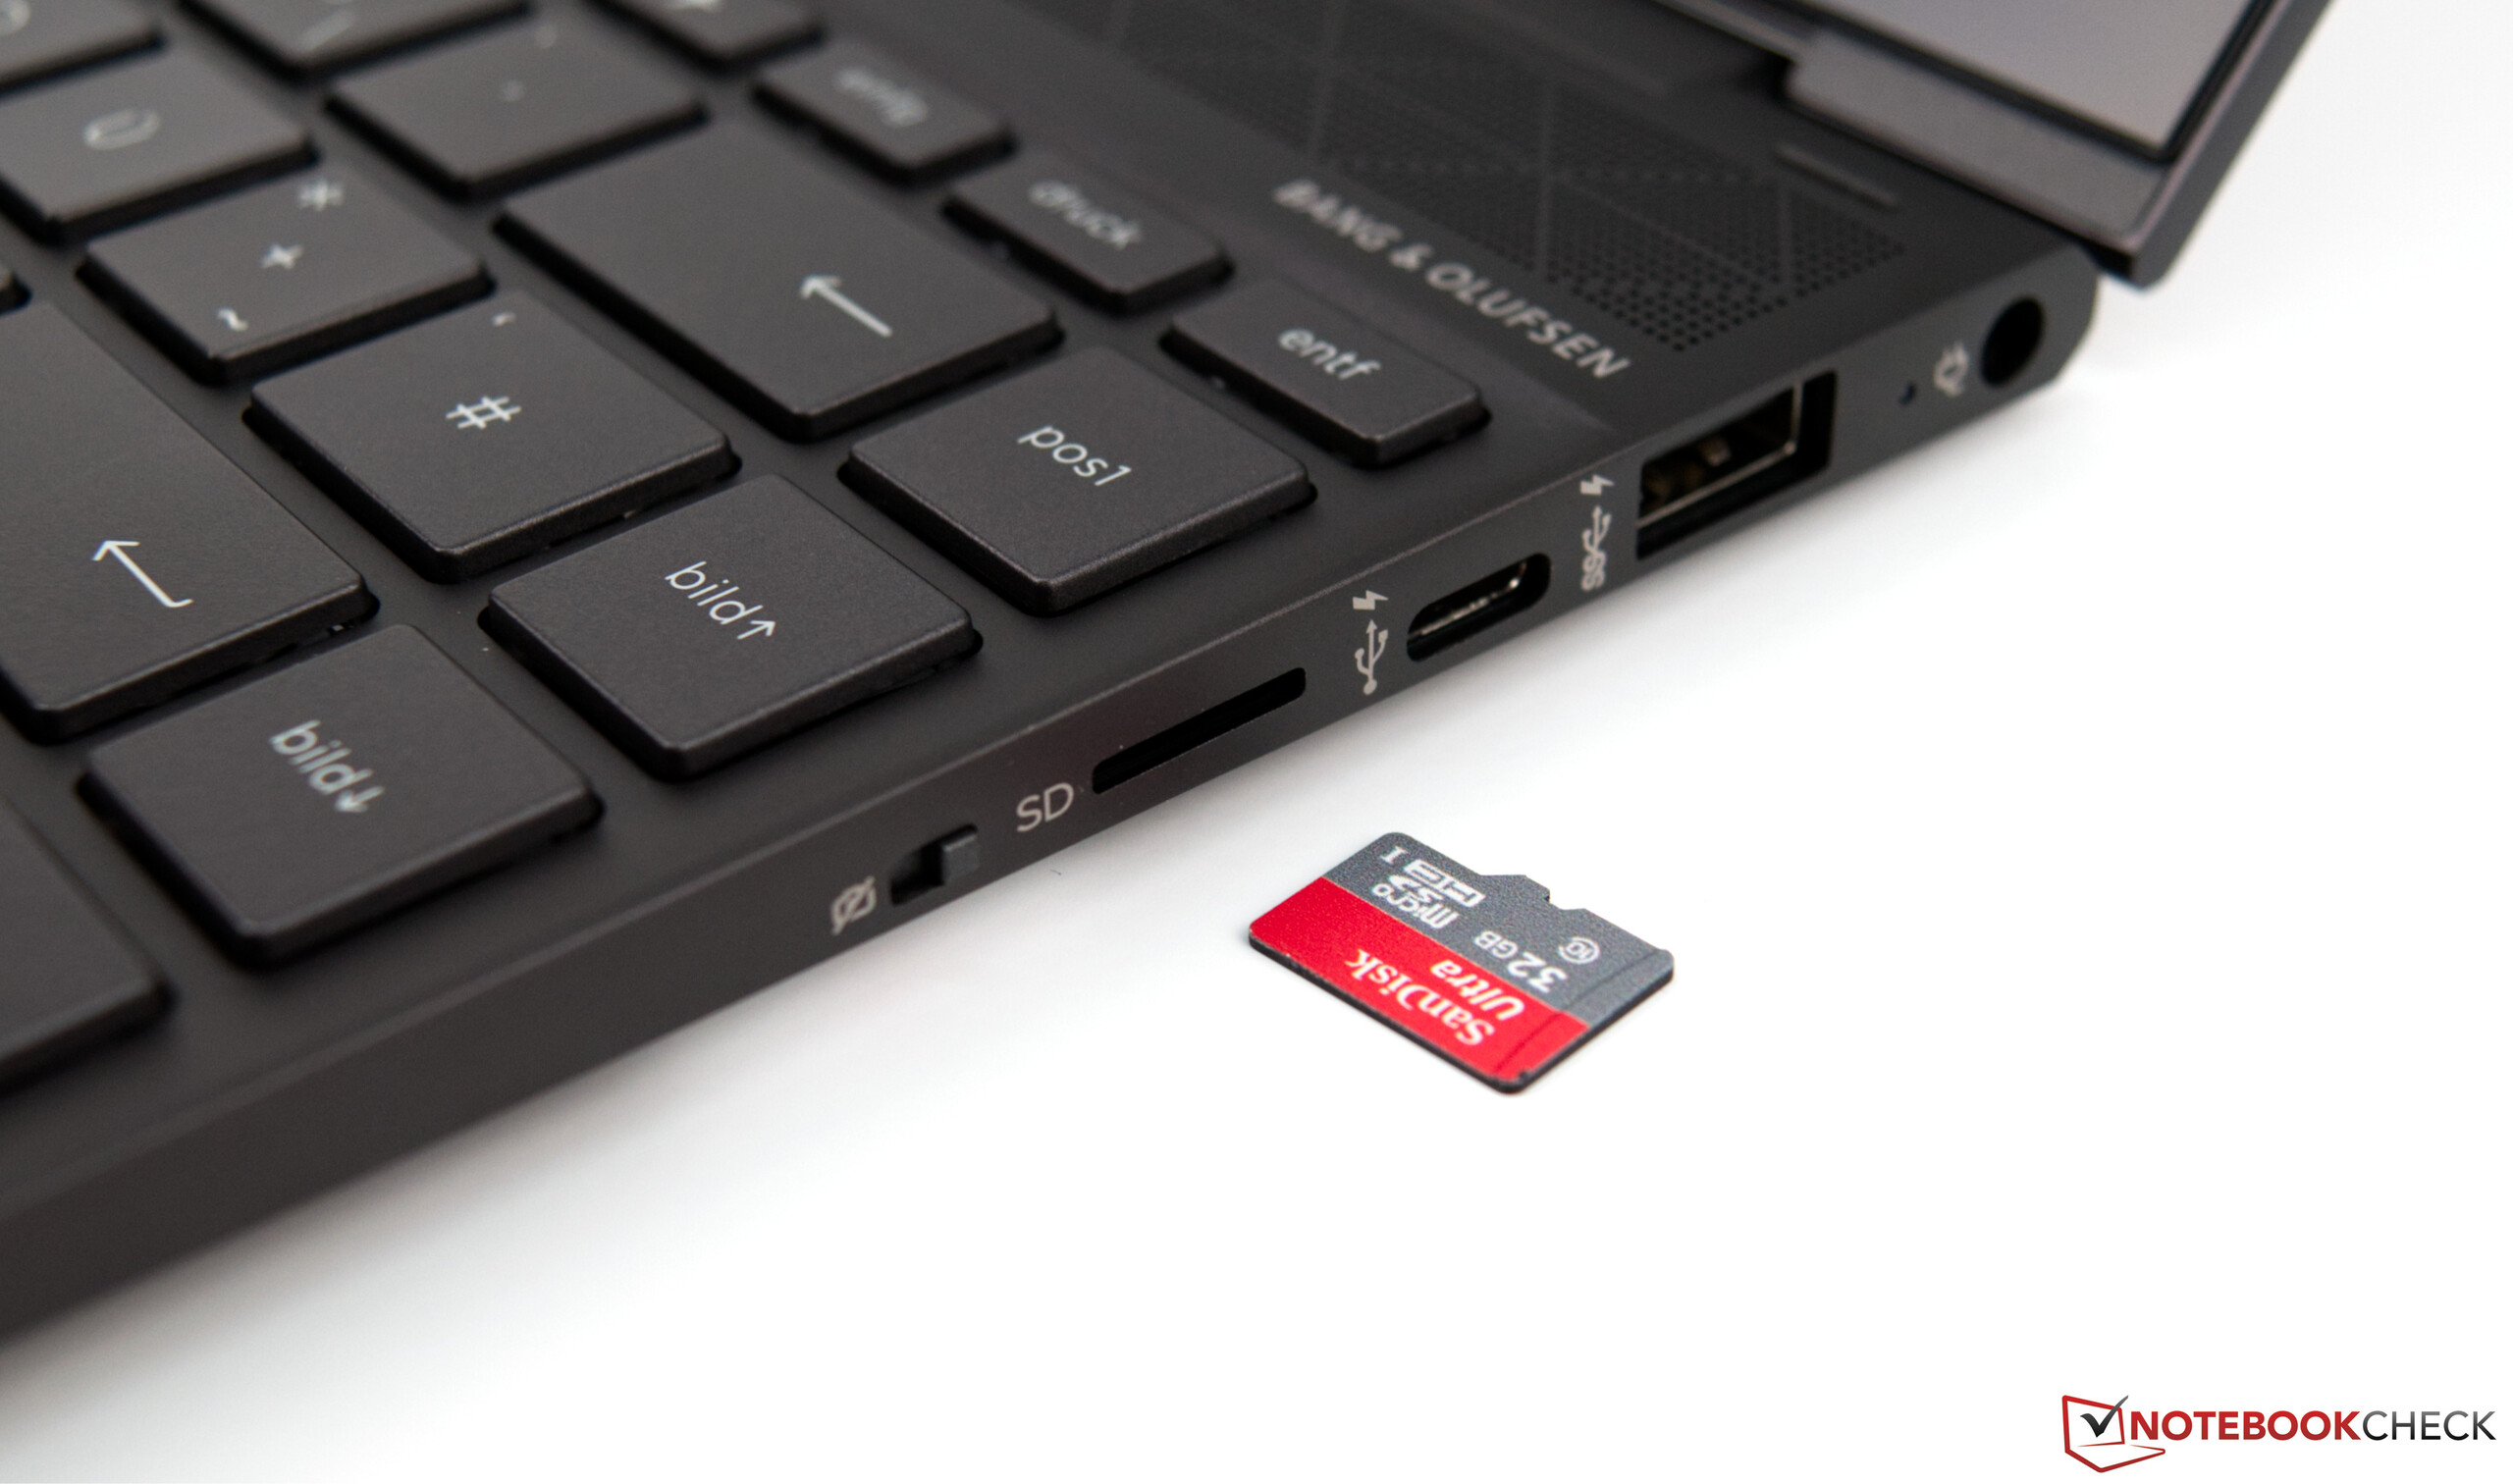
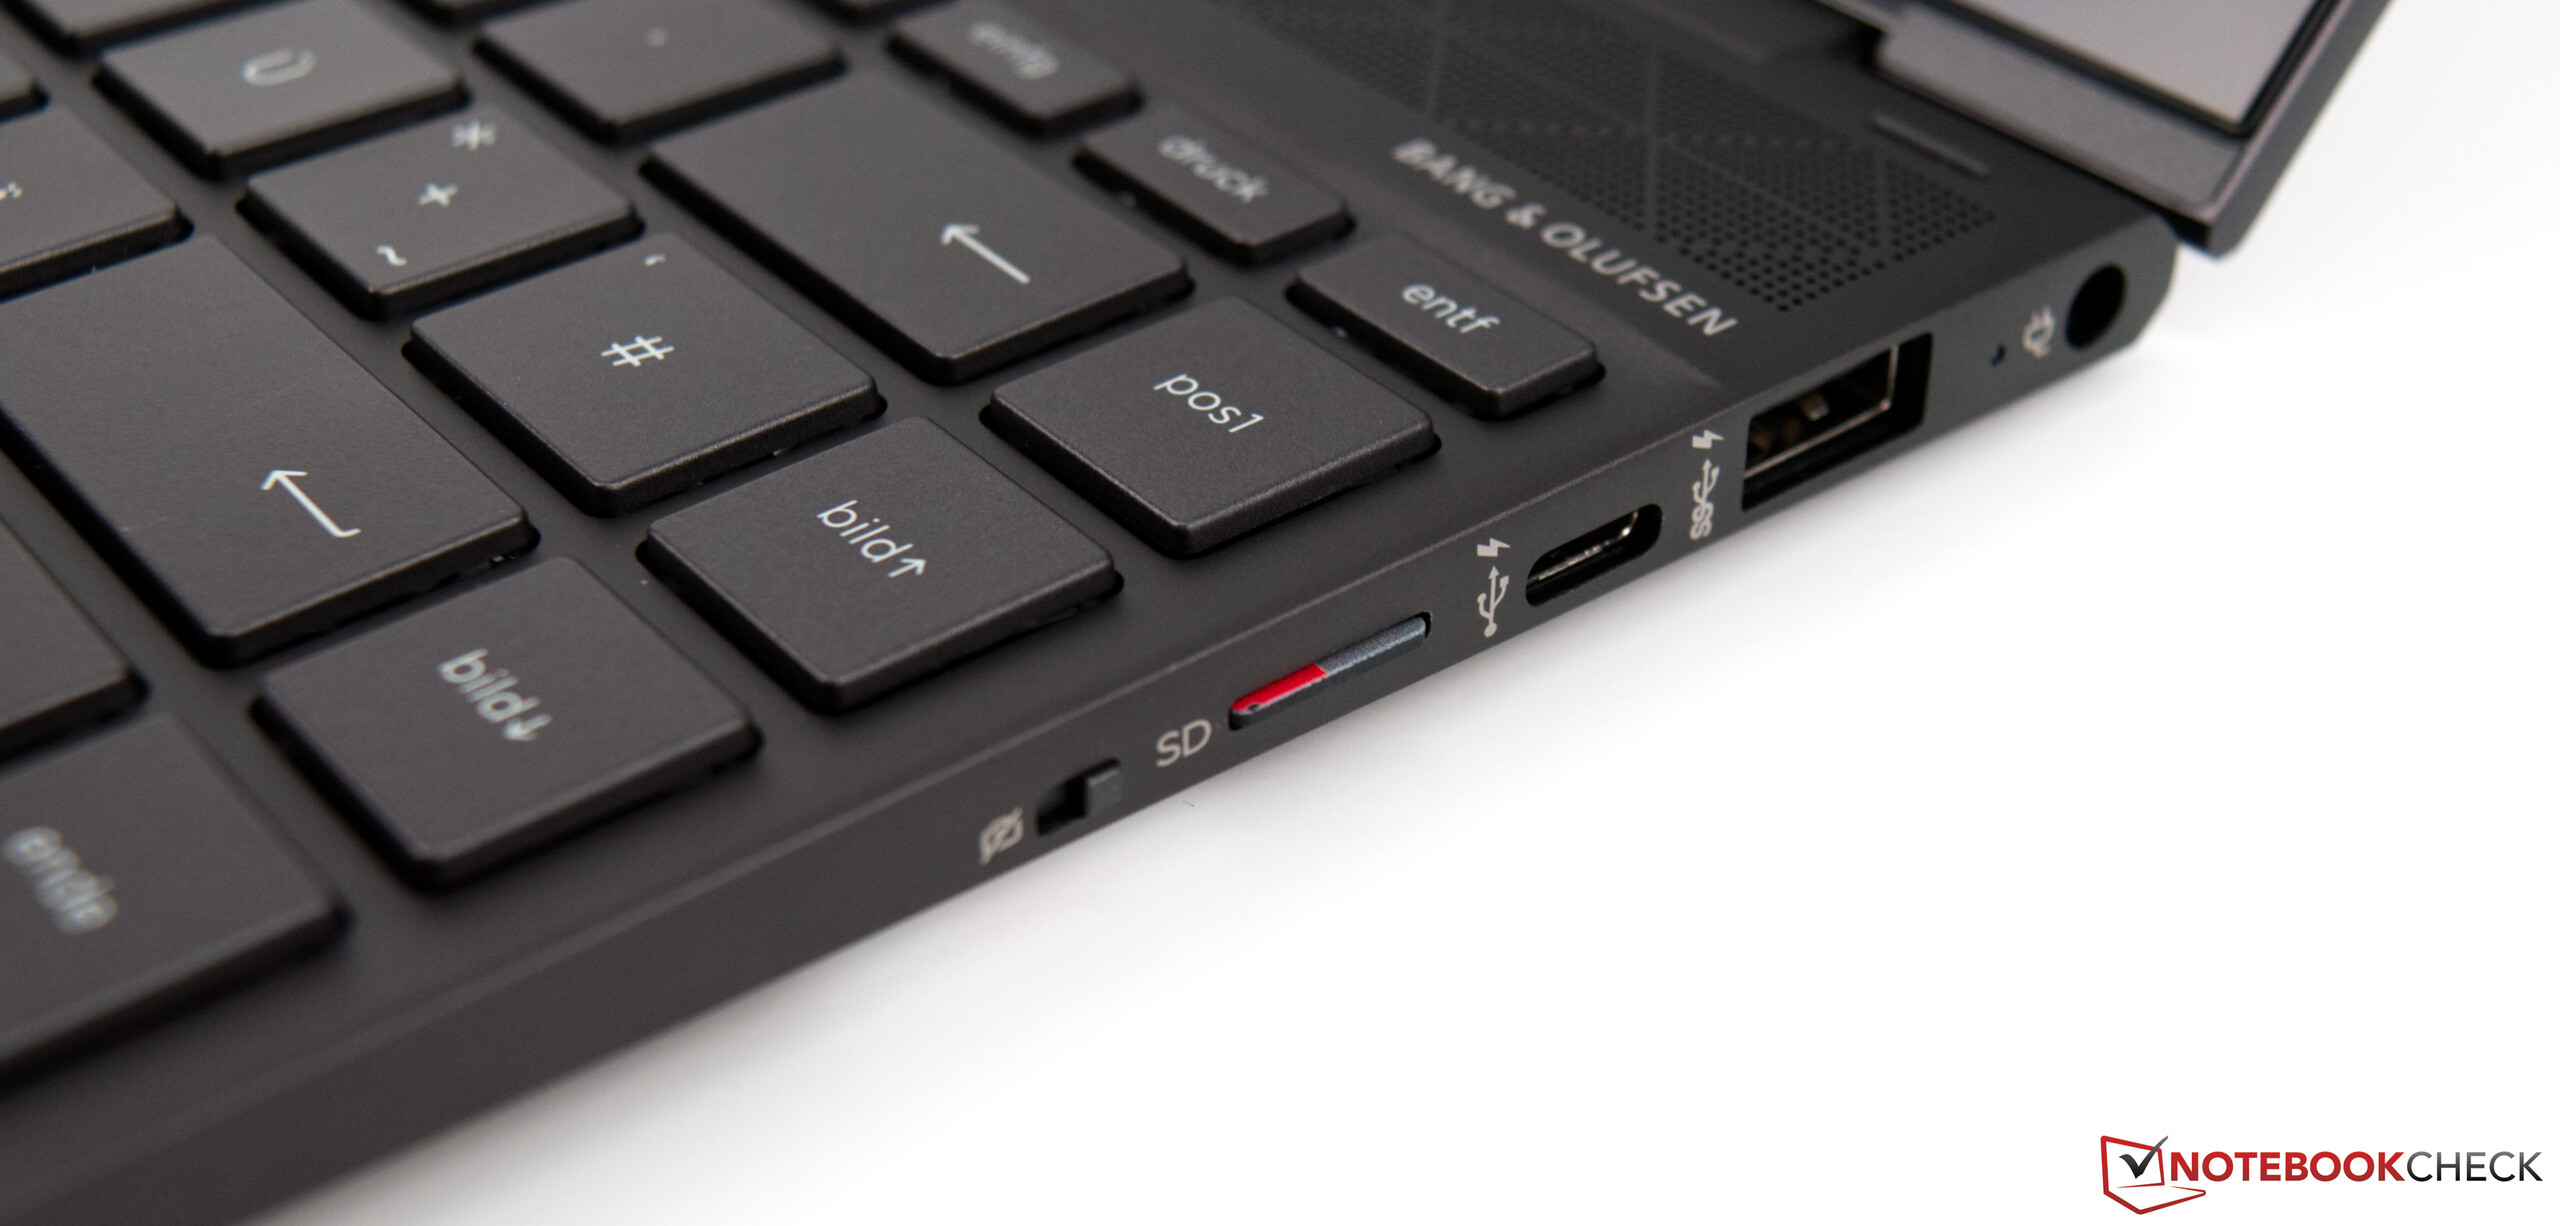
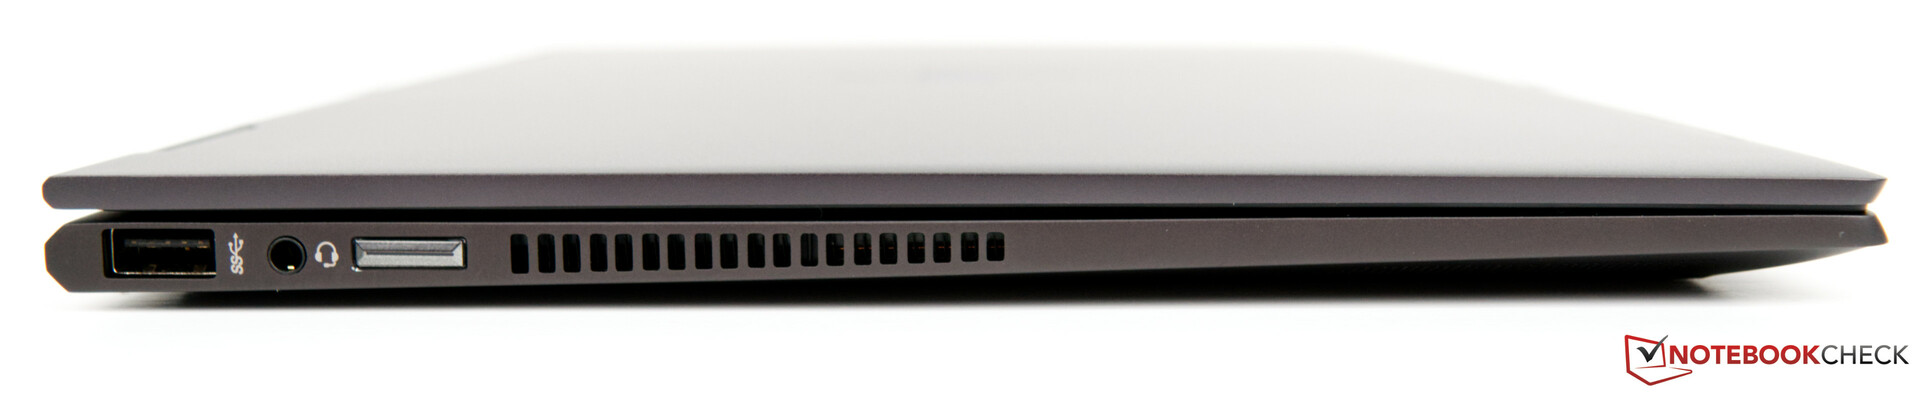
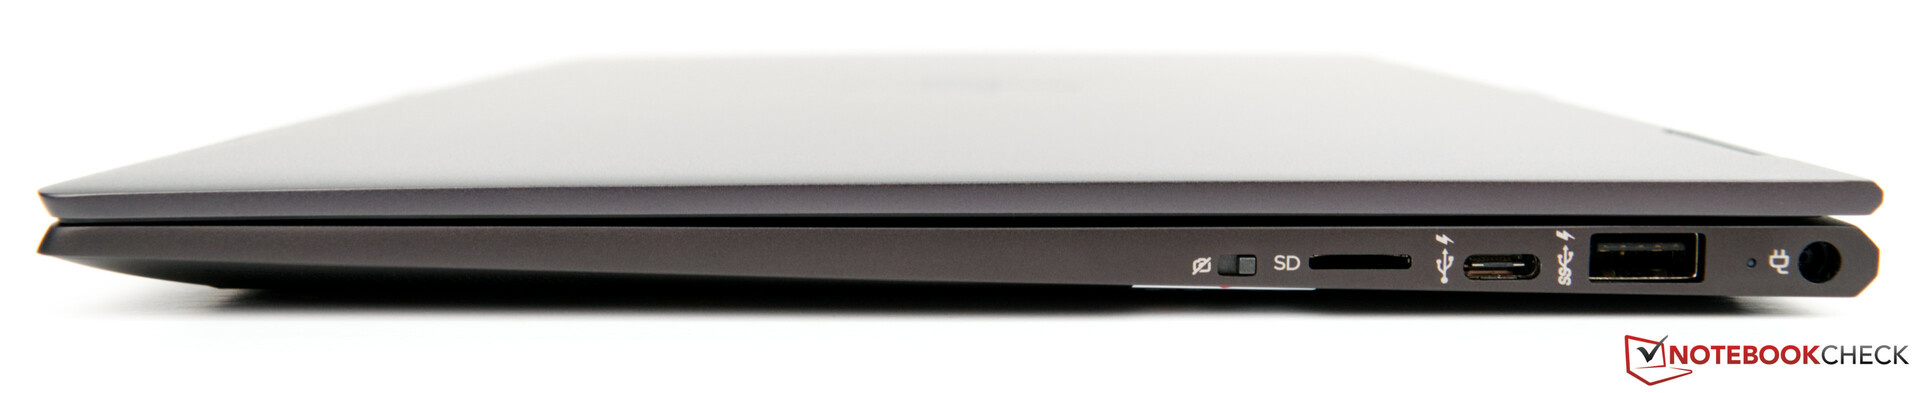
Este dispositivo deixa uma boa impressão já a julgar pelo seu visual, parecendo muito moderno devido a seus marcos finos. Aqueles que se contentam sem uma infinidade de conexões estão bem servidos com as três conexões USB disponíveis. Por outro lado, também não nos queixaríamos de uma conexão Type-C com Thunderbolt. Mas pelo menos a conexão USB Tipo C convencional que está lá suporta DisplayPort. Isso é o mínimo que esperamos, já que não há conexões HDMI ou DisplayPort diretas.
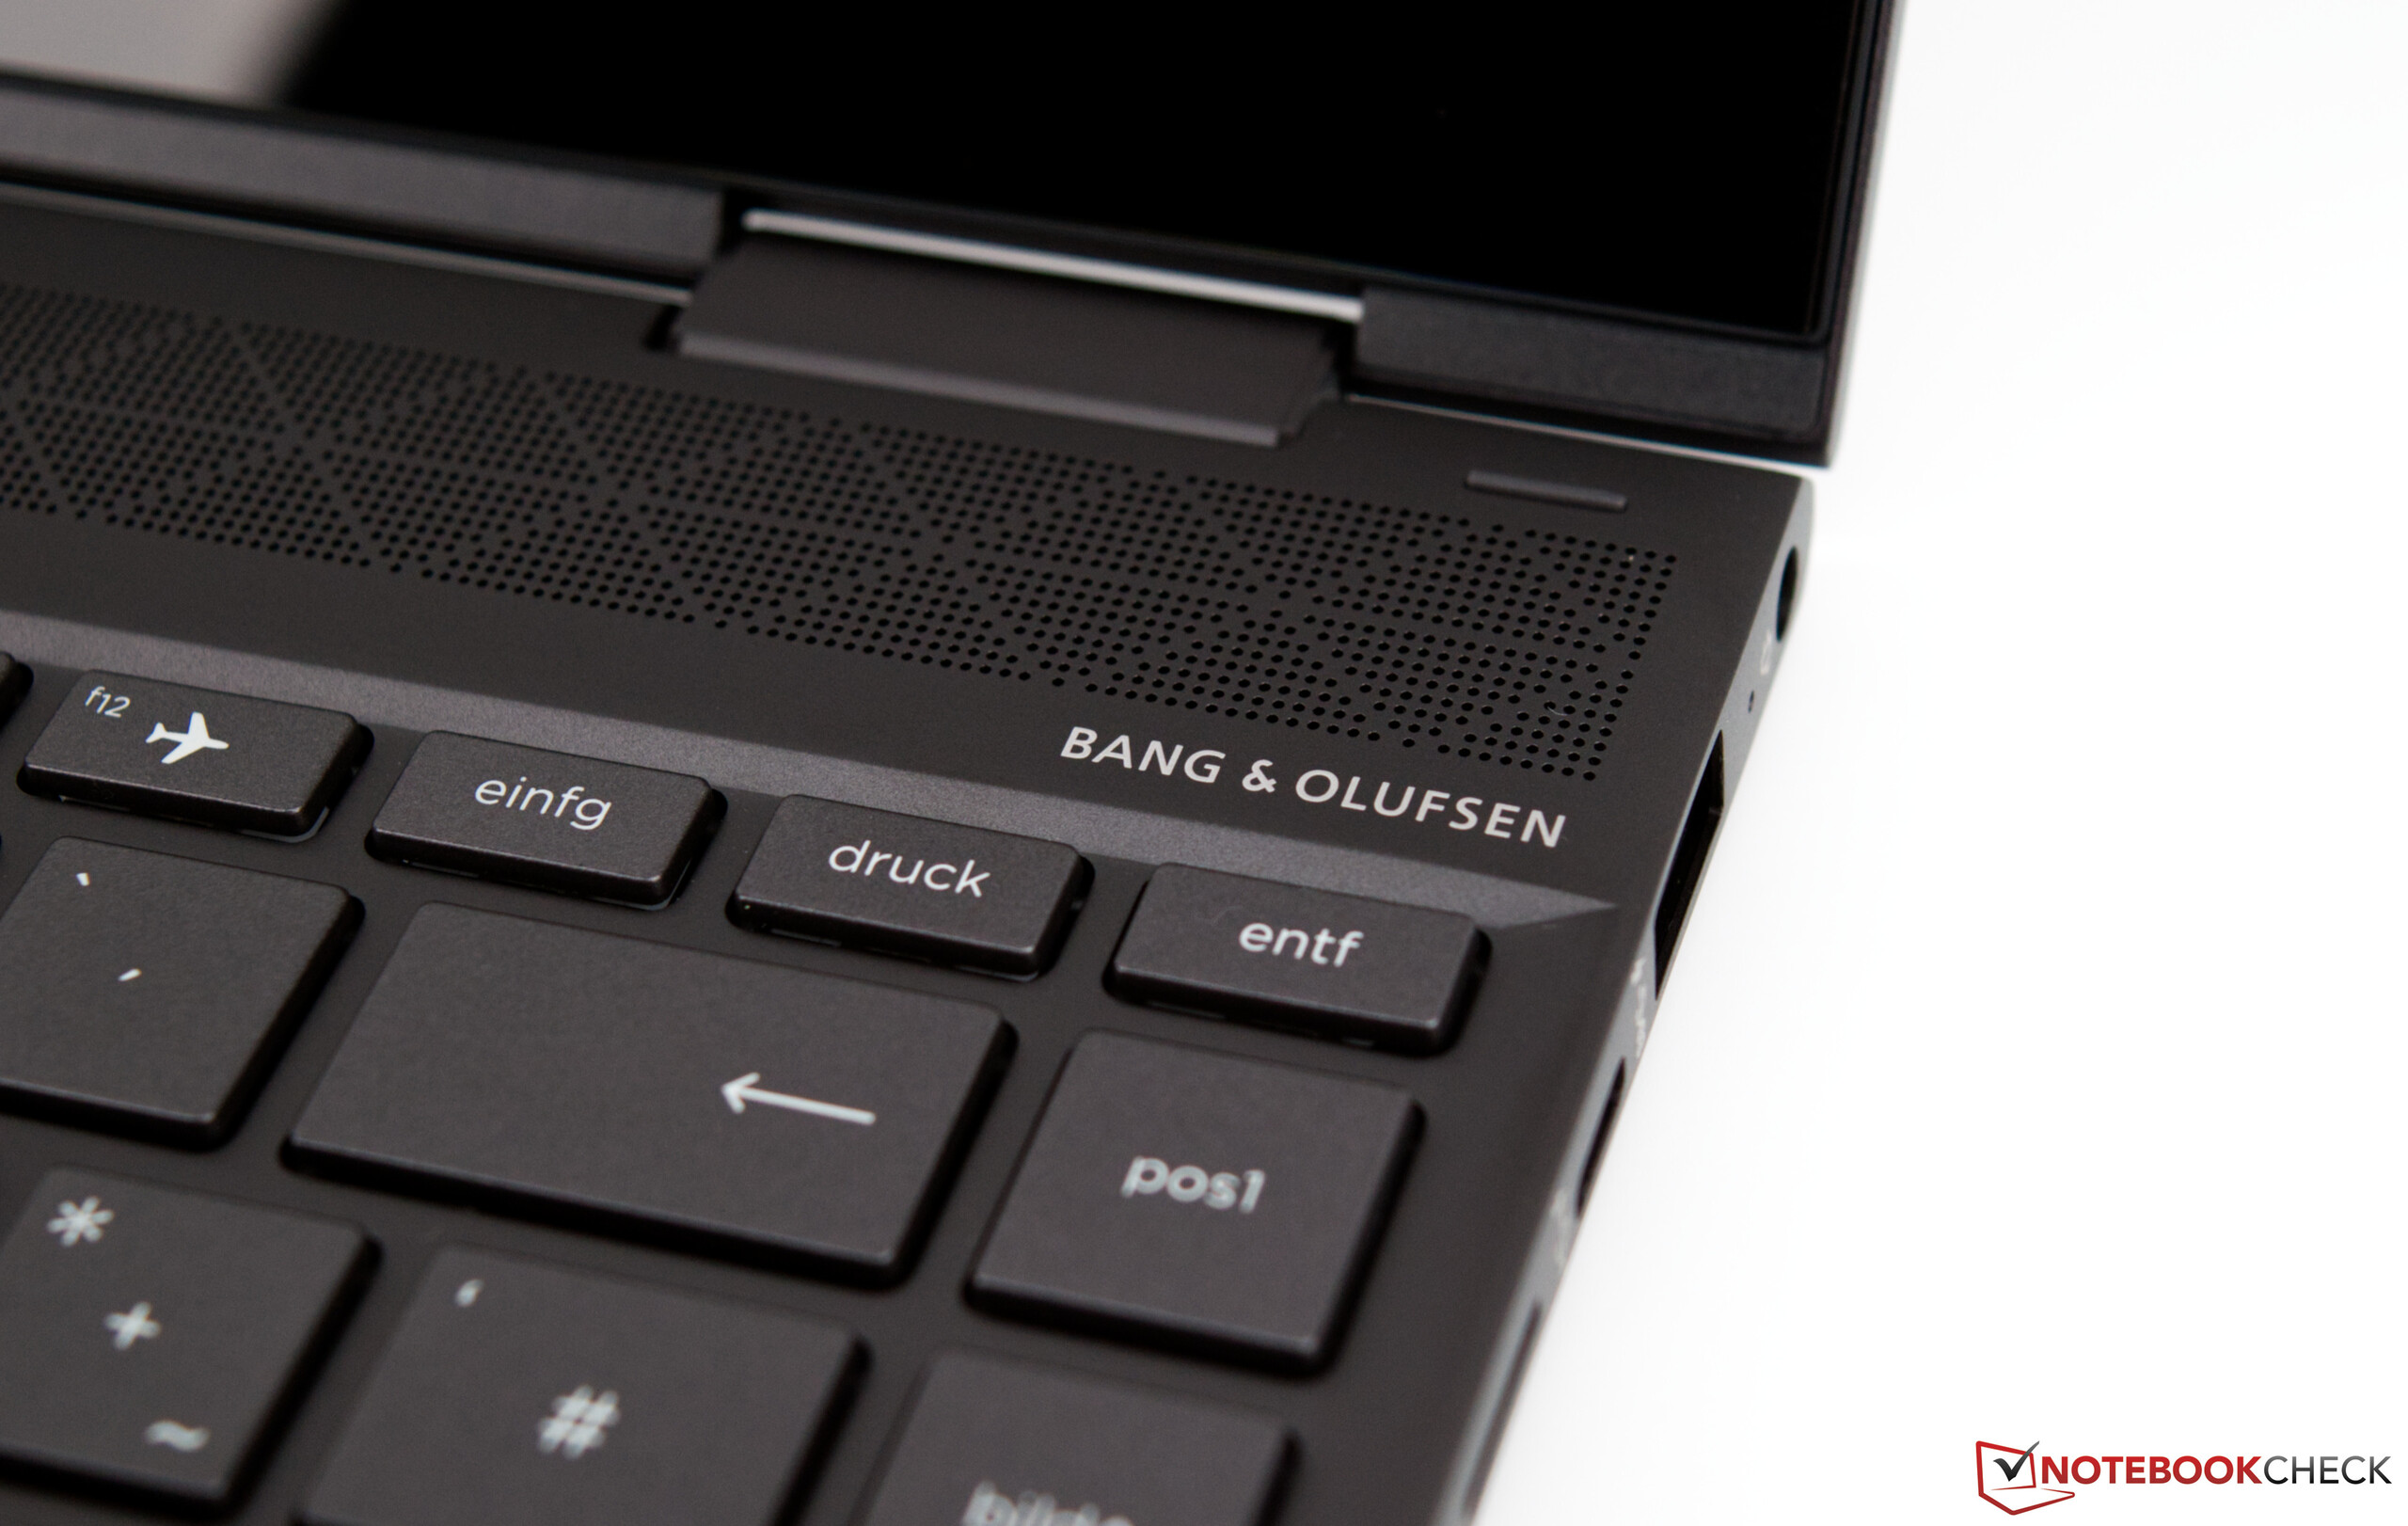
A boa eficiência energética e os alto-falantes utilizáveis devem ser notados positivamente. O conceito com quatro alto-falantes oferece uma boa experiência de audição, independentemente do modo usado (modo portátil, stand, tablet e tenda).
Infelizmente, o HP Envy x360 13 não conseguiu converter o baixo consumo de energia em uma longa duração da bateria. Uma boa duração de sete horas da bateria não vai durar até o fim de um dia de trabalho completo sem uma recarga.
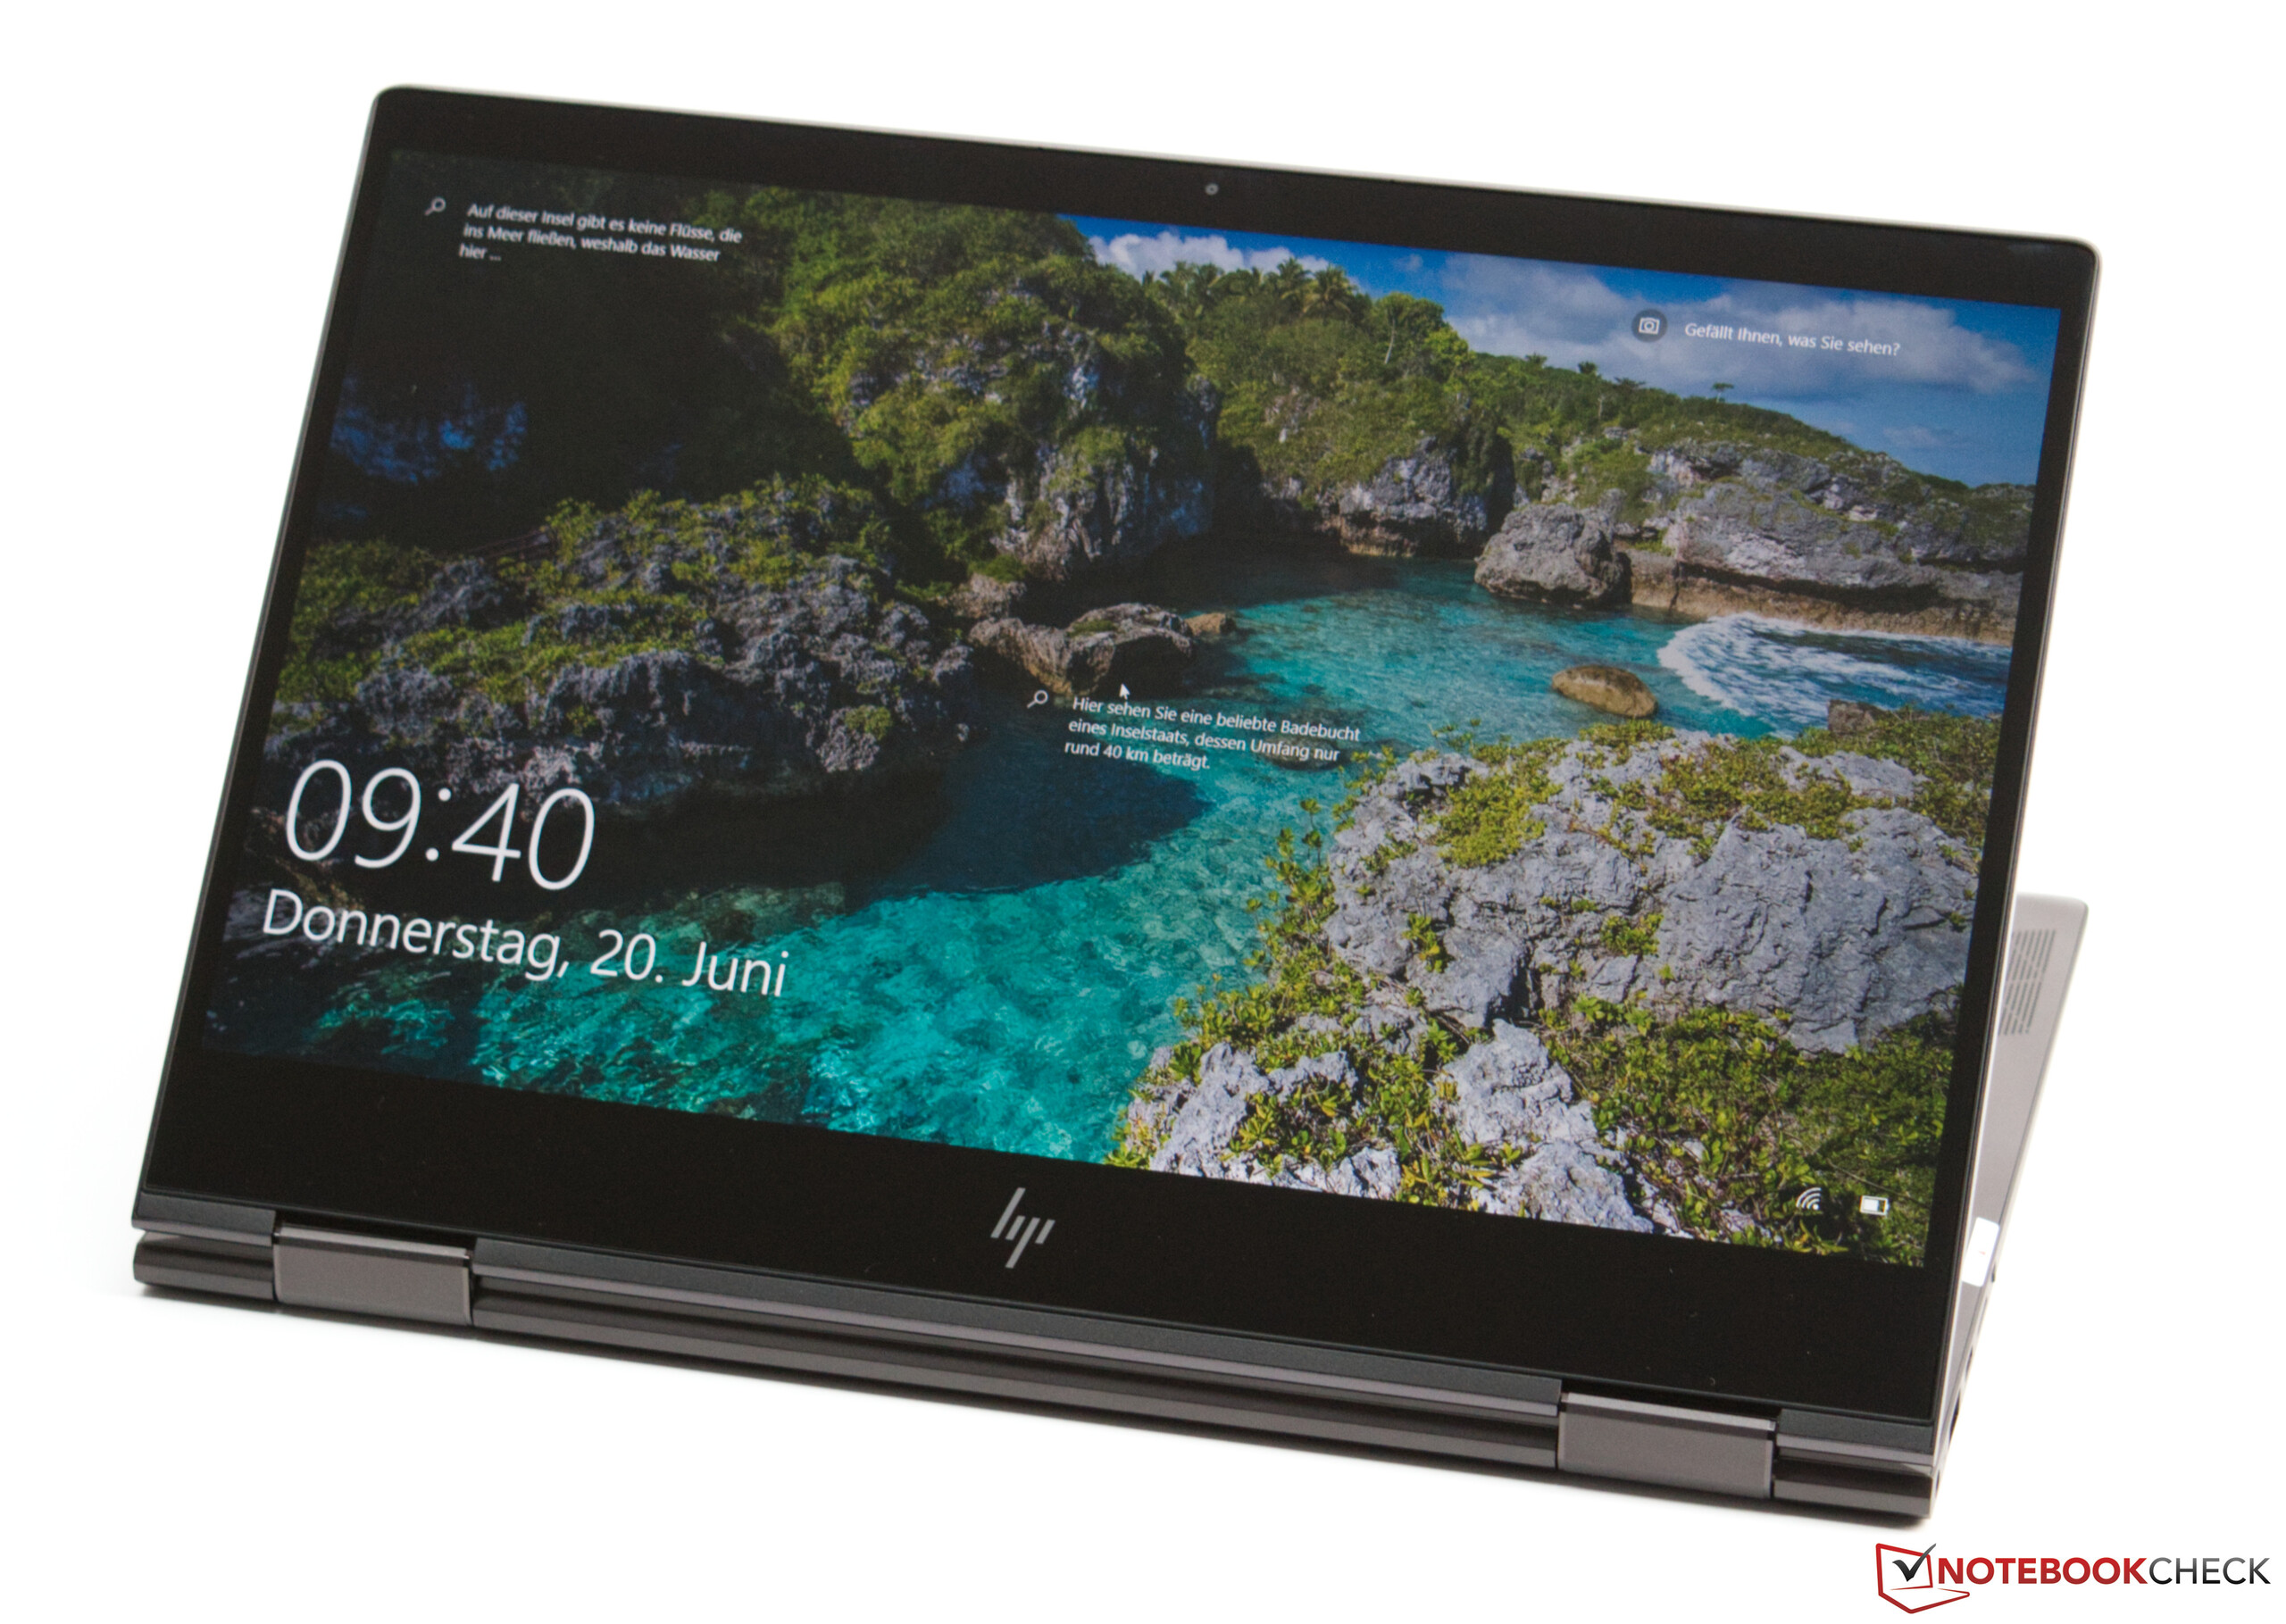
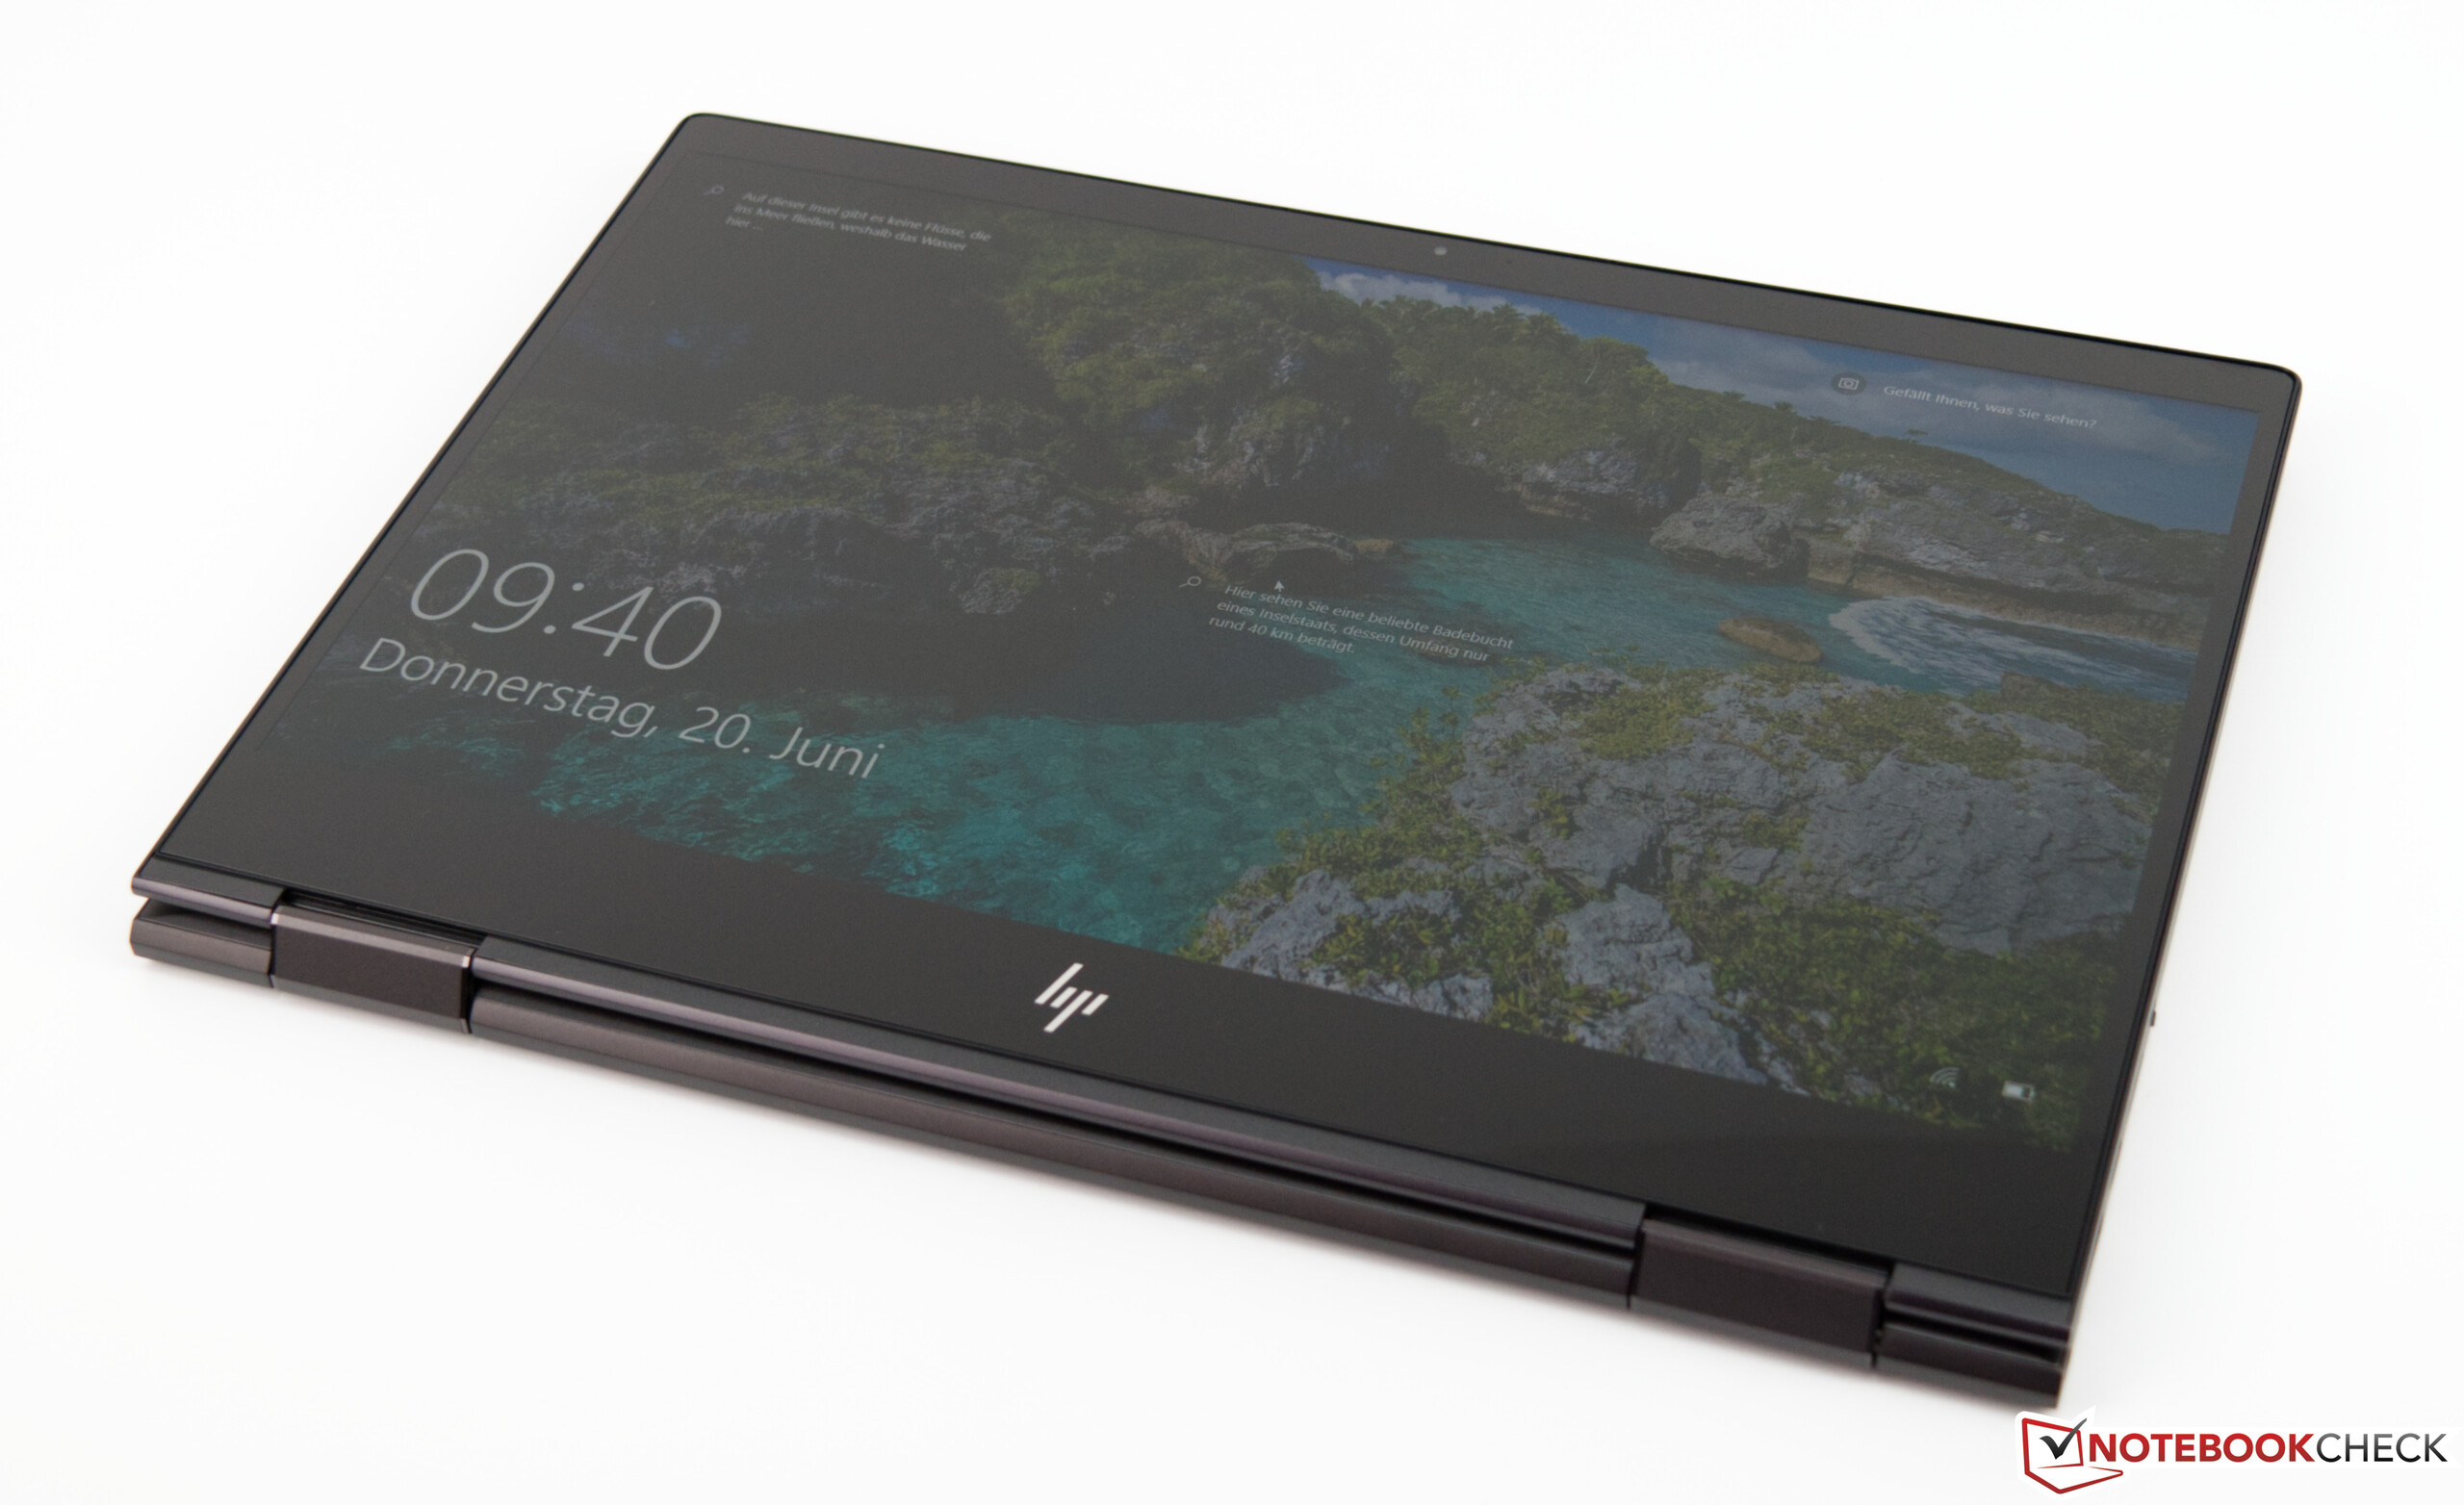
Uma das maiores surpresas no HP Envy x360 13 é a excelente tela que funciona a 120 Hz. Com seus valores de brilho muito bons e a tela de alto contraste, trabalhar no dispositivo é simplesmente divertido. Infelizmente, os usuários têm que esperar algumas limitações ao trabalharem em exteriores, já que a superfície de tela altamente refletiva tem seu preço, apesar do excelente brilho da tela. No entanto, a tela ainda merece uma reclamação, dado que não há suporte para uma caneta ativa no Envy x360 13.
Um conversível acessível com um processador AMD em combinação com uma boa tela, tudo isso é o que o HP Envy x360 13 oferece.
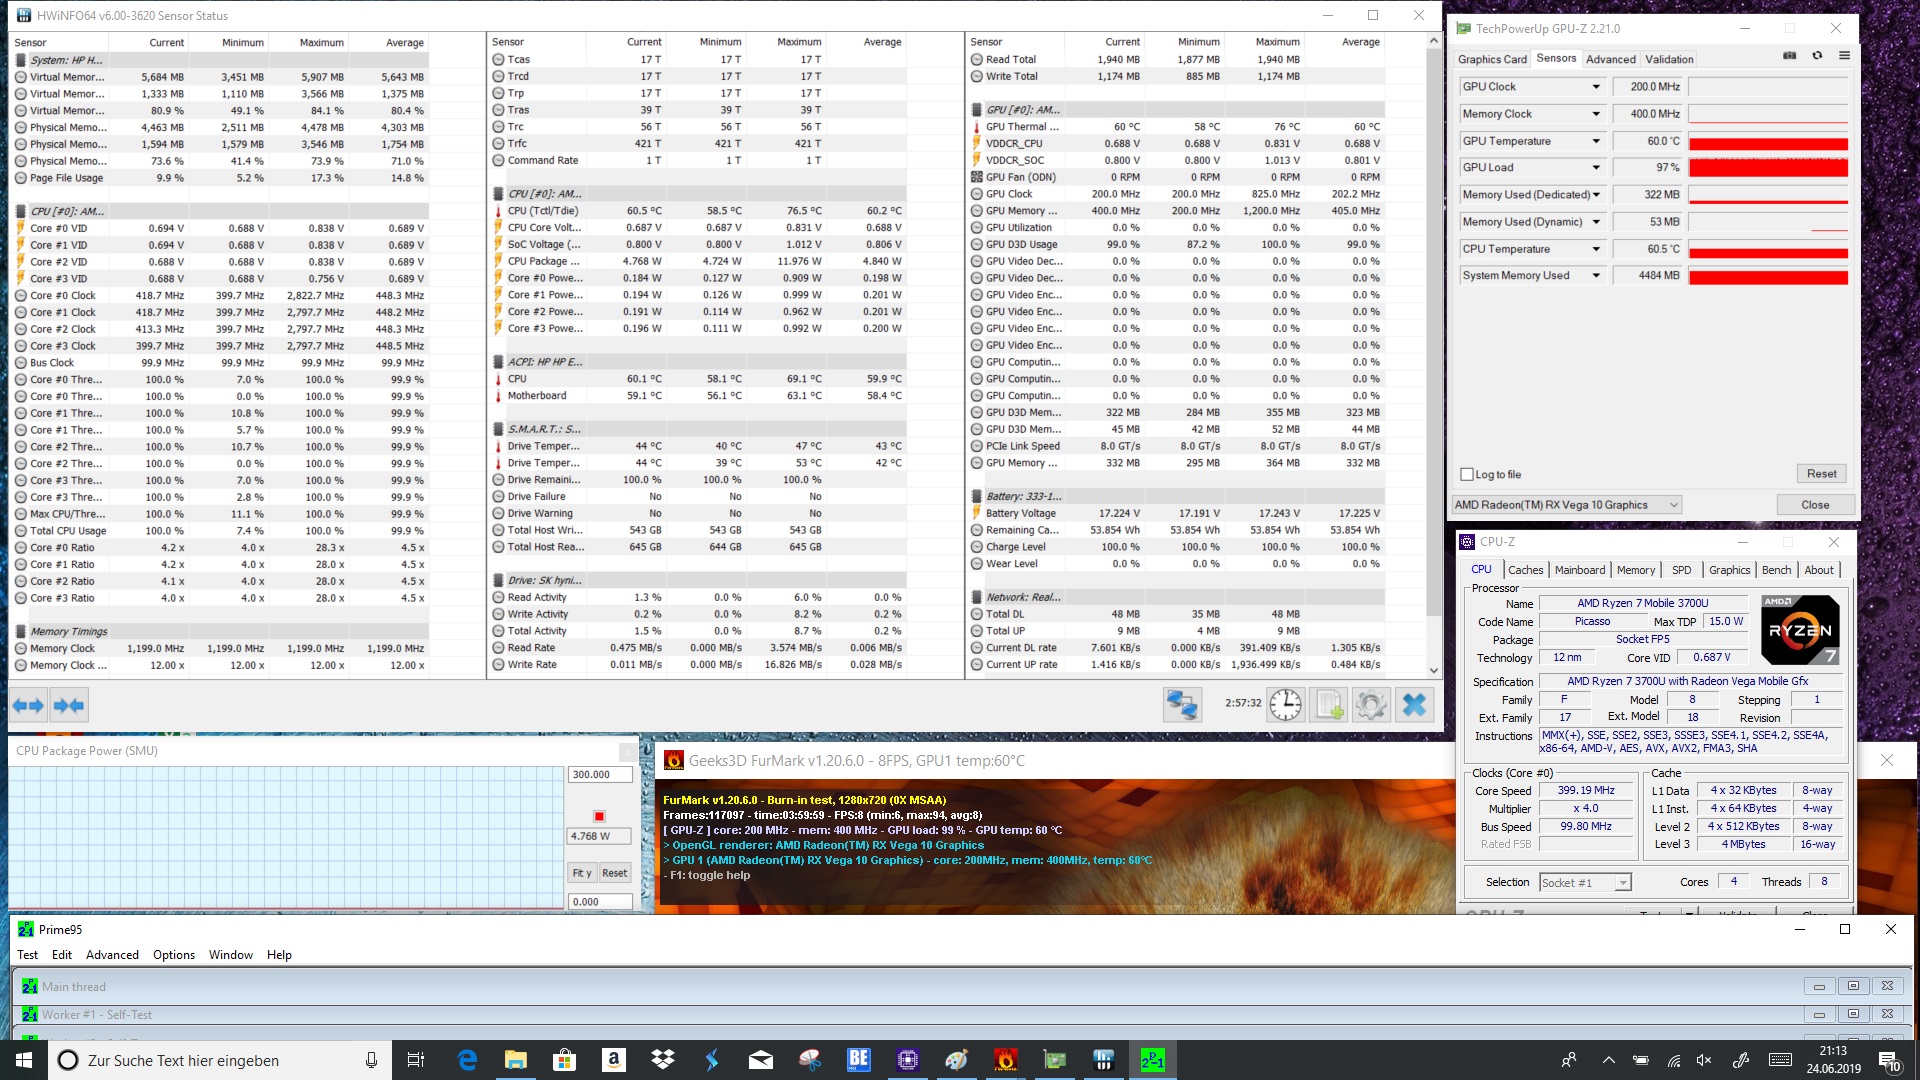
Uma das maiores desvantagem do HP Envy x360 13 é a APU AMD significante afogada sob uso intenso. Mas aqueles que não são dependentes de um alto desempenho constante estarão bem servidos com o AMD Ryzen 7 3700U.
O HP Envy x360 13 é um conversível acessível por menos de 1.000 Euros (~$ 1.138). Com sua AMD Ryzen 7 3700U e AMD Radeon RX Vega 10, o dispositivo 2-em-1 oferece um bom desempenho para tarefas do dia a dia. Você também pode jogar jogos antigos sem problemas com a iGPU do SoC AMD. Afinal, essa combinação oferece um melhor desempenho 3D do que um SoC atual da Intel.
Este dispositivo deixa uma boa impressão já a julgar pelo seu visual, parecendo muito moderno devido a seus marcos finos. Aqueles que se contentam sem uma infinidade de conexões estão bem servidos com as três conexões USB disponíveis. Por outro lado, também não nos queixaríamos de uma conexão Type-C com Thunderbolt. Mas pelo menos a conexão USB Tipo C convencional que está lá suporta DisplayPort. Isso é o mínimo que esperamos, já que não há conexões HDMI ou DisplayPort diretas.
A boa eficiência energética e os alto-falantes utilizáveis devem ser notados positivamente. O conceito com quatro alto-falantes oferece uma boa experiência de audição, independentemente do modo usado (modo portátil, stand, tablet e tenda).
Infelizmente, o HP Envy x360 13 não conseguiu converter o baixo consumo de energia em uma longa duração da bateria. Uma boa duração de sete horas da bateria não vai durar até o fim de um dia de trabalho completo sem uma recarga.
Uma das maiores surpresas no HP Envy x360 13 é a excelente tela que funciona a 120 Hz. Com seus valores de brilho muito bons e a tela de alto contraste, trabalhar no dispositivo é simplesmente divertido. Infelizmente, os usuários têm que esperar algumas limitações ao trabalharem em exteriores, já que a superfície de tela altamente refletiva tem seu preço, apesar do excelente brilho da tela. No entanto, a tela ainda merece uma reclamação, dado que não há suporte para uma caneta ativa no Envy x360 13.
Um conversível acessível com um processador AMD em combinação com uma boa tela, tudo isso é o que o HP Envy x360 13 oferece.
Uma das maiores desvantagem do HP Envy x360 13 é a APU AMD significante afogada sob uso intenso. Mas aqueles que não são dependentes de um alto desempenho constante estarão bem servidos com o AMD Ryzen 7 3700U.
HP Envy x360 13-ar0601ng
- 06/28/2019 v6 (old)
Sebastian Bade
Price comparison
