Breve Análise do Conversível Microsoft Surface Pro 6 (2018) (i5, 128 GB, 8 GB)
| SD Card Reader | |
| average JPG Copy Test (av. of 3 runs) | |
| Microsoft Surface Book 2 (Toshiba Exceria Pro SDXC 64 GB UHS-II) | |
| Dell Latitude 5290 2-in-1 (Toshiba Exceria Pro M501 UHS-II) | |
| Microsoft Surface Pro 6, Core i5, 128 GB (Toshiba Exceria Pro M501 microSDXC 64GB) | |
| Média da turma Convertible (28.1 - 197, n=23, últimos 2 anos) | |
| Microsoft Surface Pro (2017) i7 (Toshiba Exceria Pro M401 64 GB) | |
| maximum AS SSD Seq Read Test (1GB) | |
| Microsoft Surface Book 2 (Toshiba Exceria Pro SDXC 64 GB UHS-II) | |
| Dell Latitude 5290 2-in-1 (Toshiba Exceria Pro M501 UHS-II) | |
| Média da turma Convertible (28.9 - 254, n=22, últimos 2 anos) | |
| Microsoft Surface Pro (2017) i7 (Toshiba Exceria Pro M401 64 GB) | |
| Microsoft Surface Pro 6, Core i5, 128 GB (Toshiba Exceria Pro M501 microSDXC 64GB) | |
| |||||||||||||||||||||||||
iluminação: 83 %
iluminação com acumulador: 463 cd/m²
Contraste: 1447:1 (Preto: 0.32 cd/m²)
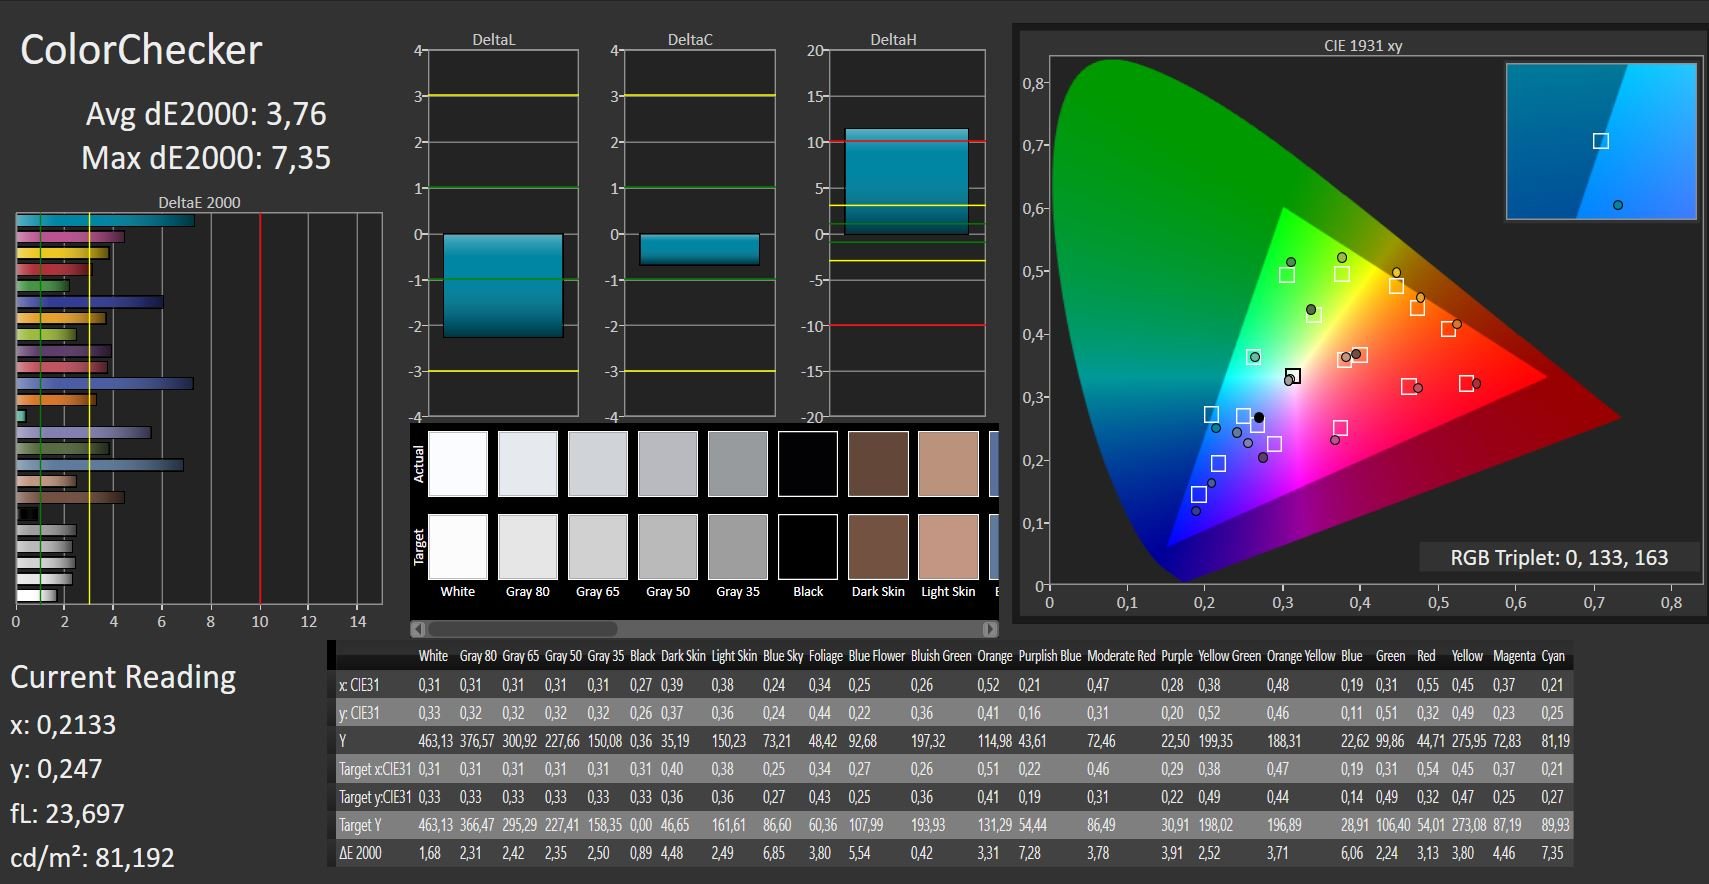
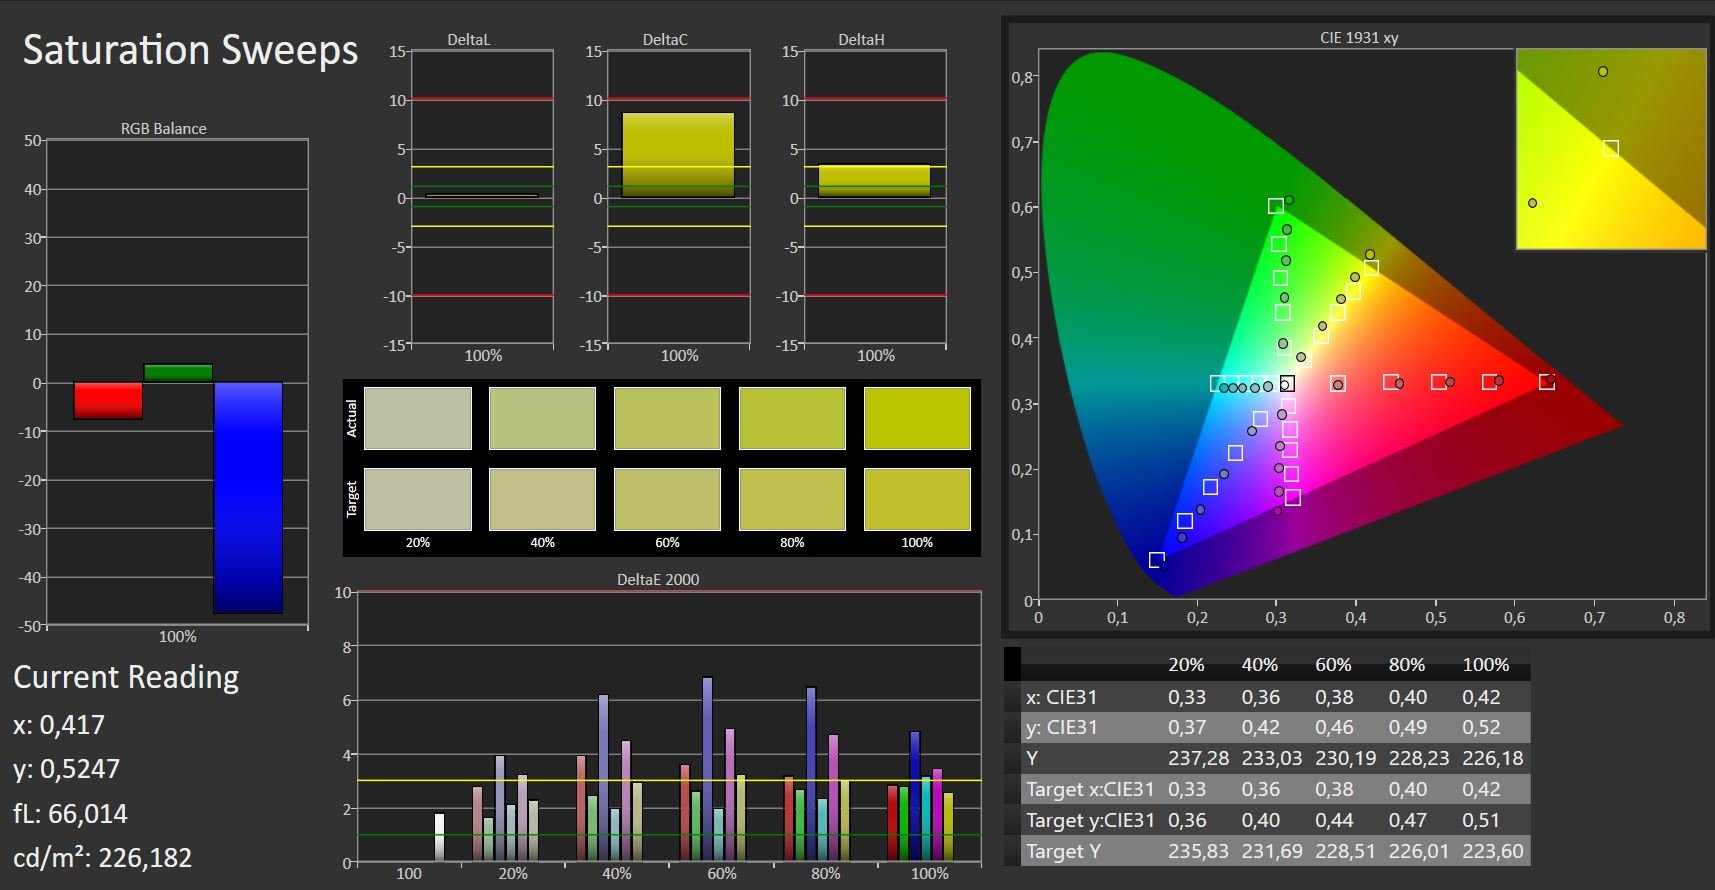
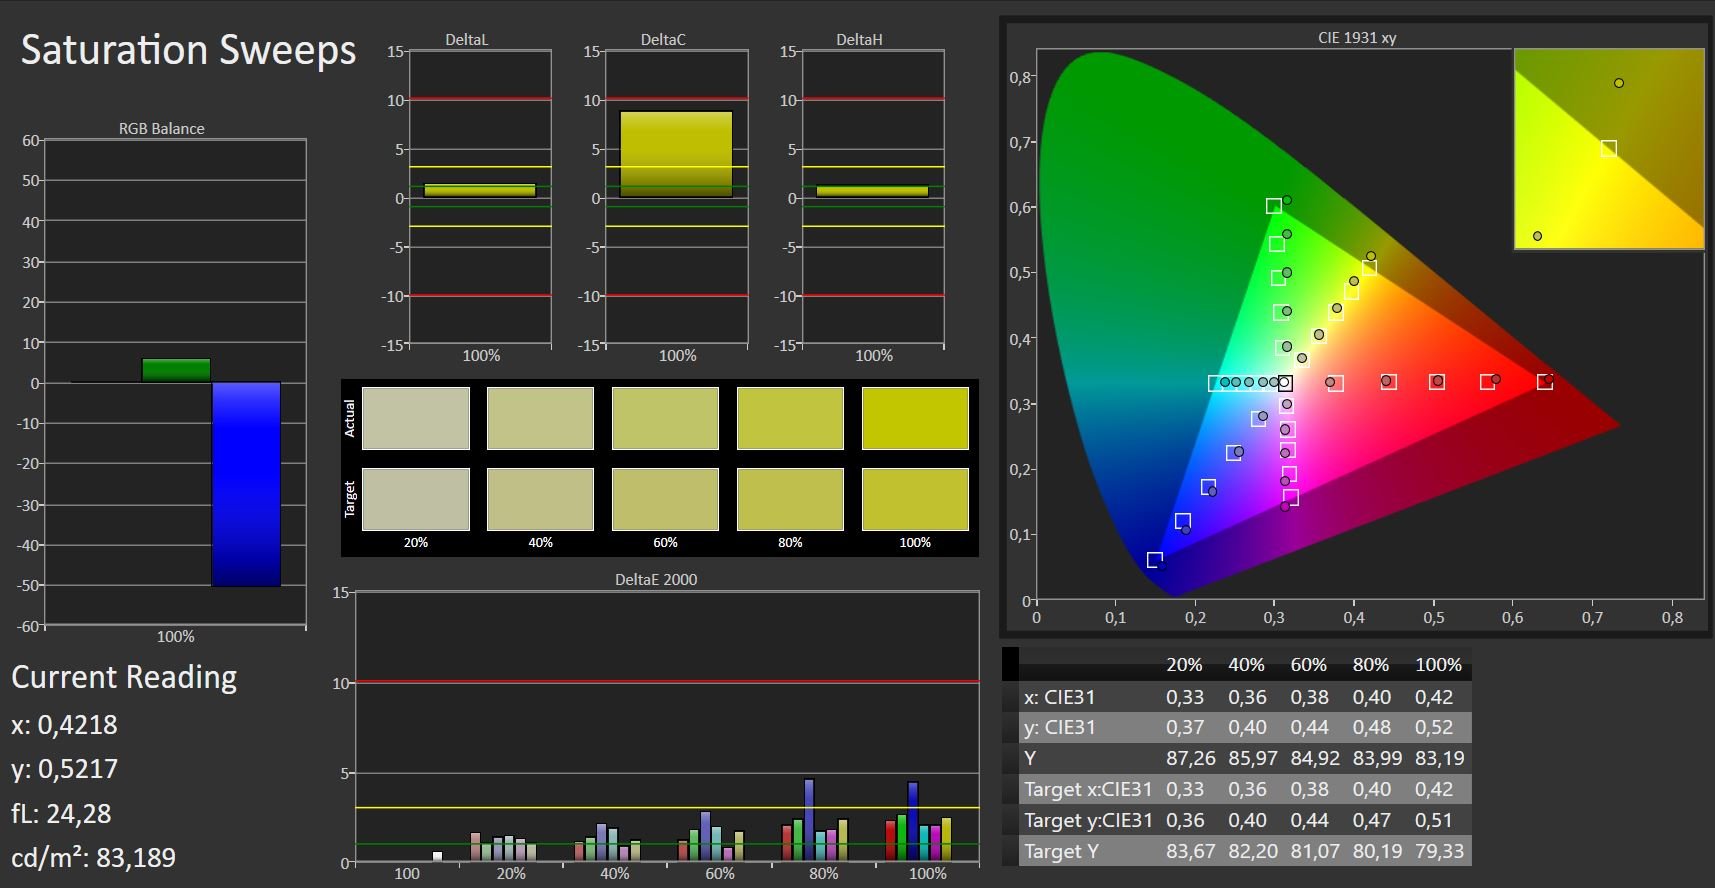
ΔE ColorChecker Calman: 3.76 | ∀{0.5-29.43 Ø4.72}
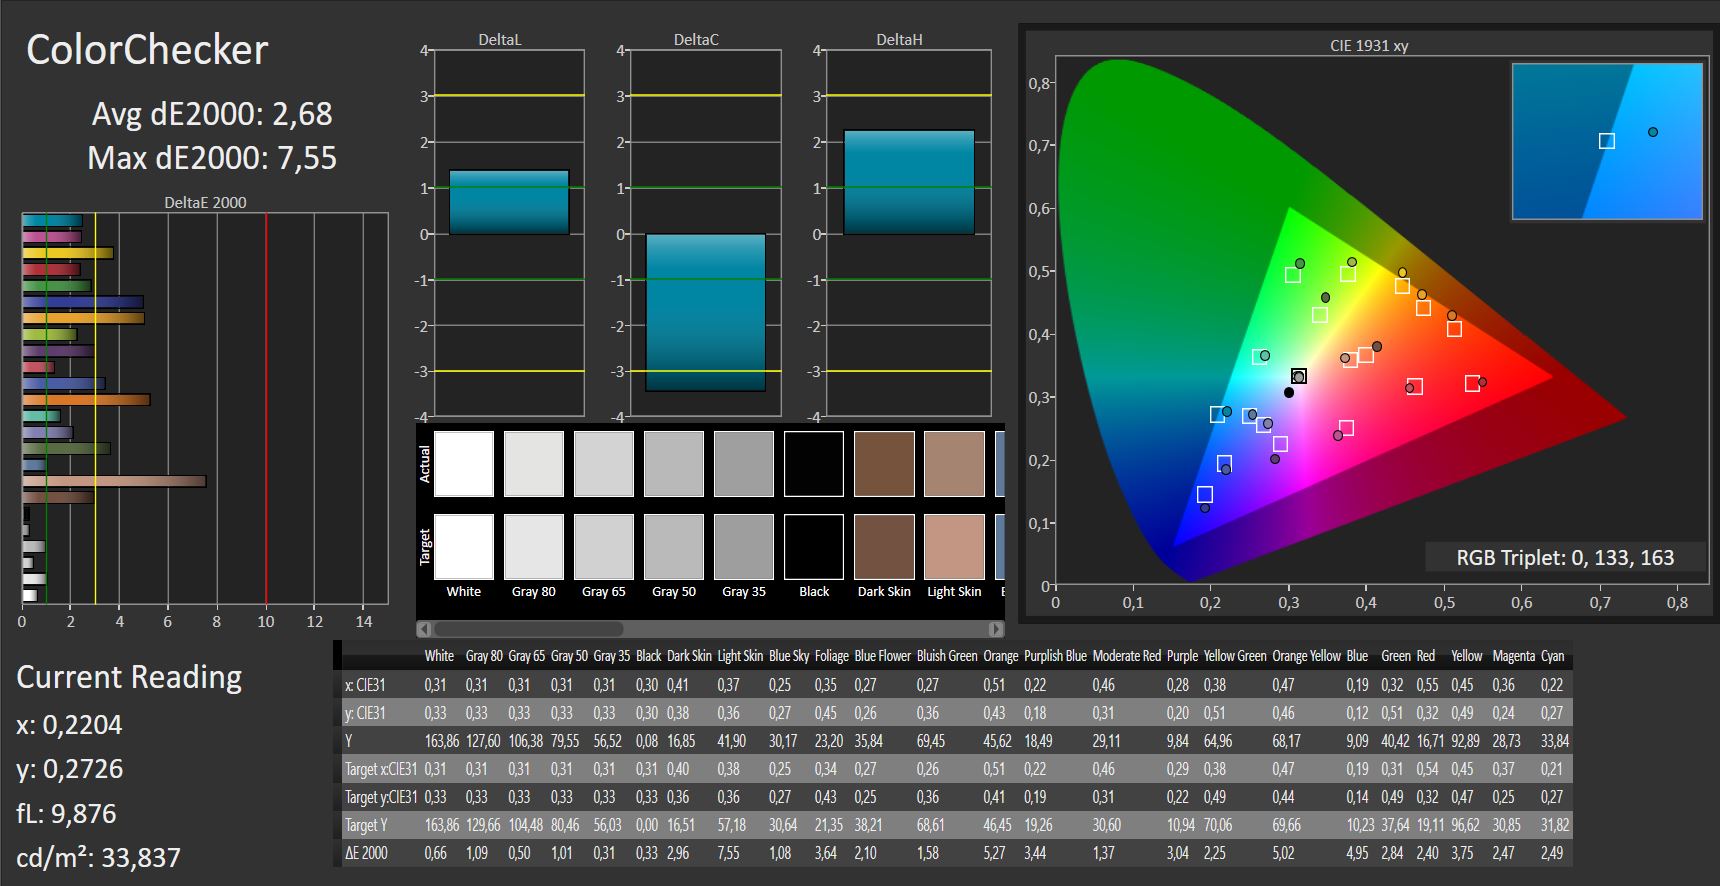
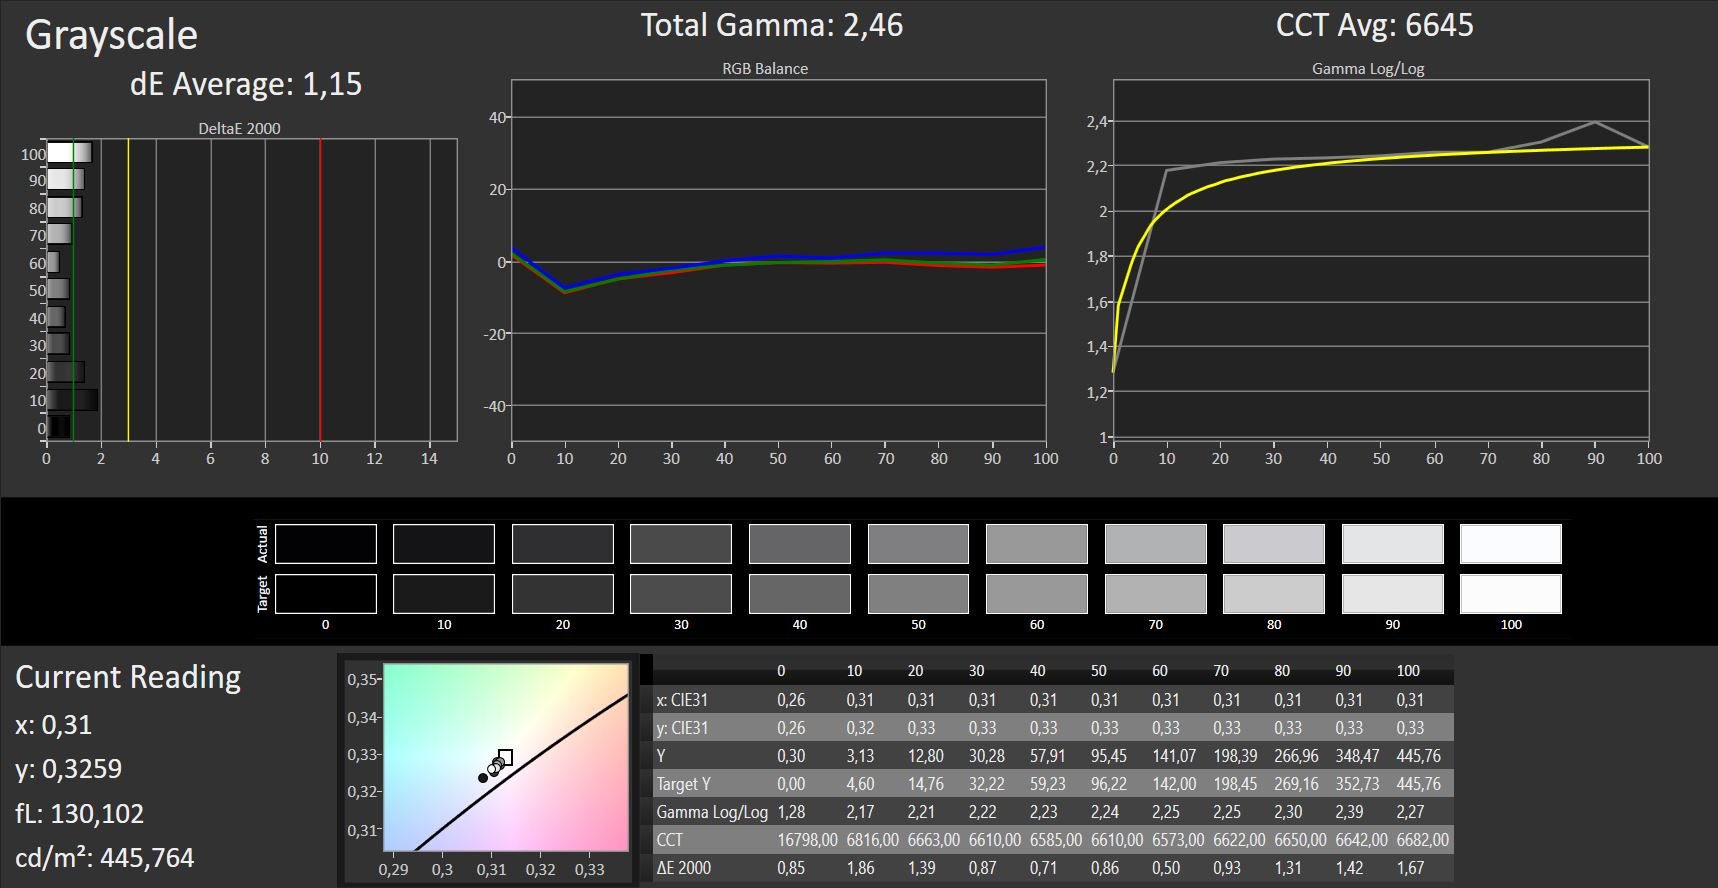
calibrated: 2.68
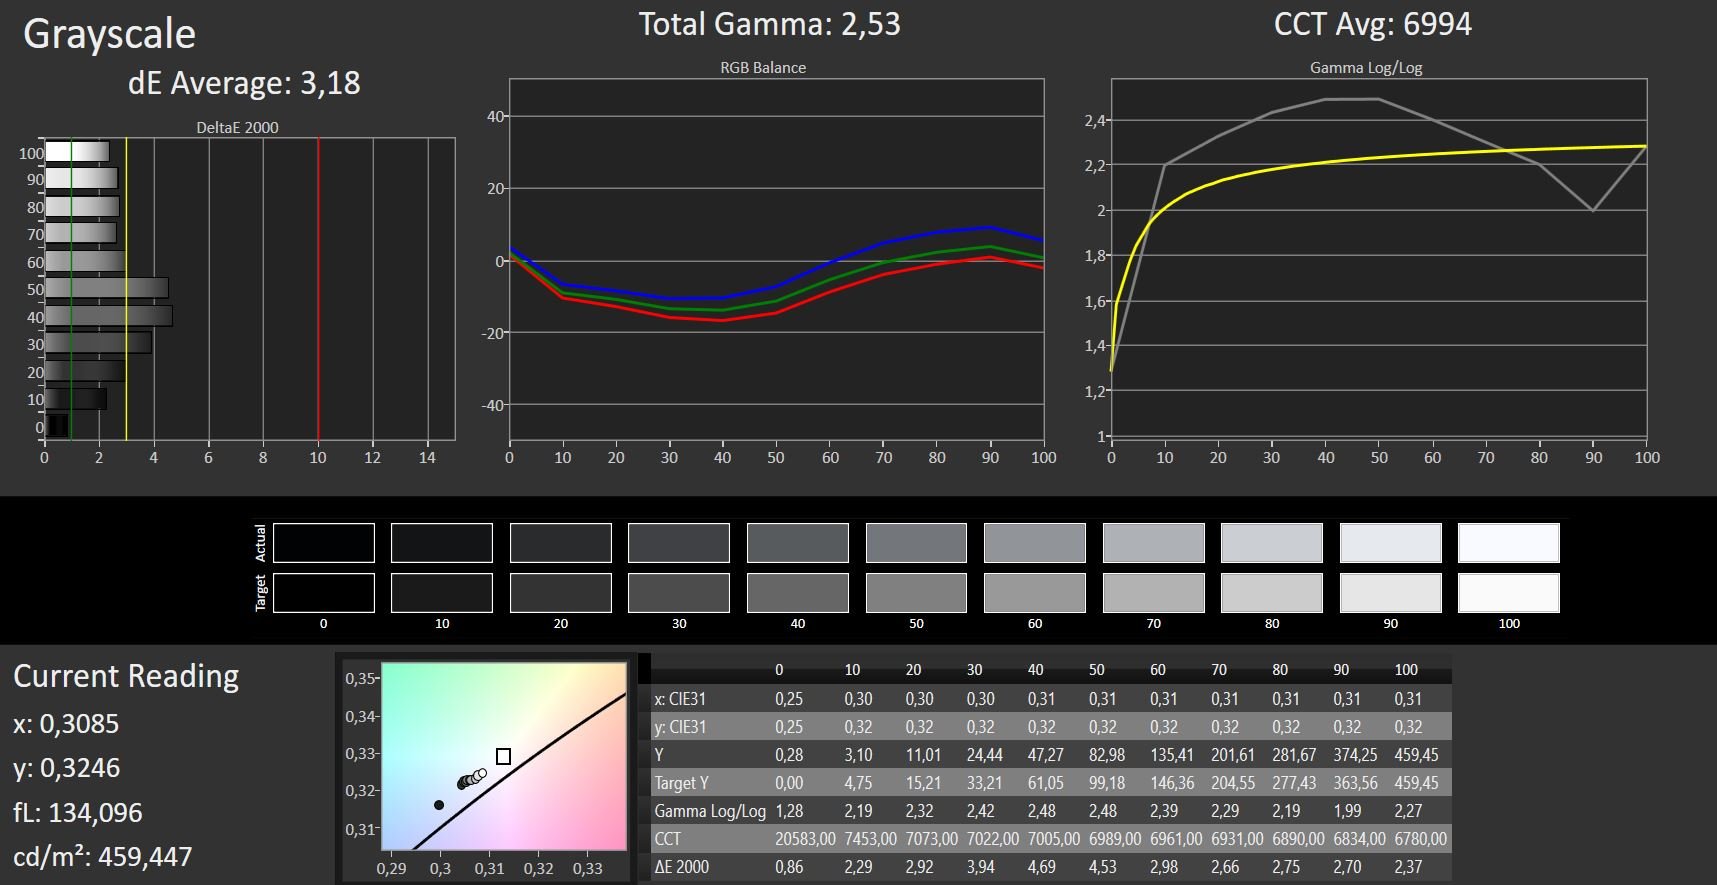
ΔE Greyscale Calman: 3.18 | ∀{0.09-98 Ø4.97}
90% sRGB (Argyll 1.6.3 3D)
59% AdobeRGB 1998 (Argyll 1.6.3 3D)
65.6% AdobeRGB 1998 (Argyll 3D)
90.4% sRGB (Argyll 3D)
65.5% Display P3 (Argyll 3D)
Gamma: 2.53
CCT: 6994 K
| Microsoft Surface Pro 6, Core i5, 128 GB LGPhilips LP123WQ112604, , 2736x1834, 12.3" | Microsoft Surface Pro (2017) i5 LG Display LP123WQ112604, , 2736x1824, 12.3" | Microsoft Surface Book 2 Panasonic MEI96A2 , , 3000x2000, 13.5" | Microsoft Surface Go MHN-00003 Sharp SHP14A6, , 1800x1200, 10" | Dell Latitude 5290 2-in-1 SHP1479, , 1920x1280, 12.3" | HP Elite x2 1013 G3-2TT14EA AU Optronics AUO101A, , 3000x2000, 13" | Lenovo ThinkPad X1 Tablet G3-20KJ001NGE LP130QP1-SPA1, , 3000x2000, 13" | Samsung Galaxy Book 12 SM-W728 Samsung SDCA029, , 2160x1440, 12" | Huawei Matebook E Chi Mei CMN7801, , 2160x1440, 12" | Lenovo Miix 520-12IKB 20M3000LGE Unbekannt, , 1920x1200, 12.2" | |
|---|---|---|---|---|---|---|---|---|---|---|
| Display | 6% | 5% | 4% | 9% | 5% | 7% | 16% | 21% | 1% | |
| Display P3 Coverage (%) | 65.5 | 67.6 3% | 67.9 4% | 66.5 2% | 70.5 8% | 67.5 3% | 68.1 4% 67.8 4% | 77.3 18% | 84.9 30% | 66.1 1% |
| sRGB Coverage (%) | 90.4 | 99 10% | 95.7 6% | 97.5 8% | 98.6 9% | 96.7 7% | 99.4 10% 99.1 10% | 92.8 3% | 99.8 10% | 91.6 1% |
| AdobeRGB 1998 Coverage (%) | 65.6 | 69.1 5% | 69.4 6% | 67.5 3% | 71.5 9% | 68.2 4% | 69.9 7% 69.3 6% | 83.1 27% | 79.9 22% | 66.7 2% |
| Response Times | -8% | -23% | -4% | -40% | -8% | -41% | 55% | 25% | 11% | |
| Response Time Grey 50% / Grey 80% * (ms) | 42 ? | 42 ? -0% | 52.8 ? -26% | 44 ? -5% | 56.8 ? -35% | 47 ? -12% | 47.2 ? -12% | 4 ? 90% | 26 ? 38% | 36 ? 14% |
| Response Time Black / White * (ms) | 25 ? | 29 ? -16% | 30 ? -20% | 25.6 ? -2% | 36 ? -44% | 26 ? -4% | 42.4 ? -70% | 20 ? 20% | 22 ? 12% | 23 ? 8% |
| PWM Frequency (Hz) | 20800 ? | 21000 | 1020 ? | 1852 ? | 250 ? | 200 ? | ||||
| Screen | 5% | 20% | 23% | -5% | -8% | 5% | 85% | -11% | -32% | |
| Brightness middle (cd/m²) | 463 | 417 -10% | 385 -17% | 456 -2% | 548 18% | 452 -2% | 474 2% | 376 -19% | 439 -5% | 384 -17% |
| Brightness (cd/m²) | 450 | 401 -11% | 372 -17% | 426 -5% | 545 21% | 412 -8% | 418 -7% | 378 -16% | 428 -5% | 355 -21% |
| Brightness Distribution (%) | 83 | 88 6% | 89 7% | 88 6% | 86 4% | 85 2% | 76 -8% | 91 10% | 92 11% | 80 -4% |
| Black Level * (cd/m²) | 0.32 | 0.29 9% | 0.21 34% | 0.31 3% | 0.51 -59% | 0.48 -50% | 0.33 -3% | 0.03 91% | 0.35 -9% | 0.56 -75% |
| Contrast (:1) | 1447 | 1438 -1% | 1833 27% | 1471 2% | 1075 -26% | 942 -35% | 1436 -1% | 12533 766% | 1254 -13% | 686 -53% |
| Colorchecker dE 2000 * | 3.76 | 3.63 3% | 1.6 57% | 1.3 65% | 3.65 3% | 4.05 -8% | 3.2 15% | 4.1 -9% | 5.17 -38% | 4.58 -22% |
| Colorchecker dE 2000 max. * | 7.35 | 6.74 8% | 4.5 39% | 3 59% | 7.15 3% | 6.64 10% | 6.1 17% | 6.45 12% | 7.68 -4% | 11.63 -58% |
| Colorchecker dE 2000 calibrated * | 2.68 | 1.1 59% | 1.81 32% | 1.56 42% | 0.9 66% | |||||
| Greyscale dE 2000 * | 3.18 | 2.18 31% | 1.5 53% | 1.4 56% | 5.5 -73% | 4.87 -53% | 4.5 -42% | 3.64 -14% | 5.69 -79% | 5.63 -77% |
| Gamma | 2.53 87% | 3.09 71% | 2.22 99% | 2.24 98% | 2.154 102% | 2.71 81% | 2.07 106% | 2.58 85% | 2.42 91% | 2.45 90% |
| CCT | 6994 93% | 6767 96% | 6502 100% | 6687 97% | 7052 92% | 7160 91% | 5881 111% | 7113 91% | 7999 81% | 7571 86% |
| Color Space (Percent of AdobeRGB 1998) (%) | 59 | 63 7% | 64 8% | 62.3 6% | 65.2 11% | 62 5% | 64 8% | 74 25% | 71 20% | 60 2% |
| Color Space (Percent of sRGB) (%) | 90 | 99 10% | 95.9 7% | 96.8 8% | 99.1 10% | 97 8% | 99.4 10% | 93 3% | 100 11% | 92 2% |
| Média Total (Programa/Configurações) | 1% /
4% | 1% /
11% | 8% /
16% | -12% /
-7% | -4% /
-6% | -10% /
1% | 52% /
67% | 12% /
0% | -7% /
-20% |
* ... menor é melhor
Exibir tempos de resposta
| ↔ Tempo de resposta preto para branco | ||
|---|---|---|
| 25 ms ... ascensão ↗ e queda ↘ combinadas | ↗ 14 ms ascensão | 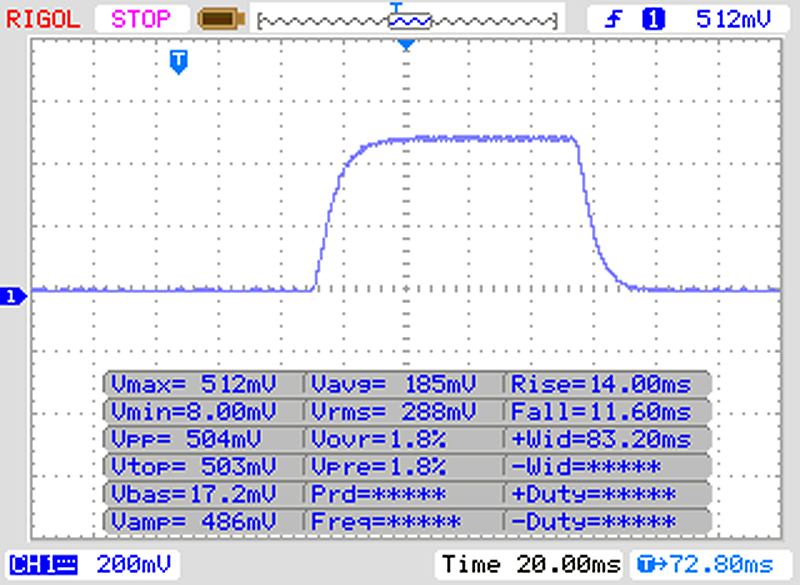 |
| ↘ 11 ms queda | ||
| A tela mostra taxas de resposta relativamente lentas em nossos testes e pode ser muito lenta para os jogadores. Em comparação, todos os dispositivos testados variam de 0.1 (mínimo) a 240 (máximo) ms. » 59 % de todos os dispositivos são melhores. Isso significa que o tempo de resposta medido é pior que a média de todos os dispositivos testados (19.9 ms). | ||
| ↔ Tempo de resposta 50% cinza a 80% cinza | ||
| 42 ms ... ascensão ↗ e queda ↘ combinadas | ↗ 22 ms ascensão | 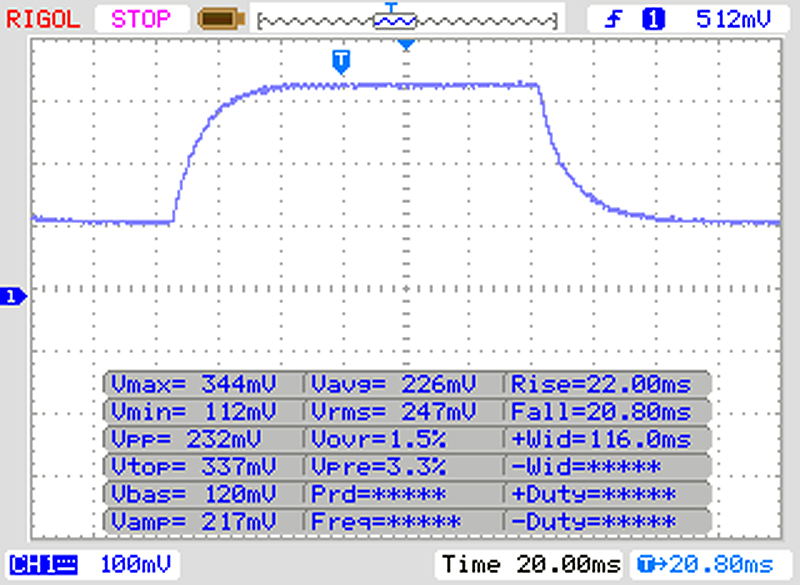 |
| ↘ 20 ms queda | ||
| A tela mostra taxas de resposta lentas em nossos testes e será insatisfatória para os jogadores. Em comparação, todos os dispositivos testados variam de 0.165 (mínimo) a 636 (máximo) ms. » 67 % de todos os dispositivos são melhores. Isso significa que o tempo de resposta medido é pior que a média de todos os dispositivos testados (31.1 ms). | ||
Cintilação da tela / PWM (modulação por largura de pulso)
| Tela tremeluzindo/PWM detectado | 20800 Hz | ≤ 50 % configuração de brilho | 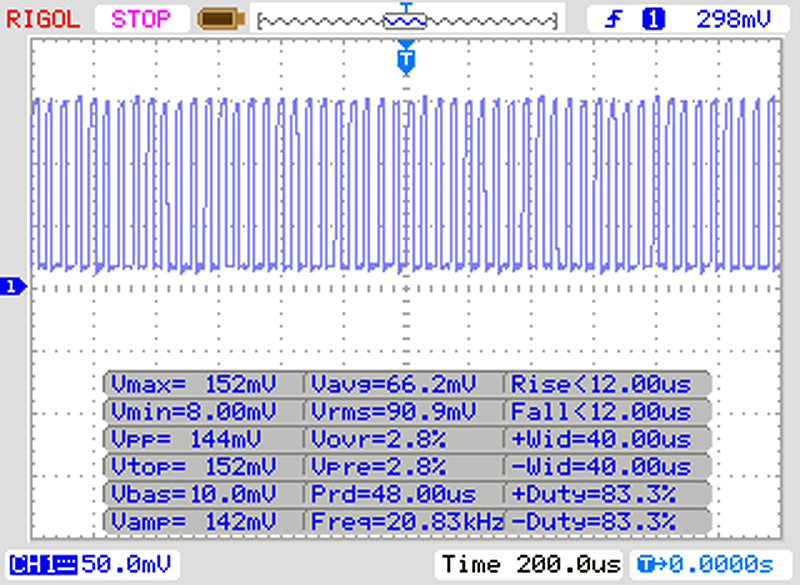 |
A luz de fundo da tela pisca em 20800 Hz (pior caso, por exemplo, utilizando PWM) Cintilação detectada em uma configuração de brilho de 50 % e abaixo. Não deve haver cintilação ou PWM acima desta configuração de brilho. A frequência de 20800 Hz é bastante alta, então a maioria dos usuários sensíveis ao PWM não deve notar nenhuma oscilação. [pwm_comparison] Em comparação: 52 % de todos os dispositivos testados não usam PWM para escurecer a tela. Se PWM foi detectado, uma média de 7784 (mínimo: 5 - máximo: 343500) Hz foi medida. | |||
| PCMark 8 Home Score Accelerated v2 | 3088 pontos | |
| PCMark 8 Creative Score Accelerated v2 | 4227 pontos | |
| PCMark 8 Work Score Accelerated v2 | 3970 pontos | |
| PCMark 10 Score | 3076 pontos | |
Ajuda | ||
| Microsoft Surface Pro 6, Core i5, 128 GB Toshiba KBG30ZPZ128G | Microsoft Surface Pro (2017) i5 Samsung PM971 KUS030202M | Microsoft Surface Pro 6, Core i7, 512 GB Toshiba KBG30ZPZ512G | Microsoft Surface Book 2 Samsung PM961 MZVLW256HEHP | Microsoft Surface Go MHN-00003 64 GB eMMC Flash | HP Elite x2 1013 G3-2TT14EA Samsung PM961 MZVLW256HEHP | Samsung Galaxy Book 12 SM-W728 Samsung SSD PM871a MZNLN256HMHQ | Huawei Matebook E SanDisk SD8SN8U256G1027 | Lenovo Miix 520-12IKB 20M3000LGE Samsung SSD PM961 1TB M.2 PCIe 3.0 x4 NVMe (MZVLW1T0) | Média Toshiba KBG30ZPZ128G | |
|---|---|---|---|---|---|---|---|---|---|---|
| CrystalDiskMark 3.0 | 240% | 212% | 202% | -39% | 312% | 148% | 106% | 336% | 0% | |
| Read Seq (MB/s) | 748 | 723 -3% | 651 -13% | 1370 83% | 259.6 -65% | 1786 139% | 511 -32% | 506 -32% | 883 18% | 748 ? 0% |
| Write Seq (MB/s) | 127.6 | 853 568% | 792 521% | 341.2 167% | 122.4 -4% | 1209 847% | 473.7 271% | 461 261% | 932 630% | 127.6 ? 0% |
| Read 512 (MB/s) | 385.3 | 225 -42% | 388.2 1% | 654 70% | 190.6 -51% | 717 86% | 443.7 15% | 341.9 -11% | 586 52% | 385 ? 0% |
| Write 512 (MB/s) | 115.8 | 445 284% | 575 397% | 337.9 192% | 107.1 -8% | 798 589% | 395.4 241% | 294.7 154% | 627 441% | 115.8 ? 0% |
| Read 4k (MB/s) | 29.93 | 46 54% | 43.75 46% | 43.64 46% | 19.06 -36% | 49.66 66% | 40.46 35% | 32.46 8% | 54.8 83% | 29.9 ? 0% |
| Write 4k (MB/s) | 39.77 | 125 214% | 97.2 144% | 148.5 273% | 24.27 -39% | 104.2 162% | 91.9 131% | 65.3 64% | 139.3 250% | 39.8 ? 0% |
| Read 4k QD32 (MB/s) | 192.7 | 423 120% | 241.2 25% | 465.5 142% | 34.45 -82% | 286 48% | 289.1 50% | 381.8 98% | 607 215% | 192.7 ? 0% |
| Write 4k QD32 (MB/s) | 45.38 | 373 722% | 304.9 572% | 337.1 643% | 33.64 -26% | 298.4 558% | 260.7 474% | 184.4 306% | 498.5 999% | 45.4 ? 0% |

| 3DMark 11 Performance | 2048 pontos | |
| 3DMark Cloud Gate Standard Score | 8748 pontos | |
Ajuda | ||
| Thief - 1024x768 Very Low Preset | |
| Microsoft Surface Pro 6, Core i7, 512 GB | |
| Média Intel UHD Graphics 620 (16.3 - 34.3, n=10) | |
| Microsoft Surface Pro 6, Core i5, 128 GB | |
| Microsoft Surface Pro (2017) i5 | |
| Civilization 6 - 1024x768 Minimum Preset | |
| Microsoft Surface Pro 6, Core i7, 512 GB | |
| Microsoft Surface Pro 6, Core i5, 128 GB | |
| Média Intel UHD Graphics 620 (27.8 - 54.4, n=13) | |
| Farming Simulator 17 - 1366x768 Medium Preset | |
| Microsoft Surface Pro 6, Core i7, 512 GB | |
| Média Intel UHD Graphics 620 (8 - 67.9, n=12) | |
| Microsoft Surface Pro 6, Core i5, 128 GB | |
| Samsung Galaxy Book 12 SM-W728 | |
| Middle-earth: Shadow of War - 1280x720 Lowest Preset | |
| Microsoft Surface Pro 6, Core i7, 512 GB | |
| Média Intel UHD Graphics 620 (18 - 23, n=3) | |
| Microsoft Surface Pro 6, Core i5, 128 GB | |
| F1 2018 - 1280x720 Ultra Low Preset | |
| Microsoft Surface Pro 6, Core i5, 128 GB | |
| Média Intel UHD Graphics 620 (31 - 35.8, n=5) | |
| Microsoft Surface Pro 6, Core i7, 512 GB | |
| Shadow of the Tomb Raider - 1280x720 Lowest Preset | |
| Média da turma Convertible (24 - 180, n=2, últimos 2 anos) | |
| Microsoft Surface Pro 6, Core i5, 128 GB | |
| Microsoft Surface Pro 6, Core i7, 512 GB | |
| Média Intel UHD Graphics 620 (12 - 21.7, n=13) | |
| baixo | média | alto | ultra | |
|---|---|---|---|---|
| BioShock Infinite (2013) | 70.2 | 38 | 31.9 | 8.6 |
| Thief (2014) | 23.7 | 10.4 | 8.5 | |
| Dota 2 Reborn (2015) | 72.9 | 46.3 | 20.6 | 18.3 |
| Rise of the Tomb Raider (2016) | 14.1 | 8.9 | ||
| Civilization 6 (2016) | 38.8 | 14.1 | 5.9 | |
| Farming Simulator 17 (2016) | 58.1 | 47.8 | 19 | |
| Middle-earth: Shadow of War (2017) | 18 | 10 | ||
| X-Plane 11.11 (2018) | 30.3 | 22.7 | 19.1 | |
| F1 2018 (2018) | 35.8 | 11 | 9 | 4 |
| Shadow of the Tomb Raider (2018) | 21.7 | 5.4 |
(+) A temperatura máxima no lado superior é 39.7 °C / 103 F, em comparação com a média de 35.4 °C / 96 F , variando de 19.6 a 60 °C para a classe Convertible.
(±) A parte inferior aquece até um máximo de 41.1 °C / 106 F, em comparação com a média de 36.9 °C / 98 F
(+) Em uso inativo, a temperatura média para o lado superior é 31.2 °C / 88 F, em comparação com a média do dispositivo de 30.3 °C / ### class_avg_f### F.
(±) Os apoios para as mãos e o touchpad podem ficar muito quentes ao toque, com um máximo de 39.1 °C / 102.4 F.
(-) A temperatura média da área do apoio para as mãos de dispositivos semelhantes foi 28 °C / 82.4 F (-11.1 °C / -20 F).
| desligado | |
| Ocioso | |
| Carga |
|
Key:
min: | |
| Microsoft Surface Pro 6, Core i5, 128 GB i5-8250U, UHD Graphics 620, Toshiba KBG30ZPZ128G, IPS, 2736x1834, 12.3" | Microsoft Surface Pro (2017) i5 i5-7300U, HD Graphics 620, Samsung PM971 KUS030202M, IPS, 2736x1824, 12.3" | Microsoft Surface Pro 6, Core i7, 512 GB i7-8650U, UHD Graphics 620, Toshiba KBG30ZPZ512G, IPS, 2736x1824, 12.3" | Microsoft Surface Book 2 i7-8650U, GeForce GTX 1050 Mobile, Samsung PM961 MZVLW256HEHP, IPS, 3000x2000, 13.5" | Microsoft Surface Go MHN-00003 Pentium 4415Y, UHD Graphics 615, 64 GB eMMC Flash, IPS, 1800x1200, 10" | Dell Latitude 5290 2-in-1 i5-8350U, UHD Graphics 620, Toshiba XG5 KXG50ZNV256G, IPS, 1920x1280, 12.3" | HP Elite x2 1013 G3-2TT14EA i5-8350U, UHD Graphics 620, Samsung PM961 MZVLW256HEHP, IPS, 3000x2000, 13" | Samsung Galaxy Book 12 SM-W728 i5-7200U, HD Graphics 620, Samsung SSD PM871a MZNLN256HMHQ, Super AMOLED, 2160x1440, 12" | Huawei Matebook E i5-7Y54, HD Graphics 615, SanDisk SD8SN8U256G1027, IPS, 2160x1440, 12" | Lenovo Miix 520-12IKB 20M3000LGE i5-8550U, UHD Graphics 620, Samsung SSD PM961 1TB M.2 PCIe 3.0 x4 NVMe (MZVLW1T0), IPS, 1920x1200, 12.2" | Média Intel UHD Graphics 620 | Média da turma Convertible | |
|---|---|---|---|---|---|---|---|---|---|---|---|---|
| Power Consumption | 12% | -3% | -94% | 33% | -3% | -13% | -2% | 14% | 4% | -7% | -28% | |
| Idle Minimum * (Watt) | 4.3 | 3.6 16% | 3.2 26% | 4.7 -9% | 2.88 33% | 3 30% | 4.9 -14% | 3.9 9% | 3.9 9% | 3.9 9% | 3.81 ? 11% | 4.24 ? 1% |
| Idle Average * (Watt) | 8.7 | 8.1 7% | 8.7 -0% | 10.6 -22% | 4.8 45% | 7.2 17% | 8.9 -2% | 9 -3% | 8.8 -1% | 8.2 6% | 6.94 ? 20% | 7.03 ? 19% |
| Idle Maximum * (Watt) | 9.4 | 8.7 7% | 10.4 -11% | 12.3 -31% | 7.5 20% | 10 -6% | 11 -17% | 11.9 -27% | 8.9 5% | 8.4 11% | 8.75 ? 7% | 8.61 ? 8% |
| Load Average * (Watt) | 24.5 | 25.5 -4% | 29.2 -19% | 81 -231% | 16.9 31% | 37.1 -51% | 32 -31% | 27.3 -11% | 20 18% | 25.2 -3% | 35 ? -43% | 43.9 ? -79% |
| Load Maximum * (Watt) | 36 | 23.5 35% | 40.8 -13% | 100.3 -179% | 23.8 34% | 38.2 -6% | 36 -0% | 27.9 23% | 21.8 39% | 37 -3% | 47.5 ? -32% | 67.2 ? -87% |
| Witcher 3 ultra * (Watt) | 97 |
* ... menor é melhor
| Microsoft Surface Pro 6, Core i5, 128 GB i5-8250U, UHD Graphics 620, 45 Wh | Microsoft Surface Pro (2017) i5 i5-7300U, HD Graphics 620, 45 Wh | Microsoft Surface Pro 6, Core i7, 512 GB i7-8650U, UHD Graphics 620, 45 Wh | Microsoft Surface Book 2 i7-8650U, GeForce GTX 1050 Mobile, 75 Wh | Microsoft Surface Go MHN-00003 Pentium 4415Y, UHD Graphics 615, 28 Wh | Dell Latitude 5290 2-in-1 i5-8350U, UHD Graphics 620, 42 Wh | HP Elite x2 1013 G3-2TT14EA i5-8350U, UHD Graphics 620, 50 Wh | Samsung Galaxy Book 12 SM-W728 i5-7200U, HD Graphics 620, 39 Wh | Huawei Matebook E i5-7Y54, HD Graphics 615, 33.7 Wh | Lenovo Miix 520-12IKB 20M3000LGE i5-8550U, UHD Graphics 620, 38 Wh | Média da turma Convertible | |
|---|---|---|---|---|---|---|---|---|---|---|---|
| Duração da bateria | 25% | 2% | 40% | 1% | -38% | -9% | -3% | -25% | -38% | 26% | |
| Reader / Idle (h) | 17.8 | 17.6 -1% | 18.1 2% | 24.5 38% | 12.9 -28% | 13 -27% | 17.2 -3% | 27.7 ? 56% | |||
| WiFi v1.3 (h) | 9.1 | 12.4 36% | 8.5 -7% | 11.1 22% | 7.5 -18% | 5 -45% | 7.7 -15% | 6.8 -25% | 5.6 -38% | 12.1 ? 33% | |
| Load (h) | 2 | 2.8 40% | 2.2 10% | 3.2 60% | 3 50% | 1.4 -30% | 2.3 15% | 1.779 ? -11% | |||
| H.264 (h) | 15.6 | 6.4 | 6.5 | 6.8 | 15.3 ? | ||||||
| Witcher 3 ultra (h) | 3.8 |
Pro
Contra
O Surface Pro 2018 da Microsoft ainda é um dos melhores tablets Windows disponíveis: excelente qualidade, excelente tela, boas câmeras, dispositivos de entrada agradáveis (embora o Type Cover e a Caneta sejam opcionais e precisem ser adquiridos separadamente) e um microfone muito bom.
No entanto, ainda não é o melhor da sua classe em todas as categorias. A conectividade permanece bastante limitada e o USB-C deveria estar disponível em qualquer dispositivo 2018 - de preferência Ger 2 com Thunderbolt 3. No entanto, a Microsoft não conseguiu implementar o Thunderbolt 3 mesmo em seu workstation criativo Surface Book 2.
Com sua carcaça, tela, dispositivos de entrada e conectividade idênticos, não é surpresa que a avaliação do Surface Pro i5 (2018) de 91% seja idêntica à do modelo i7. As diferenças entre os dois são bastante óbvias: enquanto a duração da bateria é bastante similar, o desempenho bruto não é. O i7 se mostrou até 22% mais rápido sob carga sustentada e não se afogou tanto quanto o i5. Este último reduziu sua velocidade em 25% sob carga, o primeiro em apenas 11%.
Se você está procurando desempenho, o i7 [clique aqui para ler nossa análise] é a melhor opção. Todos os outros estarão bem com o i5, que é mais do que rápido o suficiente para aplicativos de escritório e web.
Infelizmente, a Microsoft optou por um SSD NVMe Toshiba comparativamente lento (128 GB) - o modelo de 512 GB com os que a nossa unidade de teste i7 foi equipada, se desempenhou muito mais rápido. O SSD lento foi o principal culpado pelo fraco desempenho do PCMark do dispositivo.
O modelo i5 e i7 podem diferir bastante em termos de capacidade bruta de computação, e seu desempenho de aplicativos (PCMark) diferiu apenas de 5 a 18%, apesar do desempenho muito melhor do SSD de 512 GB.
A pequena diferença no desempenho de aplicativos levanta a questão de se o modelo i7 realmente vale ou não seu alto preço. Os viciados em desempenho se beneficiarão com o i7, que se mostrou 22% mais rápido sob carga sustentada.
Em nossa opinião, o i7 é um exagero para usuários que procuram principalmente um dispositivo de escritório e para aplicativo da web. O i5 é muito mais adequado para essas tarefas.
Infelizmente, a duração da bateria diminuiu de 12 horas (i5 2017) para apenas 9 horas (i5 2018). Dito isso, ainda é mais do que o que a concorrência é capaz de extrair da plataforma Kaby Lake R.
O HP Elite x2 1013 G3 é uma excelente alternativa ao Surface Pro, com desempenho comparável ao modelo i7 e uma duração de bateria ligeiramente mais curta. Para compensar, possui duas portas Thunderbolt 3 e uma tela 3:2 3K.
E ainda temos outro concorrente em análise enquanto falamos. O Tablet Lenovo ThinkPad X1 Gen. 3 custa quase o mesmo, mas possui uma Stylus, um maior resolução de 3000 x 2000, e um modem LTE. Em compensação, o tablet de 13 polegadas é um pouco maior e mais pesado (1.270 g incluindo o dock). Assim como o Surface Pro, ele possui uma tela 3:2, mas também duas portas Thunderbolt 3. Assim, pelo menos no papel, deveria ser a melhor opção. Nosso teste será concluído e publicado em poucos dias.
Microsoft Surface Pro 6, Core i5, 128 GB
- 02/17/2020 v7 (old)
Sebastian Jentsch
Price comparison
