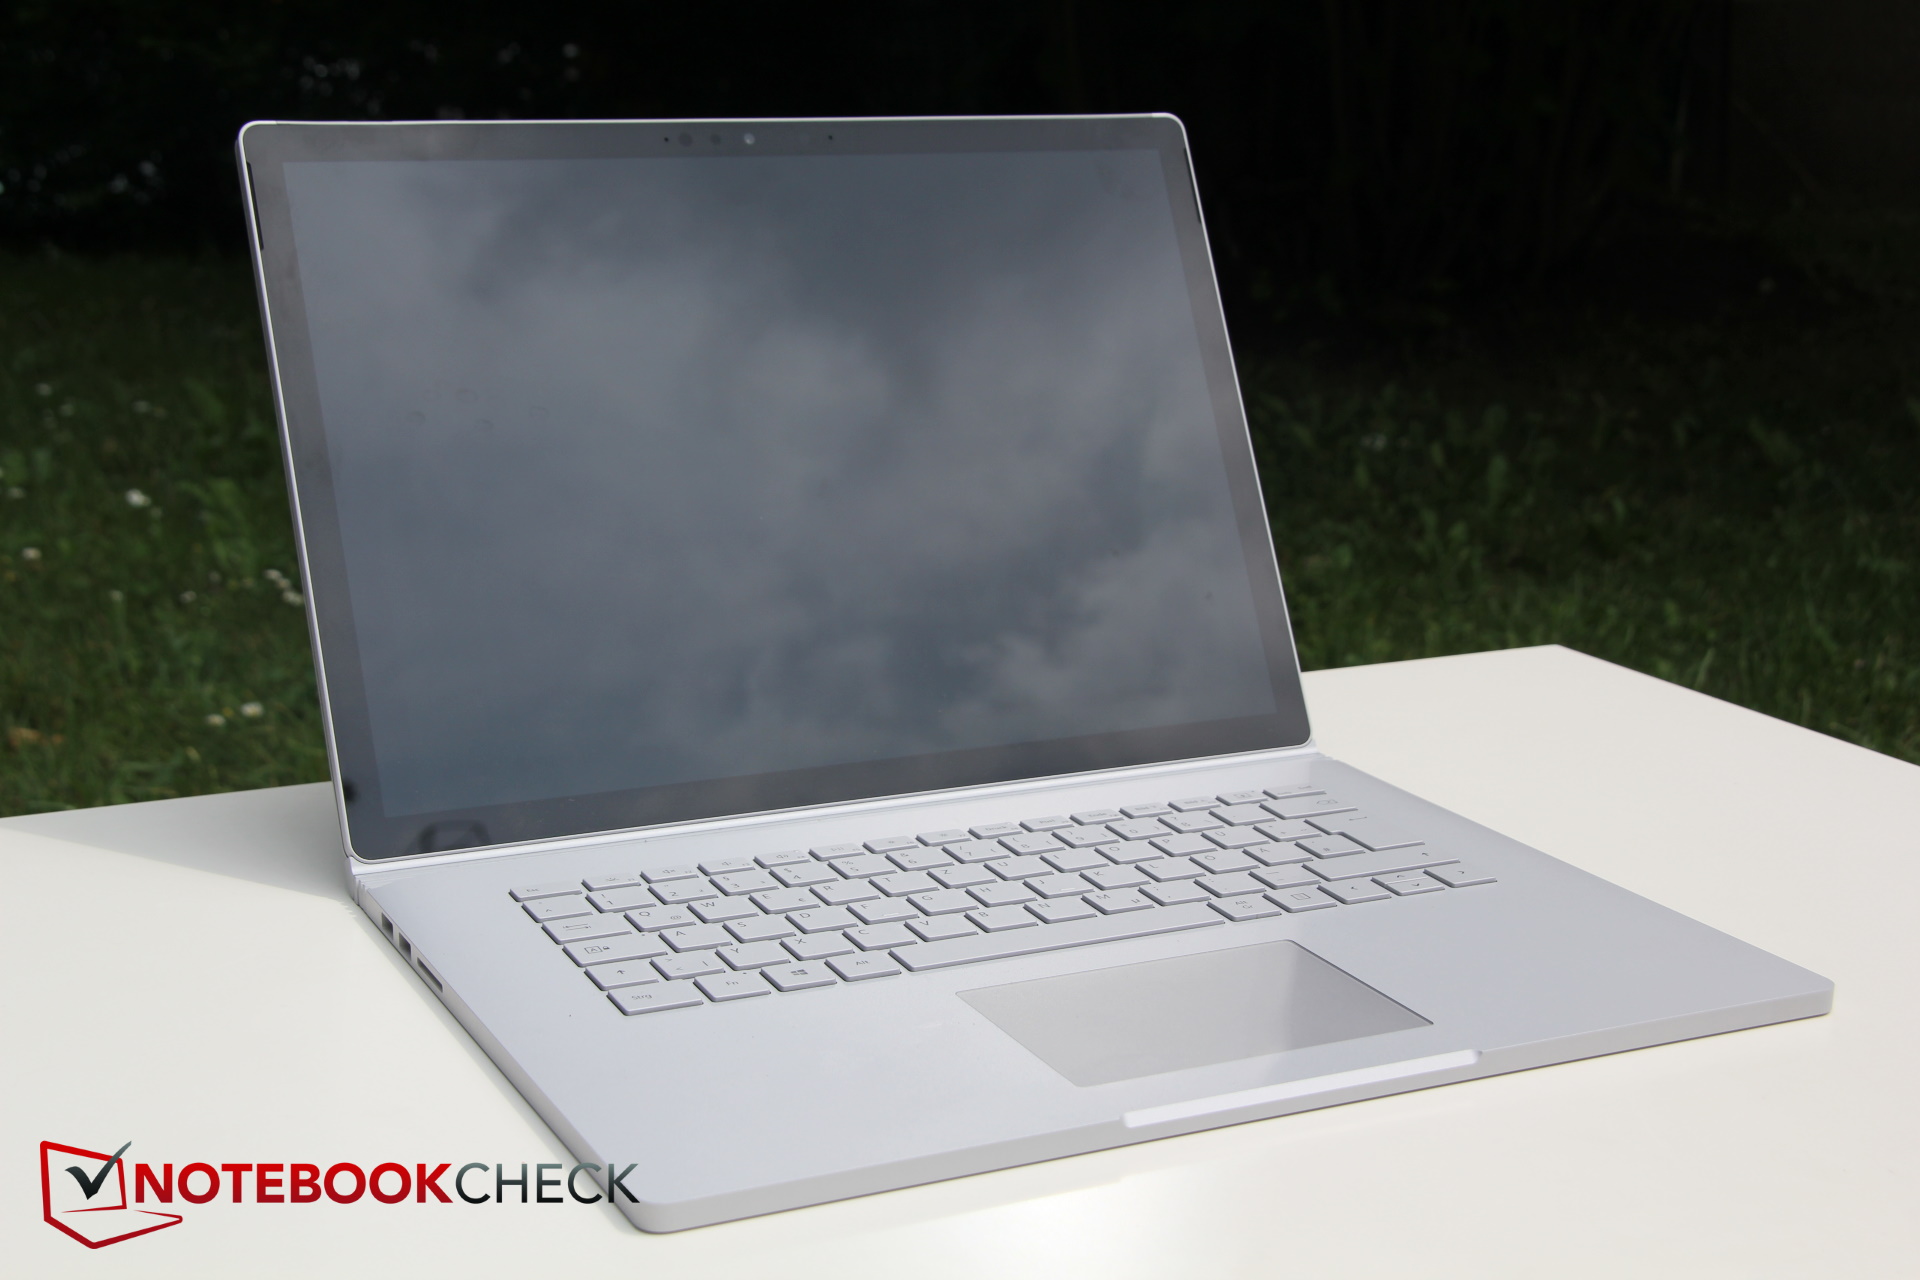
Breve Análise do Conversível Microsoft Surface Book 3 15: Ainda é ótimo, mas será que é melhor que o seu antecessor?
Avaliação | Data | Modelo | Peso | Altura | Size | Resolução | Preço |
|---|---|---|---|---|---|---|---|
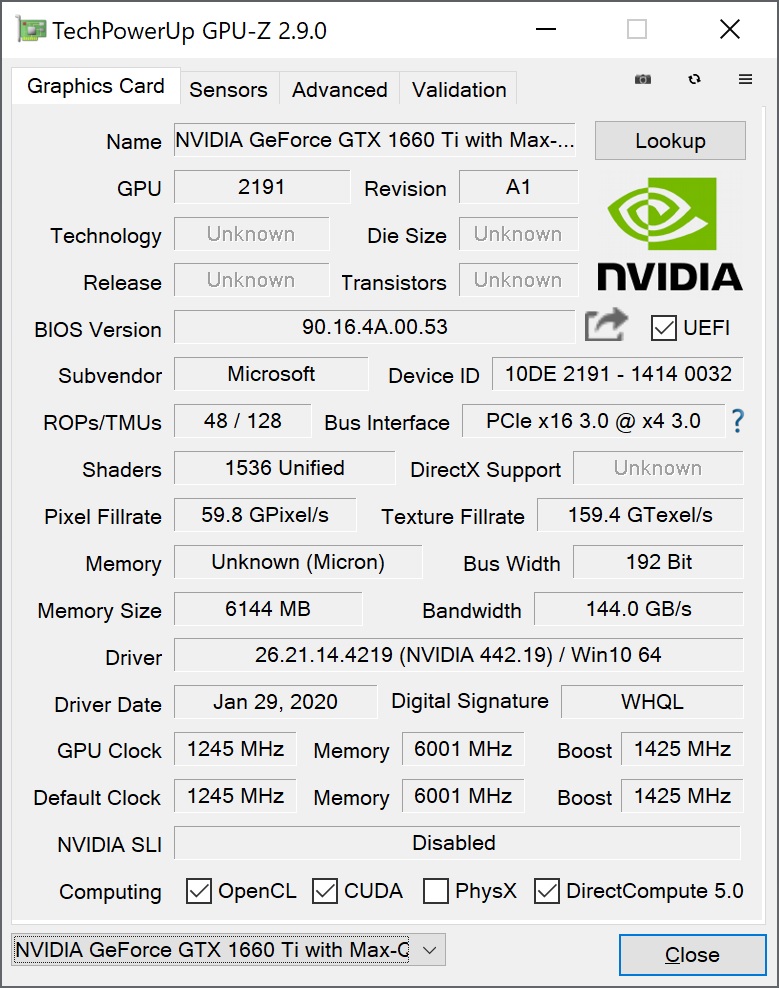
| 88.3 % v7 (old) | 06/2020 | Microsoft Surface Book 3 15 i7-1065G7, GeForce GTX 1660 Ti Max-Q | 1.9 kg | 23 mm | 15.00" | 3240x2160 | |
v (old) | 02/2018 | Microsoft Surface Book 2 15 i7-8650U, GeForce GTX 1060 Mobile | 1.9 kg | 23 mm | 15.00" | 3240x2160 | |
| 89.4 % v7 (old) | 03/2020 | Apple MacBook Pro 15 2019 i9 Vega 20 i9-9980HK, Radeon Pro Vega 20 | 1.8 kg | 15.5 mm | 15.40" | 2880x1800 | |
| 86.5 % v7 (old) | 03/2020 | Asus ZenBook Flip 15 UX563FD-A1027T i7-10510U, GeForce GTX 1050 Max-Q | 1.9 kg | 19.9 mm | 15.60" | 3840x2160 | |
| 88.2 % v7 (old) | 10/2019 | Lenovo Yoga C940-14IIL i7-1065G7, Iris Plus Graphics G7 (Ice Lake 64 EU) | 1.4 kg | 14.95 mm | 14.00" | 1920x1080 |
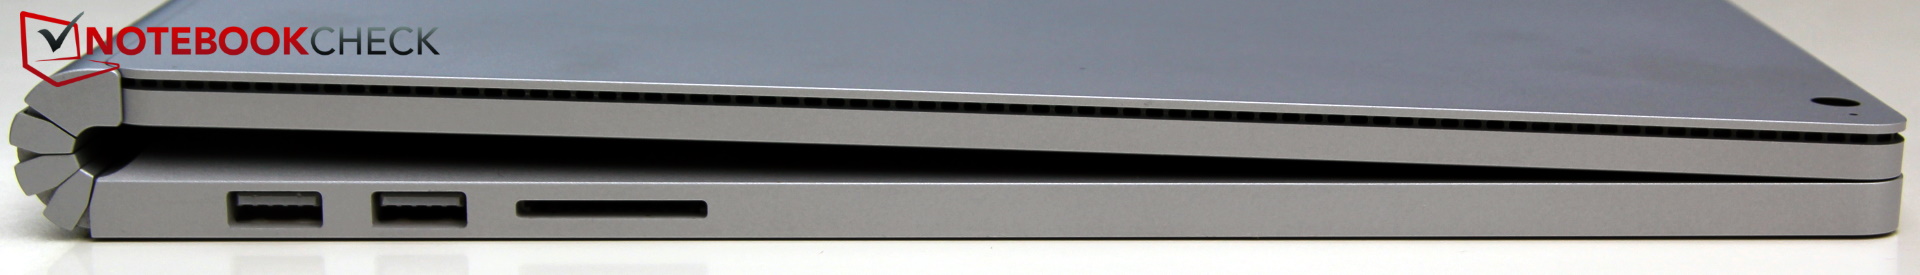
| SD Card Reader | |
| average JPG Copy Test (av. of 3 runs) | |
| Microsoft Surface Book 2 15 (Toshiba Exceria Pro SDXC 64 GB UHS-II) | |
| Microsoft Surface Book 3 15 (Toshiba Exceria Pro M501 microSDXC 64GB) | |
| Asus ZenBook Flip 15 UX563FD-A1027T (Toshiba Exceria Pro SDXC 64 GB UHS-II) | |
| Média da turma Convertible (29.4 - 186, n=21, últimos 2 anos) | |
| maximum AS SSD Seq Read Test (1GB) | |
| Microsoft Surface Book 2 15 (Toshiba Exceria Pro SDXC 64 GB UHS-II) | |
| Microsoft Surface Book 3 15 (Toshiba Exceria Pro M501 microSDXC 64GB) | |
| Média da turma Convertible (67.5 - 254, n=20, últimos 2 anos) | |


| |||||||||||||||||||||||||
iluminação: 89 %
iluminação com acumulador: 429 cd/m²
Contraste: 1861:1 (Preto: 0.23 cd/m²)
ΔE ColorChecker Calman: 2.65 | ∀{0.5-29.43 Ø4.71}
calibrated: 0.92
ΔE Greyscale Calman: 3.99 | ∀{0.09-98 Ø4.96}
93% sRGB (Argyll 1.6.3 3D)
58% AdobeRGB 1998 (Argyll 1.6.3 3D)
63.6% AdobeRGB 1998 (Argyll 3D)
92.7% sRGB (Argyll 3D)
61.5% Display P3 (Argyll 3D)
Gamma: 3.12
CCT: 6309 K
| Microsoft Surface Book 3 15 LG Philips LGD0554, IPS, 3240x2160, 15" | Microsoft Surface Book 2 15 LG Philips LGD0554, IPS, 3240x2160, 15" | Asus ZenBook Flip 15 UX563FD-A1027T BOE HF NE156QUM-N64, IPS, 3840x2160, 15.6" | Lenovo Yoga C940-14IIL LP140WF9-SPE2, IPS LED, 1920x1080, 14" | |
|---|---|---|---|---|
| Display | 7% | 6% | ||
| Display P3 Coverage (%) | 61.5 | 66.2 8% | 66 7% | |
| sRGB Coverage (%) | 92.7 | 97.2 5% | 97.9 6% | |
| AdobeRGB 1998 Coverage (%) | 63.6 | 68.3 7% | 67.3 6% | |
| Response Times | 6% | -49% | -26% | |
| Response Time Grey 50% / Grey 80% * (ms) | 38 ? | 37.6 ? 1% | 60 ? -58% | 49.6 ? -31% |
| Response Time Black / White * (ms) | 25 ? | 22.4 ? 10% | 35 ? -40% | 30 ? -20% |
| PWM Frequency (Hz) | 250 ? | 21930 ? | ||
| Screen | 16% | 4% | 1% | |
| Brightness middle (cd/m²) | 428 | 446 4% | 351 -18% | 384 -10% |
| Brightness (cd/m²) | 413 | 444 8% | 335 -19% | 363 -12% |
| Brightness Distribution (%) | 89 | 89 0% | 87 -2% | 90 1% |
| Black Level * (cd/m²) | 0.23 | 0.25 -9% | 0.31 -35% | 0.17 26% |
| Contrast (:1) | 1861 | 1784 -4% | 1132 -39% | 2259 21% |
| Colorchecker dE 2000 * | 2.65 | 1.7 36% | 1.74 34% | 3.5 -32% |
| Colorchecker dE 2000 max. * | 8.12 | 2.7 67% | 2.76 66% | 5.5 32% |
| Colorchecker dE 2000 calibrated * | 0.92 | 1 -9% | ||
| Greyscale dE 2000 * | 3.99 | 1.7 57% | 2.22 44% | 4.6 -15% |
| Gamma | 3.12 71% | 2.11 104% | 2.35 94% | 2.32 95% |
| CCT | 6309 103% | 6384 102% | 6667 97% | 6884 94% |
| Color Space (Percent of AdobeRGB 1998) (%) | 58 | 58.6 1% | 62 7% | 62 7% |
| Color Space (Percent of sRGB) (%) | 93 | 92.9 0% | 97 4% | 97.7 5% |
| Média Total (Programa/Configurações) | 11% /
14% | -13% /
-2% | -6% /
-1% |
* ... menor é melhor
Exibir tempos de resposta
| ↔ Tempo de resposta preto para branco | ||
|---|---|---|
| 25 ms ... ascensão ↗ e queda ↘ combinadas | ↗ 15 ms ascensão | 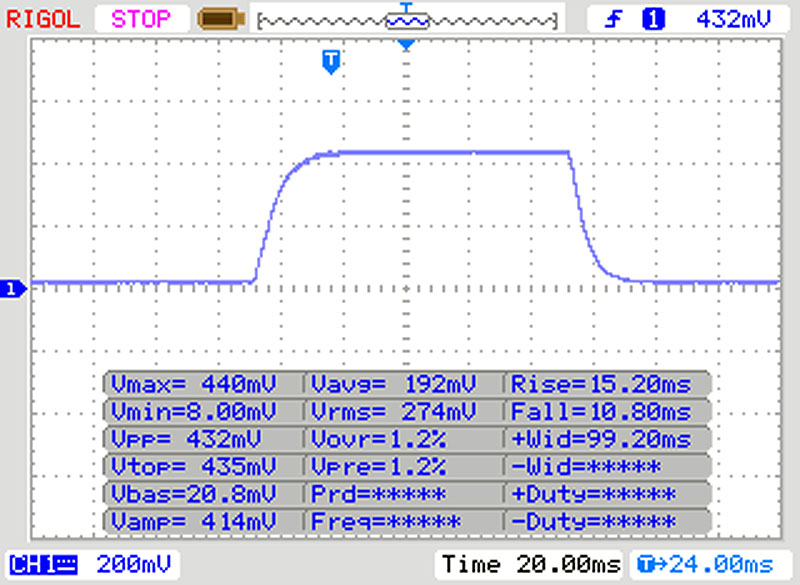 |
| ↘ 10 ms queda | ||
| A tela mostra taxas de resposta relativamente lentas em nossos testes e pode ser muito lenta para os jogadores. Em comparação, todos os dispositivos testados variam de 0.1 (mínimo) a 240 (máximo) ms. » 59 % de todos os dispositivos são melhores. Isso significa que o tempo de resposta medido é pior que a média de todos os dispositivos testados (19.8 ms). | ||
| ↔ Tempo de resposta 50% cinza a 80% cinza | ||
| 38 ms ... ascensão ↗ e queda ↘ combinadas | ↗ 18 ms ascensão | 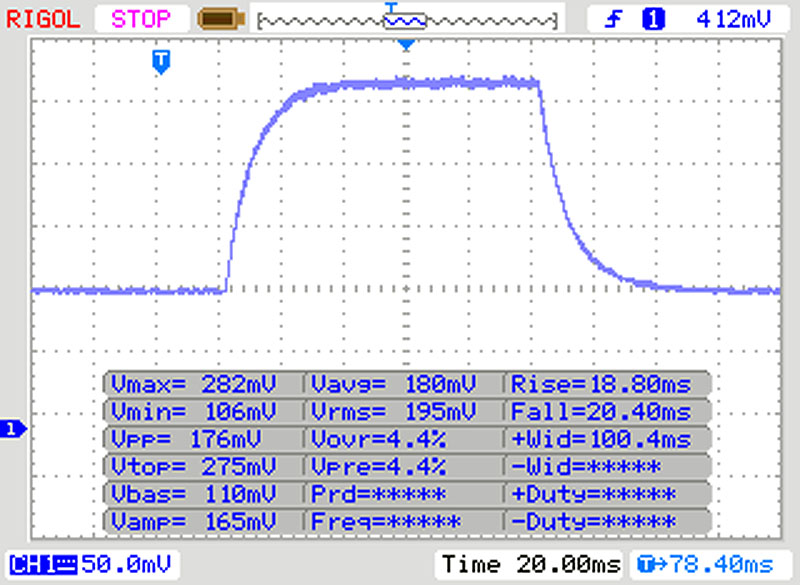 |
| ↘ 20 ms queda | ||
| A tela mostra taxas de resposta lentas em nossos testes e será insatisfatória para os jogadores. Em comparação, todos os dispositivos testados variam de 0.165 (mínimo) a 636 (máximo) ms. » 55 % de todos os dispositivos são melhores. Isso significa que o tempo de resposta medido é pior que a média de todos os dispositivos testados (30.9 ms). | ||
Cintilação da tela / PWM (modulação por largura de pulso)
| Tela tremeluzindo/PWM detectado | 250 Hz | ≤ 50 % configuração de brilho | 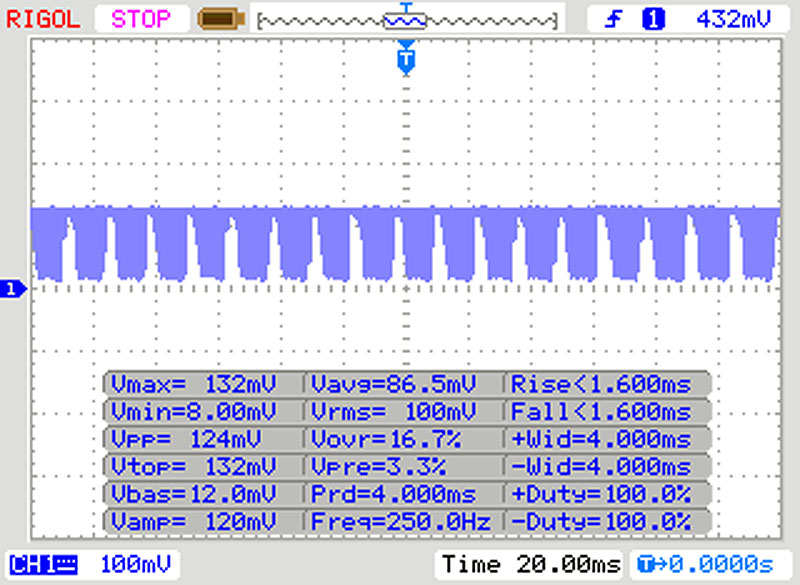 |
A luz de fundo da tela pisca em 250 Hz (pior caso, por exemplo, utilizando PWM) Cintilação detectada em uma configuração de brilho de 50 % e abaixo. Não deve haver cintilação ou PWM acima desta configuração de brilho. A frequência de 250 Hz é relativamente baixa, portanto, usuários sensíveis provavelmente notarão cintilação e sentirão fadiga ocular na configuração de brilho indicada e abaixo. [pwm_comparison] Em comparação: 52 % de todos os dispositivos testados não usam PWM para escurecer a tela. Se PWM foi detectado, uma média de 7748 (mínimo: 5 - máximo: 343500) Hz foi medida. | |||
Cinebench R15: CPU Single 64Bit | CPU Multi 64Bit
Blender: v2.79 BMW27 CPU
7-Zip 18.03: 7z b 4 -mmt1 | 7z b 4
Geekbench 5.5: Single-Core | Multi-Core
HWBOT x265 Benchmark v2.2: 4k Preset
LibreOffice : 20 Documents To PDF
R Benchmark 2.5: Overall mean
| Cinebench R20 / CPU (Single Core) | |
| Média da turma Convertible (273 - 834, n=49, últimos 2 anos) | |
| Asus ZenBook Flip 15 UX563FD-A1027T | |
| Apple MacBook Pro 15 2019 i9 Vega 20 | |
| Microsoft Surface Book 3 15 | |
| Média Intel Core i7-1065G7 (358 - 474, n=31) | |
| Cinebench R20 / CPU (Multi Core) | |
| Média da turma Convertible (595 - 12102, n=49, últimos 2 anos) | |
| Apple MacBook Pro 15 2019 i9 Vega 20 | |
| Asus ZenBook Flip 15 UX563FD-A1027T | |
| Média Intel Core i7-1065G7 (1081 - 2024, n=31) | |
| Microsoft Surface Book 3 15 | |
| Cinebench R15 / CPU Single 64Bit | |
| Média da turma Convertible (149.8 - 317, n=48, últimos 2 anos) | |
| Asus ZenBook Flip 15 UX563FD-A1027T | |
| Apple MacBook Pro 15 2019 i9 Vega 20 | |
| Microsoft Surface Book 3 15 | |
| Lenovo Yoga C940-14IIL | |
| Microsoft Surface Book 2 15 | |
| Média Intel Core i7-1065G7 (141 - 190, n=35) | |
| Cinebench R15 / CPU Multi 64Bit | |
| Média da turma Convertible (478 - 4940, n=48, últimos 2 anos) | |
| Apple MacBook Pro 15 2019 i9 Vega 20 | |
| Asus ZenBook Flip 15 UX563FD-A1027T | |
| Lenovo Yoga C940-14IIL | |
| Lenovo Yoga C940-14IIL | |
| Microsoft Surface Book 2 15 | |
| Microsoft Surface Book 2 15 | |
| Microsoft Surface Book 2 15 | |
| Média Intel Core i7-1065G7 (288 - 836, n=36) | |
| Microsoft Surface Book 3 15 | |
| Blender / v2.79 BMW27 CPU | |
| Média Intel Core i7-1065G7 (675 - 1650, n=23) | |
| Microsoft Surface Book 3 15 | |
| Lenovo Yoga C940-14IIL | |
| Média da turma Convertible (105 - 1051, n=48, últimos 2 anos) | |
| 7-Zip 18.03 / 7z b 4 -mmt1 | |
| Média da turma Convertible (3672 - 6655, n=48, últimos 2 anos) | |
| Lenovo Yoga C940-14IIL | |
| Microsoft Surface Book 3 15 | |
| Média Intel Core i7-1065G7 (3289 - 4589, n=24) | |
| 7-Zip 18.03 / 7z b 4 | |
| Média da turma Convertible (12977 - 121368, n=48, últimos 2 anos) | |
| Lenovo Yoga C940-14IIL | |
| Microsoft Surface Book 3 15 | |
| Média Intel Core i7-1065G7 (10406 - 22898, n=24) | |
| Geekbench 5.5 / Single-Core | |
| Média da turma Convertible (806 - 2275, n=48, últimos 2 anos) | |
| Microsoft Surface Book 3 15 | |
| Asus ZenBook Flip 15 UX563FD-A1027T | |
| Média Intel Core i7-1065G7 (948 - 1348, n=18) | |
| Geekbench 5.5 / Multi-Core | |
| Média da turma Convertible (1608 - 22023, n=48, últimos 2 anos) | |
| Microsoft Surface Book 3 15 | |
| Asus ZenBook Flip 15 UX563FD-A1027T | |
| Média Intel Core i7-1065G7 (2464 - 4855, n=18) | |
| HWBOT x265 Benchmark v2.2 / 4k Preset | |
| Média da turma Convertible (3.43 - 36.2, n=48, últimos 2 anos) | |
| Lenovo Yoga C940-14IIL | |
| Média Intel Core i7-1065G7 (2.2 - 6.38, n=22) | |
| Microsoft Surface Book 3 15 | |
| LibreOffice / 20 Documents To PDF | |
| Microsoft Surface Book 3 15 | |
| Média Intel Core i7-1065G7 (46.9 - 85.3, n=19) | |
| Média da turma Convertible (42.5 - 84.3, n=48, últimos 2 anos) | |
| R Benchmark 2.5 / Overall mean | |
| Média Intel Core i7-1065G7 (0.661 - 0.798, n=18) | |
| Microsoft Surface Book 3 15 | |
| Média da turma Convertible (0.3915 - 0.84, n=48, últimos 2 anos) | |
* ... menor é melhor
| PCMark 8 Home Score Accelerated v2 | 3382 pontos | |
| PCMark 8 Work Score Accelerated v2 | 4415 pontos | |
| PCMark 10 Score | 4317 pontos | |
Ajuda | ||
| DPC Latencies / LatencyMon - interrupt to process latency (max), Web, Youtube, Prime95 | |
| Microsoft Surface Book 3 15 | |
* ... menor é melhor
| Microsoft Surface Book 3 15 SK hynix BC501 HFM256GDGTNG | Microsoft Surface Book 2 Samsung PM961 MZVLW256HEHP | Asus ZenBook Flip 15 UX563FD-A1027T Samsung SSD PM981 MZVLB1T0HALR | Lenovo Yoga C940-14IIL Samsung SSD PM981 MZVLB512HAJQ | Média SK hynix BC501 HFM256GDGTNG | |
|---|---|---|---|---|---|
| CrystalDiskMark 5.2 / 6 | 19% | 98% | 101% | 5% | |
| Write 4K (MB/s) | 87.4 | 140.6 61% | 137.8 58% | 128.4 47% | 96.6 ? 11% |
| Read 4K (MB/s) | 38.14 | 43.62 14% | 44.15 16% | 46.37 22% | 39.1 ? 3% |
| Write Seq (MB/s) | 610 | 343.3 -44% | 2073 240% | 1863 205% | 637 ? 4% |
| Read Seq (MB/s) | 1029 | 1452 41% | 2165 110% | 2340 127% | 1032 ? 0% |
| Write 4K Q32T1 (MB/s) | 280.3 | 344.4 23% | 431.9 54% | 451.1 61% | 303 ? 8% |
| Read 4K Q32T1 (MB/s) | 259.6 | 457.2 76% | 427.7 65% | 415.3 60% | 298 ? 15% |
| Write Seq Q32T1 (MB/s) | 829 | 344.3 -58% | 2253 172% | 2985 260% | 822 ? -1% |
| Read Seq Q32T1 (MB/s) | 2037 | 2885 42% | 3480 71% | 2565 26% | 2030 ? 0% |
| Write 4K Q8T8 (MB/s) | 451.4 | ||||
| Read 4K Q8T8 (MB/s) | 1004 | ||||
| AS SSD | 113% | 123% | -11% | ||
| Seq Read (MB/s) | 1625 | 2739 69% | 2525 55% | 1370 ? -16% | |
| Seq Write (MB/s) | 461.3 | 1307 183% | 1253 172% | 493 ? 7% | |
| 4K Read (MB/s) | 37.2 | 47.43 27% | 59.1 59% | 38.2 ? 3% | |
| 4K Write (MB/s) | 100.9 | 126 25% | 134.1 33% | 104 ? 3% | |
| 4K-64 Read (MB/s) | 501 | 1013 102% | 1010 102% | 493 ? -2% | |
| 4K-64 Write (MB/s) | 311.7 | 1371 340% | 1461 369% | 339 ? 9% | |
| Access Time Read * (ms) | 0.072 | 0.082 -14% | 0.052 28% | 0.06 ? 17% | |
| Access Time Write * (ms) | 0.036 | 0.029 19% | 0.029 19% | 0.086 ? -139% | |
| Score Read (Points) | 701 | 1335 90% | 1322 89% | 669 ? -5% | |
| Score Write (Points) | 459 | 1628 255% | 1721 275% | 493 ? 7% | |
| Score Total (Points) | 1470 | 3582 144% | 3670 150% | 1471 ? 0% | |
| Copy ISO MB/s (MB/s) | 1931 | 2016 | 786 ? | ||
| Copy Program MB/s (MB/s) | 457.9 | 542 | 252 ? | ||
| Copy Game MB/s (MB/s) | 1242 | 1278 | 376 ? | ||
| Média Total (Programa/Configurações) | 19% /
19% | 106% /
107% | 112% /
114% | -3% /
-4% |
* ... menor é melhor

Dauerleistung Lesen: DiskSpd Read Loop, Queue Depth 8
| 3DMark 11 Performance | 14387 pontos | |
| 3DMark Cloud Gate Standard Score | 16807 pontos | |
| 3DMark Fire Strike Score | 10103 pontos | |
| 3DMark Time Spy Score | 4820 pontos | |
Ajuda | ||
| Battlefield V | |
| 1280x720 Low Preset | |
| Média NVIDIA GeForce GTX 1660 Ti Max-Q (94.3 - 152, n=3) | |
| Microsoft Surface Book 3 15 | |
| Lenovo Yoga C940-14IIL | |
| 1920x1080 Medium Preset | |
| Média NVIDIA GeForce GTX 1660 Ti Max-Q (74.6 - 102.6, n=3) | |
| Microsoft Surface Book 3 15 | |
| Lenovo Yoga C940-14IIL | |
| 1920x1080 High Preset | |
| Média NVIDIA GeForce GTX 1660 Ti Max-Q (65.9 - 92.2, n=3) | |
| Microsoft Surface Book 3 15 | |
| Lenovo Yoga C940-14IIL | |
| 1920x1080 Ultra Preset | |
| Microsoft Surface Book 3 15 | |
| Média NVIDIA GeForce GTX 1660 Ti Max-Q (61 - 85, n=3) | |
| 3840x2160 Ultra Preset | |
| Microsoft Surface Book 3 15 | |
| Média NVIDIA GeForce GTX 1660 Ti Max-Q (n=1) | |
| baixo | média | alto | ultra | 4K | |
|---|---|---|---|---|---|
| The Witcher 3 (2015) | 144.5 | 111.4 | 64.4 | 44.8 | 30.9 |
| Dota 2 Reborn (2015) | 113 | 102.1 | 93.8 | 86.3 | |
| X-Plane 11.11 (2018) | 68.8 | 62.9 | 55.4 | ||
| Far Cry 5 (2018) | 68 | 54 | 53 | 50 | 30 |
| Battlefield V (2018) | 94.3 | 82.9 | 77.5 | 73 | 37.9 |
Barulho
| Ocioso |
| 30.2 / 30.2 / 30.2 dB |
| Carga |
| 30.9 / 34.3 dB |
 | ||
30 dB silencioso 40 dB(A) audível 50 dB(A) ruidosamente alto |
||
min: | ||
| Microsoft Surface Book 3 15 GeForce GTX 1660 Ti Max-Q, i7-1065G7, SK hynix BC501 HFM256GDGTNG | Microsoft Surface Book 2 15 GeForce GTX 1060 Mobile, i7-8650U, Samsung PM961 MZVLW256HEHP | Asus ZenBook Flip 15 UX563FD-A1027T GeForce GTX 1050 Max-Q, i7-10510U, Samsung SSD PM981 MZVLB1T0HALR | Lenovo Yoga C940-14IIL Iris Plus Graphics G7 (Ice Lake 64 EU), i7-1065G7, Samsung SSD PM981 MZVLB512HAJQ | |
|---|---|---|---|---|
| Noise | -5% | -1% | 1% | |
| desligado / ambiente * (dB) | 30.2 | 29.1 4% | 30.3 -0% | 29.3 3% |
| Idle Minimum * (dB) | 30.2 | 29.1 4% | 30.3 -0% | 29.3 3% |
| Idle Average * (dB) | 30.2 | 29.1 4% | 30.3 -0% | 29.3 3% |
| Idle Maximum * (dB) | 30.2 | 29.1 4% | 30.3 -0% | 29.3 3% |
| Load Average * (dB) | 30.9 | 35.7 -16% | 33.7 -9% | 33.3 -8% |
| Witcher 3 ultra * (dB) | 45.1 | 37.4 17% | ||
| Load Maximum * (dB) | 34.3 | 45.3 -32% | 38.9 -13% | 33.3 3% |
* ... menor é melhor
| Microsoft Surface Book 3 15 GeForce GTX 1660 Ti Max-Q, i7-1065G7, SK hynix BC501 HFM256GDGTNG | Microsoft Surface Book 2 15 GeForce GTX 1060 Mobile, i7-8650U, Samsung PM961 MZVLW256HEHP | Asus ZenBook Flip 15 UX563FD-A1027T GeForce GTX 1050 Max-Q, i7-10510U, Samsung SSD PM981 MZVLB1T0HALR | Lenovo Yoga C940-14IIL Iris Plus Graphics G7 (Ice Lake 64 EU), i7-1065G7, Samsung SSD PM981 MZVLB512HAJQ | |
|---|---|---|---|---|
| Heat | 7% | 7% | 9% | |
| Maximum Upper Side * (°C) | 41.4 | 43.5 -5% | 42.6 -3% | 41 1% |
| Maximum Bottom * (°C) | 39.7 | 42.7 -8% | 41.5 -5% | 44.6 -12% |
| Idle Upper Side * (°C) | 34.6 | 28.4 18% | 26.4 24% | 24.4 29% |
| Idle Bottom * (°C) | 30.3 | 23.7 22% | 26.3 13% | 25 17% |
* ... menor é melhor
(±) A temperatura máxima no lado superior é 41.4 °C / 107 F, em comparação com a média de 35.4 °C / 96 F , variando de 19.6 a 60 °C para a classe Convertible.
(+) A parte inferior aquece até um máximo de 39.7 °C / 103 F, em comparação com a média de 36.9 °C / 98 F
(+) Em uso inativo, a temperatura média para o lado superior é 30.3 °C / 87 F, em comparação com a média do dispositivo de 30.3 °C / ### class_avg_f### F.
(±) Jogando The Witcher 3, a temperatura média para o lado superior é 34.6 °C / 94 F, em comparação com a média do dispositivo de 30.3 °C / ## #class_avg_f### F.
(±) Os apoios para as mãos e o touchpad podem ficar muito quentes ao toque, com um máximo de 38.8 °C / 101.8 F.
(-) A temperatura média da área do apoio para as mãos de dispositivos semelhantes foi 28 °C / 82.4 F (-10.8 °C / -19.4 F).
Microsoft Surface Book 3 15 análise de áudio
(-) | alto-falantes não muito altos (###valor### dB)
Graves 100 - 315Hz
(±) | graves reduzidos - em média 9.8% menor que a mediana
(±) | a linearidade dos graves é média (8.9% delta para a frequência anterior)
Médios 400 - 2.000 Hz
(±) | médios mais altos - em média 5.2% maior que a mediana
(±) | a linearidade dos médios é média (9.4% delta para frequência anterior)
Altos 2 - 16 kHz
(+) | agudos equilibrados - apenas 3.1% longe da mediana
(±) | a linearidade dos máximos é média (7.1% delta para frequência anterior)
Geral 100 - 16.000 Hz
(±) | a linearidade do som geral é média (17.3% diferença em relação à mediana)
Comparado com a mesma classe
» 33% de todos os dispositivos testados nesta classe foram melhores, 8% semelhantes, 59% piores
» O melhor teve um delta de 6%, a média foi 20%, o pior foi 57%
Comparado com todos os dispositivos testados
» 33% de todos os dispositivos testados foram melhores, 8% semelhantes, 59% piores
» O melhor teve um delta de 4%, a média foi 23%, o pior foi 134%
Apple MacBook 12 (Early 2016) 1.1 GHz análise de áudio
(+) | os alto-falantes podem tocar relativamente alto (###valor### dB)
Graves 100 - 315Hz
(±) | graves reduzidos - em média 11.3% menor que a mediana
(±) | a linearidade dos graves é média (14.2% delta para a frequência anterior)
Médios 400 - 2.000 Hz
(+) | médios equilibrados - apenas 2.4% longe da mediana
(+) | médios são lineares (5.5% delta para frequência anterior)
Altos 2 - 16 kHz
(+) | agudos equilibrados - apenas 2% longe da mediana
(+) | os máximos são lineares (4.5% delta da frequência anterior)
Geral 100 - 16.000 Hz
(+) | o som geral é linear (10.2% diferença em relação à mediana)
Comparado com a mesma classe
» 7% de todos os dispositivos testados nesta classe foram melhores, 2% semelhantes, 90% piores
» O melhor teve um delta de 5%, a média foi 18%, o pior foi 53%
Comparado com todos os dispositivos testados
» 5% de todos os dispositivos testados foram melhores, 1% semelhantes, 94% piores
» O melhor teve um delta de 4%, a média foi 23%, o pior foi 134%
| desligado | |
| Ocioso | |
| Carga |
|
Key:
min: | |
| Microsoft Surface Book 3 15 i7-1065G7, GeForce GTX 1660 Ti Max-Q, SK hynix BC501 HFM256GDGTNG, IPS, 3240x2160, 15" | Asus ZenBook Flip 15 UX563FD-A1027T i7-10510U, GeForce GTX 1050 Max-Q, Samsung SSD PM981 MZVLB1T0HALR, IPS, 3840x2160, 15.6" | Lenovo Yoga C940-14IIL i7-1065G7, Iris Plus Graphics G7 (Ice Lake 64 EU), Samsung SSD PM981 MZVLB512HAJQ, IPS LED, 1920x1080, 14" | Apple MacBook Pro 15 2019 i9 Vega 20 i9-9980HK, Radeon Pro Vega 20, Apple SSD AP1024, IPS, 2880x1800, 15.4" | Média NVIDIA GeForce GTX 1660 Ti Max-Q | Média da turma Convertible | |
|---|---|---|---|---|---|---|
| Power Consumption | 1% | 22% | -28% | 17% | ||
| Idle Minimum * (Watt) | 4.2 | 2.3 45% | 3.2 24% | 5.16 ? -23% | 4.28 ? -2% | |
| Idle Average * (Watt) | 7.4 | 10.3 -39% | 7 5% | 8.51 ? -15% | 6.96 ? 6% | |
| Idle Maximum * (Watt) | 9 | 11 -22% | 8.9 1% | 14.6 ? -62% | 8.67 ? 4% | |
| Load Average * (Watt) | 78 | 77 1% | 47.6 39% | 76.4 ? 2% | 45.1 ? 42% | |
| Witcher 3 ultra * (Watt) | 94.2 | 68 28% | ||||
| Load Maximum * (Watt) | 108 | 118 -9% | 63.1 42% | 151.4 ? -40% | 67.7 ? 37% |
* ... menor é melhor
| Microsoft Surface Book 3 15 i7-1065G7, GeForce GTX 1660 Ti Max-Q, 82 Wh | Microsoft Surface Book 2 15 i7-8650U, GeForce GTX 1060 Mobile, 86 Wh | Apple MacBook Pro 15 2019 i9 Vega 20 i9-9980HK, Radeon Pro Vega 20, 83 Wh | Asus ZenBook Flip 15 UX563FD-A1027T i7-10510U, GeForce GTX 1050 Max-Q, 71 Wh | Lenovo Yoga C940-14IIL i7-1065G7, Iris Plus Graphics G7 (Ice Lake 64 EU), 60 Wh | Média da turma Convertible | |
|---|---|---|---|---|---|---|
| Duração da bateria | 8% | 35% | 0% | -12% | 20% | |
| Reader / Idle (h) | 16.2 | 19.5 20% | 26.7 ? 65% | |||
| H.264 (h) | 12.9 | 15.3 19% | 11.2 -13% | 13.2 2% | 15 ? 16% | |
| WiFi v1.3 (h) | 8.5 | 10.6 25% | 11.5 35% | 9.4 11% | 10.6 25% | 12 ? 41% |
| Load (h) | 3 | 2.4 -20% | 2.5 -17% | 1.1 -63% | 1.713 ? -43% |
Pro
Contra
Veredicto - Excelente conversível com uma desvantagem
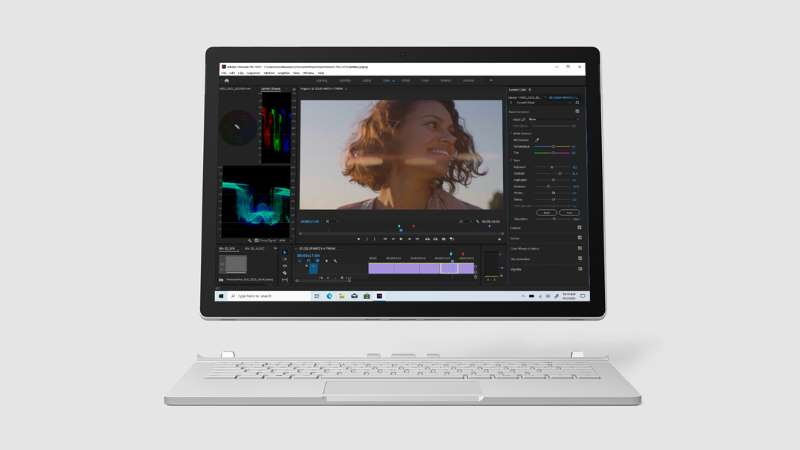
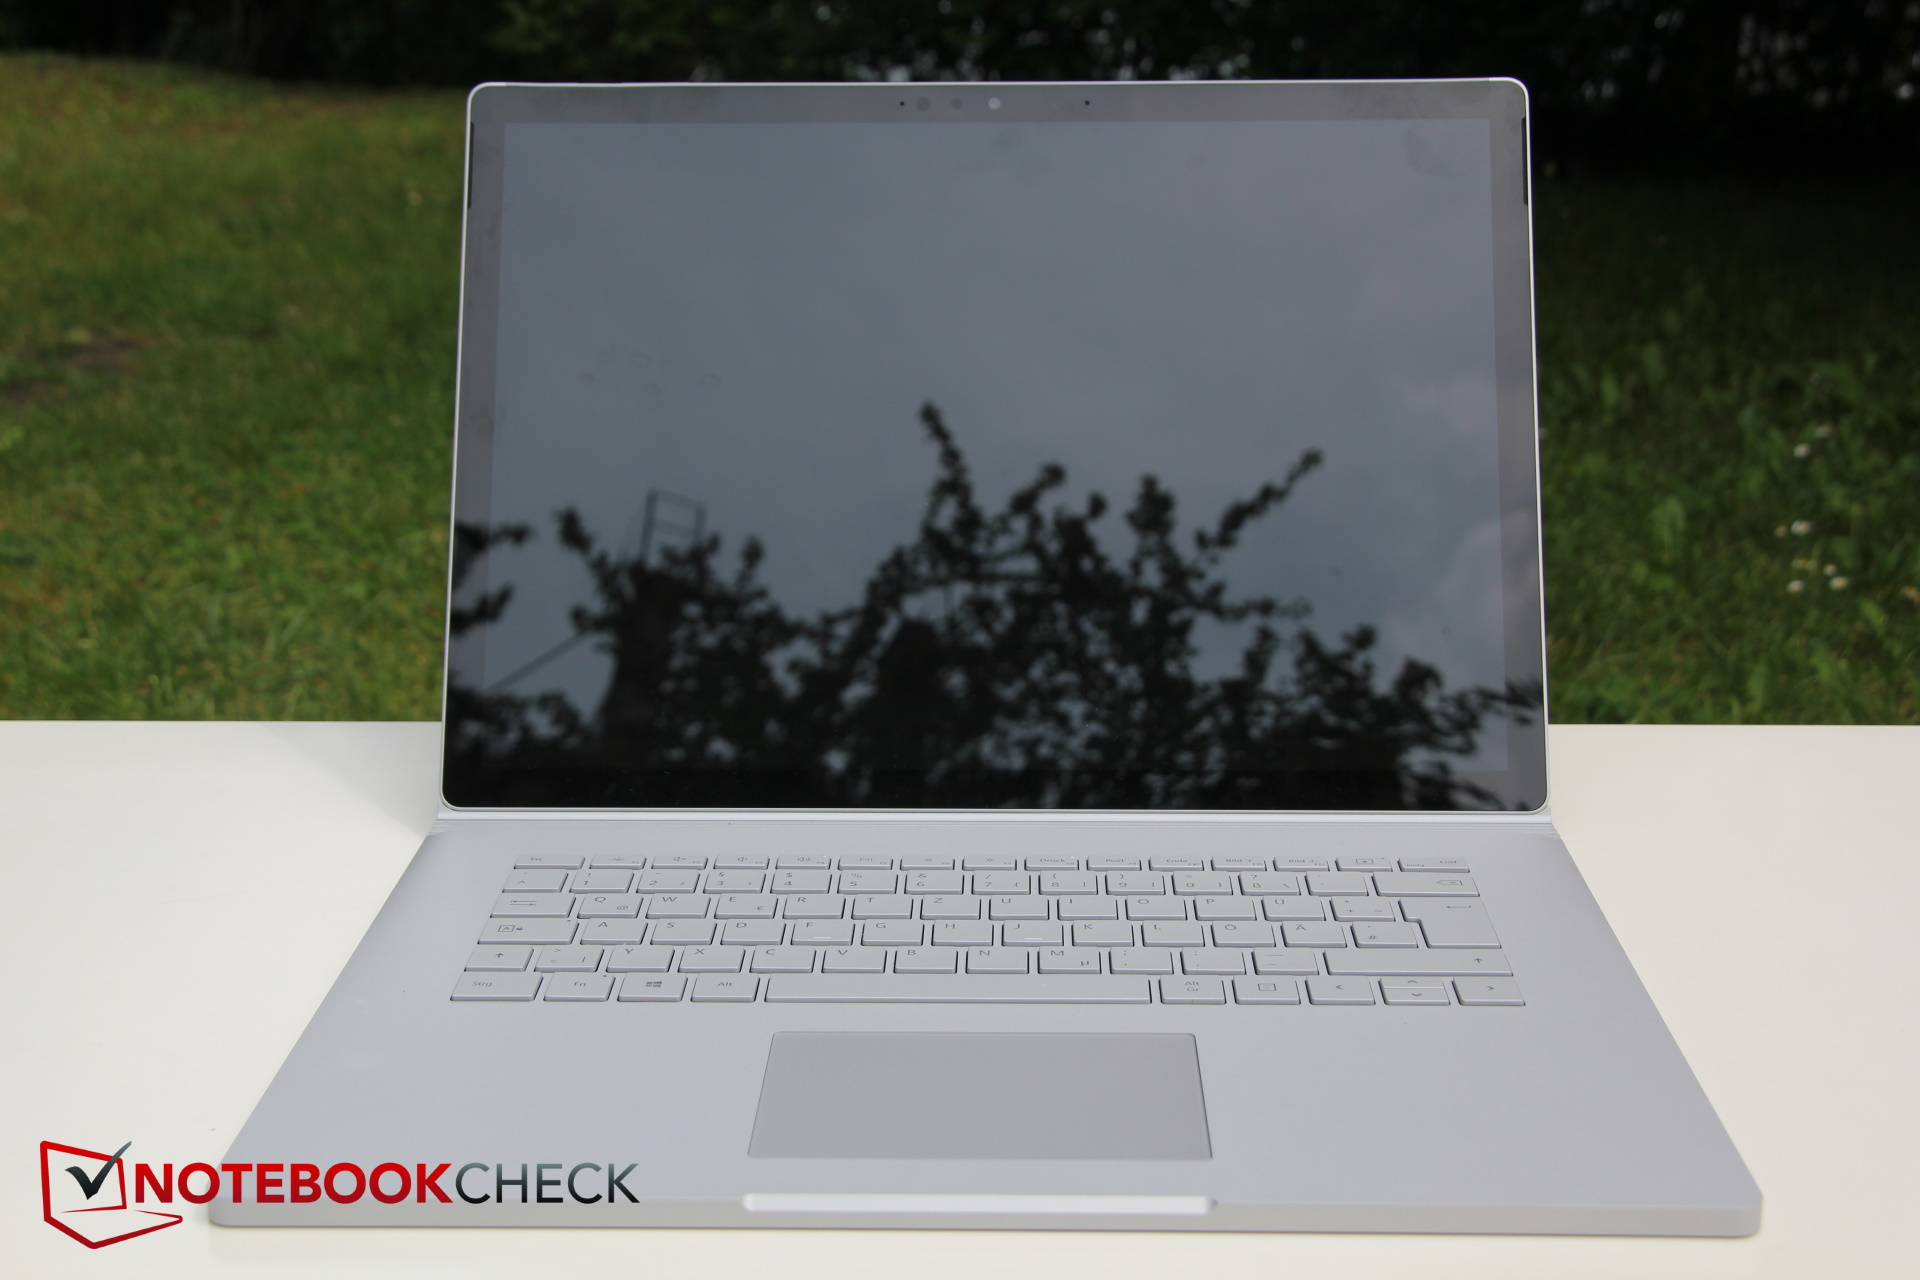
O Surface Book 3 15 da Microsoft é um dispositivo premium que, graças ao seu design único, quase não tem concorrência. Onde mais você pode obter um tablet tão poderoso que também pode se transformar em um portátil com hardware ainda melhor (GPU). Mesmo o próprio tablet é mais rápido que muitos portáteis básicos.
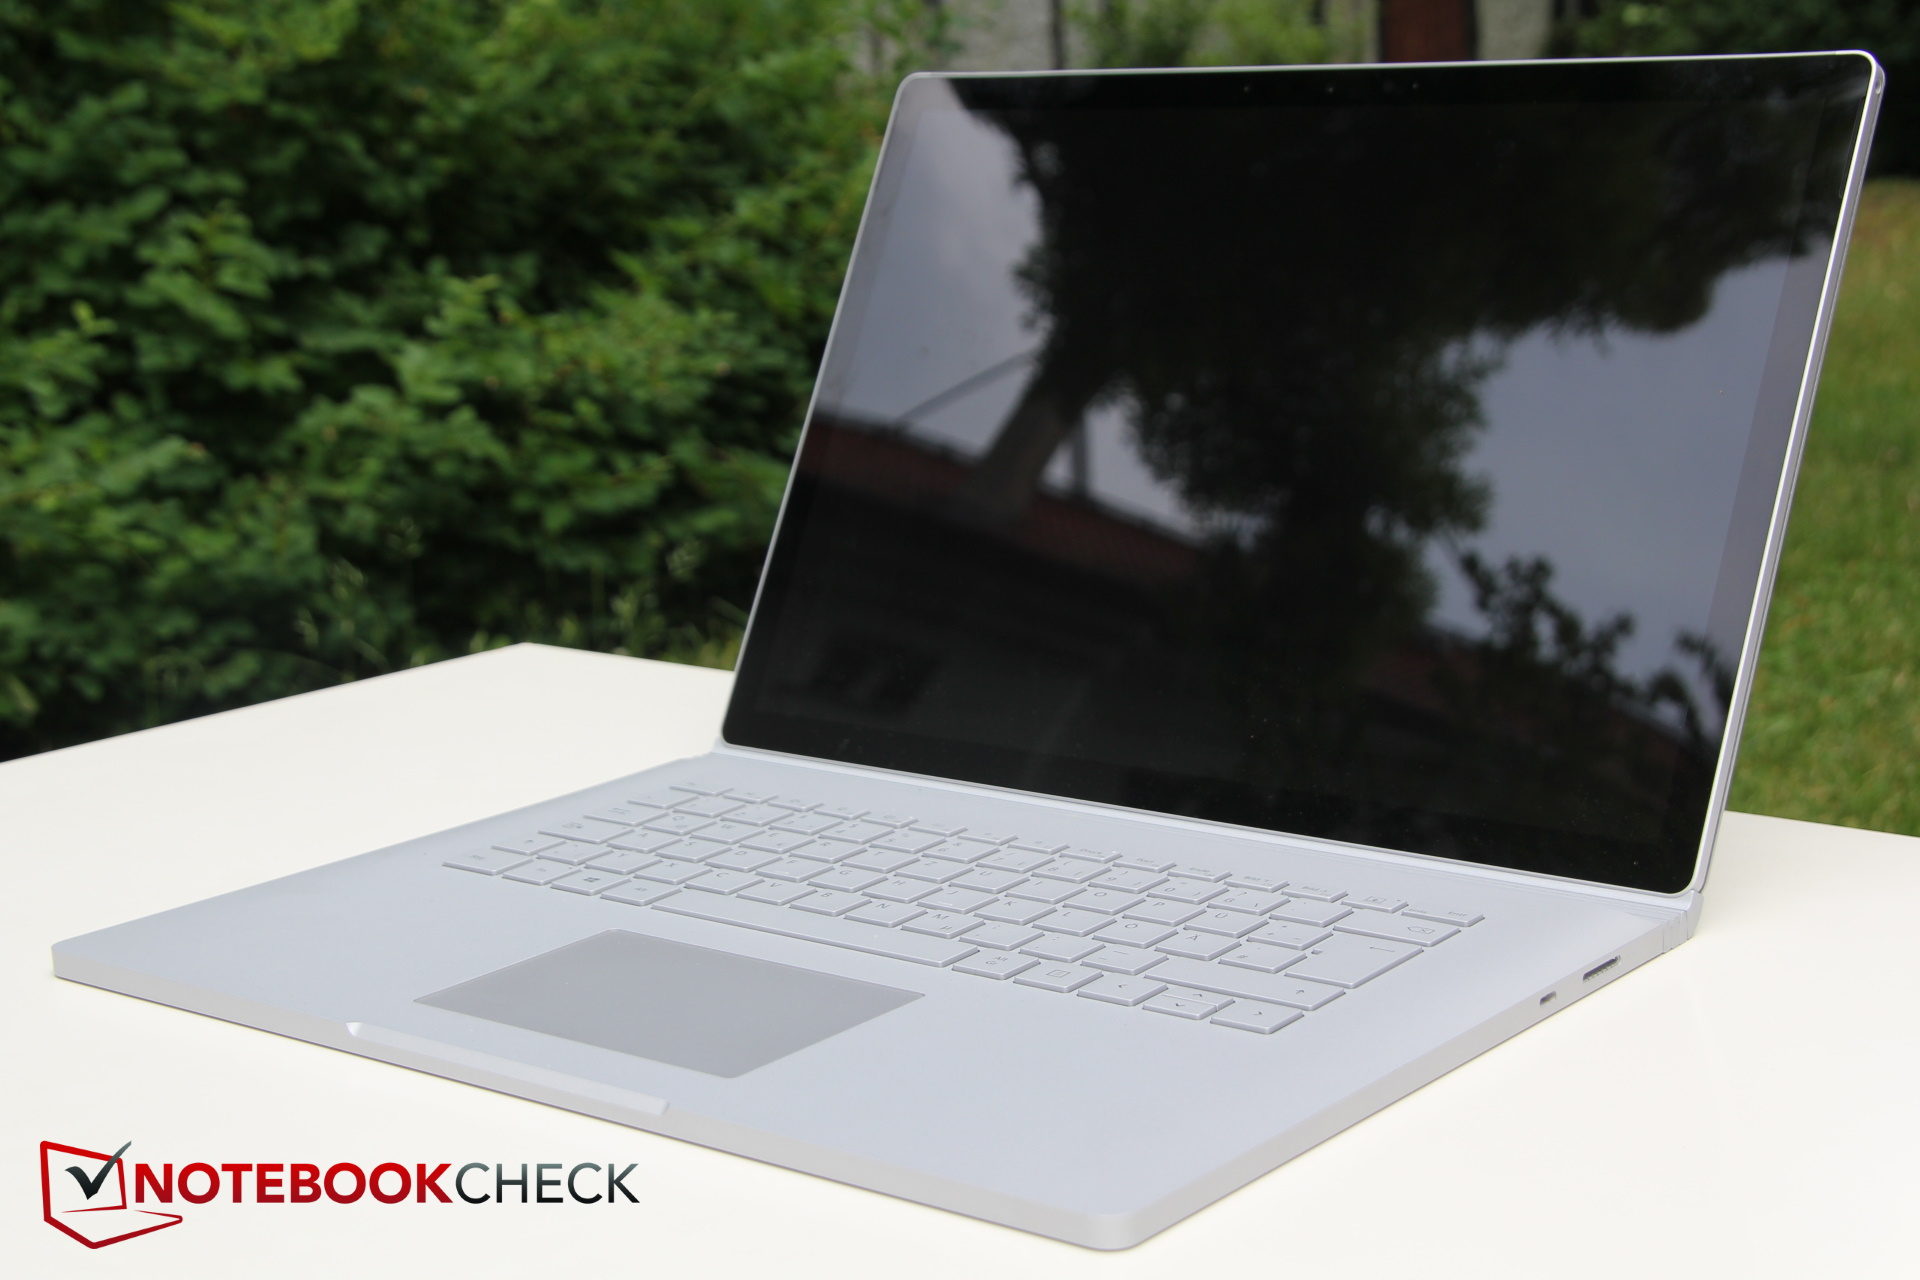
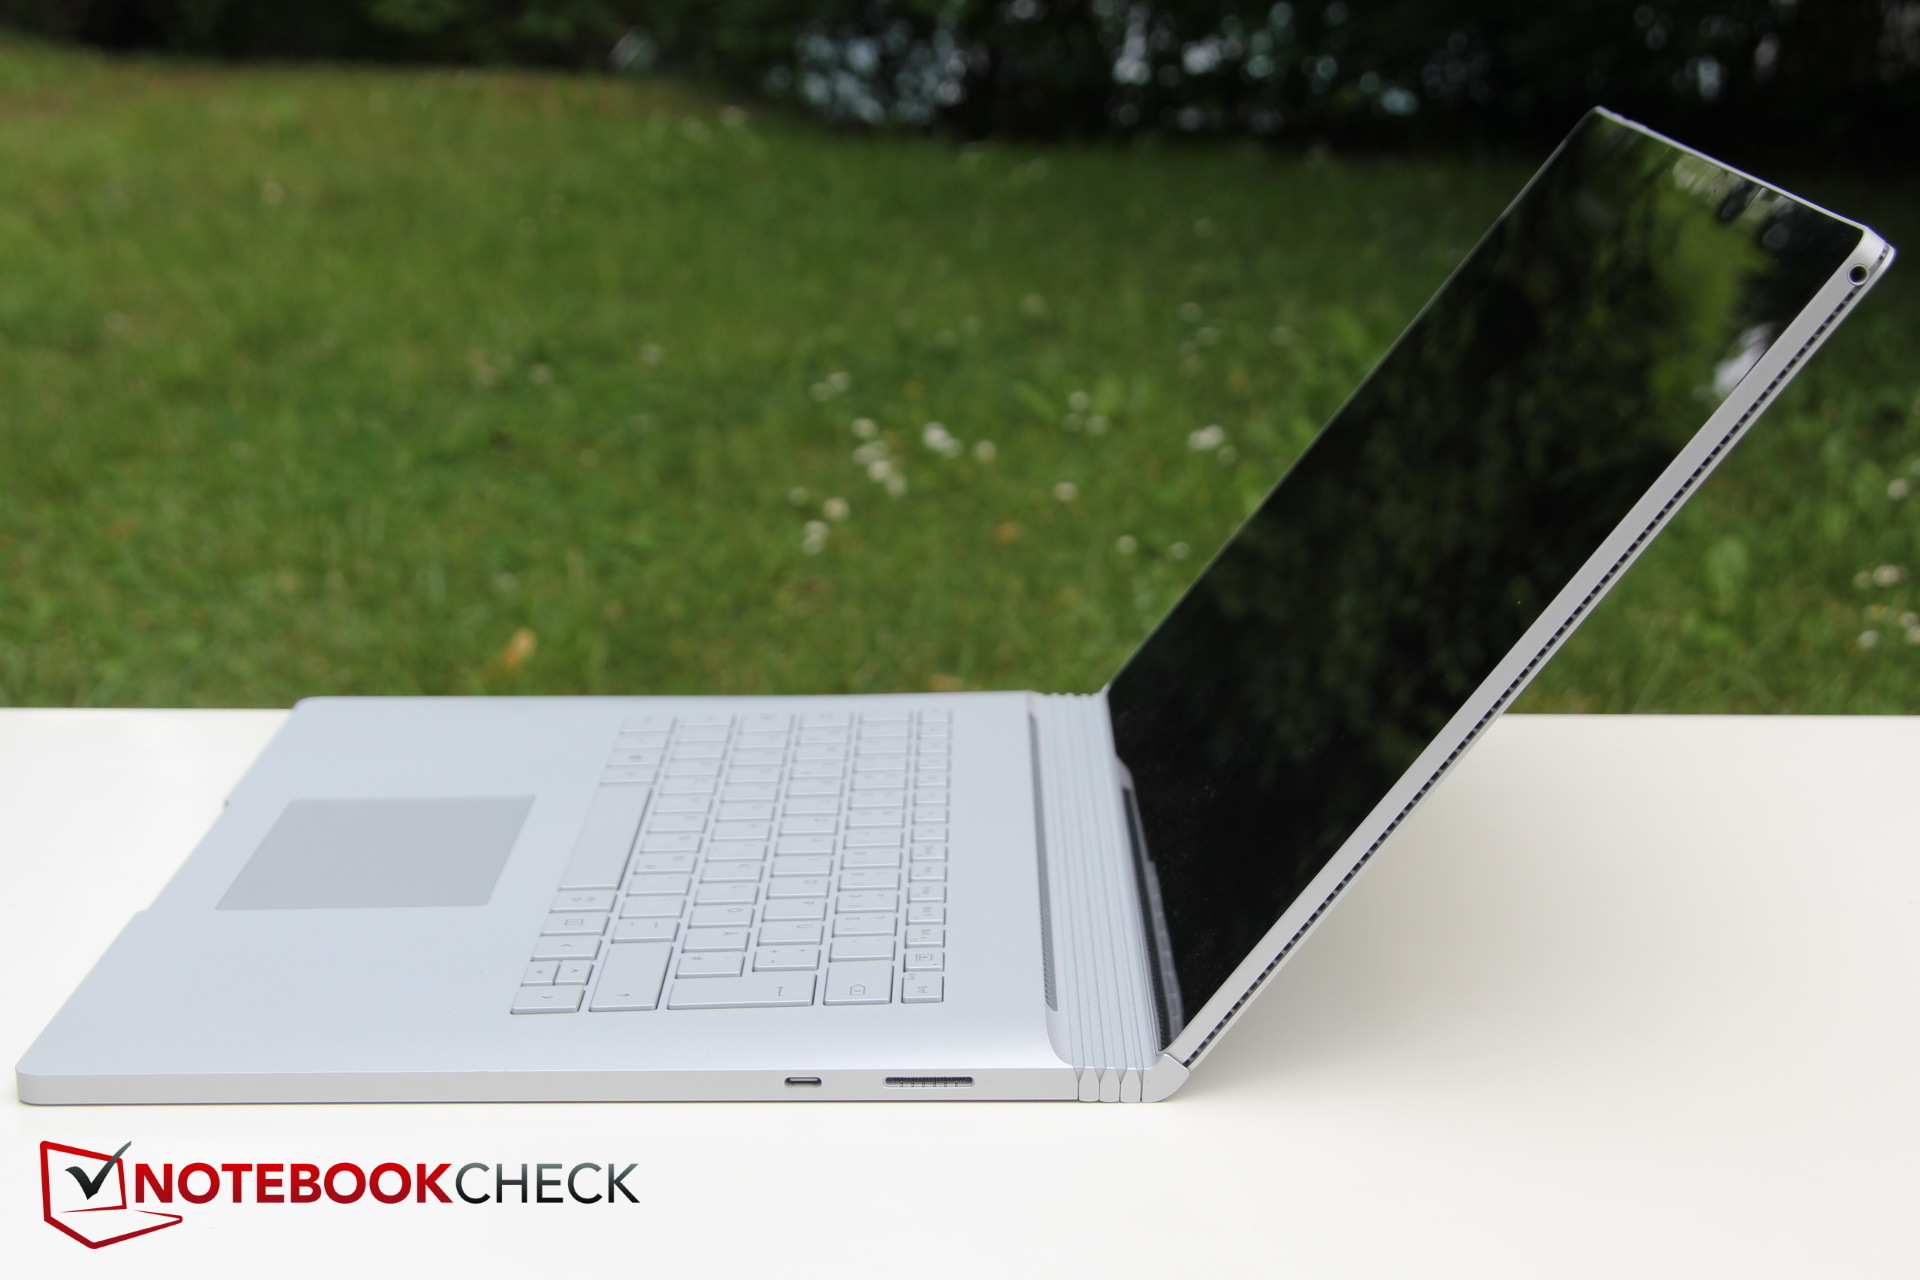
A Microsoft otimizou ainda mais sua família de dispositivos com melhorias substanciais em diversas áreas, como o aumento do nível de volume, por exemplo. A excelente tela de 4K, a poderosa combinação CPU/GPU e a qualidade de construção, bem como seu sólido mecanismo de acoplamento, continuam a surpreender. Da mesma forma, os dispositivos de entrada são sólidos.
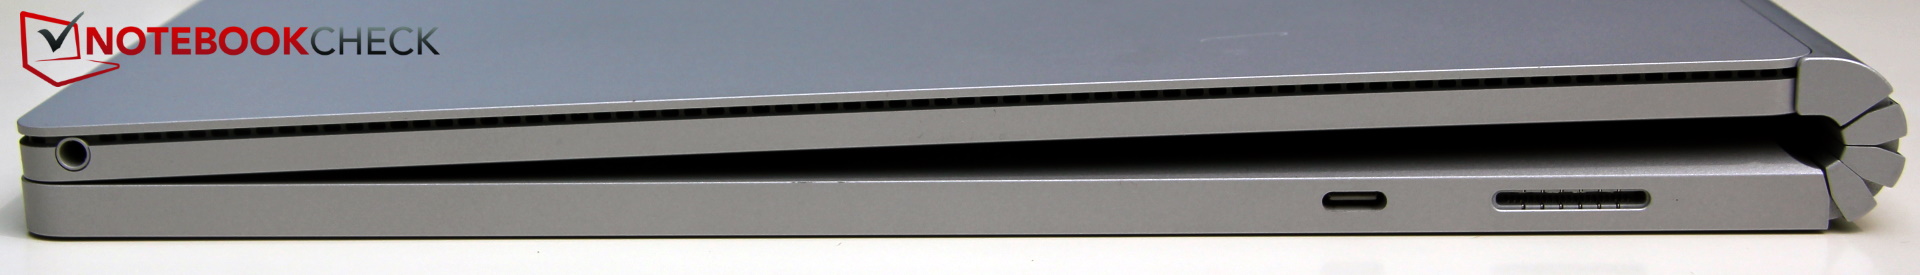
No entanto, esta não é uma atualização rigorosa: Um downgrade significativo de SSD nesta classe de preço é desconcertante. Ainda não há Thunderbolt e a Microsoft está tentando empurrar o dock muito caro para seus clientes. Além disso, gostaríamos de ter visto uma porta USB tipo C diretamente na unidade tablet e sua bateria também poderia ter sido maior.
Com o último Surface Book 15, a Microsoft tem feito a maioria das coisas bem. No entanto, não há nenhuma razão real para atualizar do previous model, o que tem até algumas vantagens em relação ao modelo mais novo.
Isso nos deixa com a questão de saber se o modelo mais novo é ainda melhor do que o anterior Surface Book 15. A interface USB foi atualizada da geração 1 par a. 2da geração, o nível de ruído sob carga caiu significativamente e houve também melhorias no desempenho 3D. Enquanto isso, o desempenho da CPU permanece inalterado na melhor das hipóteses e, como mencionado anteriormente, o SSD é mais lento. Embora o Surface Book 3 tenha uma ligeira vantagem, existem muito poucas boas razões para atualizar a partir de um Surface Book 2. Para quem pode pagar, o Surface Book 3 15 ainda é uma boa compra.
Microsoft Surface Book 3 15
- 06/29/2020 v7 (old)
Christian Hintze
Price comparison
