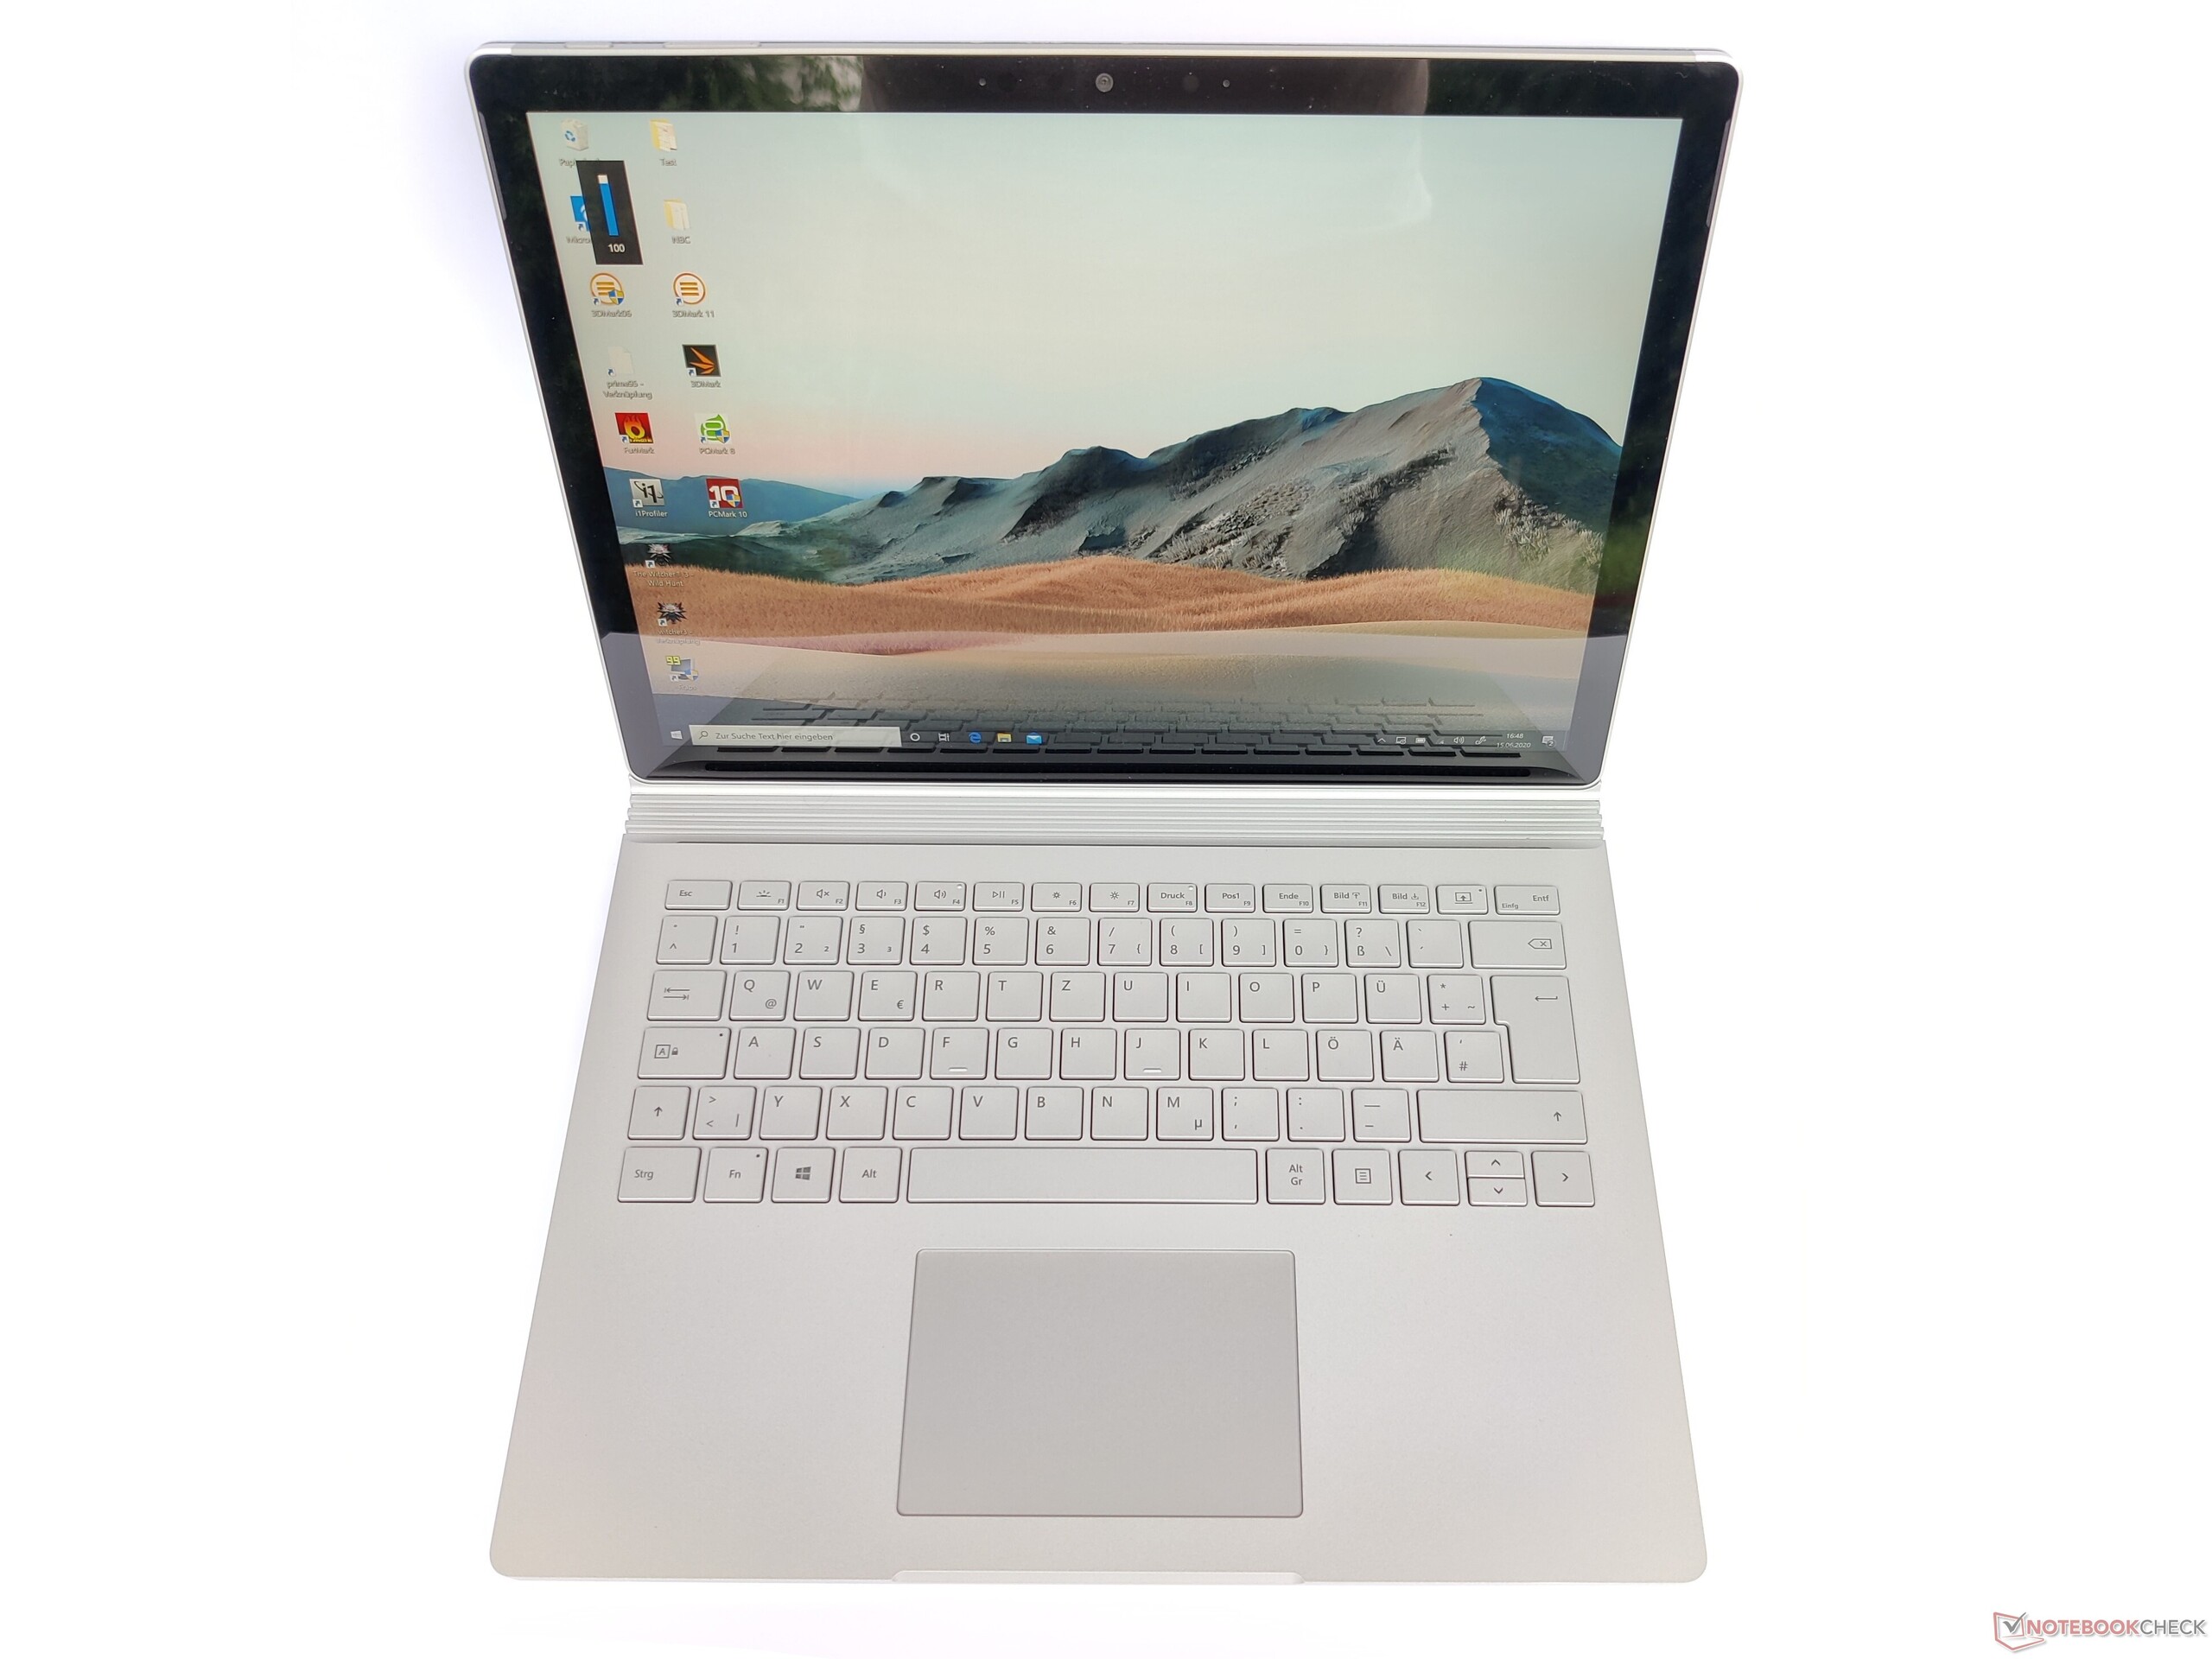
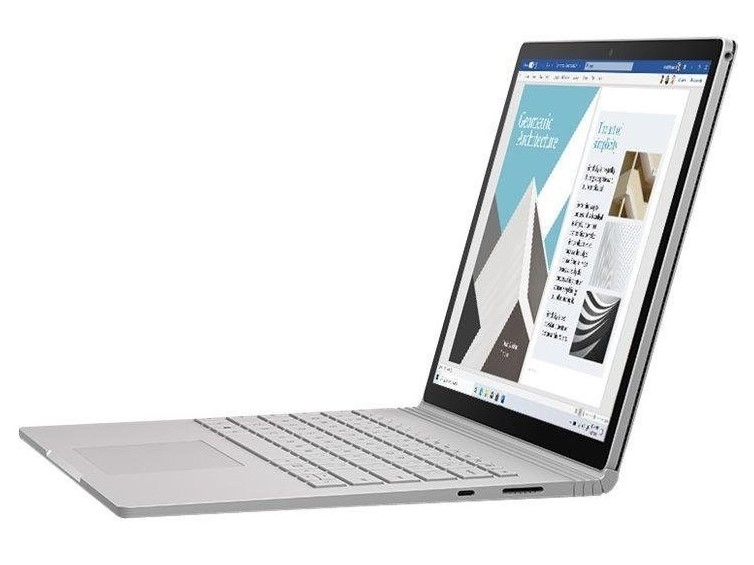
Breve Análise do Surface Book 3 13.5: O conversível da Microsoft está envelhecendo lentamente
Avaliação | Data | Modelo | Peso | Altura | Size | Resolução | Preço |
|---|---|---|---|---|---|---|---|
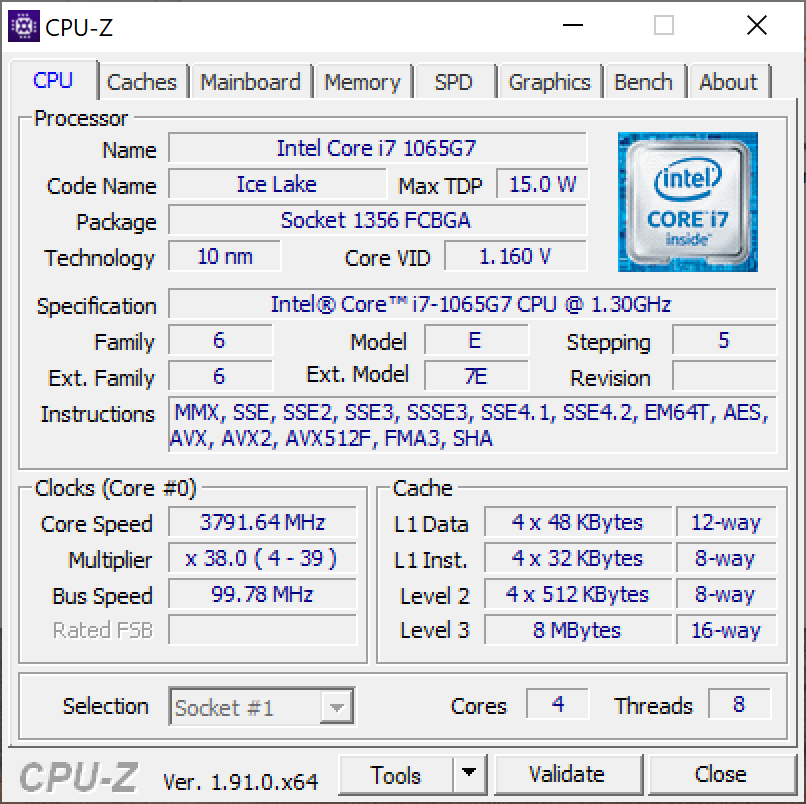
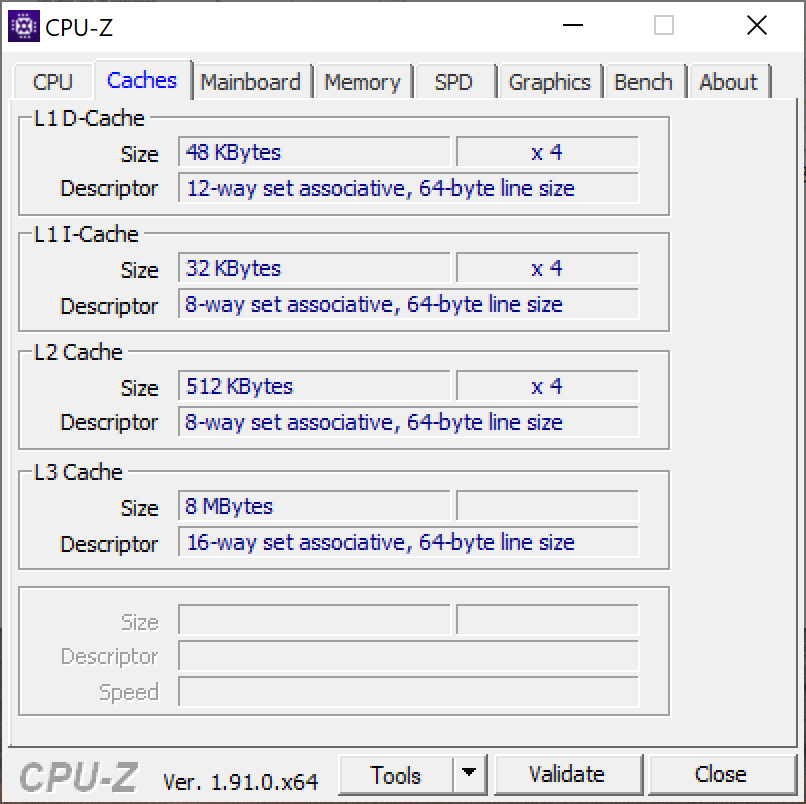
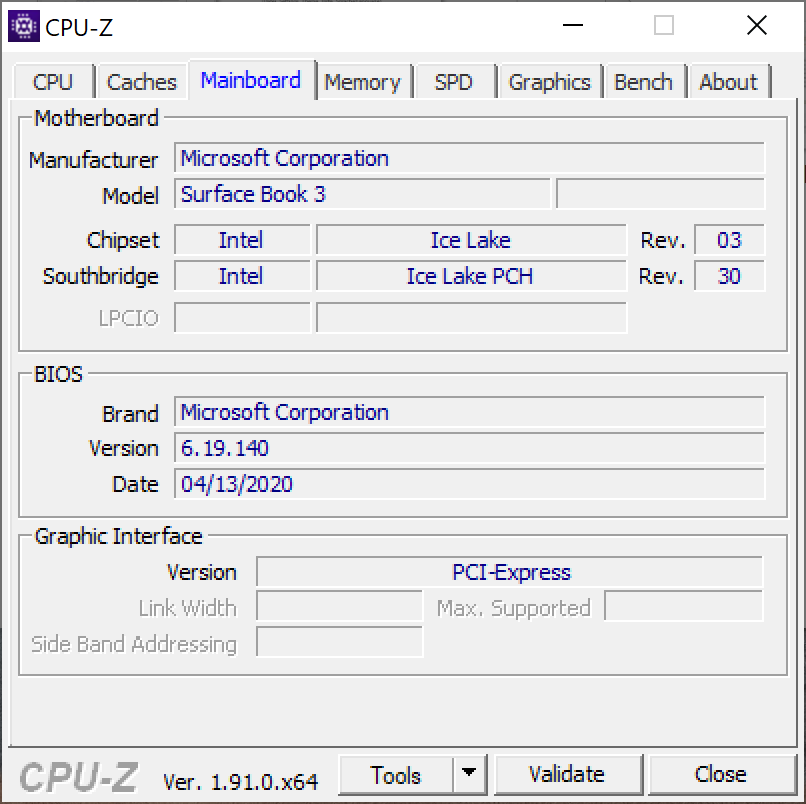
| 86.9 % v7 (old) | 06/2020 | Microsoft Surface Book 3 13.5 i7-1065G7, GeForce GTX 1650 Max-Q | 1.6 kg | 23 mm | 13.50" | 3000x2000 | |
| 85 % v7 (old) | Asus ZenBook Flip 14 UX463FA-AI039T i5-10210U, UHD Graphics 620 | 1.4 kg | 18 mm | 14.00" | 1920x1080 | ||
| 89.8 % v7 (old) | 04/2020 | Lenovo ThinkPad X1 Yoga 20SA000GUS i7-10510U, UHD Graphics 620 | 1.3 kg | 15.5 mm | 14.00" | 2560x1440 | |
| 88.1 % v7 (old) | 03/2020 | Microsoft Surface Pro 7 i7-1065G7, Iris Plus Graphics G7 (Ice Lake 64 EU) | 790 g | 8.5 mm | 12.30" | 2736x1824 | |
| 88.4 % v7 (old) | 12/2019 | HP Spectre x360 13-aw0013dx i7-1065G7, Iris Plus Graphics G7 (Ice Lake 64 EU) | 1.2 kg | 16.9 mm | 13.30" | 1920x1080 | |
| 87.4 % v6 (old) | 12/2017 | Microsoft Surface Book 2 i7-8650U, GeForce GTX 1050 Mobile | 1.6 kg | 23 mm | 13.50" | 3000x2000 |
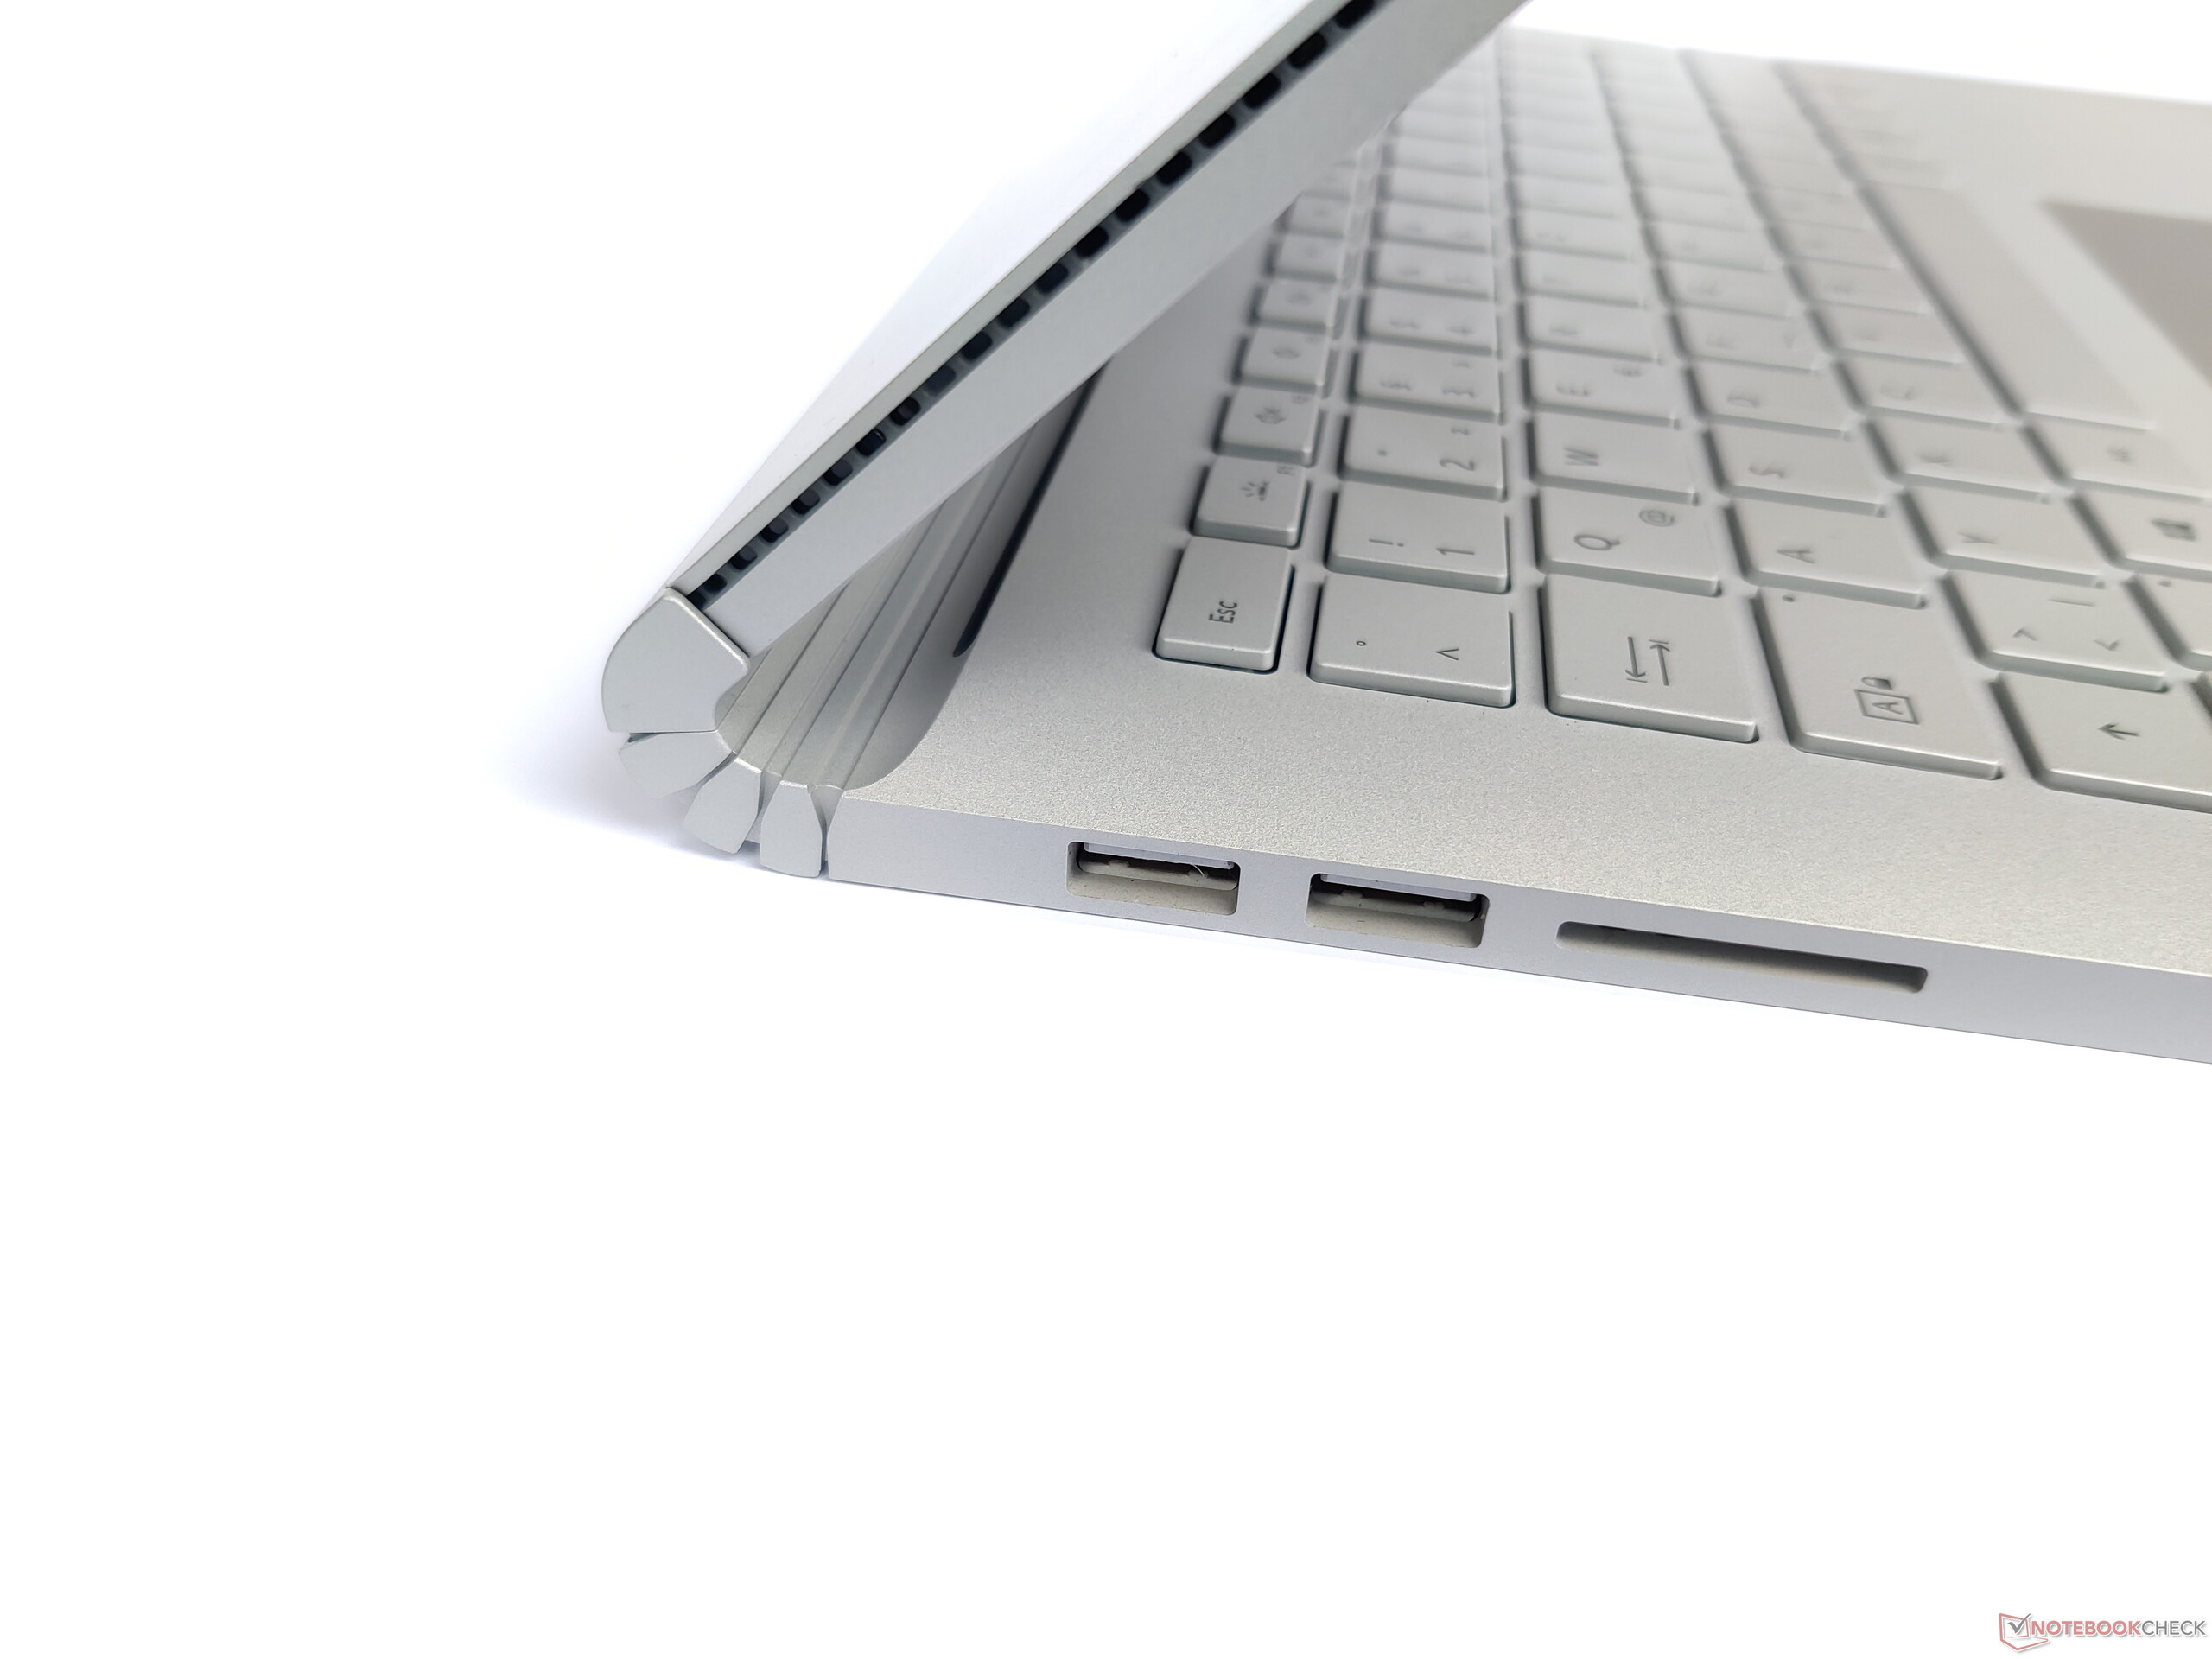
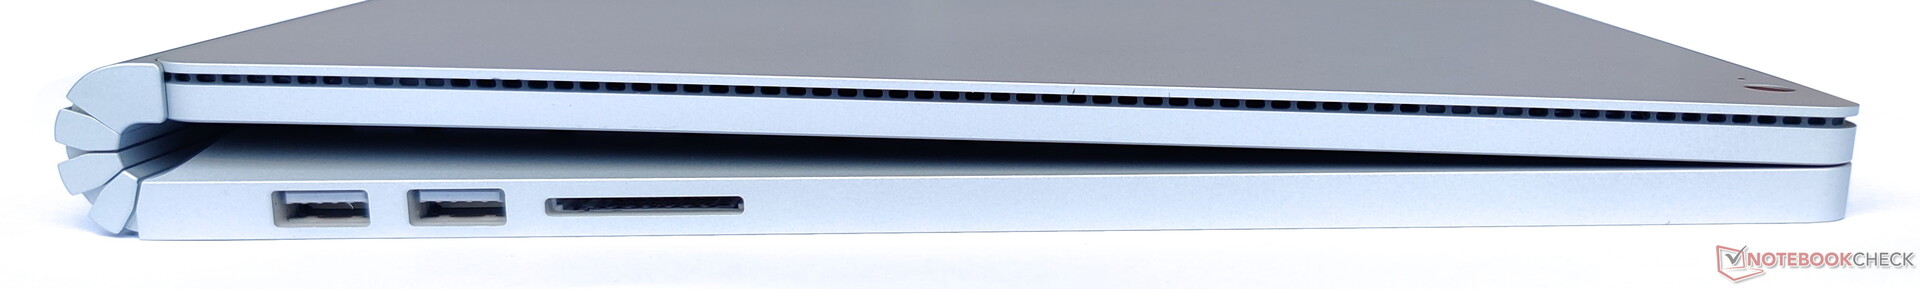
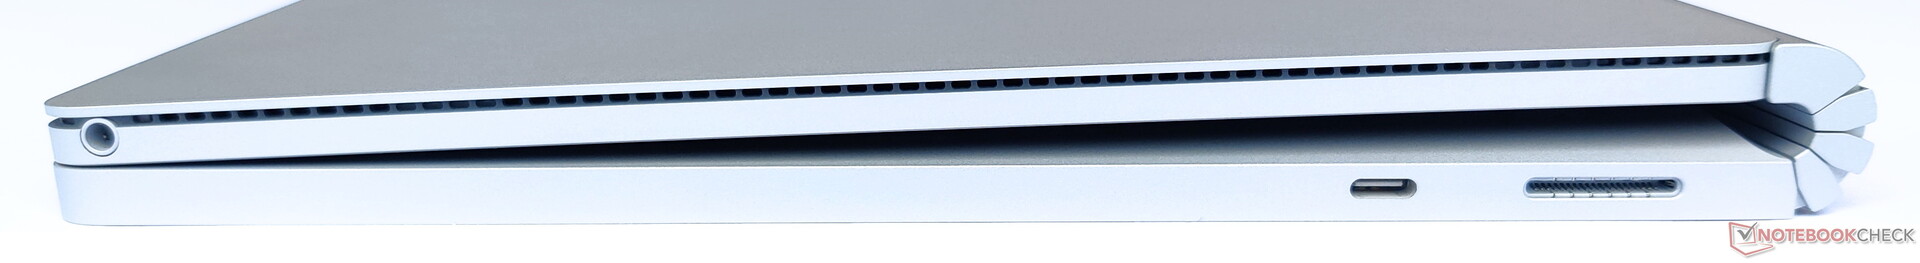
| SD Card Reader | |
| average JPG Copy Test (av. of 3 runs) | |
| HP Spectre x360 13-aw0013dx (Toshiba Exceria Pro M501 microSDXC 64GB) | |
| Microsoft Surface Book 3 13.5 (Toshiba Exceria Pro M501 microSDXC 64GB) | |
| Microsoft Surface Pro 7 (Toshiba Exceria Pro M501 microSDXC 64GB) | |
| Média da turma Convertible (29.4 - 141, n=20, últimos 2 anos) | |
| Asus ZenBook Flip 14 UX463FA-AI039T (Toshiba Exceria Pro M501 microSDXC 64GB) | |
| maximum AS SSD Seq Read Test (1GB) | |
| Microsoft Surface Book 3 13.5 (Toshiba Exceria Pro M501 microSDXC 64GB) | |
| HP Spectre x360 13-aw0013dx (Toshiba Exceria Pro M501 microSDXC 64GB) | |
| Média da turma Convertible (67.5 - 254, n=19, últimos 2 anos) | |
| Microsoft Surface Pro 7 (Toshiba Exceria Pro M501 microSDXC 64GB) | |
| Asus ZenBook Flip 14 UX463FA-AI039T (Toshiba Exceria Pro M501 microSDXC 64GB) | |
| Networking | |
| iperf3 transmit AX12 | |
| Asus ZenBook Flip 14 UX463FA-AI039T | |
| Lenovo ThinkPad X1 Yoga 20SA000GUS | |
| Média Intel Wi-Fi 6 AX201 (49.8 - 1775, n=324) | |
| Microsoft Surface Book 3 13.5 | |
| Microsoft Surface Pro 7 | |
| iperf3 receive AX12 | |
| Asus ZenBook Flip 14 UX463FA-AI039T | |
| Média Intel Wi-Fi 6 AX201 (136 - 1743, n=324) | |
| Lenovo ThinkPad X1 Yoga 20SA000GUS | |
| Microsoft Surface Book 3 13.5 | |
| Microsoft Surface Pro 7 | |


| |||||||||||||||||||||||||
iluminação: 86 %
iluminação com acumulador: 391 cd/m²
Contraste: 2058:1 (Preto: 0.19 cd/m²)
ΔE ColorChecker Calman: 3.07 | ∀{0.5-29.43 Ø4.71}
calibrated: 1.52
ΔE Greyscale Calman: 3.6 | ∀{0.09-98 Ø4.96}
95% sRGB (Argyll 1.6.3 3D)
61% AdobeRGB 1998 (Argyll 1.6.3 3D)
65.7% AdobeRGB 1998 (Argyll 3D)
95.1% sRGB (Argyll 3D)
63.5% Display P3 (Argyll 3D)
Gamma: 2.29
CCT: 6330 K
| Microsoft Surface Book 3 13.5 Panasonic MEI96A2, IPS, 3000x2000, 13.5" | Microsoft Surface Book 2 Panasonic MEI96A2 , IPS, 3000x2000, 13.5" | Asus ZenBook Flip 14 UX463FA-AI039T AU AUO323D, IPS, 1920x1080, 14" | Lenovo ThinkPad X1 Yoga 20SA000GUS AU Optronics B140QAN02.2, IPS, 2560x1440, 14" | HP Spectre x360 13-aw0013dx AU Optronics AUO5E2D, IPS, 1920x1080, 13.3" | |
|---|---|---|---|---|---|
| Display | 5% | -7% | 3% | 8% | |
| Display P3 Coverage (%) | 63.5 | 67.9 7% | 60.1 -5% | 66.6 5% | 69.6 10% |
| sRGB Coverage (%) | 95.1 | 95.7 1% | 85.5 -10% | 95.9 1% | 98.9 4% |
| AdobeRGB 1998 Coverage (%) | 65.7 | 69.4 6% | 61.1 -7% | 67.5 3% | 71.5 9% |
| Response Times | 14% | 32% | 41% | -2% | |
| Response Time Grey 50% / Grey 80% * (ms) | 57 ? | 52.8 ? 7% | 36 ? 37% | 32 ? 44% | 60.8 ? -7% |
| Response Time Black / White * (ms) | 38 ? | 30 ? 21% | 28 ? 26% | 23.6 ? 38% | 36.8 ? 3% |
| PWM Frequency (Hz) | |||||
| Screen | 10% | -30% | -7% | -22% | |
| Brightness middle (cd/m²) | 391 | 385 -2% | 280 -28% | 284.6 -27% | 447.4 14% |
| Brightness (cd/m²) | 367 | 372 1% | 286 -22% | 269 -27% | 420 14% |
| Brightness Distribution (%) | 86 | 89 3% | 78 -9% | 86 0% | 85 -1% |
| Black Level * (cd/m²) | 0.19 | 0.21 -11% | 0.208 -9% | 0.28 -47% | 0.31 -63% |
| Contrast (:1) | 2058 | 1833 -11% | 1346 -35% | 1016 -51% | 1443 -30% |
| Colorchecker dE 2000 * | 3.07 | 1.6 48% | 3.97 -29% | 2.07 33% | 4.23 -38% |
| Colorchecker dE 2000 max. * | 4.74 | 4.5 5% | 8.29 -75% | 3.75 21% | 9.34 -97% |
| Colorchecker dE 2000 calibrated * | 1.52 | 3.42 -125% | 2.05 -35% | 1.32 13% | |
| Greyscale dE 2000 * | 3.6 | 1.5 58% | 2.83 21% | 1.7 53% | 6.1 -69% |
| Gamma | 2.29 96% | 2.22 99% | 2.34 94% | 2.17 101% | 2.11 104% |
| CCT | 6330 103% | 6502 100% | 6556 99% | 6627 98% | 6136 106% |
| Color Space (Percent of AdobeRGB 1998) (%) | 61 | 64 5% | 56 -8% | 61.7 1% | 64.8 6% |
| Color Space (Percent of sRGB) (%) | 95 | 95.9 1% | 85 -11% | 95.8 1% | 98.9 4% |
| Média Total (Programa/Configurações) | 10% /
9% | -2% /
-18% | 12% /
1% | -5% /
-14% |
* ... menor é melhor
Exibir tempos de resposta
| ↔ Tempo de resposta preto para branco | ||
|---|---|---|
| 38 ms ... ascensão ↗ e queda ↘ combinadas | ↗ 22 ms ascensão | 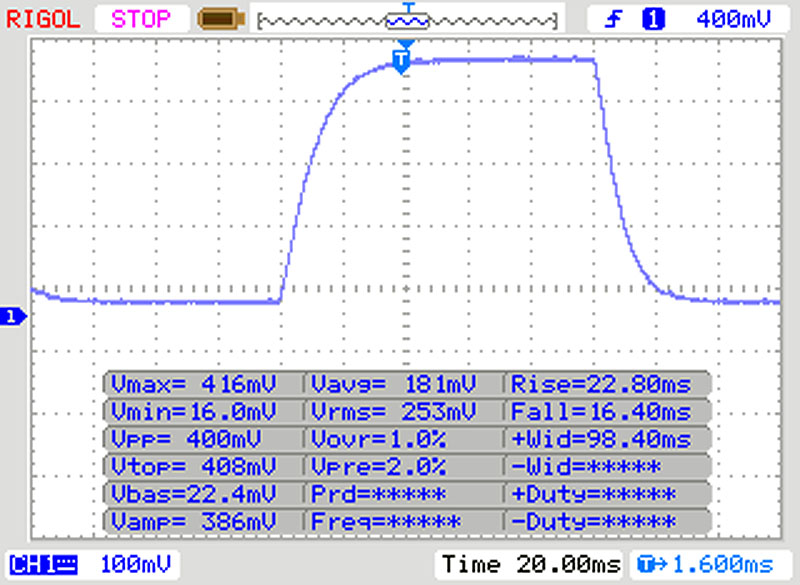 |
| ↘ 16 ms queda | ||
| A tela mostra taxas de resposta lentas em nossos testes e será insatisfatória para os jogadores. Em comparação, todos os dispositivos testados variam de 0.1 (mínimo) a 240 (máximo) ms. » 96 % de todos os dispositivos são melhores. Isso significa que o tempo de resposta medido é pior que a média de todos os dispositivos testados (19.8 ms). | ||
| ↔ Tempo de resposta 50% cinza a 80% cinza | ||
| 57 ms ... ascensão ↗ e queda ↘ combinadas | ↗ 28 ms ascensão | 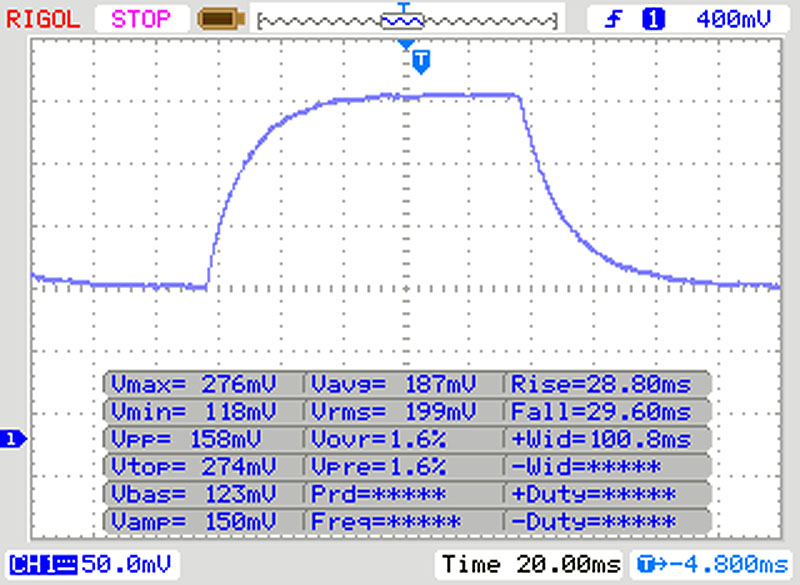 |
| ↘ 29 ms queda | ||
| A tela mostra taxas de resposta lentas em nossos testes e será insatisfatória para os jogadores. Em comparação, todos os dispositivos testados variam de 0.165 (mínimo) a 636 (máximo) ms. » 94 % de todos os dispositivos são melhores. Isso significa que o tempo de resposta medido é pior que a média de todos os dispositivos testados (31 ms). | ||
Cintilação da tela / PWM (modulação por largura de pulso)
| Tela tremeluzindo / PWM não detectado | 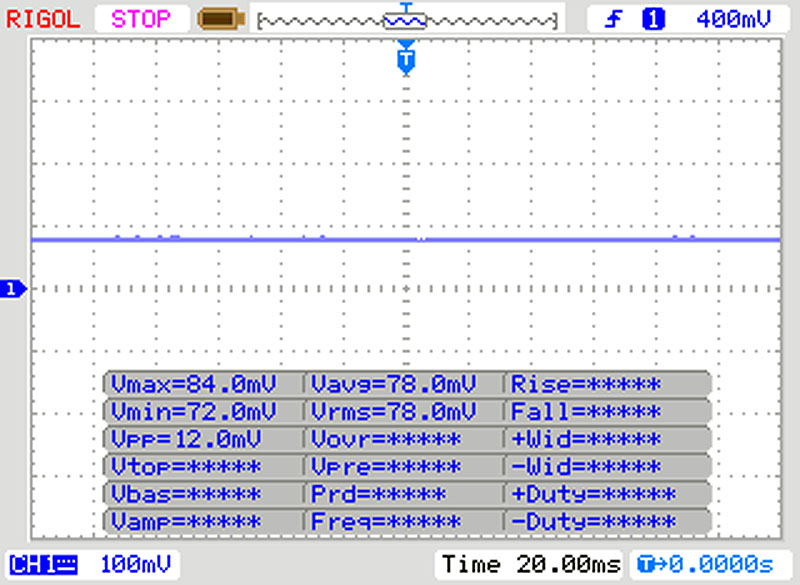 | ||
[pwm_comparison] Em comparação: 52 % de todos os dispositivos testados não usam PWM para escurecer a tela. Se PWM foi detectado, uma média de 7757 (mínimo: 5 - máximo: 343500) Hz foi medida. | |||
Cinebench R15: CPU Single 64Bit | CPU Multi 64Bit
Blender: v2.79 BMW27 CPU
7-Zip 18.03: 7z b 4 -mmt1 | 7z b 4
Geekbench 5.5: Single-Core | Multi-Core
HWBOT x265 Benchmark v2.2: 4k Preset
LibreOffice : 20 Documents To PDF
R Benchmark 2.5: Overall mean
| Cinebench R20 / CPU (Single Core) | |
| Média da turma Convertible (273 - 834, n=48, últimos 2 anos) | |
| Microsoft Surface Pro 7 | |
| Lenovo ThinkPad X1 Yoga 20SA000GUS | |
| Média Intel Core i7-1065G7 (358 - 474, n=31) | |
| Microsoft Surface Book 3 13.5 | |
| HP Spectre x360 13-aw0013dx | |
| Cinebench R20 / CPU (Multi Core) | |
| Média da turma Convertible (595 - 12102, n=48, últimos 2 anos) | |
| Microsoft Surface Pro 7 | |
| HP Spectre x360 13-aw0013dx | |
| Lenovo ThinkPad X1 Yoga 20SA000GUS | |
| Média Intel Core i7-1065G7 (1081 - 2024, n=31) | |
| Microsoft Surface Book 3 13.5 | |
| Cinebench R15 / CPU Single 64Bit | |
| Média da turma Convertible (149.8 - 317, n=47, últimos 2 anos) | |
| Microsoft Surface Pro 7 | |
| Lenovo ThinkPad X1 Yoga 20SA000GUS | |
| Microsoft Surface Book 3 13.5 | |
| HP Spectre x360 13-aw0013dx | |
| Microsoft Surface Book 2 | |
| Média Intel Core i7-1065G7 (141 - 190, n=35) | |
| Asus ZenBook Flip 14 UX463FA-AI039T | |
| Cinebench R15 / CPU Multi 64Bit | |
| Média da turma Convertible (478 - 4940, n=47, últimos 2 anos) | |
| Microsoft Surface Pro 7 | |
| Lenovo ThinkPad X1 Yoga 20SA000GUS | |
| Asus ZenBook Flip 14 UX463FA-AI039T | |
| Microsoft Surface Book 2 | |
| Média Intel Core i7-1065G7 (288 - 836, n=36) | |
| HP Spectre x360 13-aw0013dx | |
| Microsoft Surface Book 3 13.5 | |
| Blender / v2.79 BMW27 CPU | |
| Microsoft Surface Book 3 13.5 | |
| Média Intel Core i7-1065G7 (675 - 1650, n=23) | |
| Lenovo ThinkPad X1 Yoga 20SA000GUS | |
| Média da turma Convertible (105 - 1051, n=47, últimos 2 anos) | |
| 7-Zip 18.03 / 7z b 4 -mmt1 | |
| Média da turma Convertible (3672 - 6655, n=47, últimos 2 anos) | |
| Lenovo ThinkPad X1 Yoga 20SA000GUS | |
| Média Intel Core i7-1065G7 (3289 - 4589, n=24) | |
| Microsoft Surface Book 3 13.5 | |
| 7-Zip 18.03 / 7z b 4 | |
| Média da turma Convertible (12977 - 121368, n=47, últimos 2 anos) | |
| Média Intel Core i7-1065G7 (10406 - 22898, n=24) | |
| Lenovo ThinkPad X1 Yoga 20SA000GUS | |
| Microsoft Surface Book 3 13.5 | |
| Geekbench 5.5 / Single-Core | |
| Média da turma Convertible (806 - 2275, n=48, últimos 2 anos) | |
| Microsoft Surface Book 3 13.5 | |
| Média Intel Core i7-1065G7 (948 - 1348, n=18) | |
| Lenovo ThinkPad X1 Yoga 20SA000GUS | |
| Geekbench 5.5 / Multi-Core | |
| Média da turma Convertible (1608 - 22023, n=48, últimos 2 anos) | |
| Lenovo ThinkPad X1 Yoga 20SA000GUS | |
| Média Intel Core i7-1065G7 (2464 - 4855, n=18) | |
| Microsoft Surface Book 3 13.5 | |
| HWBOT x265 Benchmark v2.2 / 4k Preset | |
| Média da turma Convertible (3.43 - 36.2, n=47, últimos 2 anos) | |
| Lenovo ThinkPad X1 Yoga 20SA000GUS | |
| Média Intel Core i7-1065G7 (2.2 - 6.38, n=22) | |
| Microsoft Surface Book 3 13.5 | |
| LibreOffice / 20 Documents To PDF | |
| Microsoft Surface Book 3 13.5 | |
| Média Intel Core i7-1065G7 (46.9 - 85.3, n=19) | |
| Média da turma Convertible (42.5 - 84.3, n=47, últimos 2 anos) | |
| Lenovo ThinkPad X1 Yoga 20SA000GUS | |
| R Benchmark 2.5 / Overall mean | |
| Microsoft Surface Book 3 13.5 | |
| Média Intel Core i7-1065G7 (0.661 - 0.798, n=18) | |
| Lenovo ThinkPad X1 Yoga 20SA000GUS | |
| Média da turma Convertible (0.3915 - 0.84, n=47, últimos 2 anos) | |
* ... menor é melhor
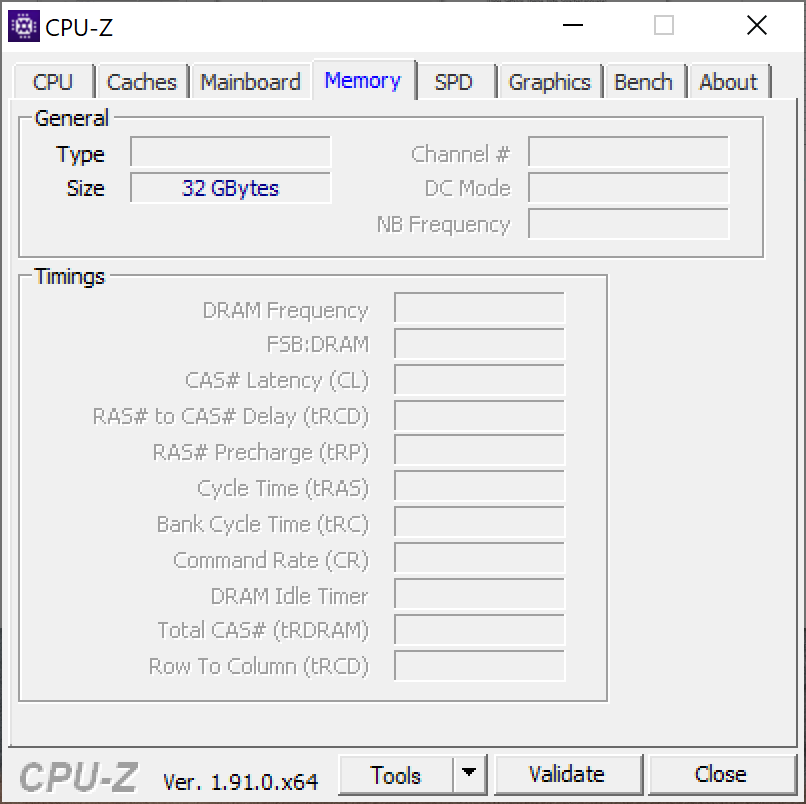
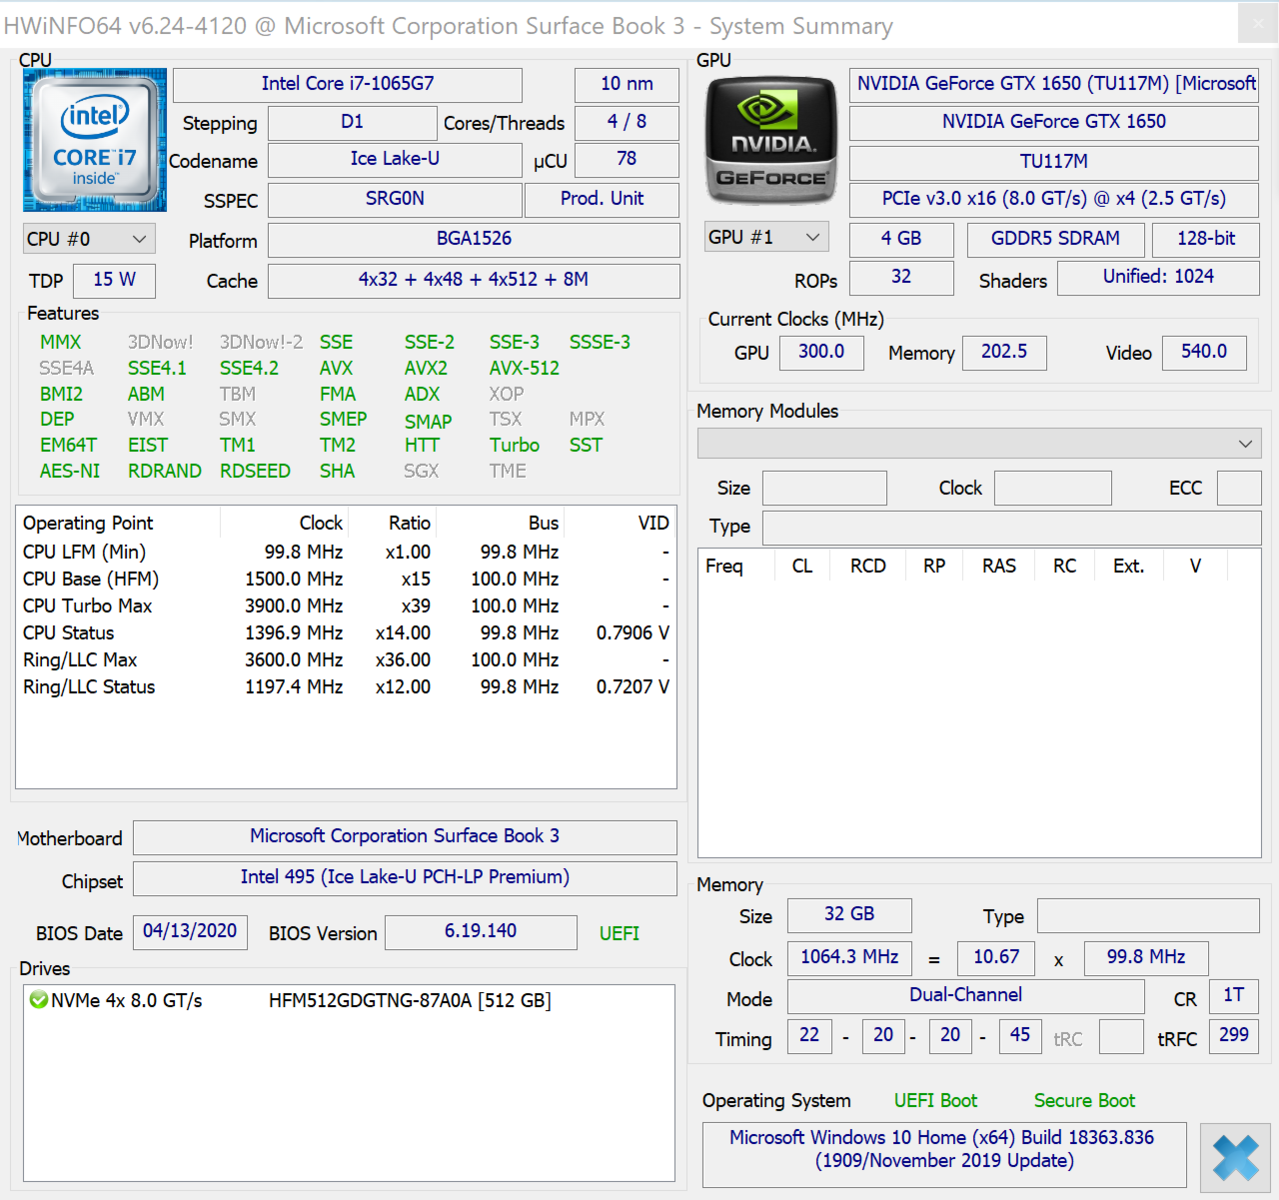
| PCMark 8 Home Score Accelerated v2 | 3369 pontos | |
| PCMark 8 Work Score Accelerated v2 | 4466 pontos | |
| PCMark 10 Score | 4184 pontos | |
Ajuda | ||
| DPC Latencies / LatencyMon - interrupt to process latency (max), Web, Youtube, Prime95 | |
| Lenovo ThinkPad X1 Yoga 20SA000GUS | |
| Microsoft Surface Book 3 13.5 | |
| Asus ZenBook Flip 14 UX463FA-AI039T | |
* ... menor é melhor
| Microsoft Surface Book 3 13.5 SK Hynix BC501 HFM512GDJTNG | Microsoft Surface Book 2 Samsung PM961 MZVLW256HEHP | Asus ZenBook Flip 14 UX463FA-AI039T Kingston RBUSNS8154P3512GJ1 | Lenovo ThinkPad X1 Yoga 20SA000GUS WDC PC SN730 SDBQNTY-512GB | HP Spectre x360 13-aw0013dx Intel Optane Memory H10 with Solid State Storage 32GB + 512GB HBRPEKNX0202A(L/H) | Microsoft Surface Pro 7 Toshiba KBG40ZNS256G NVMe | Média SK Hynix BC501 HFM512GDJTNG | |
|---|---|---|---|---|---|---|---|
| CrystalDiskMark 5.2 / 6 | 17% | -0% | 94% | 45% | 65% | 4% | |
| Write 4K (MB/s) | 88.4 | 140.6 59% | 54.6 -38% | 152 72% | 112.6 27% | 131.3 49% | 95.5 ? 8% |
| Read 4K (MB/s) | 39.53 | 43.62 10% | 28.19 -29% | 45.96 16% | 131 231% | 52.4 33% | 38.3 ? -3% |
| Write Seq (MB/s) | 691 | 343.3 -50% | 840 22% | 2069 199% | 458.9 -34% | 1613 133% | 759 ? 10% |
| Read Seq (MB/s) | 1032 | 1452 41% | 905 -12% | 1708 66% | 1355 31% | 1613 56% | 1022 ? -1% |
| Write 4K Q32T1 (MB/s) | 279.6 | 344.4 23% | 409.5 46% | 465.4 66% | 341.3 22% | 411.6 47% | 303 ? 8% |
| Read 4K Q32T1 (MB/s) | 261.6 | 457.2 75% | 292.4 12% | 410.1 57% | 320.6 23% | 415.6 59% | 317 ? 21% |
| Write Seq Q32T1 (MB/s) | 868 | 344.3 -60% | 1038 20% | 2713 213% | 1219 40% | 2340 170% | 885 ? 2% |
| Read Seq Q32T1 (MB/s) | 2075 | 2885 39% | 1607 -23% | 3399 64% | 2462 19% | 1568 -24% | 1803 ? -13% |
| Write 4K Q8T8 (MB/s) | 410.9 | 306 ? | |||||
| Read 4K Q8T8 (MB/s) | 1033 | 698 ? | |||||
| AS SSD | -22% | 38% | -37% | -19% | 4% | ||
| Seq Read (MB/s) | 1707 | 1336 -22% | 1939 14% | 1039 -39% | 1881 10% | 1323 ? -22% | |
| Seq Write (MB/s) | 510 | 653 28% | 1380 171% | 310.1 -39% | 703 38% | 697 ? 37% | |
| 4K Read (MB/s) | 38.77 | 26.65 -31% | 41.38 7% | 76 96% | 52.3 35% | 40.4 ? 4% | |
| 4K Write (MB/s) | 100.9 | 52.7 -48% | 154.9 54% | 118 17% | 154.1 53% | 100.8 ? 0% | |
| 4K-64 Read (MB/s) | 630 | 644 2% | 970 54% | 371.8 -41% | 1048 66% | 686 ? 9% | |
| 4K-64 Write (MB/s) | 707 | 482.9 -32% | 990 40% | 469.5 -34% | 703 -1% | 660 ? -7% | |
| Access Time Read * (ms) | 0.085 | 0.074 13% | 0.055 35% | 0.067 21% | 0.069 19% | 0.06071 ? 29% | |
| Access Time Write * (ms) | 0.035 | 0.072 -106% | 0.07 -100% | 0.138 -294% | 0.221 -531% | 0.037 ? -6% | |
| Score Read (Points) | 839 | 804 -4% | 1205 44% | 552 -34% | 1288 54% | 858 ? 2% | |
| Score Write (Points) | 859 | 601 -30% | 1283 49% | 618 -28% | 927 8% | 830 ? -3% | |
| Score Total (Points) | 2077 | 1786 -14% | 3083 48% | 1448 -30% | 2826 36% | 2107 ? 1% | |
| Copy ISO MB/s (MB/s) | 2074 | 764 | 1160 | 802 ? | |||
| Copy Program MB/s (MB/s) | 630 | 465.8 | 454.7 | 265 ? | |||
| Copy Game MB/s (MB/s) | 1326 | 764 | 991 | 487 ? | |||
| Média Total (Programa/Configurações) | 17% /
17% | -11% /
-13% | 66% /
62% | 4% /
-2% | 23% /
16% | 4% /
4% |
* ... menor é melhor

Continuous reading: DiskSpd Read Loop, Queue Depth 8
| 3DMark 11 - 1280x720 Performance GPU | |
| Média NVIDIA GeForce GTX 1650 Max-Q (10248 - 12259, n=14) | |
| Microsoft Surface Book 3 13.5 | |
| Média da turma Convertible (1505 - 40732, n=47, últimos 2 anos) | |
| Microsoft Surface Book 2 | |
| HP Spectre x360 13-aw0013dx | |
| Microsoft Surface Pro 7 | |
| Lenovo ThinkPad X1 Yoga 20SA000GUS | |
| Asus ZenBook Flip 14 UX463FA-AI039T | |
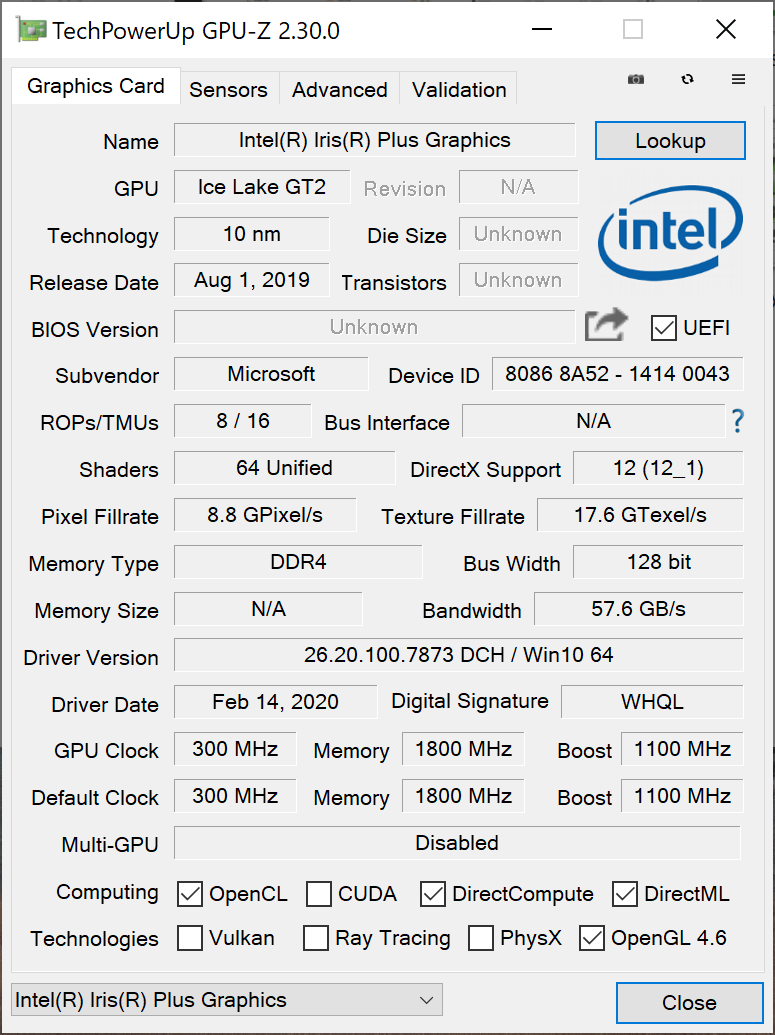
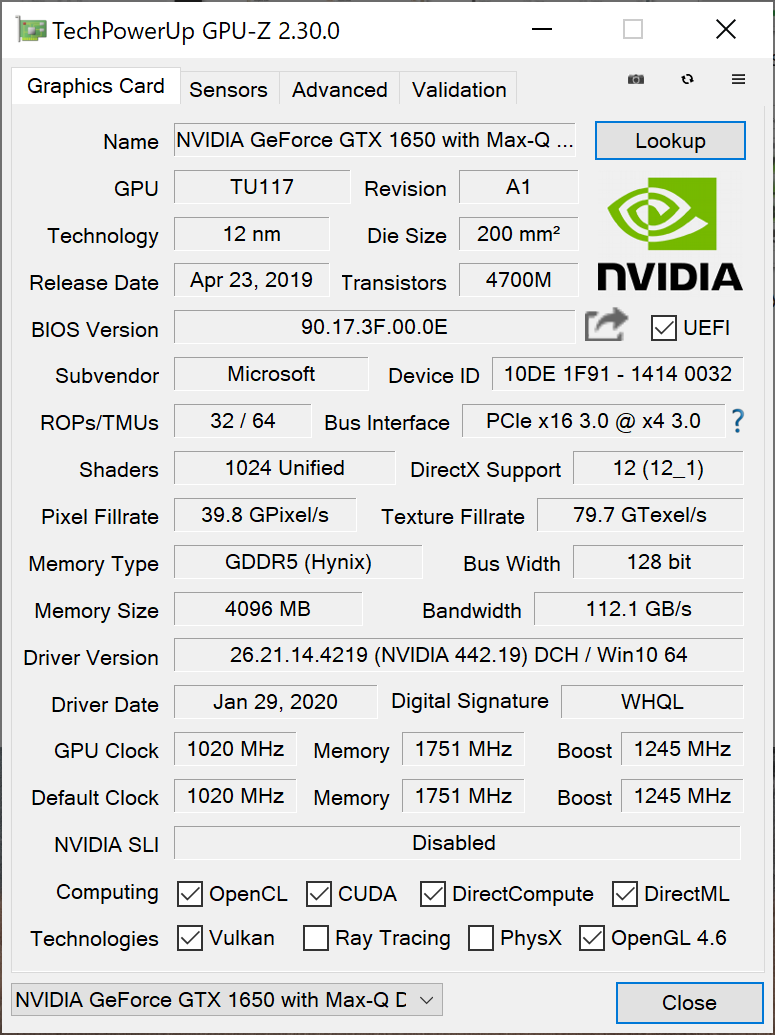
| 3DMark 11 Performance | 9665 pontos | |
| 3DMark Cloud Gate Standard Score | 15476 pontos | |
| 3DMark Fire Strike Score | 6602 pontos | |
Ajuda | ||
| Dota 2 Reborn | |
| 1280x720 min (0/3) fastest | |
| Média NVIDIA GeForce GTX 1650 Max-Q (61.2 - 158.2, n=5) | |
| Média da turma Convertible (66.1 - 223, n=48, últimos 2 anos) | |
| Asus ZenBook Flip 14 UX463FA-AI039T | |
| Lenovo ThinkPad X1 Yoga 20SA000GUS | |
| Microsoft Surface Book 3 13.5 | |
| 1366x768 med (1/3) | |
| Média NVIDIA GeForce GTX 1650 Max-Q (76.5 - 130.9, n=5) | |
| Microsoft Surface Book 3 13.5 | |
| Média da turma Convertible (38.2 - 192.3, n=48, últimos 2 anos) | |
| Lenovo ThinkPad X1 Yoga 20SA000GUS | |
| Asus ZenBook Flip 14 UX463FA-AI039T | |
| 1920x1080 high (2/3) | |
| Média NVIDIA GeForce GTX 1650 Max-Q (71.2 - 128, n=5) | |
| Microsoft Surface Book 3 13.5 | |
| Média da turma Convertible (20.2 - 164.4, n=48, últimos 2 anos) | |
| Lenovo ThinkPad X1 Yoga 20SA000GUS | |
| Asus ZenBook Flip 14 UX463FA-AI039T | |
| 1920x1080 ultra (3/3) best looking | |
| Média NVIDIA GeForce GTX 1650 Max-Q (64.4 - 105.6, n=5) | |
| Microsoft Surface Book 3 13.5 | |
| Média da turma Convertible (18.8 - 142, n=48, últimos 2 anos) | |
| Lenovo ThinkPad X1 Yoga 20SA000GUS | |
| Asus ZenBook Flip 14 UX463FA-AI039T | |
| baixo | média | alto | ultra | |
|---|---|---|---|---|
| The Witcher 3 (2015) | 141.5 | 83.2 | 41.5 | 30.1 |
| Dota 2 Reborn (2015) | 61.2 | 85.6 | 81.6 | 68.3 |
| X-Plane 11.11 (2018) | 83.5 | 57.2 | 51.8 |
Barulho
| Ocioso |
| 30.2 / 30.2 / 30.2 dB |
| Carga |
| 32.4 / 33.6 dB |
 | ||
30 dB silencioso 40 dB(A) audível 50 dB(A) ruidosamente alto |
||
min: | ||
(±) A temperatura máxima no lado superior é 41 °C / 106 F, em comparação com a média de 35.4 °C / 96 F , variando de 19.6 a 60 °C para a classe Convertible.
(±) A parte inferior aquece até um máximo de 43.7 °C / 111 F, em comparação com a média de 36.9 °C / 98 F
(+) Em uso inativo, a temperatura média para o lado superior é 27.2 °C / 81 F, em comparação com a média do dispositivo de 30.3 °C / ### class_avg_f### F.
(-) Jogando The Witcher 3, a temperatura média para o lado superior é 38.9 °C / 102 F, em comparação com a média do dispositivo de 30.3 °C / ## #class_avg_f### F.
(-) Os apoios para as mãos e o touchpad podem ficar muito quentes ao toque, com um máximo de 41.8 °C / 107.2 F.
(-) A temperatura média da área do apoio para as mãos de dispositivos semelhantes foi 28 °C / 82.4 F (-13.8 °C / -24.8 F).
Microsoft Surface Book 3 13.5 análise de áudio
(-) | alto-falantes não muito altos (###valor### dB)
Graves 100 - 315Hz
(±) | graves reduzidos - em média 10.4% menor que a mediana
(±) | a linearidade dos graves é média (8.2% delta para a frequência anterior)
Médios 400 - 2.000 Hz
(+) | médios equilibrados - apenas 4.7% longe da mediana
(+) | médios são lineares (6% delta para frequência anterior)
Altos 2 - 16 kHz
(+) | agudos equilibrados - apenas 2.7% longe da mediana
(+) | os máximos são lineares (6.8% delta da frequência anterior)
Geral 100 - 16.000 Hz
(±) | a linearidade do som geral é média (19% diferença em relação à mediana)
Comparado com a mesma classe
» 45% de todos os dispositivos testados nesta classe foram melhores, 7% semelhantes, 48% piores
» O melhor teve um delta de 6%, a média foi 20%, o pior foi 57%
Comparado com todos os dispositivos testados
» 45% de todos os dispositivos testados foram melhores, 7% semelhantes, 47% piores
» O melhor teve um delta de 4%, a média foi 23%, o pior foi 134%
Apple MacBook 12 (Early 2016) 1.1 GHz análise de áudio
(+) | os alto-falantes podem tocar relativamente alto (###valor### dB)
Graves 100 - 315Hz
(±) | graves reduzidos - em média 11.3% menor que a mediana
(±) | a linearidade dos graves é média (14.2% delta para a frequência anterior)
Médios 400 - 2.000 Hz
(+) | médios equilibrados - apenas 2.4% longe da mediana
(+) | médios são lineares (5.5% delta para frequência anterior)
Altos 2 - 16 kHz
(+) | agudos equilibrados - apenas 2% longe da mediana
(+) | os máximos são lineares (4.5% delta da frequência anterior)
Geral 100 - 16.000 Hz
(+) | o som geral é linear (10.2% diferença em relação à mediana)
Comparado com a mesma classe
» 7% de todos os dispositivos testados nesta classe foram melhores, 2% semelhantes, 90% piores
» O melhor teve um delta de 5%, a média foi 18%, o pior foi 53%
Comparado com todos os dispositivos testados
» 5% de todos os dispositivos testados foram melhores, 1% semelhantes, 94% piores
» O melhor teve um delta de 4%, a média foi 23%, o pior foi 134%
| desligado | |
| Ocioso | |
| Carga |
|
Key:
min: | |
| Microsoft Surface Book 3 13.5 i7-1065G7, GeForce GTX 1650 Max-Q, SK Hynix BC501 HFM512GDJTNG, IPS, 3000x2000, 13.5" | Microsoft Surface Book 2 i7-8650U, GeForce GTX 1050 Mobile, Samsung PM961 MZVLW256HEHP, IPS, 3000x2000, 13.5" | Asus ZenBook Flip 14 UX463FA-AI039T i5-10210U, UHD Graphics 620, Kingston RBUSNS8154P3512GJ1, IPS, 1920x1080, 14" | Lenovo ThinkPad X1 Yoga 20SA000GUS i7-10510U, UHD Graphics 620, WDC PC SN730 SDBQNTY-512GB, IPS, 2560x1440, 14" | HP Spectre x360 13-aw0013dx i7-1065G7, Iris Plus Graphics G7 (Ice Lake 64 EU), Intel Optane Memory H10 with Solid State Storage 32GB + 512GB HBRPEKNX0202A(L/H), IPS, 1920x1080, 13.3" | Microsoft Surface Pro 7 i7-1065G7, Iris Plus Graphics G7 (Ice Lake 64 EU), Toshiba KBG40ZNS256G NVMe, IPS, 2736x1824, 12.3" | Média NVIDIA GeForce GTX 1650 Max-Q | Média da turma Convertible | |
|---|---|---|---|---|---|---|---|---|
| Power Consumption | -9% | 29% | 35% | 36% | 20% | -31% | 25% | |
| Idle Minimum * (Watt) | 4.8 | 4.7 2% | 3.6 25% | 3.5 27% | 3.9 19% | 4.4 8% | 7.75 ? -61% | 4.2 ? 12% |
| Idle Average * (Watt) | 9.4 | 10.6 -13% | 7.5 20% | 5.6 40% | 6.3 33% | 8.7 7% | 11.8 ? -26% | 6.89 ? 27% |
| Idle Maximum * (Watt) | 11.2 | 12.3 -10% | 9.4 16% | 6.5 42% | 6.8 39% | 9.6 14% | 16.6 ? -48% | 8.63 ? 23% |
| Load Average * (Watt) | 72 | 81 -13% | 42 42% | 42.7 41% | 32.6 55% | 44 39% | 75.2 ? -4% | 44.1 ? 39% |
| Load Maximum * (Watt) | 90 | 100.3 -11% | 51 43% | 66.5 26% | 59 34% | 61 32% | 105.5 ? -17% | 66.5 ? 26% |
| Witcher 3 ultra * (Watt) | 97 | 25.6 |
* ... menor é melhor
| Microsoft Surface Book 3 13.5 i7-1065G7, GeForce GTX 1650 Max-Q, 69 Wh | Microsoft Surface Book 2 i7-8650U, GeForce GTX 1050 Mobile, 75 Wh | Asus ZenBook Flip 14 UX463FA-AI039T i5-10210U, UHD Graphics 620, 50 Wh | Lenovo ThinkPad X1 Yoga 20SA000GUS i7-10510U, UHD Graphics 620, 51 Wh | HP Spectre x360 13-aw0013dx i7-1065G7, Iris Plus Graphics G7 (Ice Lake 64 EU), 60 Wh | Microsoft Surface Pro 7 i7-1065G7, Iris Plus Graphics G7 (Ice Lake 64 EU), 45 Wh | Média da turma Convertible | |
|---|---|---|---|---|---|---|---|
| Duração da bateria | 40% | 17% | 4% | 54% | -7% | 33% | |
| Reader / Idle (h) | 16.5 | 24.5 48% | 19.9 21% | 37.1 125% | 11.5 -30% | 26.7 ? 62% | |
| WiFi v1.3 (h) | 6.6 | 11.1 68% | 7.7 17% | 9.2 39% | 9.9 50% | 9.8 48% | 12 ? 82% |
| Load (h) | 3.1 | 3.2 3% | 1.6 -48% | 2.7 -13% | 1.9 -39% | 1.713 ? -45% | |
| Witcher 3 ultra (h) | 3.8 |
Pro
Contra
Veredicto - Esperávamos mais do Surface Book 3
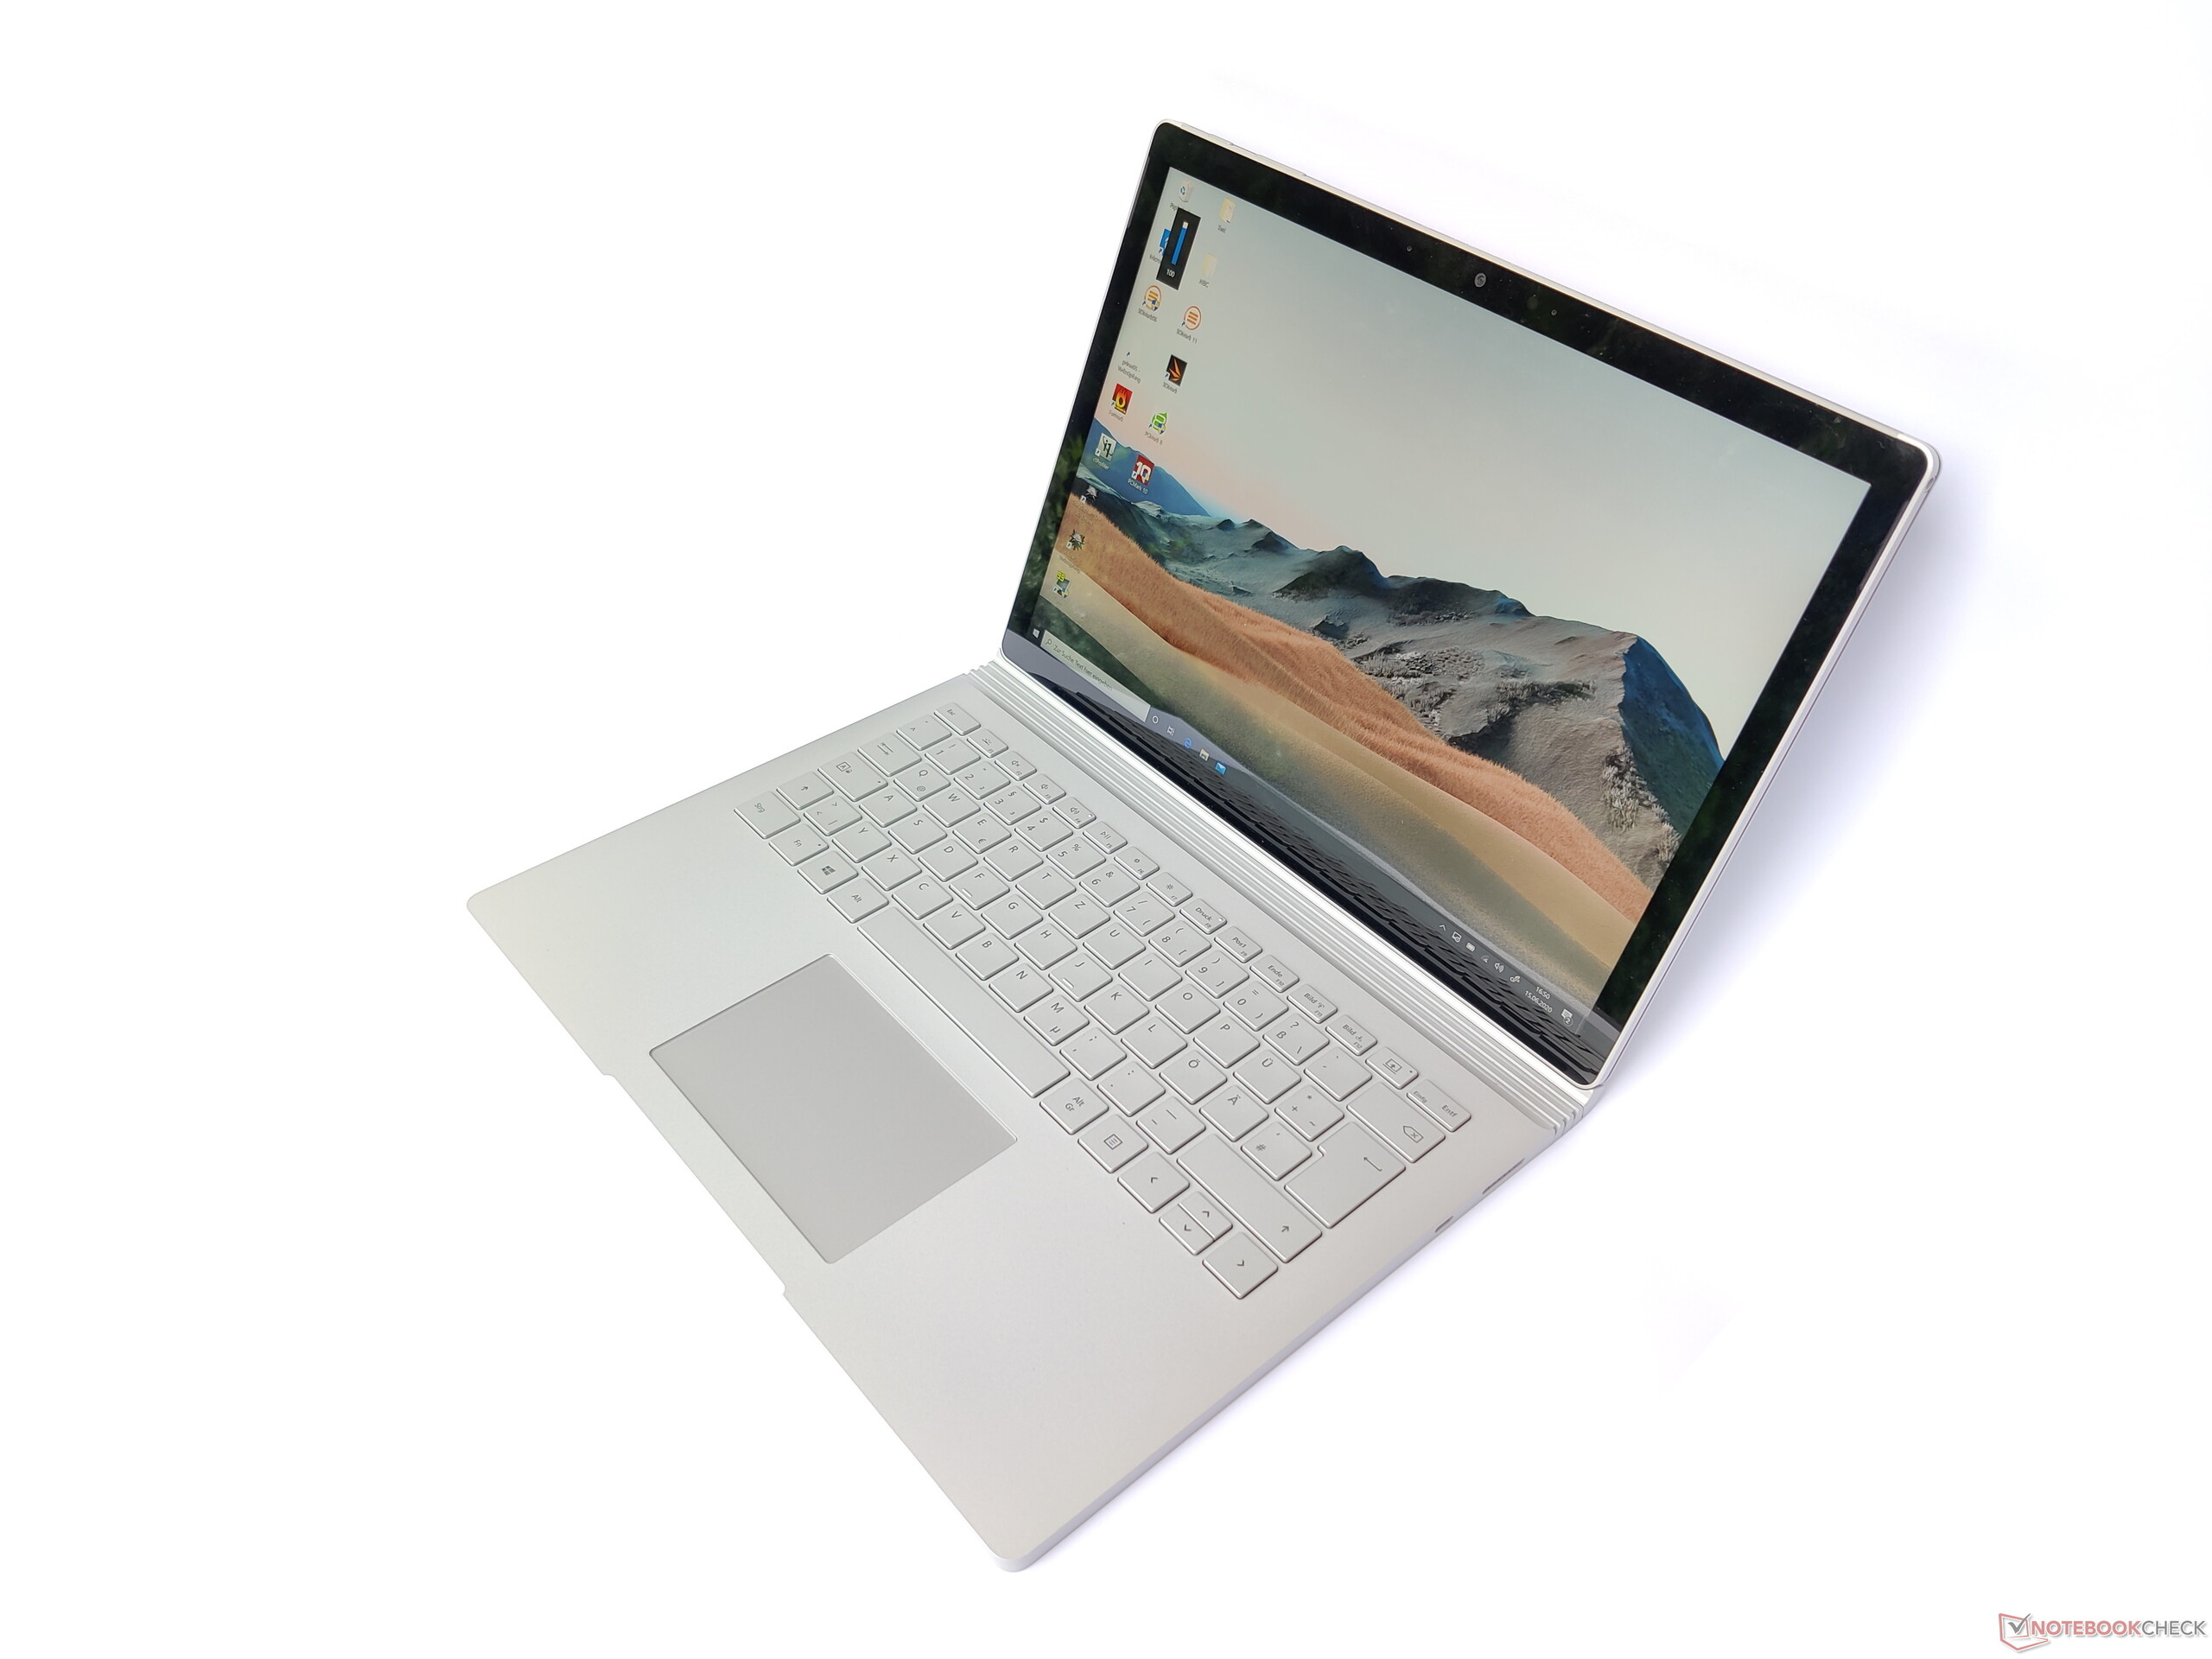
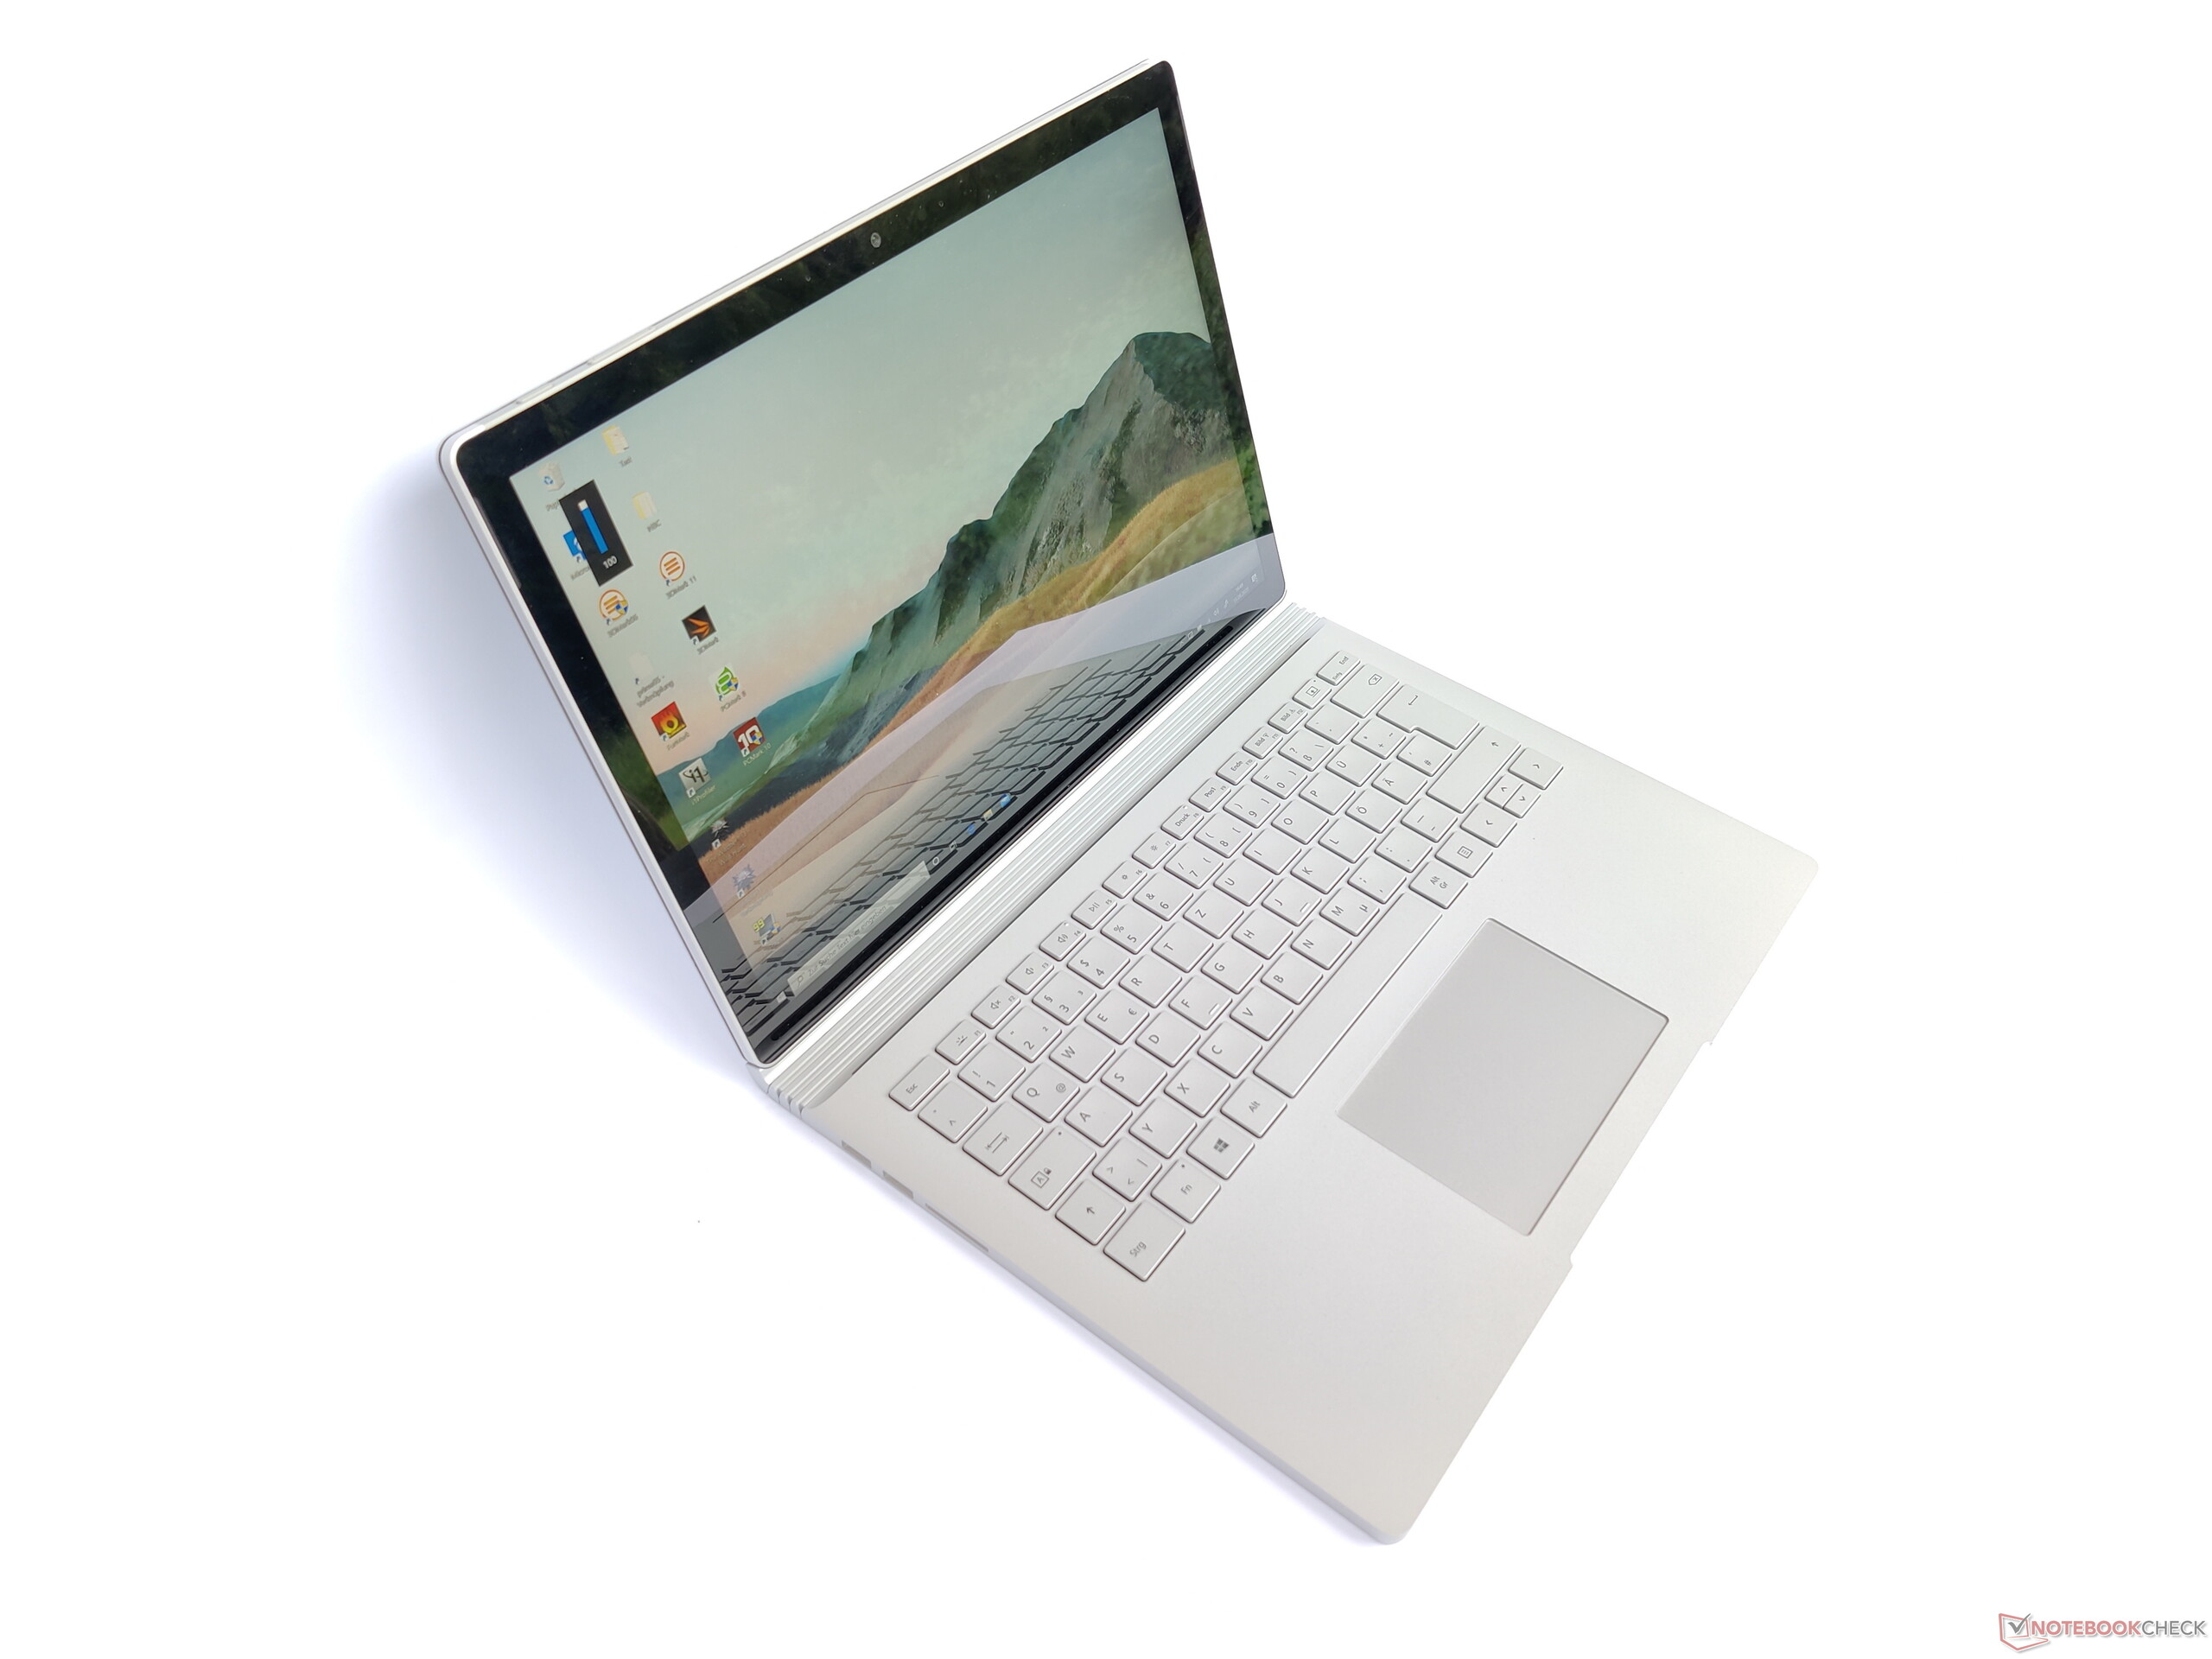
O Microsoft Surface Book 3 13.5 oferece muitas qualidades para o menor modelo conversível. O acabamento é excelente e a dobradiça também é única em relação ao mecanismo de retenção da tela. Mas também está lentamente se tornando um efeito de hábito, já que praticamente nada mudou no Surface Book. Atualizar o design, portanto, beneficiaria o dispositivo Windows.
O Microsoft Surface Book 3 13.5 é um dispositivo de alta qualidade, mas seu desempenho não é usado da melhor maneira.
A Microsoft quer incentivar os usuários a comprar o dispositivo com o hardware mais recente. Acima de tudo, a CPU não é mais potente que o modelo anterior e as sobretaxas às vezes pesadas de mais RAM e um SSD maior não fazem a carteira pular de alegria. Portanto, uma compra certamente vale a pena apenas para usuários que gostam especificamente do conceito do Surface Book 3 13.5 e estão dispostos a pagar um preço mais alto por um dispositivo incomum. Os proprietários do modelo anterior só devem pensar em mudar se quiserem usar o desempenho gráfico mais alto. Em termos de desempenho do sistema e duração da bateria, não há valor agregado.
Microsoft Surface Book 3 13.5
- 06/29/2020 v7 (old)
Mike Wobker
Price comparison
