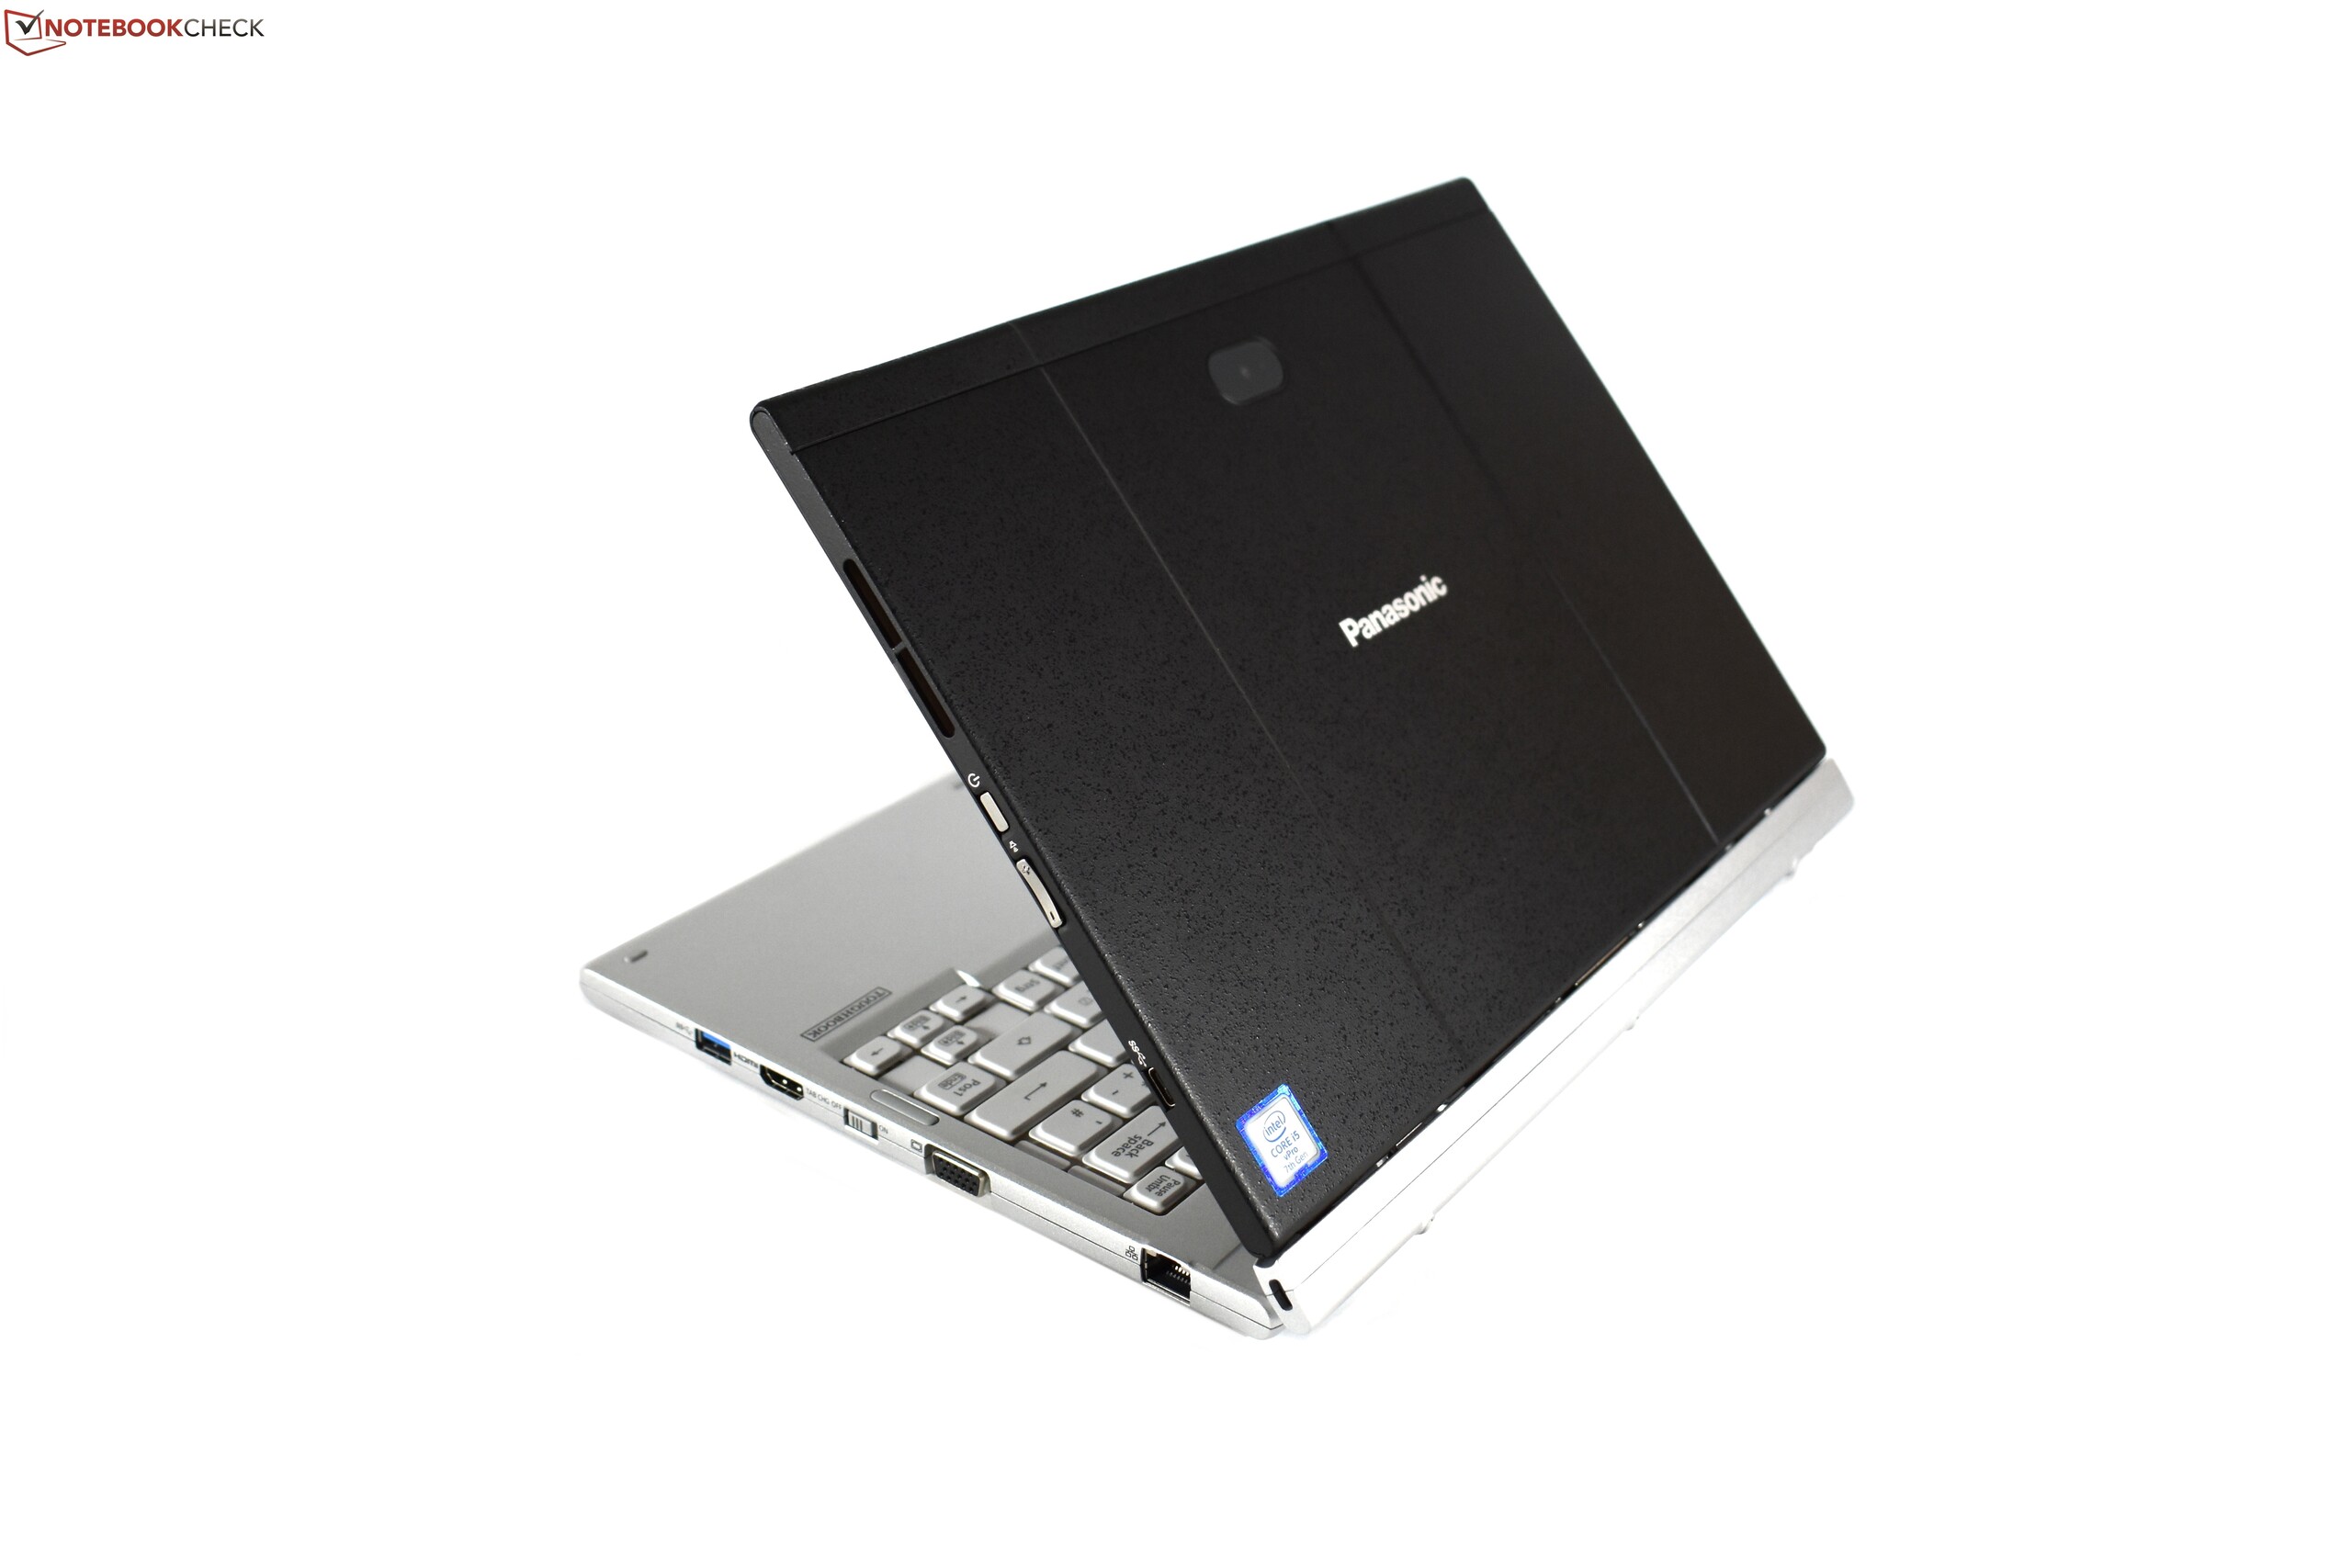
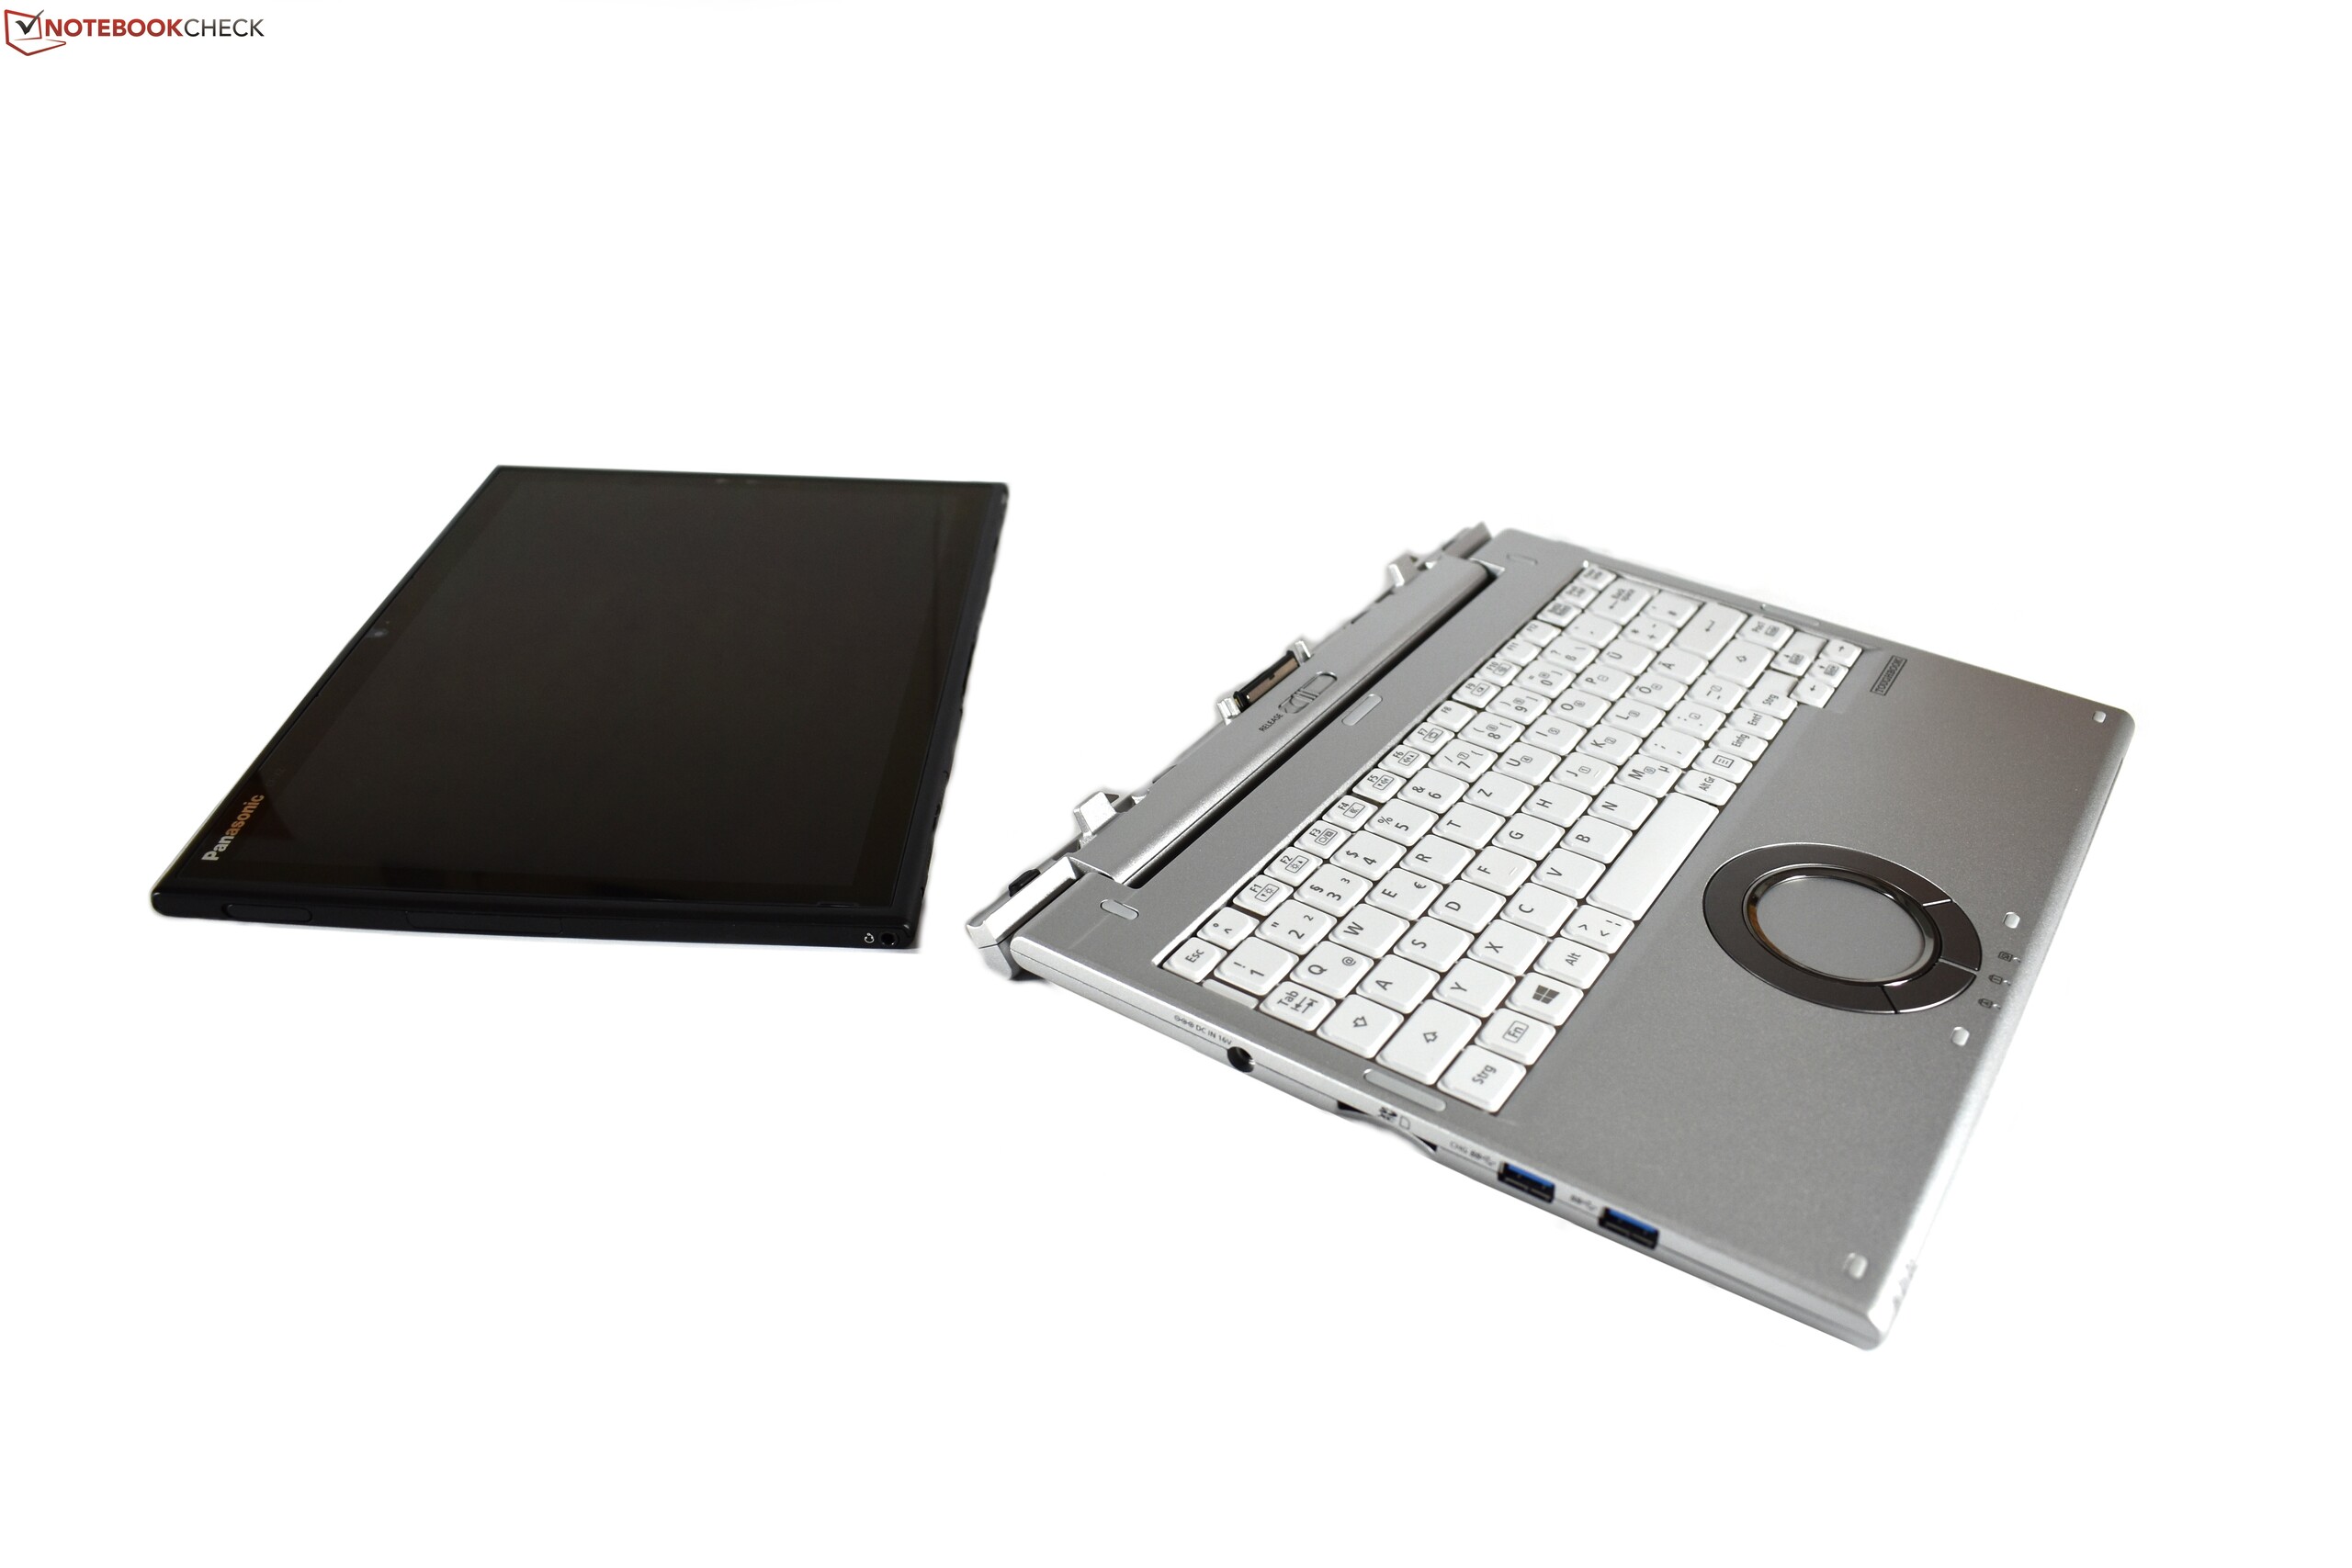
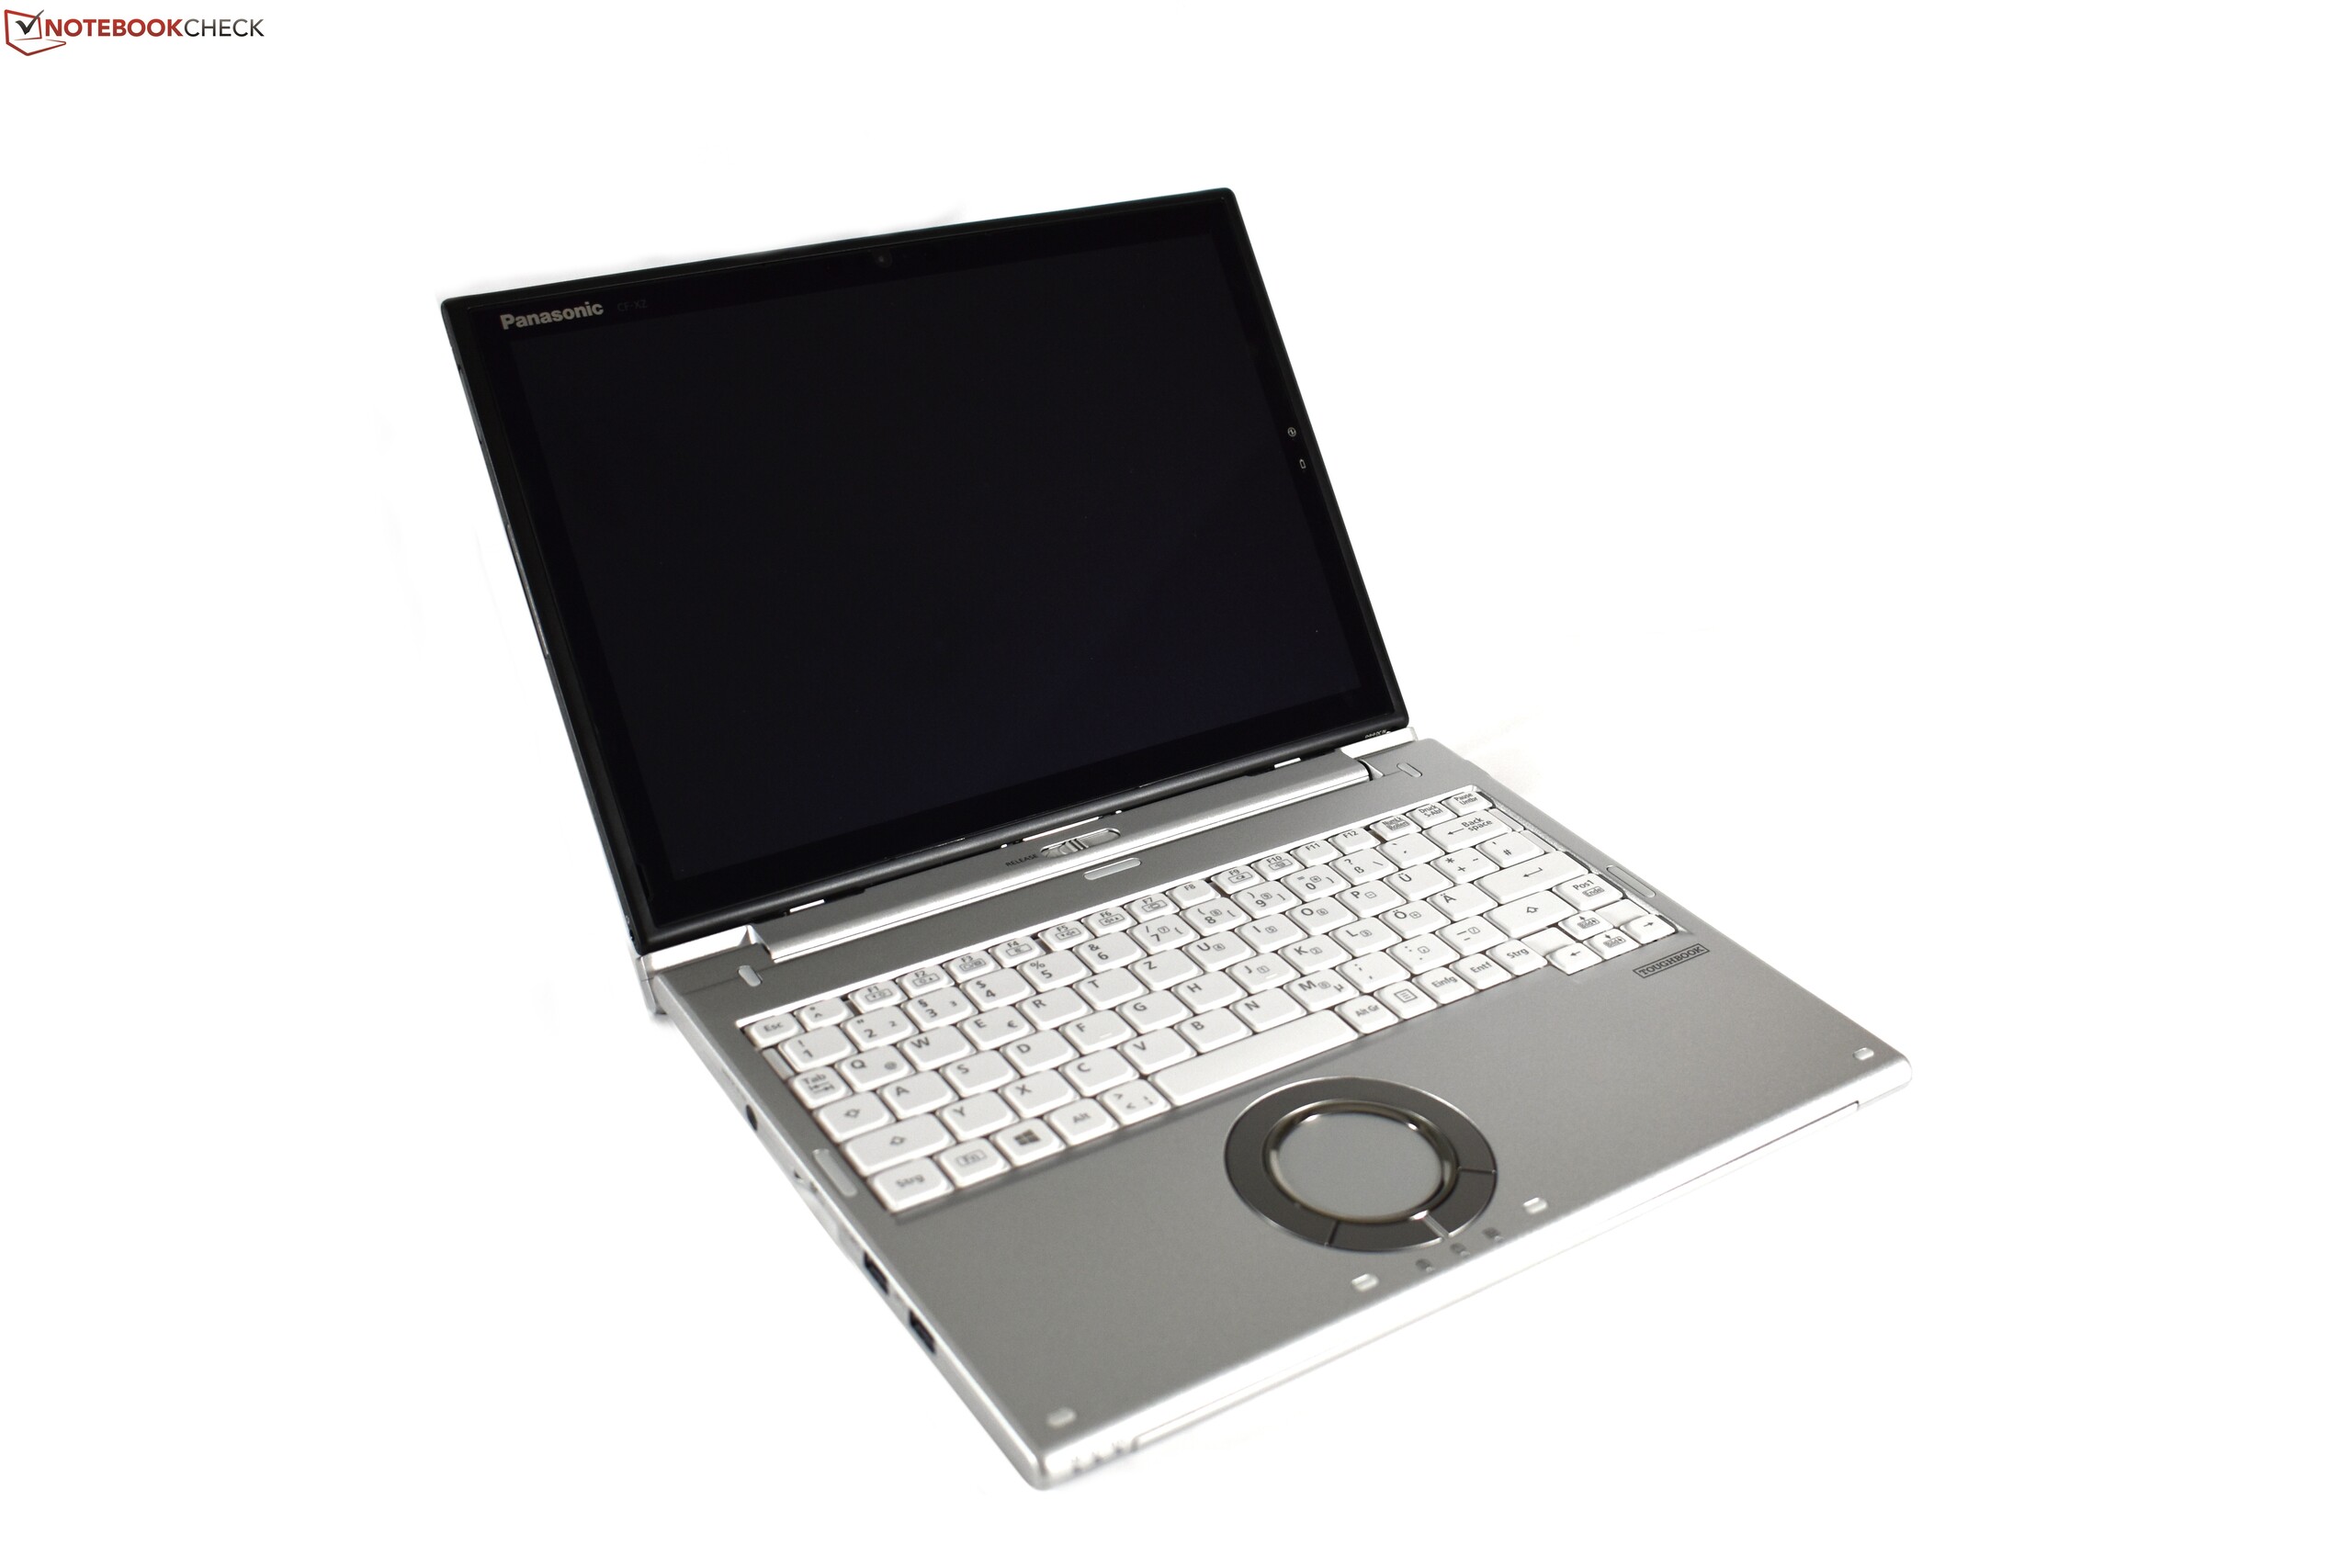
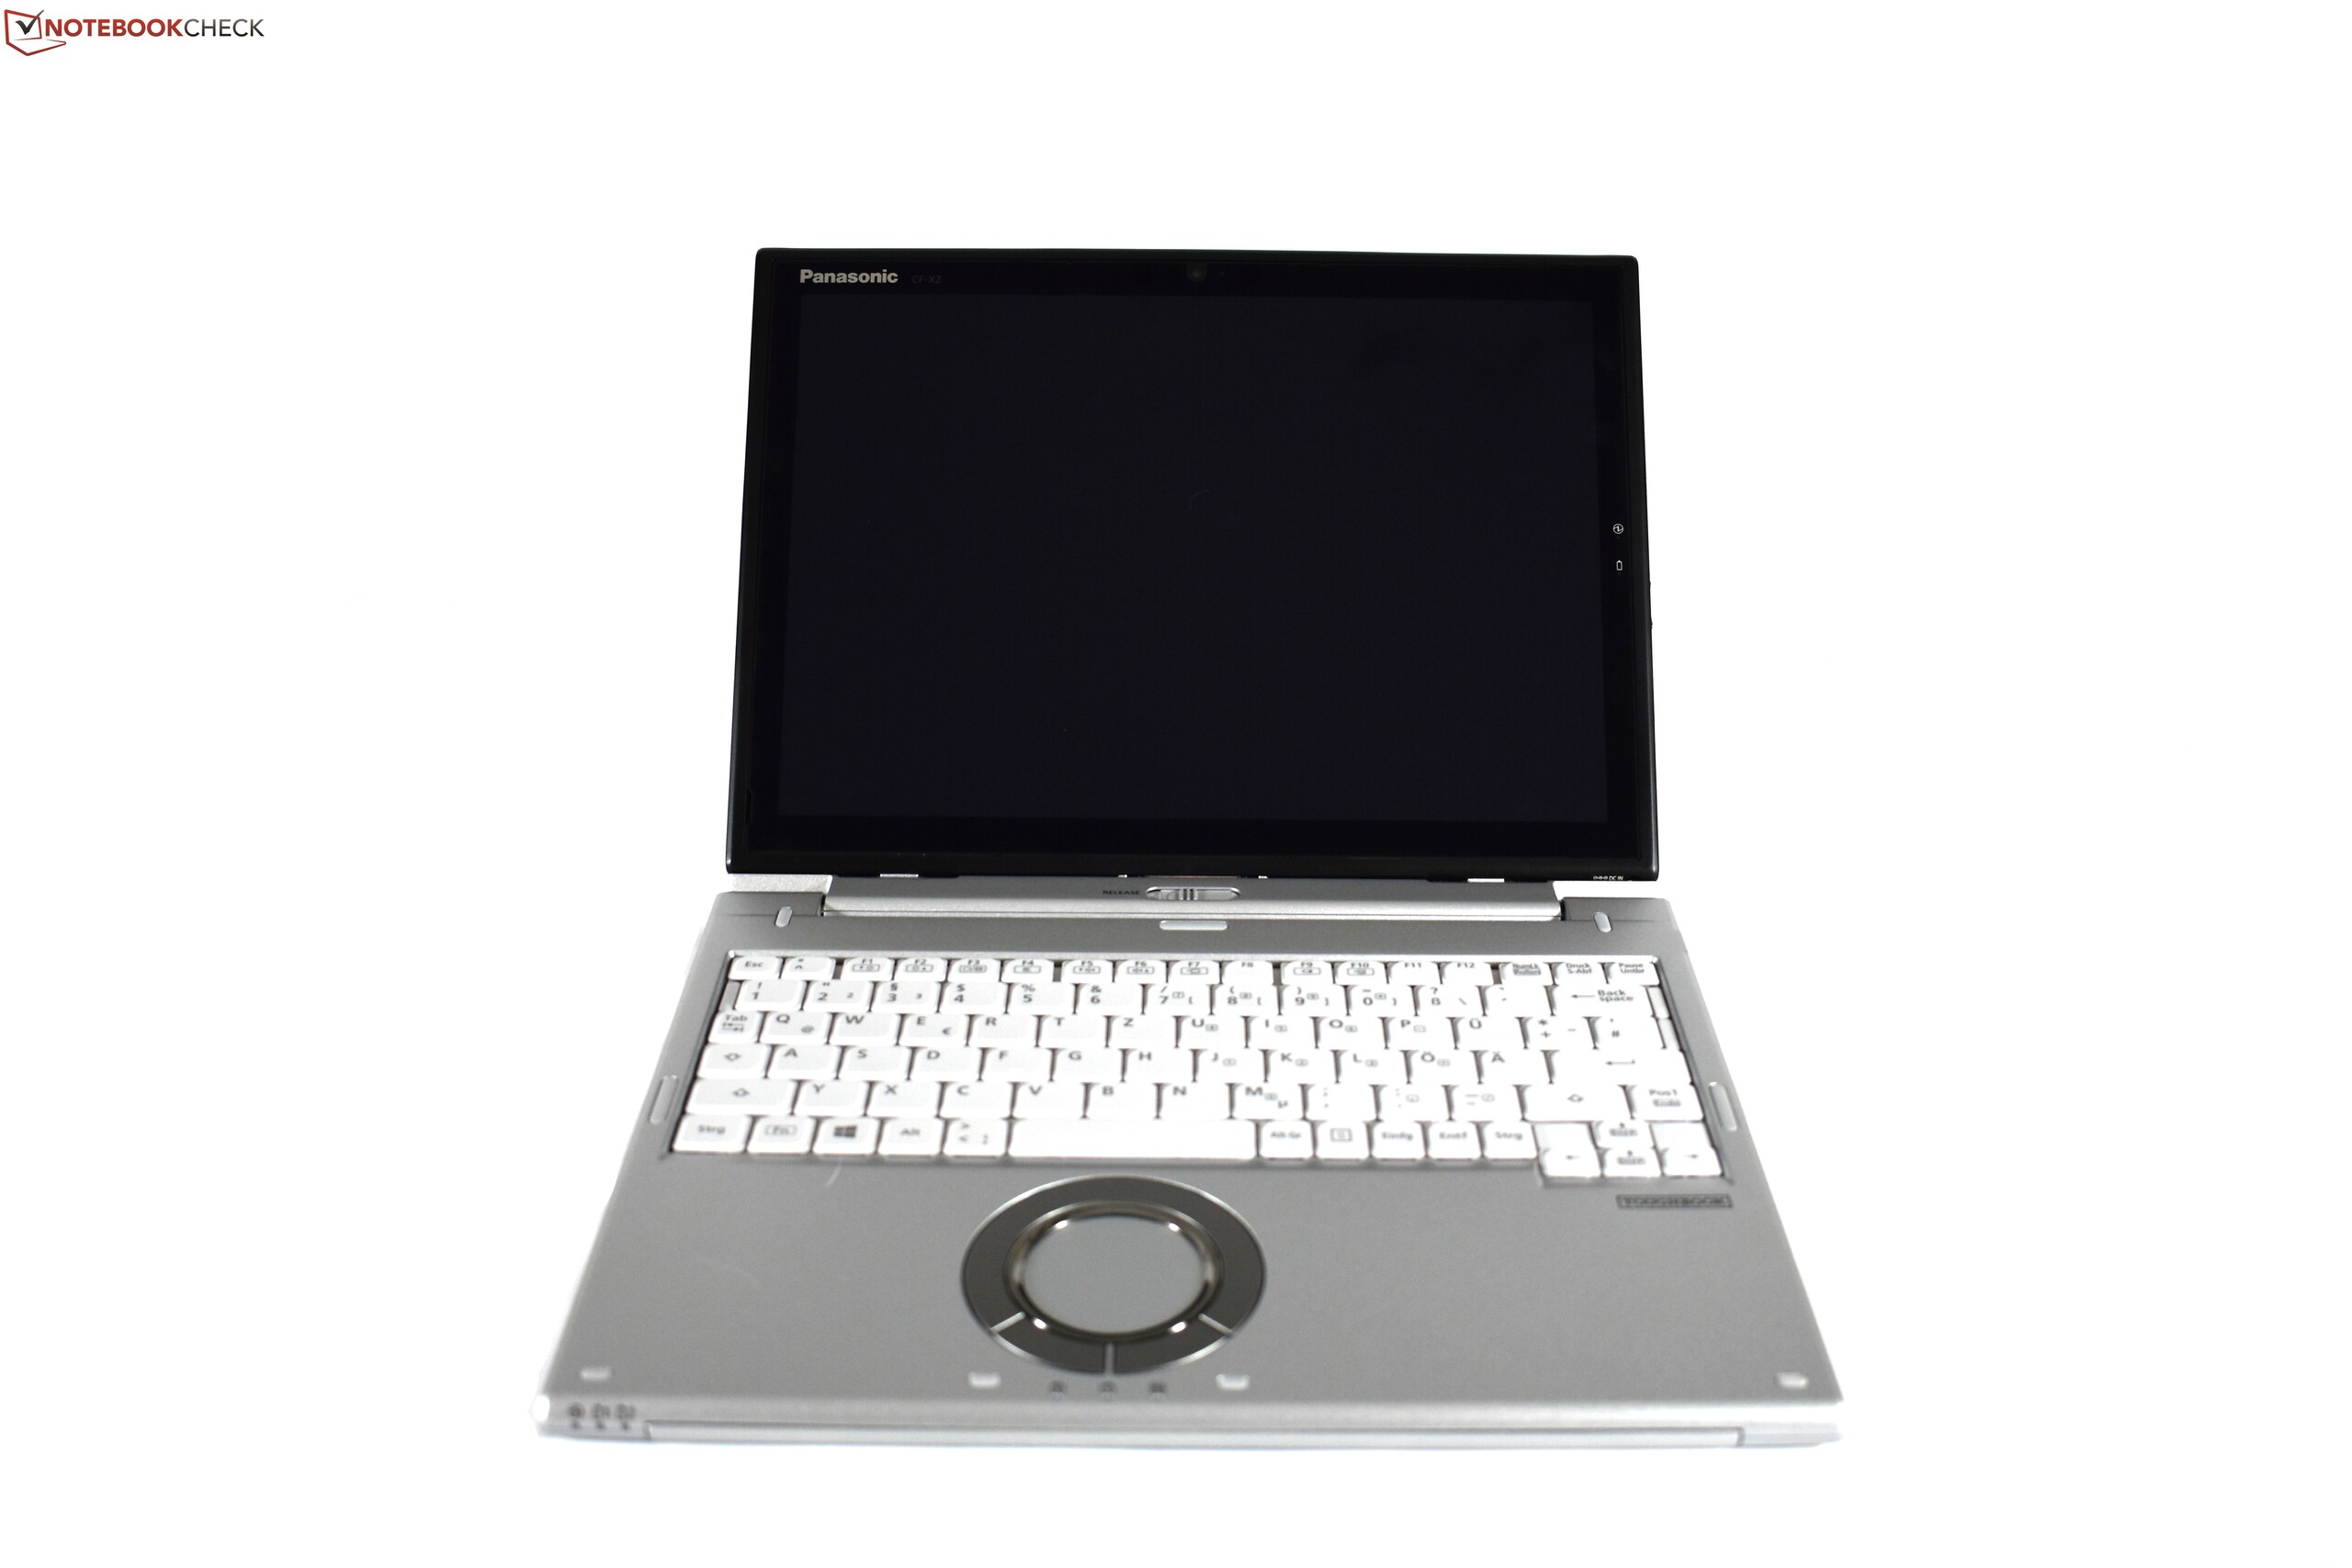
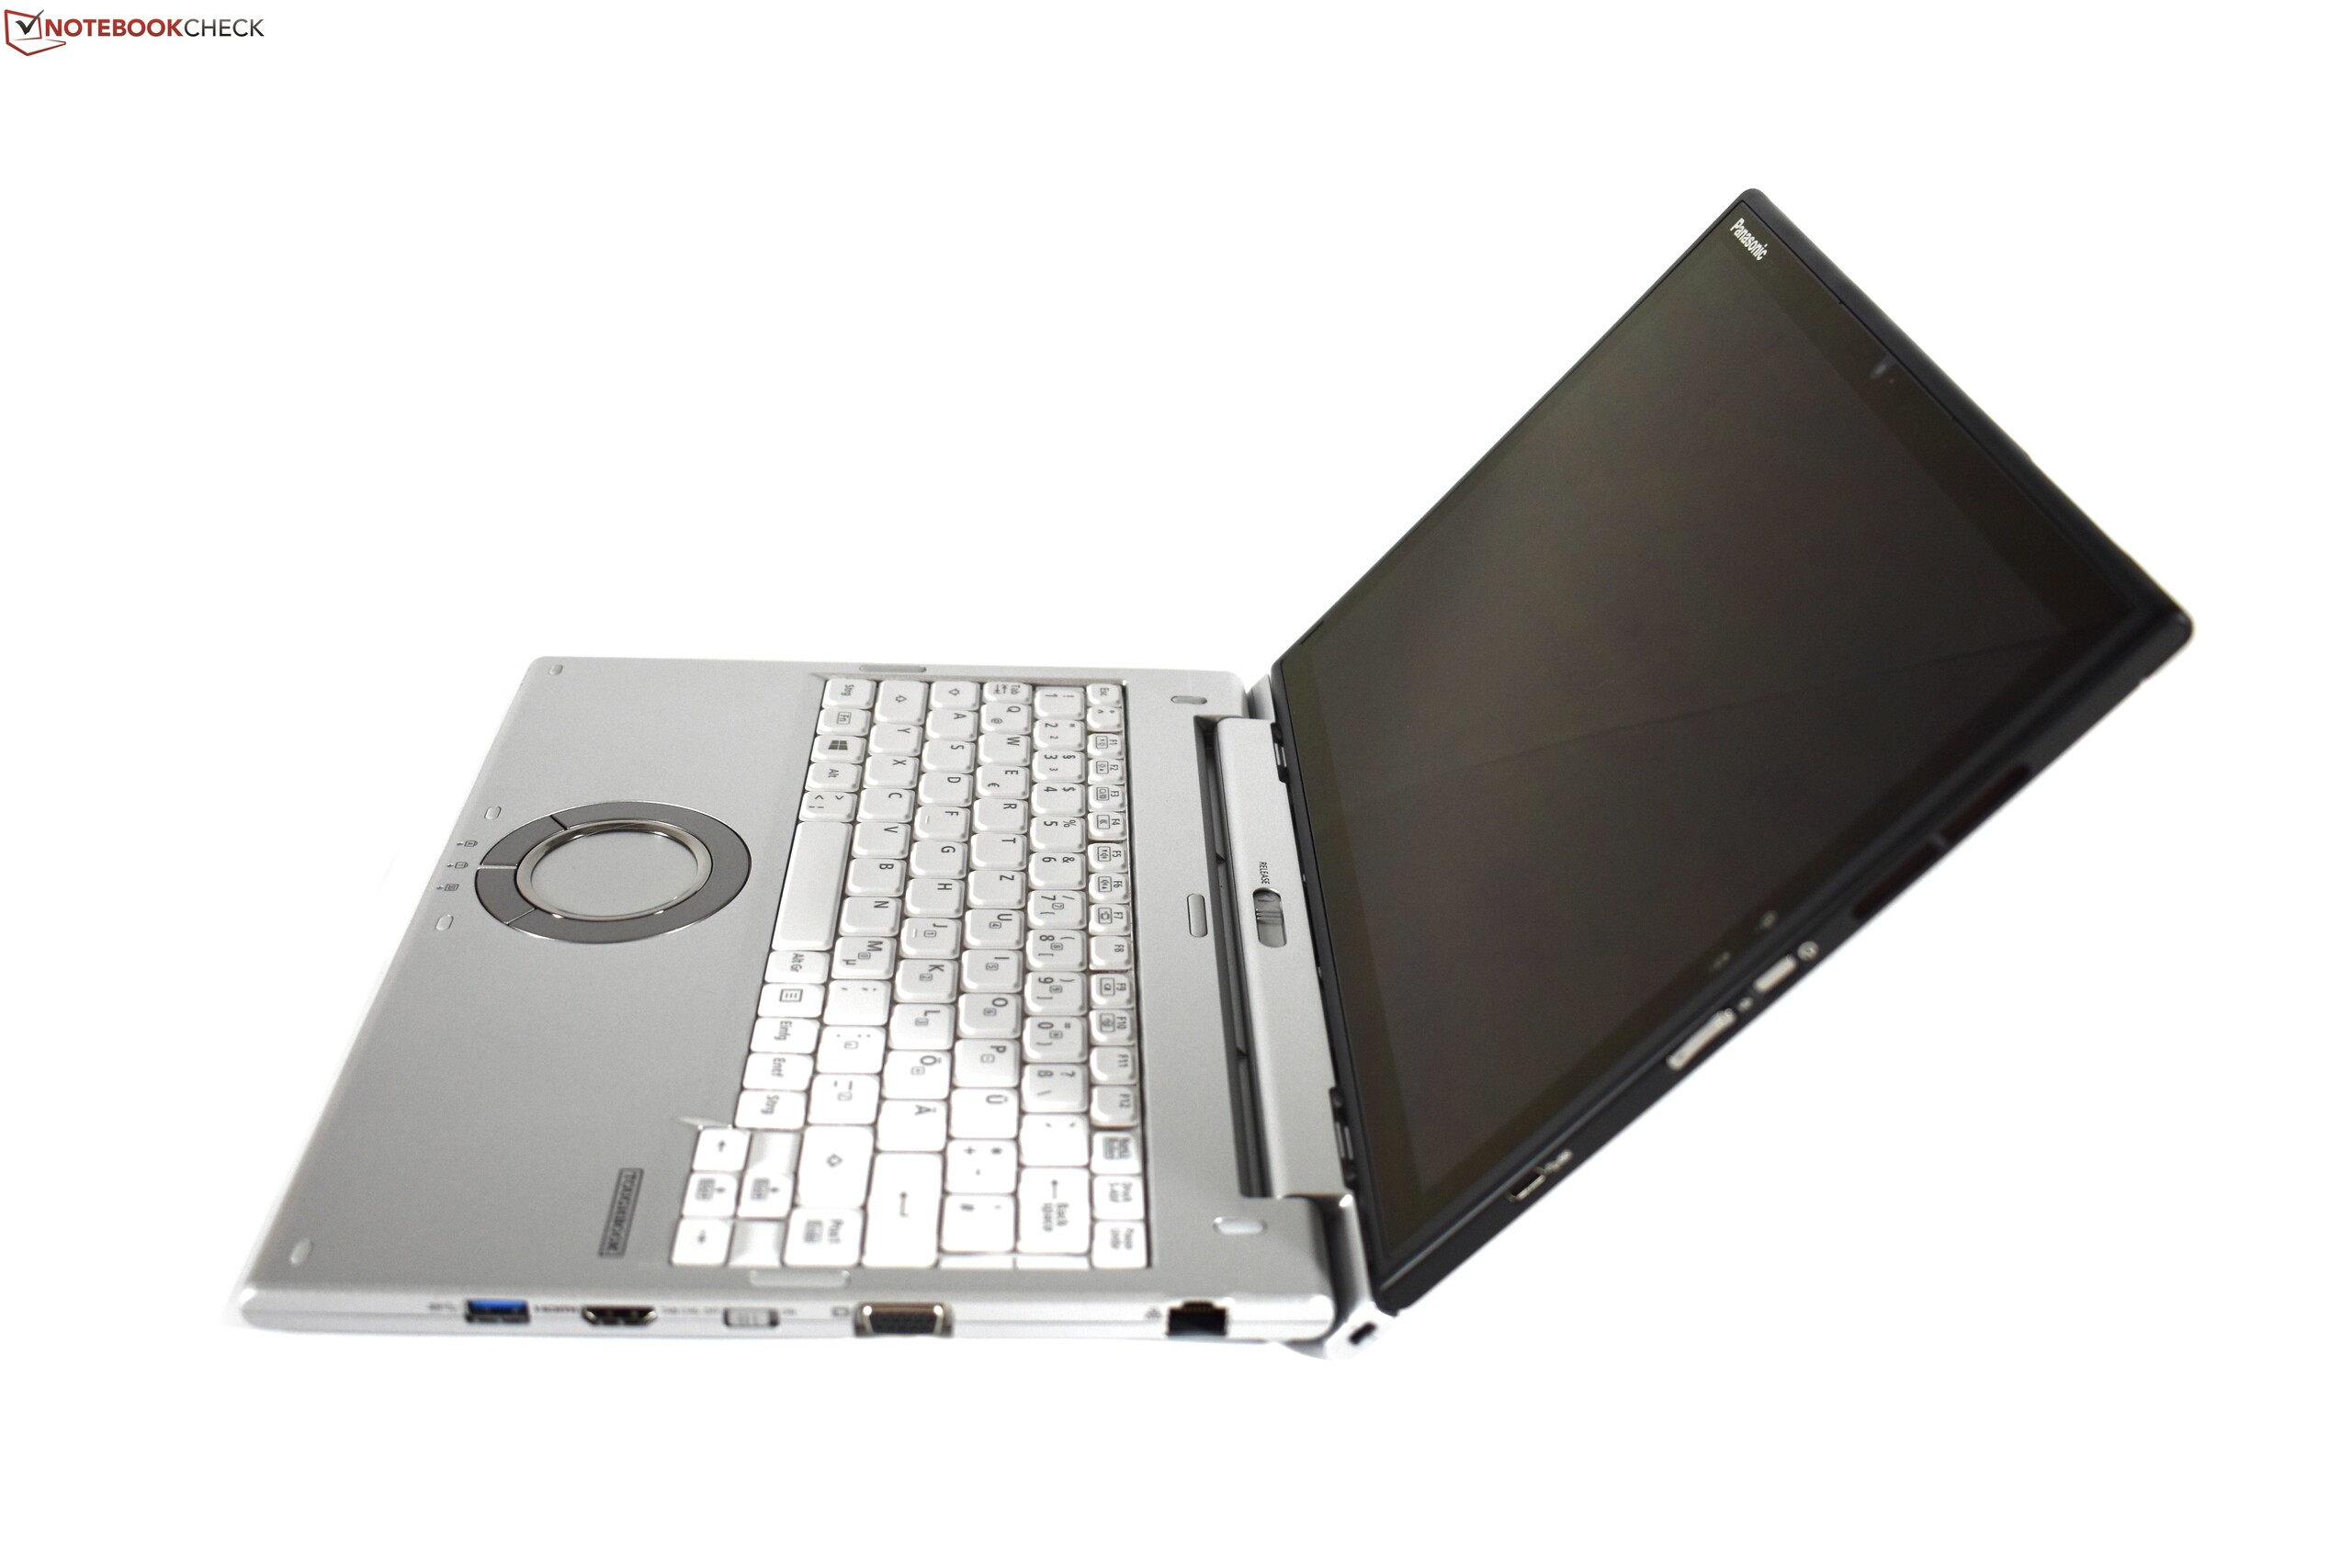
Breve Análise do Conversível Panasonic Toughbook CF-XZ6
| SD Card Reader | |
| average JPG Copy Test (av. of 3 runs) | |
| Microsoft Surface Book 2 (Toshiba Exceria Pro SDXC 64 GB UHS-II) | |
| Panasonic Toughbook CF-XZ6 (Toshiba Exceria Pro SDXC 64 GB UHS-II) | |
| HP Elite x2 1012 G2-1LV76EA (Toshiba Exceria Pro M501) | |
| Lenovo ThinkPad X1 Tablet Gen 2 (Toshiba Exceria Pro SDXC 64 GB UHS-II) | |
| Microsoft Surface Pro (2017) i7 (Toshiba Exceria Pro M401 64 GB) | |
| Dell Latitude 7285 (Toshiba Exceria Pro M501) | |
| maximum AS SSD Seq Read Test (1GB) | |
| Panasonic Toughbook CF-XZ6 (Toshiba Exceria Pro SDXC 64 GB UHS-II) | |
| Microsoft Surface Book 2 (Toshiba Exceria Pro SDXC 64 GB UHS-II) | |
| Lenovo ThinkPad X1 Tablet Gen 2 (Toshiba Exceria Pro SDXC 64 GB UHS-II) | |
| HP Elite x2 1012 G2-1LV76EA (Toshiba Exceria Pro M501) | |
| Microsoft Surface Pro (2017) i7 (Toshiba Exceria Pro M401 64 GB) | |
| Dell Latitude 7285 (Toshiba Exceria Pro M501) | |
Cintilação da tela / PWM (modulação por largura de pulso)
| Tela tremeluzindo/PWM detectado | 694 Hz | ≤ 90 % configuração de brilho | 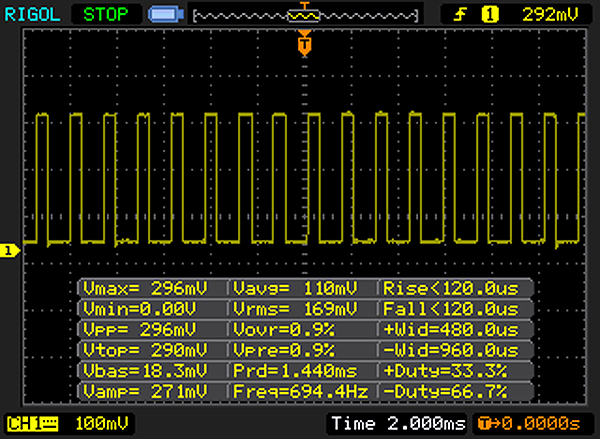 |
A luz de fundo da tela pisca em 694 Hz (pior caso, por exemplo, utilizando PWM) Cintilação detectada em uma configuração de brilho de 90 % e abaixo. Não deve haver cintilação ou PWM acima desta configuração de brilho. A frequência de 694 Hz é bastante alta, então a maioria dos usuários sensíveis ao PWM não deve notar nenhuma oscilação. [pwm_comparison] Em comparação: 52 % de todos os dispositivos testados não usam PWM para escurecer a tela. Se PWM foi detectado, uma média de 7748 (mínimo: 5 - máximo: 343500) Hz foi medida. | |||
| |||||||||||||||||||||||||
iluminação: 82 %
iluminação com acumulador: 565 cd/m²
Contraste: 1413:1 (Preto: 0.4 cd/m²)
ΔE ColorChecker Calman: 5.06 | ∀{0.5-29.43 Ø4.71}
ΔE Greyscale Calman: 6.4 | ∀{0.09-98 Ø4.96}
70% sRGB (Argyll 1.6.3 3D)
44% AdobeRGB 1998 (Argyll 1.6.3 3D)
48.01% AdobeRGB 1998 (Argyll 3D)
70% sRGB (Argyll 3D)
46.47% Display P3 (Argyll 3D)
Gamma: 2.25
CCT: 5794 K
| Panasonic Toughbook CF-XZ6 Semi-Matte Beschichtung, , 2160x1440, 12" | Microsoft Surface Book 2 Panasonic MEI96A2 , , 3000x2000, 13.5" | Dell Latitude 7285 SHP1482 (LQ123Z1), , 2880x1920, 12.3" | Microsoft Surface Pro (2017) i7 LG Display LP123WQ112604, , 2736x1824, 12.3" | Lenovo ThinkPad X1 Tablet Gen 2 LSN120QL01L01, , 2160x1440, 12" | HP Elite x2 1012 G2-1LV76EA Samsung SDC4A49, , 2716x1824, 12.3" | |
|---|---|---|---|---|---|---|
| Display | 43% | 52% | 41% | 42% | ||
| Display P3 Coverage (%) | 46.47 | 67.9 46% | 73.3 58% | 66.6 43% | 66.7 44% | |
| sRGB Coverage (%) | 70 | 95.7 37% | 99.8 43% | 96.5 38% | 98 40% | |
| AdobeRGB 1998 Coverage (%) | 48.01 | 69.4 45% | 74.1 54% | 67.8 41% | 68.7 43% | |
| Response Times | -18% | -7% | 11% | 26% | 6% | |
| Response Time Grey 50% / Grey 80% * (ms) | 39 ? | 52.8 ? -35% | 44 ? -13% | 37 ? 5% | 28.4 ? 27% | 45.6 ? -17% |
| Response Time Black / White * (ms) | 30 ? | 30 ? -0% | 30.4 ? -1% | 25 ? 17% | 22.8 ? 24% | 21.6 ? 28% |
| PWM Frequency (Hz) | 694 ? | 922 ? | 22130 ? | 221.2 ? | 2119 ? | |
| Screen | 30% | 18% | 9% | -3% | 18% | |
| Brightness middle (cd/m²) | 565 | 385 -32% | 531 -6% | 482 -15% | 388.1 -31% | 443 -22% |
| Brightness (cd/m²) | 538 | 372 -31% | 490 -9% | 466 -13% | 344 -36% | 446 -17% |
| Brightness Distribution (%) | 82 | 89 9% | 86 5% | 92 12% | 78 -5% | 88 7% |
| Black Level * (cd/m²) | 0.4 | 0.21 48% | 0.37 7% | 0.395 1% | 0.39 2% | 0.41 -2% |
| Contrast (:1) | 1413 | 1833 30% | 1435 2% | 1220 -14% | 995 -30% | 1080 -24% |
| Colorchecker dE 2000 * | 5.06 | 1.6 68% | 3.5 31% | 4 21% | 4.6 9% | 2.6 49% |
| Colorchecker dE 2000 max. * | 8.1 | 4.5 44% | 6.2 23% | 7.2 11% | 9.1 -12% | 4 51% |
| Greyscale dE 2000 * | 6.4 | 1.5 77% | 4.7 27% | 5.7 11% | 6.1 5% | 3 53% |
| Gamma | 2.25 98% | 2.22 99% | 2.04 108% | 2.28 96% | 2.07 106% | 2.38 92% |
| CCT | 5794 112% | 6502 100% | 6581 99% | 7950 82% | 7104 91% | 6780 96% |
| Color Space (Percent of AdobeRGB 1998) (%) | 44 | 64 45% | 67.6 54% | 62 41% | 59 34% | 62.6 42% |
| Color Space (Percent of sRGB) (%) | 70 | 95.9 37% | 99.8 43% | 96 37% | 91 30% | 98 40% |
| Média Total (Programa/Configurações) | 18% /
26% | 21% /
21% | 20% /
16% | 12% /
1% | 22% /
21% |
* ... menor é melhor
Exibir tempos de resposta
| ↔ Tempo de resposta preto para branco | ||
|---|---|---|
| 30 ms ... ascensão ↗ e queda ↘ combinadas | ↗ 18 ms ascensão | 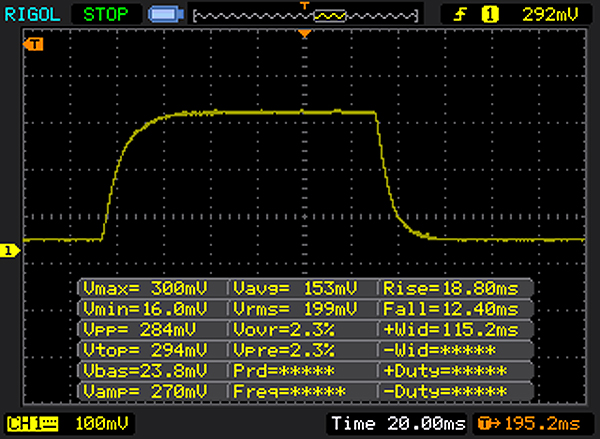 |
| ↘ 12 ms queda | ||
| A tela mostra taxas de resposta lentas em nossos testes e será insatisfatória para os jogadores. Em comparação, todos os dispositivos testados variam de 0.1 (mínimo) a 240 (máximo) ms. » 80 % de todos os dispositivos são melhores. Isso significa que o tempo de resposta medido é pior que a média de todos os dispositivos testados (19.8 ms). | ||
| ↔ Tempo de resposta 50% cinza a 80% cinza | ||
| 39 ms ... ascensão ↗ e queda ↘ combinadas | ↗ 21 ms ascensão | 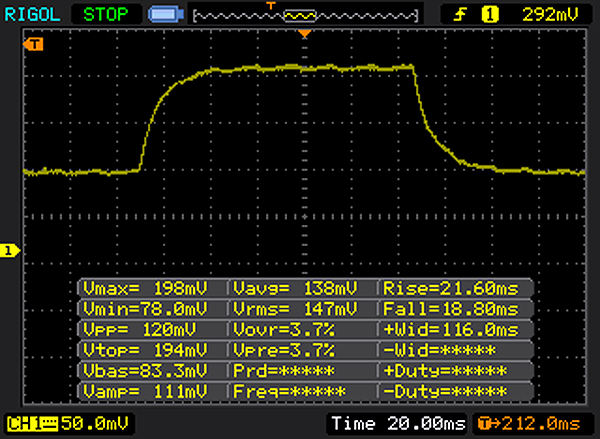 |
| ↘ 18 ms queda | ||
| A tela mostra taxas de resposta lentas em nossos testes e será insatisfatória para os jogadores. Em comparação, todos os dispositivos testados variam de 0.165 (mínimo) a 636 (máximo) ms. » 59 % de todos os dispositivos são melhores. Isso significa que o tempo de resposta medido é pior que a média de todos os dispositivos testados (30.9 ms). | ||
| PCMark 8 Home Score Accelerated v2 | 3386 pontos | |
| PCMark 8 Work Score Accelerated v2 | 4503 pontos | |
| PCMark 10 Score | 3226 pontos | |
Ajuda | ||
| Panasonic Toughbook CF-XZ6 Samsung SSD PM871a MZNLN256HMHQ | Microsoft Surface Book 2 Samsung PM961 MZVLW256HEHP | Dell Latitude 7285 Toshiba KBG20ZMS256G | Microsoft Surface Pro (2017) i7 Samsung PM971 KUS040202M | Lenovo ThinkPad X1 Tablet Gen 2 Samsung PM961 MZVLW256HEHP | HP Elite x2 1012 G2-1LV76EA Samsung PM961 MZVLW256HEHP | |
|---|---|---|---|---|---|---|
| CrystalDiskMark 3.0 | 46% | 38% | 73% | 90% | 129% | |
| Read Seq (MB/s) | 499.9 | 1370 174% | 1017 103% | 1308 162% | 1739 248% | 1875 275% |
| Write Seq (MB/s) | 404.2 | 341.2 -16% | 587 45% | 961 138% | 1259 211% | 1261 212% |
| Read 512 (MB/s) | 423.5 | 654 54% | 756 79% | 227.5 -46% | 698 65% | 1235 192% |
| Write 512 (MB/s) | 355.6 | 337.9 -5% | 487.9 37% | 792 123% | 869 144% | 844 137% |
| Read 4k (MB/s) | 35.75 | 43.64 22% | 45.26 27% | 53.6 50% | 52.3 46% | 56.9 59% |
| Write 4k (MB/s) | 93 | 148.5 60% | 99.1 7% | 136.3 47% | 120 29% | 145.4 56% |
| Read 4k QD32 (MB/s) | 307 | 465.5 52% | 357.7 17% | 485.6 58% | 247.9 -19% | 398.3 30% |
| Write 4k QD32 (MB/s) | 273.9 | 337.1 23% | 253 -8% | 421.5 54% | 259 -5% | 472.5 73% |

| 3DMark 11 - 1280x720 Performance GPU | |
| Microsoft Surface Book 2 | |
| Microsoft Surface Pro (2017) i7 | |
| HP Elite x2 1012 G2-1LV76EA | |
| Panasonic Toughbook CF-XZ6 | |
| Dell Latitude 7285 | |
| Lenovo ThinkPad X1 Tablet Gen 2 | |
| 3DMark 11 Performance | 1552 pontos | |
| 3DMark Cloud Gate Standard Score | 5469 pontos | |
| 3DMark Fire Strike Score | 734 pontos | |
Ajuda | ||
| baixo | média | alto | ultra | |
|---|---|---|---|---|
| BioShock Infinite (2013) | 43.31 | 24.5 | ||
| Rise of the Tomb Raider (2016) | 16.08 | |||
| Civilization 6 (2016) | 17.28 |
Barulho
| Ocioso |
| 30.5 / 30.5 / 30.5 dB |
| Carga |
| 31.9 / 32.6 dB |
 | ||
30 dB silencioso 40 dB(A) audível 50 dB(A) ruidosamente alto |
||
min: | ||
(+) A temperatura máxima no lado superior é 37.6 °C / 100 F, em comparação com a média de 35.4 °C / 96 F , variando de 19.6 a 60 °C para a classe Convertible.
(+) A parte inferior aquece até um máximo de 38.2 °C / 101 F, em comparação com a média de 36.9 °C / 98 F
(+) Em uso inativo, a temperatura média para o lado superior é 30.3 °C / 87 F, em comparação com a média do dispositivo de 30.3 °C / ### class_avg_f### F.
(+) Os apoios para as mãos e o touchpad estão atingindo a temperatura máxima da pele (34.7 °C / 94.5 F) e, portanto, não estão quentes.
(-) A temperatura média da área do apoio para as mãos de dispositivos semelhantes foi 28 °C / 82.4 F (-6.7 °C / -12.1 F).
Panasonic Toughbook CF-XZ6 análise de áudio
(-) | alto-falantes não muito altos (###valor### dB)
Graves 100 - 315Hz
(-) | quase nenhum baixo - em média 24.6% menor que a mediana
(+) | o baixo é linear (3.3% delta para a frequência anterior)
Médios 400 - 2.000 Hz
(±) | médios reduzidos - em média 10.4% menor que a mediana
(-) | médios não são lineares (16.2% delta para frequência anterior)
Altos 2 - 16 kHz
(±) | máximos mais altos - em média 7.4% maior que a mediana
(±) | a linearidade dos máximos é média (9.1% delta para frequência anterior)
Geral 100 - 16.000 Hz
(-) | o som geral não é linear (43.6% diferença em relação à mediana)
Comparado com a mesma classe
» 98% de todos os dispositivos testados nesta classe foram melhores, 1% semelhantes, 1% piores
» O melhor teve um delta de 6%, a média foi 20%, o pior foi 57%
Comparado com todos os dispositivos testados
» 96% de todos os dispositivos testados foram melhores, 0% semelhantes, 4% piores
» O melhor teve um delta de 4%, a média foi 23%, o pior foi 134%
Microsoft Surface Book 2 análise de áudio
(±) | o volume do alto-falante é médio, mas bom (###valor### dB)
Graves 100 - 315Hz
(±) | graves reduzidos - em média 12.4% menor que a mediana
(±) | a linearidade dos graves é média (12.3% delta para a frequência anterior)
Médios 400 - 2.000 Hz
(+) | médios equilibrados - apenas 1.9% longe da mediana
(+) | médios são lineares (3.6% delta para frequência anterior)
Altos 2 - 16 kHz
(+) | agudos equilibrados - apenas 4.8% longe da mediana
(±) | a linearidade dos máximos é média (9.3% delta para frequência anterior)
Geral 100 - 16.000 Hz
(±) | a linearidade do som geral é média (18.2% diferença em relação à mediana)
Comparado com a mesma classe
» 40% de todos os dispositivos testados nesta classe foram melhores, 7% semelhantes, 53% piores
» O melhor teve um delta de 6%, a média foi 20%, o pior foi 57%
Comparado com todos os dispositivos testados
» 39% de todos os dispositivos testados foram melhores, 8% semelhantes, 53% piores
» O melhor teve um delta de 4%, a média foi 23%, o pior foi 134%
| desligado | |
| Ocioso | |
| Carga |
|
Key:
min: | |
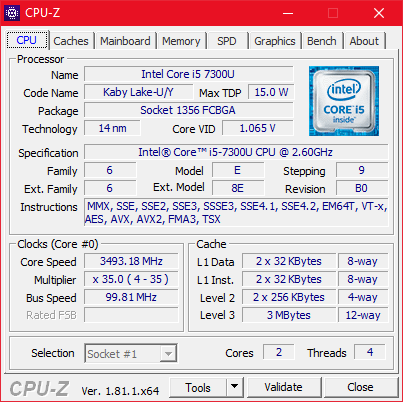
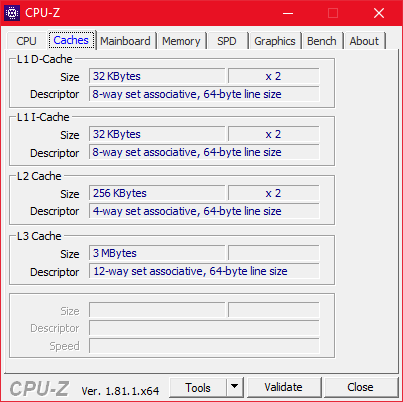
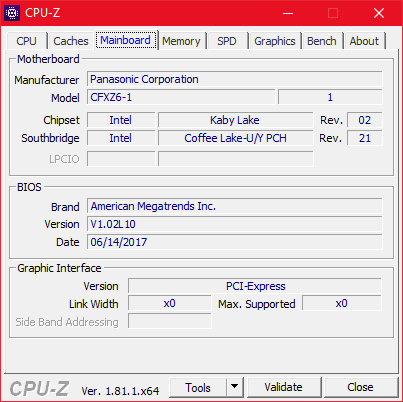
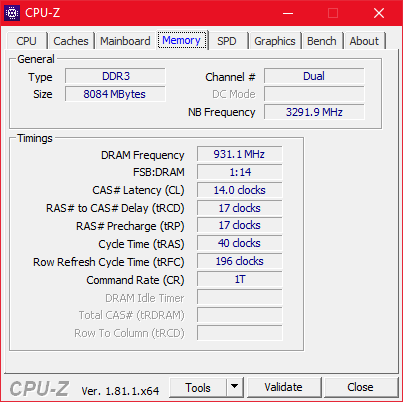
| Panasonic Toughbook CF-XZ6 i5-7300U, HD Graphics 620, Samsung SSD PM871a MZNLN256HMHQ, IPS LED, 2160x1440, 12" | Microsoft Surface Book 2 i7-8650U, GeForce GTX 1050 Mobile, Samsung PM961 MZVLW256HEHP, IPS, 3000x2000, 13.5" | Dell Latitude 7285 i5-7Y57, HD Graphics 615, Toshiba KBG20ZMS256G, IPS LED, 2880x1920, 12.3" | Microsoft Surface Pro (2017) i7 i7-7660U, Iris Plus Graphics 640, Samsung PM971 KUS040202M, IPS, 2736x1824, 12.3" | Lenovo ThinkPad X1 Tablet Gen 2 i5-7Y54, HD Graphics 615, Samsung PM961 MZVLW256HEHP, IPS, 2160x1440, 12" | HP Elite x2 1012 G2-1LV76EA i5-7200U, HD Graphics 620, Samsung PM961 MZVLW256HEHP, IPS, 2716x1824, 12.3" | |
|---|---|---|---|---|---|---|
| Power Consumption | -169% | -61% | -70% | -13% | -67% | |
| Idle Minimum * (Watt) | 3.15 | 4.7 -49% | 6.6 -110% | 4.2 -33% | 5 -59% | 4.1 -30% |
| Idle Average * (Watt) | 6 | 10.6 -77% | 9.3 -55% | 10.1 -68% | 6.3 -5% | 9.2 -53% |
| Idle Maximum * (Watt) | 6.3 | 12.3 -95% | 10.2 -62% | 14 -122% | 7.8 -24% | 11.1 -76% |
| Load Average * (Watt) | 21 | 81 -286% | 25.1 -20% | 37.4 -78% | 19.5 7% | 33.8 -61% |
| Load Maximum * (Watt) | 23 | 100.3 -336% | 36.1 -57% | 34 -48% | 19.6 15% | 49.2 -114% |
| Witcher 3 ultra * (Watt) | 97 | 38.1 |
* ... menor é melhor
| Panasonic Toughbook CF-XZ6 i5-7300U, HD Graphics 620, 76 Wh | Microsoft Surface Book 2 i7-8650U, GeForce GTX 1050 Mobile, 75 Wh | Dell Latitude 7285 i5-7Y57, HD Graphics 615, 54 Wh | Microsoft Surface Pro (2017) i7 i7-7660U, Iris Plus Graphics 640, 45 Wh | Lenovo ThinkPad X1 Tablet Gen 2 i5-7Y54, HD Graphics 615, 37 Wh | HP Elite x2 1012 G2-1LV76EA i5-7200U, HD Graphics 620, 47 Wh | |
|---|---|---|---|---|---|---|
| Duração da bateria | 6% | -34% | -31% | -42% | -41% | |
| Reader / Idle (h) | 22.1 | 24.5 11% | 17.2 -22% | 11 -50% | 13.9 -37% | |
| H.264 (h) | 11.8 | 15.6 32% | 6.2 -47% | 10.2 -14% | 6.3 -47% | |
| WiFi v1.3 (h) | 14 | 11.1 -21% | 6.5 -54% | 8.2 -41% | 7.4 -47% | 6.3 -55% |
| Load (h) | 3.1 | 3.2 3% | 2.7 -13% | 1.9 -39% | 2.2 -29% | 2.3 -26% |
| Witcher 3 ultra (h) | 3.8 | 1.9 |
Pro
Contra

O Panasonic Toughbook CF-XZ6 é um desmontável interessante que possui alguns recursos excelentes - mas também algumas fraquezas e falhas grandes.
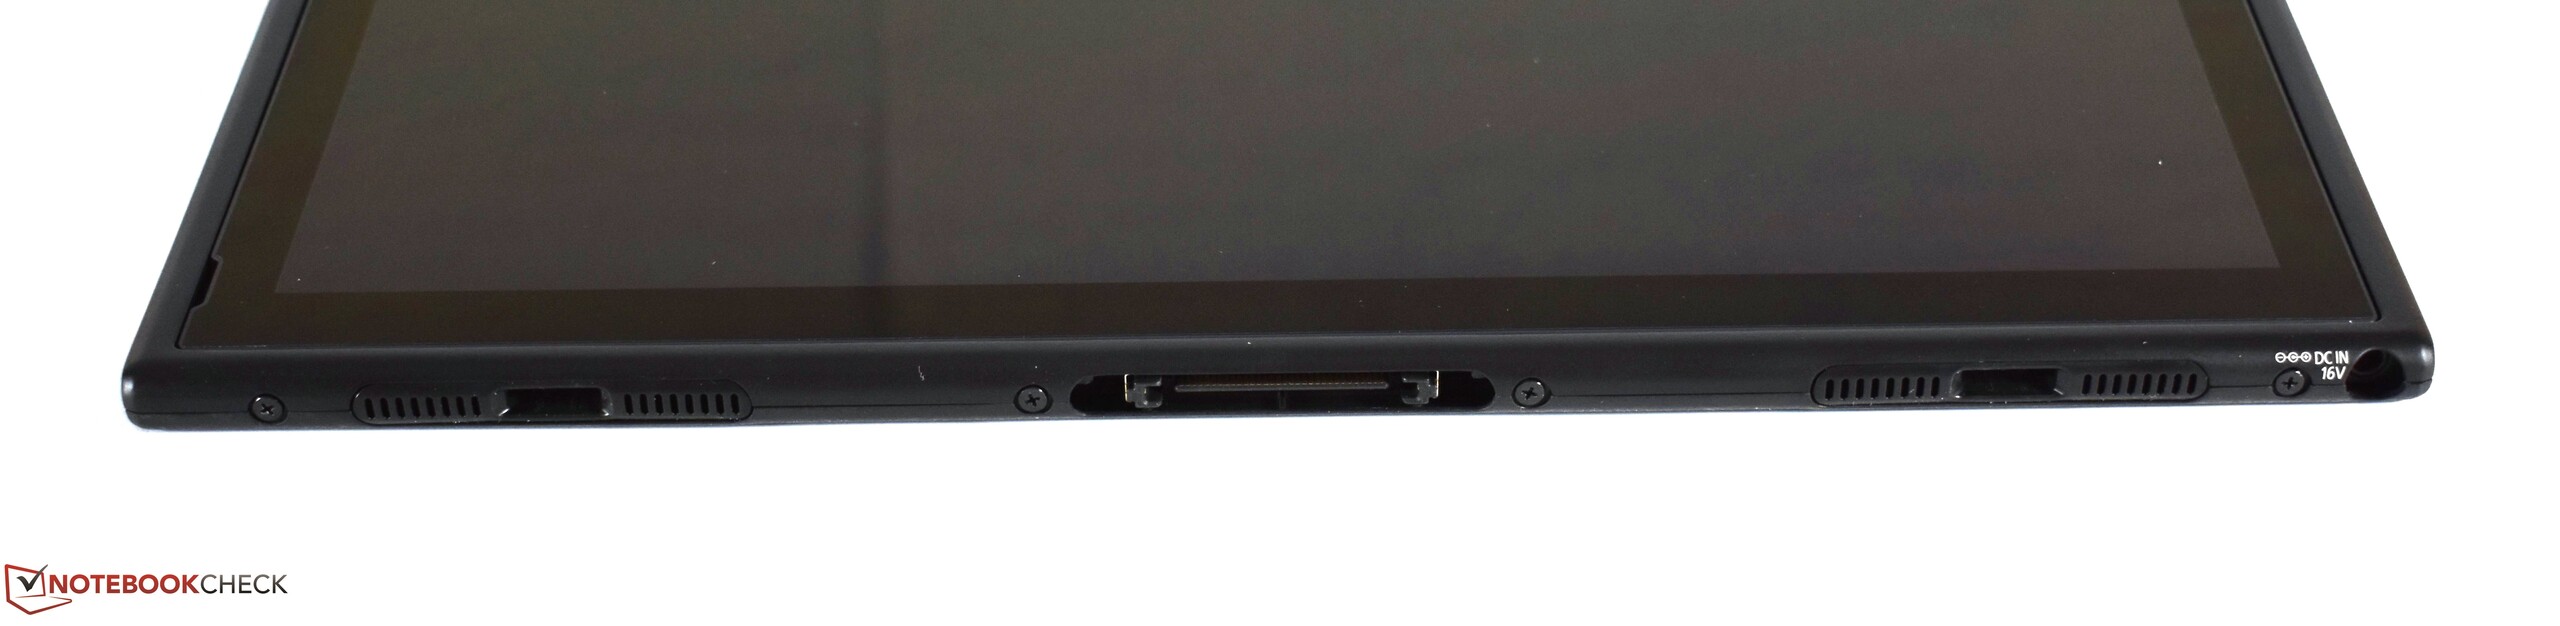
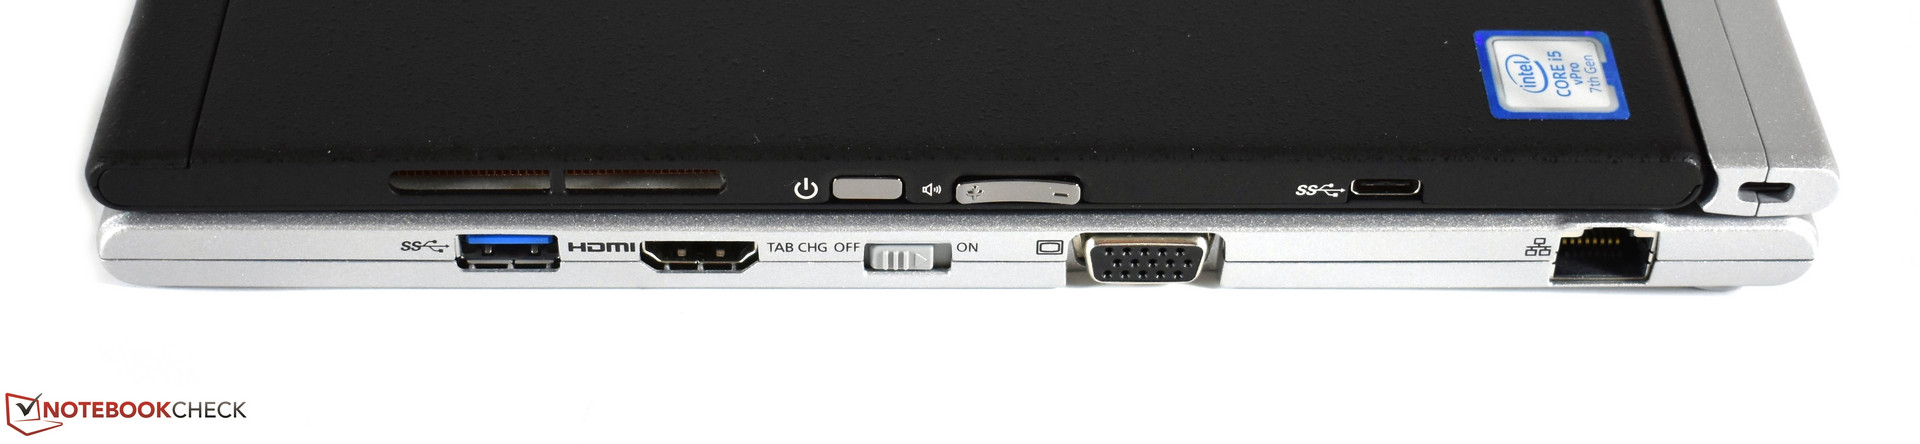
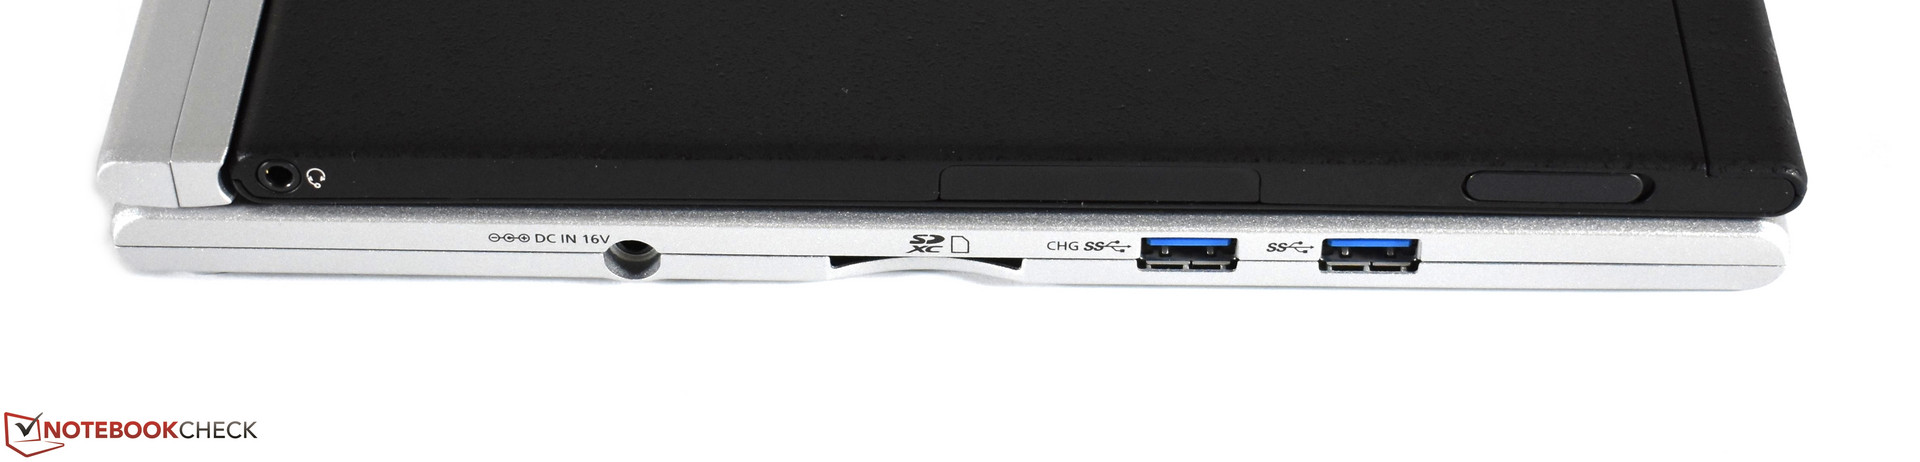
Se você der uma olhada na duração da bateria ou no brilho da tela da tela semi mate, por exemplo, terá a impressão de estar olhando para um portátil de primeira classe. Nenhum concorrente consegue competir com o Toughbook nestes aspectos. Outra vantagem é a sua flexibilidade: O Toughbook é claramente o melhor no segmento de desmontáveis ou tablets 2-em-1. Uma porta VGA e Ethernet ainda é essencial para um portátil empresarial e a bateria substituível lhe oferece a opção de ter durações ainda melhores. E apesar de que o Toughbook tem uma carcaça de metal pequena e leve, se sene muito robusto. O módulo WWAN incluído mantém você conectado em qualquer lugar.
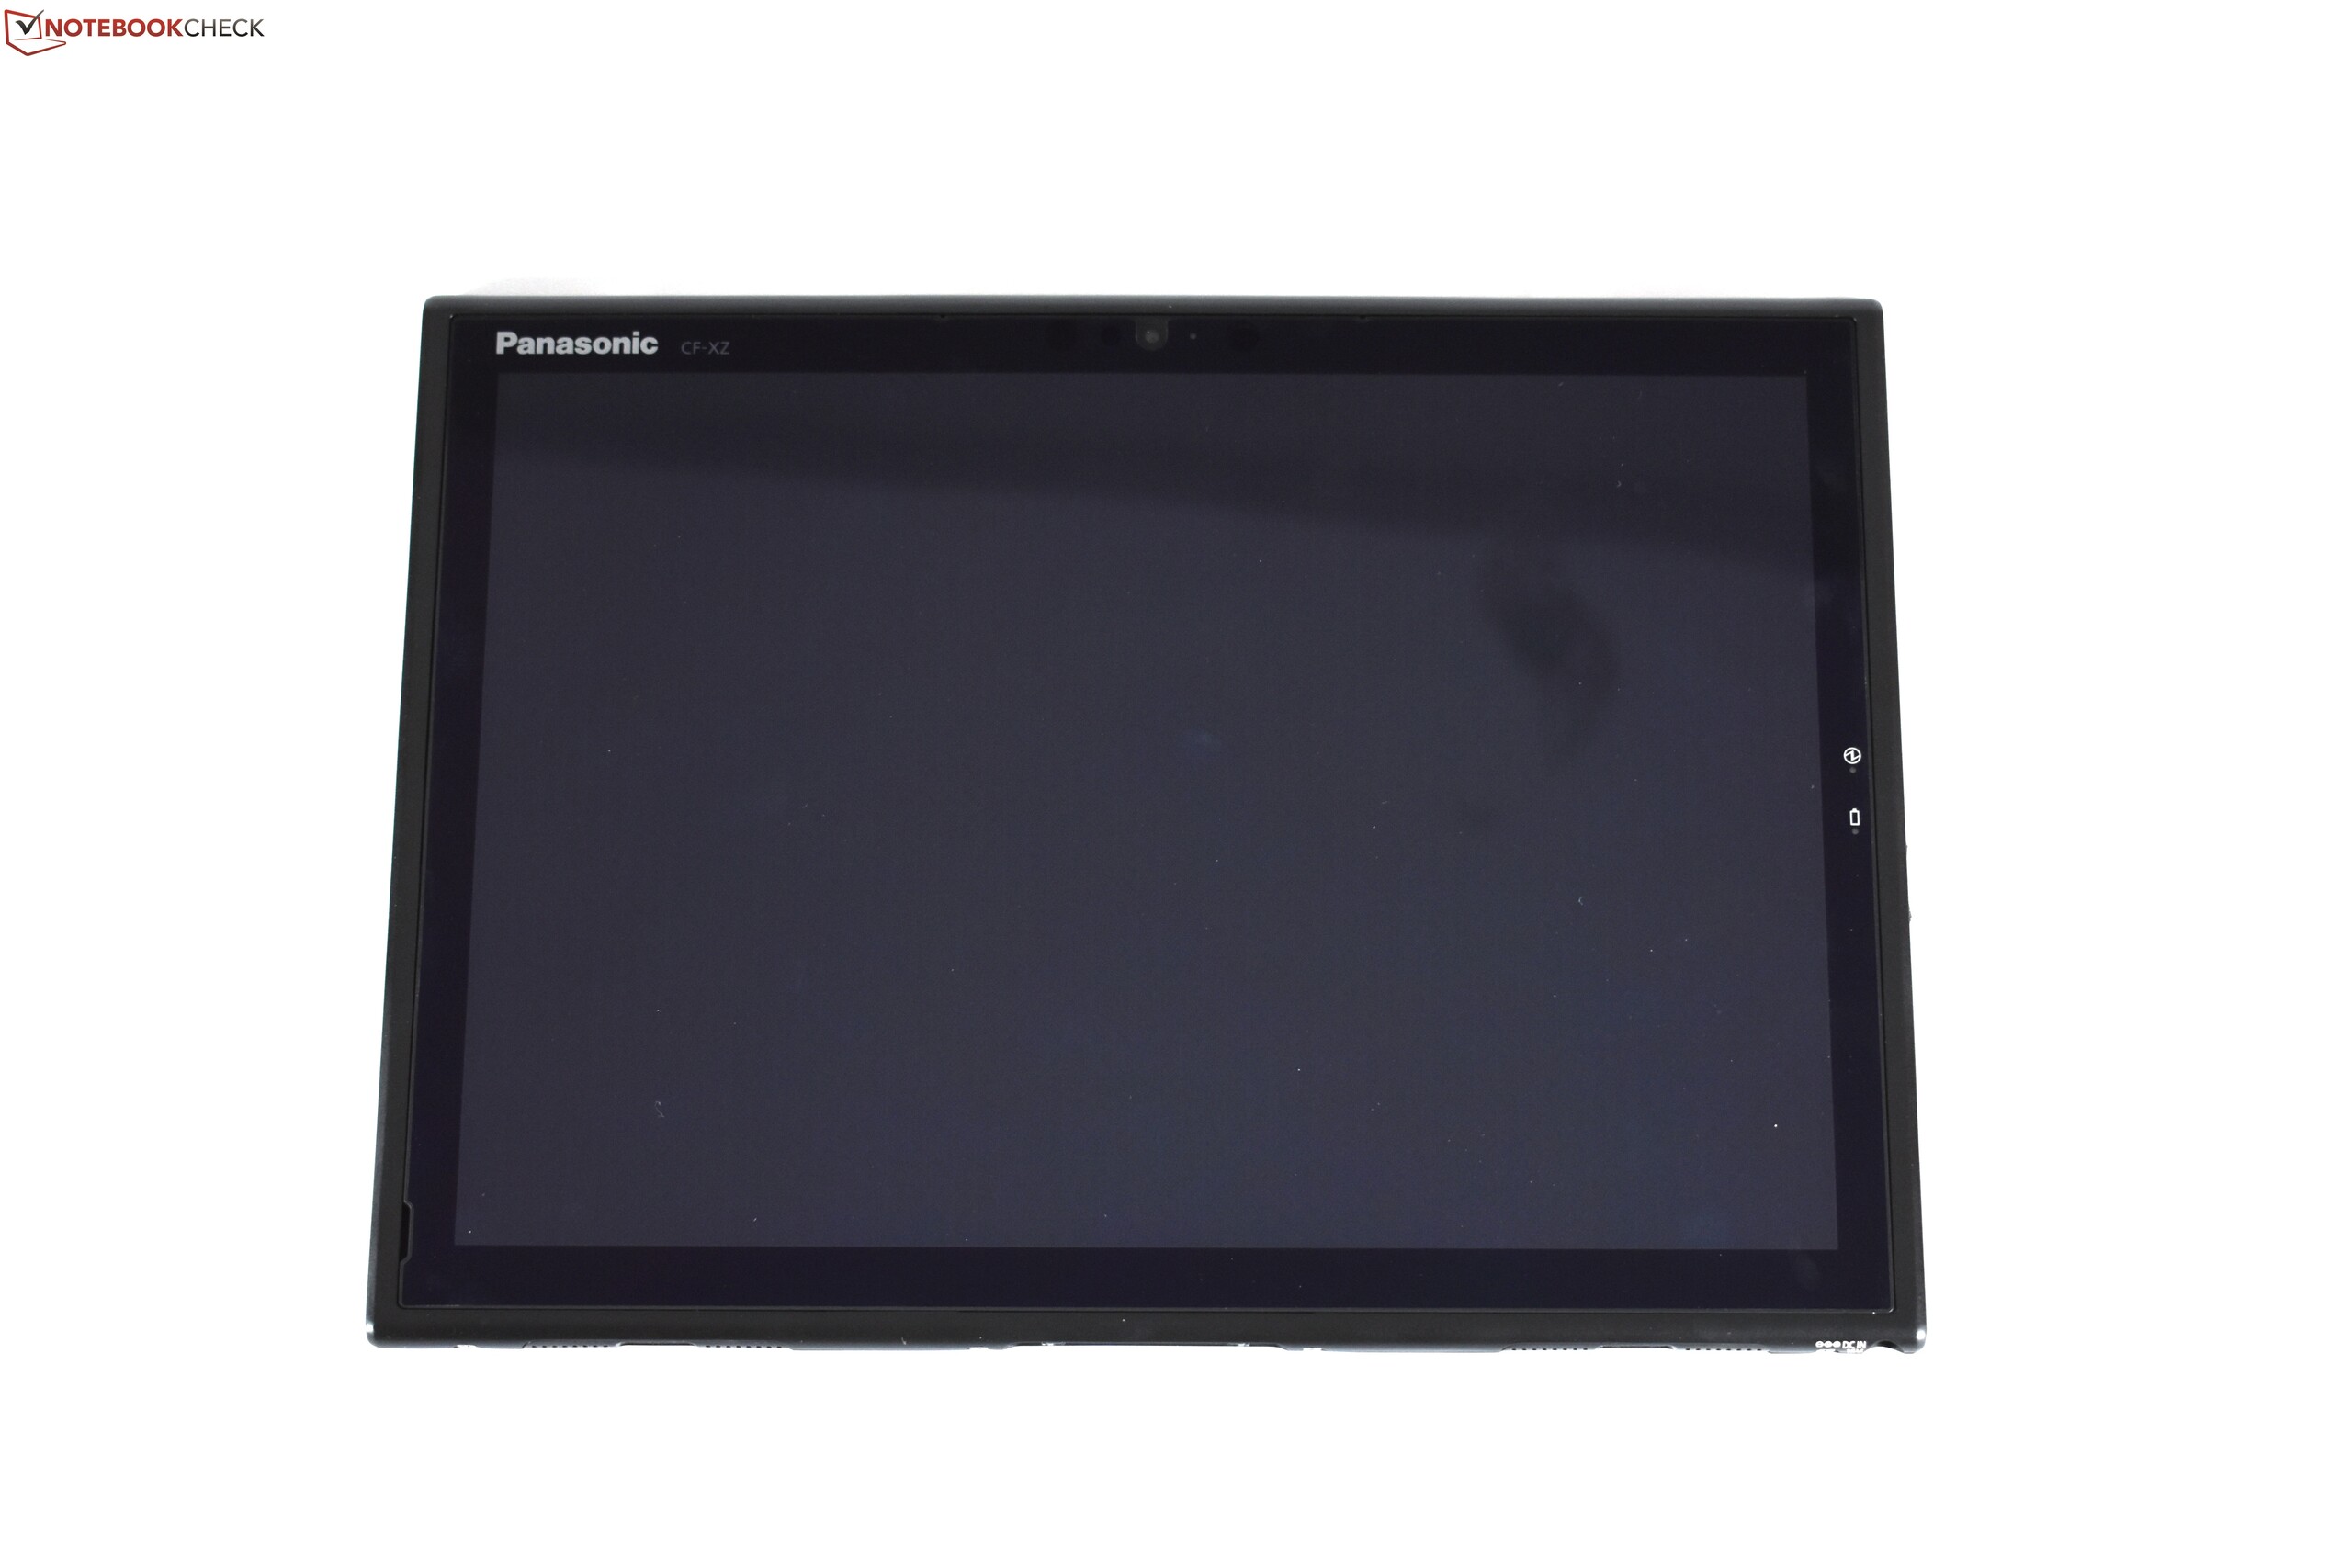
Tão bom quanto tudo isso soa: As fraquezas não são facilmente ignoradas. Começa com a tela, cujo brilho diminui tão fortemente na borda esquerda que você pode vê-lo a olho nu. A tela também tem PWM e a cobertura de espaço de cores é simplesmente ruim para um portátil dessa faixa de preços. Mas não é apenas o dispositivo de saída principal que tem alguns problemas. Os dois principais dispositivos de entrada são bastante decepcionantes também: O teclado tem um layout muito peculiar, que causou vários erros de digitação e o touchpad parece ter chegado na década errada com sua pequena área de toque. Apenas estes dois pontos tornam quase impossível imaginar este dispositivo como uma ferramenta de trabalho. Considerando tudo isso, quase podemos perdoar a má qualidade do alto-falante mono, embora normalmente esperássemos mais de um dispositivo que custa £1850. Esta não é a única área em que a Panasonic tentou poupar algum dinheiro. O SSD pequeno de 256 GB, por exemplo, é apenas uma unidade flash SATA-III. Por último, mas não menos importante, devemos mencionar alguns problemas de qualidade. O acabamento da carcaça, por exemplo, não é boa em algumas áreas e, ocasionalmente, ouvimos o ruído da bobina.
Não é para as massas. A qualidade do Panasonic Toughbook CF-XZ6 é muito inconsistente para realmente competir com os dispositivos desmontáveis de outros grandes fabricantes. Provavelmente permanecerá em seu nicho.
Fizemos uma pergunta na introdução: Nicho ou mercado de massa? A resposta é clara para o Toughbook - definitivamente nicho. O usuário médio não ficará feliz com o Toughbook, portanto não podemos dar uma recomendação geral.
Mas se você é um usuário que precisa das características especiais do Toughbook, como uma bateria trocável, alto brilho da tela ou as portas legadas em um dispositivo destacável, provavelmente não encontrará nada melhor que o Toughbook CF-XZ6, apesar de suas fraquezas. Só podemos recomendar o dispositivo para este grupo muito específico - e mesmo assim, apenas com uma palavra de cautela. Em qualquer caso, você deve certificar-se de que a distribuição do brilho da tela seja mais uniforme do que em nossa unidade de teste - esta falha em um dispositivo comprado é definitivamente um motivo para reclamar.
Panasonic Toughbook CF-XZ6
- 01/11/2018 v6 (old)
Benjamin Herzig
Price comparison
