Breve Análise do Portátil Reforçado Panasonic Toughbook CF-54 (i5-7300U)
| SD Card Reader | |
| average JPG Copy Test (av. of 3 runs) | |
| Panasonic Toughbook CF-54G2999VM (Toshiba Exceria Pro SDXC 64 GB UHS-II) | |
| Dell Latitude 7490 (Toshiba Exceria Pro M501 UHS-II) | |
| Dell Latitude 14 7414 Rugged Extreme (Toshiba Exceria Pro SDXC 64 GB UHS-II) | |
| Getac S410 (Toshiba Exceria Pro SDXC 64 GB UHS-II) | |
| Fujitsu LifeBook U748 (Toshiba Exceria Pro SDXC 64 GB UHS-II) | |
| Panasonic Toughbook CF-33 (Toshiba Exceria Pro SDXC 64 GB UHS-II) | |
| maximum AS SSD Seq Read Test (1GB) | |
| Dell Latitude 14 7414 Rugged Extreme (Toshiba Exceria Pro SDXC 64 GB UHS-II) | |
| Dell Latitude 7490 (Toshiba Exceria Pro M501 UHS-II) | |
| Panasonic Toughbook CF-54G2999VM (Toshiba Exceria Pro SDXC 64 GB UHS-II) | |
| Getac S410 (Toshiba Exceria Pro SDXC 64 GB UHS-II) | |
| Fujitsu LifeBook U748 (Toshiba Exceria Pro SDXC 64 GB UHS-II) | |
| Panasonic Toughbook CF-33 (Toshiba Exceria Pro SDXC 64 GB UHS-II) | |
| Networking | |
| iperf3 transmit AX12 | |
| Dell Latitude 14 7414 Rugged Extreme | |
| Getac S410 | |
| Dell Latitude 7490 | |
| Panasonic Toughbook CF-54G2999VM | |
| Fujitsu LifeBook U748 | |
| Panasonic Toughbook CF-33 | |
| iperf3 receive AX12 | |
| Getac S410 | |
| Dell Latitude 7490 | |
| Panasonic Toughbook CF-54G2999VM | |
| Fujitsu LifeBook U748 | |
| Dell Latitude 14 7414 Rugged Extreme | |
| Panasonic Toughbook CF-33 | |
| |||||||||||||||||||||||||
iluminação: 71 %
iluminação com acumulador: 174.5 cd/m²
Contraste: 291:1 (Preto: 0.6 cd/m²)
ΔE ColorChecker Calman: 12.05 | ∀{0.5-29.43 Ø4.73}
calibrated: 4.34
ΔE Greyscale Calman: 14.8 | ∀{0.09-98 Ø4.97}
56.2% sRGB (Argyll 1.6.3 3D)
35.7% AdobeRGB 1998 (Argyll 1.6.3 3D)
38.62% AdobeRGB 1998 (Argyll 3D)
56.1% sRGB (Argyll 3D)
37.36% Display P3 (Argyll 3D)
Gamma: 1.4
CCT: 14529 K
| Panasonic Toughbook CF-54G2999VM B140XTN, AUO2E3C, TN LED, 14", 1366x768 | Dell Latitude 14 7414 Rugged Extreme Sharp LQ140K1, IPS, 14", 1366x768 | Dell Latitude 7490 AU Optronics AU0223D, IPS, 14", 1920x1080 | Panasonic Toughbook CF-33 Manufacturer unknown, ID: TMA1200, IPS, 12", 2160x1440 | Samsung Notebook 9 NP900X5T-X01US ID: BOE06E8, Name: BOE HF NV150FHB-N31, IPS, 15", 1920x1080 | Getac S410 CMN N140BGE-E33, TN PED, 14", 1366x768 | |
|---|---|---|---|---|---|---|
| Display | -0% | 65% | 18% | 74% | 8% | |
| Display P3 Coverage (%) | 37.36 | 37.22 0% | 63.6 70% | 44.24 18% | 65.2 75% | 40.46 8% |
| sRGB Coverage (%) | 56.1 | 55.8 -1% | 88.8 58% | 66.7 19% | 97.4 74% | 60.9 9% |
| AdobeRGB 1998 Coverage (%) | 38.62 | 38.49 0% | 64.8 68% | 45.71 18% | 66.8 73% | 41.8 8% |
| Response Times | -29% | -50% | -19% | -39% | 12% | |
| Response Time Grey 50% / Grey 80% * (ms) | 43.2 ? | 43 ? -0% | 48.4 ? -12% | 30 ? 31% | 46 ? -6% | 41.2 ? 5% |
| Response Time Black / White * (ms) | 17.2 ? | 27 ? -57% | 32.4 ? -88% | 29 ? -69% | 29.6 ? -72% | 14 ? 19% |
| PWM Frequency (Hz) | 200 ? | 685 | 2976 ? | 877 ? | ||
| Screen | 68% | 73% | 219% | 114% | 17% | |
| Brightness middle (cd/m²) | 174.5 | 493 183% | 328.2 88% | 571 227% | 558.2 220% | 265.1 52% |
| Brightness (cd/m²) | 164 | 456 178% | 305 86% | 555 238% | 528 222% | 246 50% |
| Brightness Distribution (%) | 71 | 81 14% | 87 23% | 89 25% | 92 30% | 81 14% |
| Black Level * (cd/m²) | 0.6 | 0.53 12% | 0.37 38% | 0.11 82% | 0.46 23% | 0.58 3% |
| Contrast (:1) | 291 | 930 220% | 887 205% | 5191 1684% | 1213 317% | 457 57% |
| Colorchecker dE 2000 * | 12.05 | 11.08 8% | 3.82 68% | 22.7 -88% | 4.41 63% | 14.24 -18% |
| Colorchecker dE 2000 max. * | 27.5 | 15.11 45% | 5.58 80% | 34.14 -24% | 10.91 60% | 26.66 3% |
| Colorchecker dE 2000 calibrated * | 4.34 | 3.5 19% | 3.94 9% | |||
| Greyscale dE 2000 * | 14.8 | 11.99 19% | 3 80% | 13.6 8% | 6.6 55% | 14.2 4% |
| Gamma | 1.4 157% | 4.03 55% | 2.36 93% | 5.51 40% | 2.19 100% | 2.03 108% |
| CCT | 14529 45% | 10872 60% | 6962 93% | 6998 93% | 7615 85% | 17152 38% |
| Color Space (Percent of AdobeRGB 1998) (%) | 35.7 | 36 1% | 58 62% | 42.5 19% | 61.3 72% | 38.7 8% |
| Color Space (Percent of sRGB) (%) | 56.2 | 56 0% | 88 57% | 67.02 19% | 97.2 73% | 61 9% |
| Média Total (Programa/Configurações) | 13% /
41% | 29% /
56% | 73% /
147% | 50% /
85% | 12% /
15% |
* ... menor é melhor
Exibir tempos de resposta
| ↔ Tempo de resposta preto para branco | ||
|---|---|---|
| 17.2 ms ... ascensão ↗ e queda ↘ combinadas | ↗ 11.2 ms ascensão | 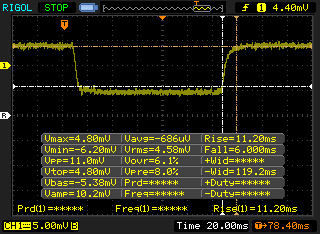 |
| ↘ 6 ms queda | ||
| A tela mostra boas taxas de resposta em nossos testes, mas pode ser muito lenta para jogadores competitivos. Em comparação, todos os dispositivos testados variam de 0.1 (mínimo) a 240 (máximo) ms. » 39 % de todos os dispositivos são melhores. Isso significa que o tempo de resposta medido é melhor que a média de todos os dispositivos testados (19.9 ms). | ||
| ↔ Tempo de resposta 50% cinza a 80% cinza | ||
| 43.2 ms ... ascensão ↗ e queda ↘ combinadas | ↗ 16.8 ms ascensão | 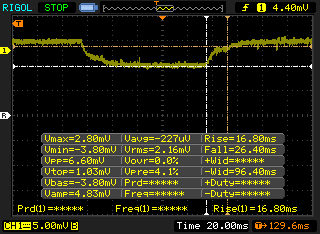 |
| ↘ 26.4 ms queda | ||
| A tela mostra taxas de resposta lentas em nossos testes e será insatisfatória para os jogadores. Em comparação, todos os dispositivos testados variam de 0.165 (mínimo) a 636 (máximo) ms. » 72 % de todos os dispositivos são melhores. Isso significa que o tempo de resposta medido é pior que a média de todos os dispositivos testados (31.1 ms). | ||
Cintilação da tela / PWM (modulação por largura de pulso)
| Tela tremeluzindo / PWM não detectado | 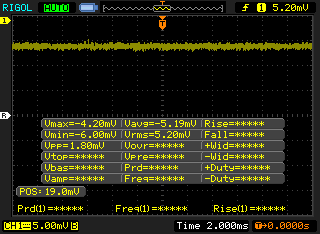 | ||
[pwm_comparison] Em comparação: 52 % de todos os dispositivos testados não usam PWM para escurecer a tela. Se PWM foi detectado, uma média de 7784 (mínimo: 5 - máximo: 343500) Hz foi medida. | |||
| Cinebench R15 | |
| CPU Single 64Bit | |
| Getac S410 | |
| Dell Latitude 15 3590-K8JP | |
| Lenovo ThinkPad 25 | |
| HP 15-da0405ng | |
| Média Intel Core i5-7300U (125 - 145, n=9) | |
| Lenovo ThinkPad A485-20MU000CGE | |
| Lenovo IdeaPad 720-15IKB | |
| Panasonic Toughbook CF-54G2999VM | |
| HP 250 G4 T6P08ES | |
| Microsoft Surface Go MHN-00003 | |
| Teclast Tbook 16 Power | |
| CPU Multi 64Bit | |
| Dell Latitude 15 3590-K8JP | |
| HP 15-da0405ng | |
| Lenovo ThinkPad A485-20MU000CGE | |
| Getac S410 | |
| Lenovo ThinkPad 25 | |
| Panasonic Toughbook CF-54G2999VM | |
| Média Intel Core i5-7300U (328 - 369, n=9) | |
| Lenovo IdeaPad 720-15IKB | |
| HP 250 G4 T6P08ES | |
| Microsoft Surface Go MHN-00003 | |
| Teclast Tbook 16 Power | |
| PCMark 10 - Score | |
| Média da turma Office (2601 - 9298, n=64, últimos 2 anos) | |
| Dell Latitude 7490 | |
| Panasonic Toughbook CF-33 | |
| Panasonic Toughbook CF-54G2999VM | |
| Fujitsu LifeBook U748 | |
| PCMark 8 - Home Score Accelerated v2 | |
| Média da turma Office (n=1últimos 2 anos) | |
| Dell Latitude 7490 | |
| Panasonic Toughbook CF-54G2999VM | |
| Dell Latitude 14 7414 Rugged Extreme | |
| Fujitsu LifeBook U748 | |
| Panasonic Toughbook CF-33 | |
| PCMark 8 Home Score Accelerated v2 | 3906 pontos | |
| PCMark 10 Score | 2972 pontos | |
Ajuda | ||
| Panasonic Toughbook CF-54G2999VM Seagate BarraCuda Compute 1TB ST1000LM048 | Lenovo IdeaPad 330-15ARR-81D2005JGE Seagate Mobile HDD 1TB ST1000LM035 | Dell G3 15 3579 Seagate Mobile HDD 1TB ST1000LX015-1U7172 | HP 15-db0500ng Seagate Mobile HDD 1TB ST1000LM035 | Toshiba Tecra A50-C1510W10 Hitachi Travelstar Z7K500 HTS725050A7E630 | Toshiba Satellite Radius 15 P50W-C-102 HGST Travelstar 5K1000 HTS541010A9E680 | |
|---|---|---|---|---|---|---|
| HD Tune Transfer Rate Average | ||||||
| Transfer Rate Average (MB/s) | 98.8 | 84.4 -15% | 97.5 -1% | 98.5 0% | 102.6 4% | 70.5 -29% |

| 3DMark 11 Performance | 1873 pontos | |
Ajuda | ||
| baixo | média | alto | ultra | |
|---|---|---|---|---|
| BioShock Infinite (2013) | 54.7 | 33.5 | 28.9 |
Barulho
| Ocioso |
| 28.8 / 28.8 / 29.1 dB |
| Carga |
| 31.3 / 40 dB |
 | ||
30 dB silencioso 40 dB(A) audível 50 dB(A) ruidosamente alto |
||
min: | ||
| Panasonic Toughbook CF-54G2999VM HD Graphics 620, i5-7300U, Seagate BarraCuda Compute 1TB ST1000LM048 | Dell Latitude 14 7414 Rugged Extreme HD Graphics 520, 6300U, Liteonit CV3-8D128 | Dell Latitude 7490 UHD Graphics 620, i7-8650U, Samsung PM961 MZVLW256HEHP | Panasonic Toughbook CF-33 HD Graphics 620, i5-7300U, Toshiba SG5 256GB THNSNK256GVN8 | Getac S410 UHD Graphics 620, i5-8550U, CUKUSA 1 TB SATA SSD Q0526A | |
|---|---|---|---|---|---|
| Noise | 1% | -1% | -2% | 4% | |
| desligado / ambiente * (dB) | 28.3 | 30.2 -7% | 28.2 -0% | 30.3 -7% | 28.4 -0% |
| Idle Minimum * (dB) | 28.8 | 30.2 -5% | 28.2 2% | 30.3 -5% | 28.4 1% |
| Idle Average * (dB) | 28.8 | 30.2 -5% | 28.2 2% | 30.3 -5% | 28.4 1% |
| Idle Maximum * (dB) | 29.1 | 30.2 -4% | 31.4 -8% | 30.5 -5% | 28.4 2% |
| Load Average * (dB) | 31.3 | 30.2 4% | 31.7 -1% | 30.5 3% | 30.3 3% |
| Load Maximum * (dB) | 40 | 31.7 21% | 41.2 -3% | 36.6 8% | 33.3 17% |
* ... menor é melhor
(+) A temperatura máxima no lado superior é 38.2 °C / 101 F, em comparação com a média de 34.3 °C / 94 F , variando de 21.2 a 62.5 °C para a classe Office.
(+) A parte inferior aquece até um máximo de 38 °C / 100 F, em comparação com a média de 36.8 °C / 98 F
(+) Em uso inativo, a temperatura média para o lado superior é 27.1 °C / 81 F, em comparação com a média do dispositivo de 29.5 °C / ### class_avg_f### F.
(+) Os apoios para as mãos e o touchpad são mais frios que a temperatura da pele, com um máximo de 29.8 °C / 85.6 F e, portanto, são frios ao toque.
(-) A temperatura média da área do apoio para as mãos de dispositivos semelhantes foi 27.5 °C / 81.5 F (-2.3 °C / -4.1 F).
Panasonic Toughbook CF-54G2999VM análise de áudio
(-) | alto-falantes não muito altos (###valor### dB)
Graves 100 - 315Hz
(-) | quase nenhum baixo - em média 25.6% menor que a mediana
(+) | o baixo é linear (5% delta para a frequência anterior)
Médios 400 - 2.000 Hz
(±) | médios mais altos - em média 7.8% maior que a mediana
(-) | médios não são lineares (17.3% delta para frequência anterior)
Altos 2 - 16 kHz
(+) | agudos equilibrados - apenas 4.3% longe da mediana
(±) | a linearidade dos máximos é média (7.9% delta para frequência anterior)
Geral 100 - 16.000 Hz
(-) | o som geral não é linear (39.6% diferença em relação à mediana)
Comparado com a mesma classe
» 99% de todos os dispositivos testados nesta classe foram melhores, 1% semelhantes, 1% piores
» O melhor teve um delta de 7%, a média foi 21%, o pior foi 53%
Comparado com todos os dispositivos testados
» 95% de todos os dispositivos testados foram melhores, 0% semelhantes, 5% piores
» O melhor teve um delta de 4%, a média foi 24%, o pior foi 134%
Apple MacBook 12 (Early 2016) 1.1 GHz análise de áudio
(+) | os alto-falantes podem tocar relativamente alto (###valor### dB)
Graves 100 - 315Hz
(±) | graves reduzidos - em média 11.3% menor que a mediana
(±) | a linearidade dos graves é média (14.2% delta para a frequência anterior)
Médios 400 - 2.000 Hz
(+) | médios equilibrados - apenas 2.4% longe da mediana
(+) | médios são lineares (5.5% delta para frequência anterior)
Altos 2 - 16 kHz
(+) | agudos equilibrados - apenas 2% longe da mediana
(+) | os máximos são lineares (4.5% delta da frequência anterior)
Geral 100 - 16.000 Hz
(+) | o som geral é linear (10.2% diferença em relação à mediana)
Comparado com a mesma classe
» 7% de todos os dispositivos testados nesta classe foram melhores, 2% semelhantes, 91% piores
» O melhor teve um delta de 5%, a média foi 18%, o pior foi 53%
Comparado com todos os dispositivos testados
» 5% de todos os dispositivos testados foram melhores, 1% semelhantes, 94% piores
» O melhor teve um delta de 4%, a média foi 24%, o pior foi 134%
| desligado | |
| Ocioso | |
| Carga |
|
Key:
min: | |
| Panasonic Toughbook CF-54G2999VM i5-7300U, HD Graphics 620, Seagate BarraCuda Compute 1TB ST1000LM048, TN LED, 1366x768, 14" | Dell Latitude 14 7414 Rugged Extreme 6300U, HD Graphics 520, Liteonit CV3-8D128, IPS, 1366x768, 14" | Fujitsu LifeBook U748 i5-8250U, UHD Graphics 620, Samsung PM961 MZVLW256HEHP, IPS, 1920x1080, 14" | Dell Latitude 7490 i7-8650U, UHD Graphics 620, Samsung PM961 MZVLW256HEHP, IPS, 1920x1080, 14" | Panasonic Toughbook CF-33 i5-7300U, HD Graphics 620, Toshiba SG5 256GB THNSNK256GVN8, IPS, 2160x1440, 12" | Getac S410 i5-8550U, UHD Graphics 620, CUKUSA 1 TB SATA SSD Q0526A, TN PED, 1366x768, 14" | |
|---|---|---|---|---|---|---|
| Power Consumption | -64% | -1% | -4% | 23% | -12% | |
| Idle Minimum * (Watt) | 4.4 | 6.8 -55% | 3.33 24% | 3.1 30% | 3.6 18% | 5.6 -27% |
| Idle Average * (Watt) | 6.3 | 13.4 -113% | 6.9 -10% | 6.5 -3% | 4.6 27% | 7.9 -25% |
| Idle Maximum * (Watt) | 6.5 | 16.8 -158% | 8.2 -26% | 7.6 -17% | 5.15 21% | 8.4 -29% |
| Load Average * (Watt) | 36.3 | 35.2 3% | 29.4 19% | 43 -18% | 27 26% | 32.8 10% |
| Load Maximum * (Watt) | 38.3 | 36.3 5% | 43.4 -13% | 43.8 -14% | 29.2 24% | 34.3 10% |
* ... menor é melhor
| Panasonic Toughbook CF-54G2999VM i5-7300U, HD Graphics 620, 33 Wh | Dell Latitude 14 7414 Rugged Extreme 6300U, HD Graphics 520, 97 Wh | Dell Latitude 7490 i7-8650U, UHD Graphics 620, 60 Wh | Panasonic Toughbook CF-33 i5-7300U, HD Graphics 620, 44 Wh | Samsung Notebook 9 NP900X5T-X01US i5-8550U, GeForce MX150, 75 Wh | Getac S410 i5-8550U, UHD Graphics 620, 46.6 Wh | |
|---|---|---|---|---|---|---|
| Duração da bateria | 78% | 59% | 34% | 80% | -12% | |
| WiFi v1.3 (h) | 5.9 | 10.5 78% | 9.4 59% | 7.9 34% | 10.6 80% | 5.2 -12% |
| Reader / Idle (h) | 18.6 | 30.2 | ||||
| Load (h) | 1.5 | 2.1 |
Pro
Contra

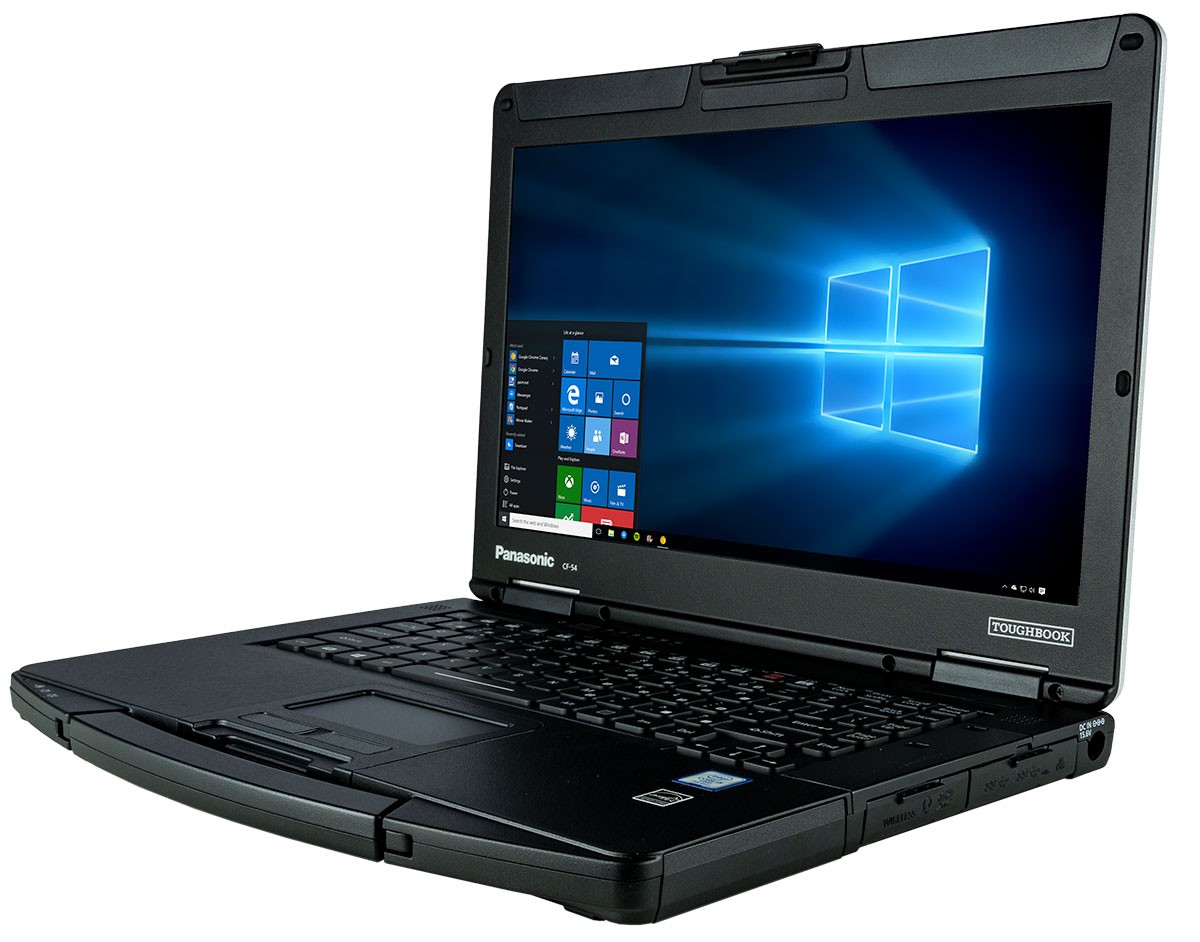
A Panasonic oferece seu Toughbook CF-54 em uma gama muito ampla de SKUs para melhor atender a casos de uso específicos. Embora não possamos agradar todos e cada um, definitivamente podemos recomendar quais evitar e quais considerar. Mais especificamente, os usuários que pretendem usar o Toughbook CF-54 em ambientes externos ou em automóveis devem investir na tela de 1080p com retro iluminação de 1000 nits. Sem esse recurso, a tela será muito escura para a maioria dos cenários.
Além disso, se o desempenho gráfico não for uma preocupação, a configuração do Core i5-7300U deve ser suficiente, pois há um benefício mínimo entre o i5-7300U e o i7-7600U. Os dólares extras economizados seriam mais bem gastos em um SSD primário para um aumento mais tangível no desempenho geral.
Para futuras revisões, esperamos ver as opções de CPU Intel 8va ger., já que as gerações mais antigas estão começando a mostrar sua idade. Posicionamento de portas aprimorado, ruído do ventilador mais gradual, alto-falantes internos mais altos e teclas auxiliares personalizáveis podem contribuir para uma máquina ainda mais versátil.
Panasonic Toughbook CF-54G2999VM
- 10/05/2018 v6 (old)
Allen Ngo
Price comparison
