Hot Ice: Breve Análise do Portátil 2-em-1 Core i3 Dell XPS 13 7390
| SD Card Reader | |
| average JPG Copy Test (av. of 3 runs) | |
| Dell XPS 13 9380 2019 (Toshiba Exceria Pro SDXC 64 GB UHS-II) | |
| Dell XPS 13 7390 2-in-1 Core i3 (Toshiba Exceria Pro M501 64 GB UHS-II) | |
| HP Spectre x360 13-ap0312ng (Toshiba Exceria Pro M501 64 GB UHS-II) | |
| Dell XPS 13-9365 2-in-1 (Toshiba THN-M401S0640E2) | |
| maximum AS SSD Seq Read Test (1GB) | |
| Dell XPS 13 7390 2-in-1 Core i3 (Toshiba Exceria Pro M501 64 GB UHS-II) | |
| HP Spectre x360 13-ap0312ng (Toshiba Exceria Pro M501 64 GB UHS-II) | |
| Dell XPS 13 9380 2019 (Toshiba Exceria Pro SDXC 64 GB UHS-II) | |
| Dell XPS 13-9365 2-in-1 (Toshiba THN-M401S0640E2) | |
| Networking | |
| iperf3 transmit AX12 | |
| HP Spectre x360 13-ap0312ng | |
| Dell XPS 13 9380 2019 | |
| Dell XPS 13 7390 2-in-1 Core i3 | |
| Dell XPS 13-9365 2-in-1 | |
| iperf3 receive AX12 | |
| Dell XPS 13 7390 2-in-1 Core i3 | |
| HP Spectre x360 13-ap0312ng | |
| Dell XPS 13 9380 2019 | |
| Dell XPS 13-9365 2-in-1 | |
| |||||||||||||||||||||||||
iluminação: 88 %
iluminação com acumulador: 576.3 cd/m²
Contraste: 1746:1 (Preto: 0.33 cd/m²)
ΔE ColorChecker Calman: 1.45 | ∀{0.5-29.43 Ø4.72}
calibrated: 1.19
ΔE Greyscale Calman: 3.1 | ∀{0.09-98 Ø4.97}
98.5% sRGB (Argyll 1.6.3 3D)
64.2% AdobeRGB 1998 (Argyll 1.6.3 3D)
70.4% AdobeRGB 1998 (Argyll 3D)
98.2% sRGB (Argyll 3D)
68.6% Display P3 (Argyll 3D)
Gamma: 2.27
CCT: 6931 K
| Dell XPS 13 7390 2-in-1 Core i3 Sharp LQ134N1, IPS, 13.4", 1920x1200 | Dell XPS 13 9380 2019 ID: AUO 282B B133ZAN Dell: 90NTH, IPS, 13.3", 3840x2160 | Dell XPS 13-9365 2-in-1 IPS, 13.3", 1920x1080 | HP Spectre x360 13-ap0312ng M133NVF3, IPS, 13.3", 1920x1080 | Lenovo Yoga C930-13IKB 81C4 AUO B139HAN03_0, IPS, 13.9", 1920x1080 | Asus ZenBook S13 UX392FN Tianma XM, IPS, 13.9", 1920x1080 | |
|---|---|---|---|---|---|---|
| Display | -6% | -30% | -9% | -8% | -2% | |
| Display P3 Coverage (%) | 68.6 | 64.7 -6% | 47.32 -31% | 63 -8% | 62.7 -9% | 67.5 -2% |
| sRGB Coverage (%) | 98.2 | 93.1 -5% | 71.1 -28% | 89.8 -9% | 92.6 -6% | 95.8 -2% |
| AdobeRGB 1998 Coverage (%) | 70.4 | 65.3 -7% | 48.83 -31% | 64.1 -9% | 64.7 -8% | 69 -2% |
| Response Times | -17% | -1% | 39% | 25% | 12% | |
| Response Time Grey 50% / Grey 80% * (ms) | 46 ? | 58 ? -26% | 48 ? -4% | 29.2 ? 37% | 34.4 ? 25% | 47.2 ? -3% |
| Response Time Black / White * (ms) | 33.6 ? | 36 ? -7% | 32.8 ? 2% | 20 ? 40% | 25.6 ? 24% | 24.8 ? 26% |
| PWM Frequency (Hz) | 2525 ? | 1042 ? | 1000 ? | |||
| Screen | -43% | -86% | -60% | -103% | -11% | |
| Brightness middle (cd/m²) | 576.3 | 404 -30% | 322.6 -44% | 272 -53% | 312 -46% | 466 -19% |
| Brightness (cd/m²) | 555 | 389 -30% | 306 -45% | 298 -46% | 295 -47% | 462 -17% |
| Brightness Distribution (%) | 88 | 85 -3% | 91 3% | 84 -5% | 87 -1% | 90 2% |
| Black Level * (cd/m²) | 0.33 | 0.37 -12% | 0.19 42% | 0.39 -18% | 0.43 -30% | 0.33 -0% |
| Contrast (:1) | 1746 | 1092 -37% | 1698 -3% | 697 -60% | 726 -58% | 1412 -19% |
| Colorchecker dE 2000 * | 1.45 | 3.72 -157% | 7.7 -431% | 4.3 -197% | 7.6 -424% | 1.93 -33% |
| Colorchecker dE 2000 max. * | 4.12 | 7.38 -79% | 11.1 -169% | 9 -118% | 15.06 -266% | 4.26 -3% |
| Colorchecker dE 2000 calibrated * | 1.19 | 2.06 -73% | 2.4 -102% | 1.96 -65% | 1.99 -67% | |
| Greyscale dE 2000 * | 3.1 | 4.44 -43% | 7.9 -155% | 4.4 -42% | 8.8 -184% | 1.7 45% |
| Gamma | 2.27 97% | 2.34 94% | 2.88 76% | 1.97 112% | 2.01 109% | 2.15 102% |
| CCT | 6931 94% | 7095 92% | 7044 92% | 5825 112% | 6874 95% | 6382 102% |
| Color Space (Percent of AdobeRGB 1998) (%) | 64.2 | 60 -7% | 44.1 -31% | 58.9 -8% | 59.1 -8% | 62.2 -3% |
| Color Space (Percent of sRGB) (%) | 98.5 | 93 -6% | 69.9 -29% | 89.8 -9% | 92.3 -6% | 95.7 -3% |
| Média Total (Programa/Configurações) | -22% /
-33% | -39% /
-64% | -10% /
-38% | -29% /
-69% | -0% /
-6% |
* ... menor é melhor
Exibir tempos de resposta
| ↔ Tempo de resposta preto para branco | ||
|---|---|---|
| 33.6 ms ... ascensão ↗ e queda ↘ combinadas | ↗ 19.2 ms ascensão | 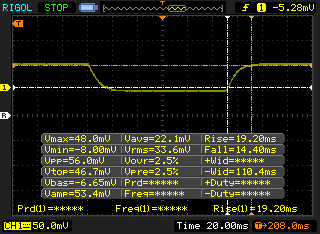 |
| ↘ 14.4 ms queda | ||
| A tela mostra taxas de resposta lentas em nossos testes e será insatisfatória para os jogadores. Em comparação, todos os dispositivos testados variam de 0.1 (mínimo) a 240 (máximo) ms. » 90 % de todos os dispositivos são melhores. Isso significa que o tempo de resposta medido é pior que a média de todos os dispositivos testados (19.9 ms). | ||
| ↔ Tempo de resposta 50% cinza a 80% cinza | ||
| 46 ms ... ascensão ↗ e queda ↘ combinadas | ↗ 23.2 ms ascensão | 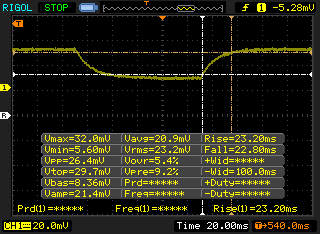 |
| ↘ 22.8 ms queda | ||
| A tela mostra taxas de resposta lentas em nossos testes e será insatisfatória para os jogadores. Em comparação, todos os dispositivos testados variam de 0.165 (mínimo) a 636 (máximo) ms. » 79 % de todos os dispositivos são melhores. Isso significa que o tempo de resposta medido é pior que a média de todos os dispositivos testados (31.1 ms). | ||
Cintilação da tela / PWM (modulação por largura de pulso)
| Tela tremeluzindo/PWM detectado | 2525 Hz | ≤ 25 % configuração de brilho | 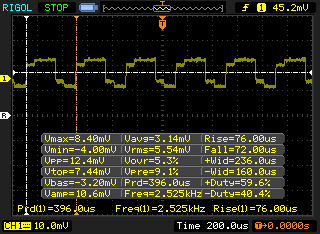 |
A luz de fundo da tela pisca em 2525 Hz (pior caso, por exemplo, utilizando PWM) Cintilação detectada em uma configuração de brilho de 25 % e abaixo. Não deve haver cintilação ou PWM acima desta configuração de brilho. A frequência de 2525 Hz é bastante alta, então a maioria dos usuários sensíveis ao PWM não deve notar nenhuma oscilação. [pwm_comparison] Em comparação: 52 % de todos os dispositivos testados não usam PWM para escurecer a tela. Se PWM foi detectado, uma média de 7784 (mínimo: 5 - máximo: 343500) Hz foi medida. | |||
| Cinebench R15 | |
| CPU Single 64Bit | |
| Lenovo Yoga C930-13IKB 81C4 | |
| HP Spectre x360 13-ap0312ng | |
| Microsoft Surface Pro 6, Core i7, 512 GB | |
| Dell XPS 13 7390 2-in-1 Core i3 | |
| Acer Swift 3 SF314-55-31N8 | |
| Dell XPS 13 9380 2019 | |
| HP EliteBook 735 G5 3UN62EA | |
| Asus VivoBook Flip 14 TP412UA-EC969T | |
| Dell XPS 13-9365 2-in-1 | |
| Lenovo V330-15IKB | |
| Lenovo Thinkpad 13-20J1001BUS | |
| Dell Inspiron 15 3585 (2300U, Vega 6) | |
| CPU Multi 64Bit | |
| Dell XPS 13 9380 2019 | |
| Lenovo Yoga C930-13IKB 81C4 | |
| HP EliteBook 735 G5 3UN62EA | |
| Microsoft Surface Pro 6, Core i7, 512 GB | |
| HP Spectre x360 13-ap0312ng | |
| Dell Inspiron 15 3585 (2300U, Vega 6) | |
| Dell XPS 13 7390 2-in-1 Core i3 | |
| Acer Swift 3 SF314-55-31N8 | |
| Asus VivoBook Flip 14 TP412UA-EC969T | |
| Lenovo V330-15IKB | |
| Dell XPS 13-9365 2-in-1 | |
| Lenovo Thinkpad 13-20J1001BUS | |
| Cinebench R11.5 | |
| CPU Single 64Bit | |
| Dell XPS 13 7390 2-in-1 Core i3 | |
| Acer Swift 3 SF314-55-31N8 | |
| Dell XPS 13-9365 2-in-1 | |
| Lenovo V330-15IKB | |
| Lenovo Thinkpad 13-20J1001BUS | |
| Dell Inspiron 15 3585 (2300U, Vega 6) | |
| CPU Multi 64Bit | |
| Dell XPS 13 7390 2-in-1 Core i3 | |
| Dell Inspiron 15 3585 (2300U, Vega 6) | |
| Acer Swift 3 SF314-55-31N8 | |
| Lenovo V330-15IKB | |
| Dell XPS 13-9365 2-in-1 | |
| Lenovo Thinkpad 13-20J1001BUS | |
| Cinebench R10 | |
| Rendering Multiple CPUs 32Bit | |
| Dell XPS 13 7390 2-in-1 Core i3 | |
| Acer Swift 3 SF314-55-31N8 | |
| Asus VivoBook Flip 14 TP412UA-EC969T | |
| Lenovo V330-15IKB | |
| Dell XPS 13-9365 2-in-1 | |
| Lenovo Thinkpad 13-20J1001BUS | |
| Rendering Single 32Bit | |
| Dell XPS 13 7390 2-in-1 Core i3 | |
| Acer Swift 3 SF314-55-31N8 | |
| Dell XPS 13-9365 2-in-1 | |
| Asus VivoBook Flip 14 TP412UA-EC969T | |
| Lenovo V330-15IKB | |
| Lenovo Thinkpad 13-20J1001BUS | |
| wPrime 2.10 - 1024m | |
| Lenovo Thinkpad 13-20J1001BUS | |
| Dell XPS 13-9365 2-in-1 | |
| Lenovo V330-15IKB | |
| Acer Swift 3 SF314-55-31N8 | |
| Dell XPS 13 7390 2-in-1 Core i3 | |
* ... menor é melhor
| PCMark 8 Home Score Accelerated v2 | 3240 pontos | |
| PCMark 8 Work Score Accelerated v2 | 4519 pontos | |
| PCMark 10 Score | 3562 pontos | |
Ajuda | ||
| Dell XPS 13 7390 2-in-1 Core i3 Toshiba BG4 KBG40ZPZ256G | Dell XPS 13 9380 2019 SK hynix PC401 HFS256GD9TNG | Asus ZenBook S13 UX392FN WDC PC SN520 SDAPNUW-512G | Microsoft Surface Pro 6, Core i7, 512 GB Toshiba KBG30ZPZ512G | Dell XPS 13-9365 2-in-1 Toshiba NVMe THNSN5256GPUK | Dell Latitude 7300-P99G Samsung SSD PM981 MZVLB512HAJQ | |
|---|---|---|---|---|---|---|
| AS SSD | 11% | 86% | -25% | 5% | 144% | |
| Seq Read (MB/s) | 1558 | 2035 31% | 1224 -21% | 1154 -26% | 1283 -18% | 2749 76% |
| Seq Write (MB/s) | 1103 | 658 -40% | 907 -18% | 393.6 -64% | 735 -33% | 1367 24% |
| 4K Read (MB/s) | 37.52 | 39.74 6% | 41.46 11% | 34.42 -8% | 37.69 0% | 49.94 33% |
| 4K Write (MB/s) | 59 | 105.7 79% | 126.2 114% | 68.9 17% | 96.9 64% | 137.6 133% |
| 4K-64 Read (MB/s) | 1684 | 461 -73% | 1021 -39% | 494.1 -71% | 586 -65% | 987 -41% |
| 4K-64 Write (MB/s) | 198.9 | 300.1 51% | 1251 529% | 171.3 -14% | 204.7 3% | 1465 637% |
| Access Time Read * (ms) | 0.099 | 0.061 38% | 0.053 46% | 0.213 -115% | 0.045 55% | 0.042 58% |
| Access Time Write * (ms) | 0.722 | 0.051 93% | 0.027 96% | 0.3 58% | 0.037 95% | 0.029 96% |
| Score Read (Points) | 1877 | 704 -62% | 1185 -37% | 644 -66% | 752 -60% | 1312 -30% |
| Score Write (Points) | 368 | 471 28% | 1468 299% | 280 -24% | 375 2% | 1739 373% |
| Score Total (Points) | 3180 | 1479 -53% | 3250 2% | 1225 -61% | 1495 -53% | 3662 15% |
| Copy ISO MB/s (MB/s) | 677 | 893 32% | 1404 107% | 985 45% | 950 40% | 2761 308% |
| Copy Program MB/s (MB/s) | 298.4 | 287.9 -4% | 402.4 35% | 143.1 -52% | 263.8 -12% | 622 108% |
| Copy Game MB/s (MB/s) | 496.1 | 618 25% | 902 82% | 676 36% | 726 46% | 1584 219% |
* ... menor é melhor

| 3DMark 06 Standard Score | 11753 pontos | |
| 3DMark 11 Performance | 2374 pontos | |
| 3DMark Ice Storm Standard Score | 56698 pontos | |
| 3DMark Cloud Gate Standard Score | 8145 pontos | |
| 3DMark Fire Strike Score | 1443 pontos | |
Ajuda | ||
| Rocket League | |
| 1920x1080 High Quality AA:High FX | |
| Huawei MateBook 13 i7 | |
| Lenovo IdeaPad 320s-14IKB | |
| Acer Swift 3 SF313-51-59SZ | |
| Lenovo Flex 14IWL | |
| Dell XPS 13 7390 2-in-1 Core i3 | |
| Samsung Notebook 9 NP930QAA | |
| Acer Switch 5 SW512-52-5819 | |
| Dell Inspiron 15 3585 (2300U, Vega 6) | |
| Dell Inspiron 14 5000 5482 2-in-1 | |
| Fujitsu LifeBook U937 | |
| 1920x1080 Quality AA:Medium FX | |
| Huawei MateBook 13 i7 | |
| Lenovo IdeaPad 320s-14IKB | |
| Dell XPS 13 7390 2-in-1 Core i3 | |
| Acer Swift 3 SF313-51-59SZ | |
| Samsung Notebook 9 NP930QAA | |
| Lenovo Flex 14IWL | |
| Acer Switch 5 SW512-52-5819 | |
| Dell Inspiron 15 3585 (2300U, Vega 6) | |
| Fujitsu LifeBook U937 | |
| Dell Inspiron 14 5000 5482 2-in-1 | |
| 1920x1080 Performance | |
| Lenovo IdeaPad 320s-14IKB | |
| Acer Swift 3 SF313-51-59SZ | |
| Dell XPS 13 7390 2-in-1 Core i3 | |
| Acer Switch 5 SW512-52-5819 | |
| Dell Inspiron 15 3585 (2300U, Vega 6) | |
| Samsung Notebook 9 NP930QAA | |
| Lenovo Flex 14IWL | |
| Fujitsu LifeBook U937 | |
| baixo | média | alto | ultra | |
|---|---|---|---|---|
| StarCraft II: Heart of the Swarm (2013) | 60.5 | 40.5 | 18.9 | |
| BioShock Infinite (2013) | 82.6 | 40 | 34.8 | 11.7 |
| The Witcher 3 (2015) | 29.7 | 19.1 | 10.4 | 5.4 |
| Overwatch (2016) | 71.4 | 52.3 | 23.5 | |
| Rocket League (2017) | 69.5 | 42.2 | 22.8 |
| Dell XPS 13 7390 2-in-1 Core i3 UHD Graphics G1 (Ice Lake 32 EU), i3-1005G1, Toshiba BG4 KBG40ZPZ256G | Dell XPS 13 9380 2019 UHD Graphics 620, i5-8265U, SK hynix PC401 HFS256GD9TNG | Dell XPS 13-9365 2-in-1 HD Graphics 615, i7-7Y75, Toshiba NVMe THNSN5256GPUK | HP Spectre x360 13-ap0312ng UHD Graphics 620, i7-8565U, Toshiba XG5 KXG50ZNV512G | Lenovo Yoga C930-13IKB 81C4 UHD Graphics 620, i5-8550U, SK hynix PC401 HFS256GD9TNG | Asus ZenBook S13 UX392FN GeForce MX150, i7-8565U, WDC PC SN520 SDAPNUW-512G | |
|---|---|---|---|---|---|---|
| Noise | -4% | 1% | 1% | -5% | ||
| desligado / ambiente * (dB) | 28 | 30.4 -9% | 29.2 -4% | 27.9 -0% | 28.1 -0% | |
| Idle Minimum * (dB) | 28 | 30.4 -9% | 29.2 -4% | 27.9 -0% | 28.1 -0% | |
| Idle Average * (dB) | 28 | 30.4 -9% | 29.2 -4% | 27.9 -0% | 28.1 -0% | |
| Idle Maximum * (dB) | 28 | 30.4 -9% | 30.4 -9% | 29.3 -5% | 29 -4% | |
| Load Average * (dB) | 31.7 | 31.7 -0% | 31 2% | 32 -1% | 41.1 -30% | |
| Load Maximum * (dB) | 43.5 | 38.1 12% | 32.1 26% | 39.3 10% | 41.1 6% | |
| Witcher 3 ultra * (dB) | 41.1 |
* ... menor é melhor
Barulho
| Ocioso |
| 28 / 28 / 28 dB |
| Carga |
| 31.7 / 43.5 dB |
 | ||
30 dB silencioso 40 dB(A) audível 50 dB(A) ruidosamente alto |
||
min: | ||
(-) A temperatura máxima no lado superior é 50 °C / 122 F, em comparação com a média de 35.4 °C / 96 F , variando de 19.6 a 60 °C para a classe Convertible.
(-) A parte inferior aquece até um máximo de 47 °C / 117 F, em comparação com a média de 36.9 °C / 98 F
(+) Em uso inativo, a temperatura média para o lado superior é 28.8 °C / 84 F, em comparação com a média do dispositivo de 30.3 °C / ### class_avg_f### F.
(+) Os apoios para as mãos e o touchpad são mais frios que a temperatura da pele, com um máximo de 31 °C / 87.8 F e, portanto, são frios ao toque.
(-) A temperatura média da área do apoio para as mãos de dispositivos semelhantes foi 28 °C / 82.4 F (-3 °C / -5.4 F).
| desligado | |
| Ocioso | |
| Carga |
|
Key:
min: | |
| Dell XPS 13 7390 2-in-1 Core i3 i3-1005G1, UHD Graphics G1 (Ice Lake 32 EU), Toshiba BG4 KBG40ZPZ256G, IPS, 1920x1200, 13.4" | Dell XPS 13 9380 2019 i5-8265U, UHD Graphics 620, SK hynix PC401 HFS256GD9TNG, IPS, 3840x2160, 13.3" | Dell XPS 13-9365 2-in-1 i7-7Y75, HD Graphics 615, Toshiba NVMe THNSN5256GPUK, IPS, 1920x1080, 13.3" | HP Spectre x360 13-ap0312ng i7-8565U, UHD Graphics 620, Toshiba XG5 KXG50ZNV512G, IPS, 1920x1080, 13.3" | Lenovo Yoga C930-13IKB 81C4 i5-8550U, UHD Graphics 620, SK hynix PC401 HFS256GD9TNG, IPS, 1920x1080, 13.9" | Asus ZenBook S13 UX392FN i7-8565U, GeForce MX150, WDC PC SN520 SDAPNUW-512G, IPS, 1920x1080, 13.9" | |
|---|---|---|---|---|---|---|
| Power Consumption | -35% | 26% | -19% | -38% | -31% | |
| Idle Minimum * (Watt) | 3 | 4.8 -60% | 3.1 -3% | 4.32 -44% | 3.4 -13% | 3.4 -13% |
| Idle Average * (Watt) | 5.4 | 8.6 -59% | 4.3 20% | 6.84 -27% | 7.5 -39% | 6.3 -17% |
| Idle Maximum * (Watt) | 7.3 | 10.4 -42% | 4.9 33% | 8.64 -18% | 11.8 -62% | 10.4 -42% |
| Load Average * (Watt) | 33.4 | 37.9 -13% | 24.3 27% | 31.8 5% | 47.7 -43% | 51 -53% |
| Load Maximum * (Watt) | 48.3 | 48.5 -0% | 22.8 53% | 53 -10% | 63.2 -31% | 62.7 -30% |
| Witcher 3 ultra * (Watt) | 39 |
* ... menor é melhor
| Dell XPS 13 7390 2-in-1 Core i3 i3-1005G1, UHD Graphics G1 (Ice Lake 32 EU), 51 Wh | Dell XPS 13 9380 2019 i5-8265U, UHD Graphics 620, 52 Wh | Dell XPS 13-9365 2-in-1 i7-7Y75, HD Graphics 615, 46 Wh | HP Spectre x360 13-ap0312ng i7-8565U, UHD Graphics 620, 61 Wh | Lenovo Yoga C930-13IKB 81C4 i5-8550U, UHD Graphics 620, 60 Wh | Asus ZenBook S13 UX392FN i7-8565U, GeForce MX150, 50 Wh | |
|---|---|---|---|---|---|---|
| Duração da bateria | -17% | 2% | 3% | 25% | -16% | |
| Reader / Idle (h) | 35.7 | 17.2 -52% | 16.2 -55% | 28.5 -20% | ||
| WiFi v1.3 (h) | 8.9 | 8.3 -7% | 11.4 28% | 8.9 0% | 11.1 25% | 8.4 -6% |
| Load (h) | 2.2 | 2.4 9% | 2.9 32% | 2.3 5% | 1.7 -23% |
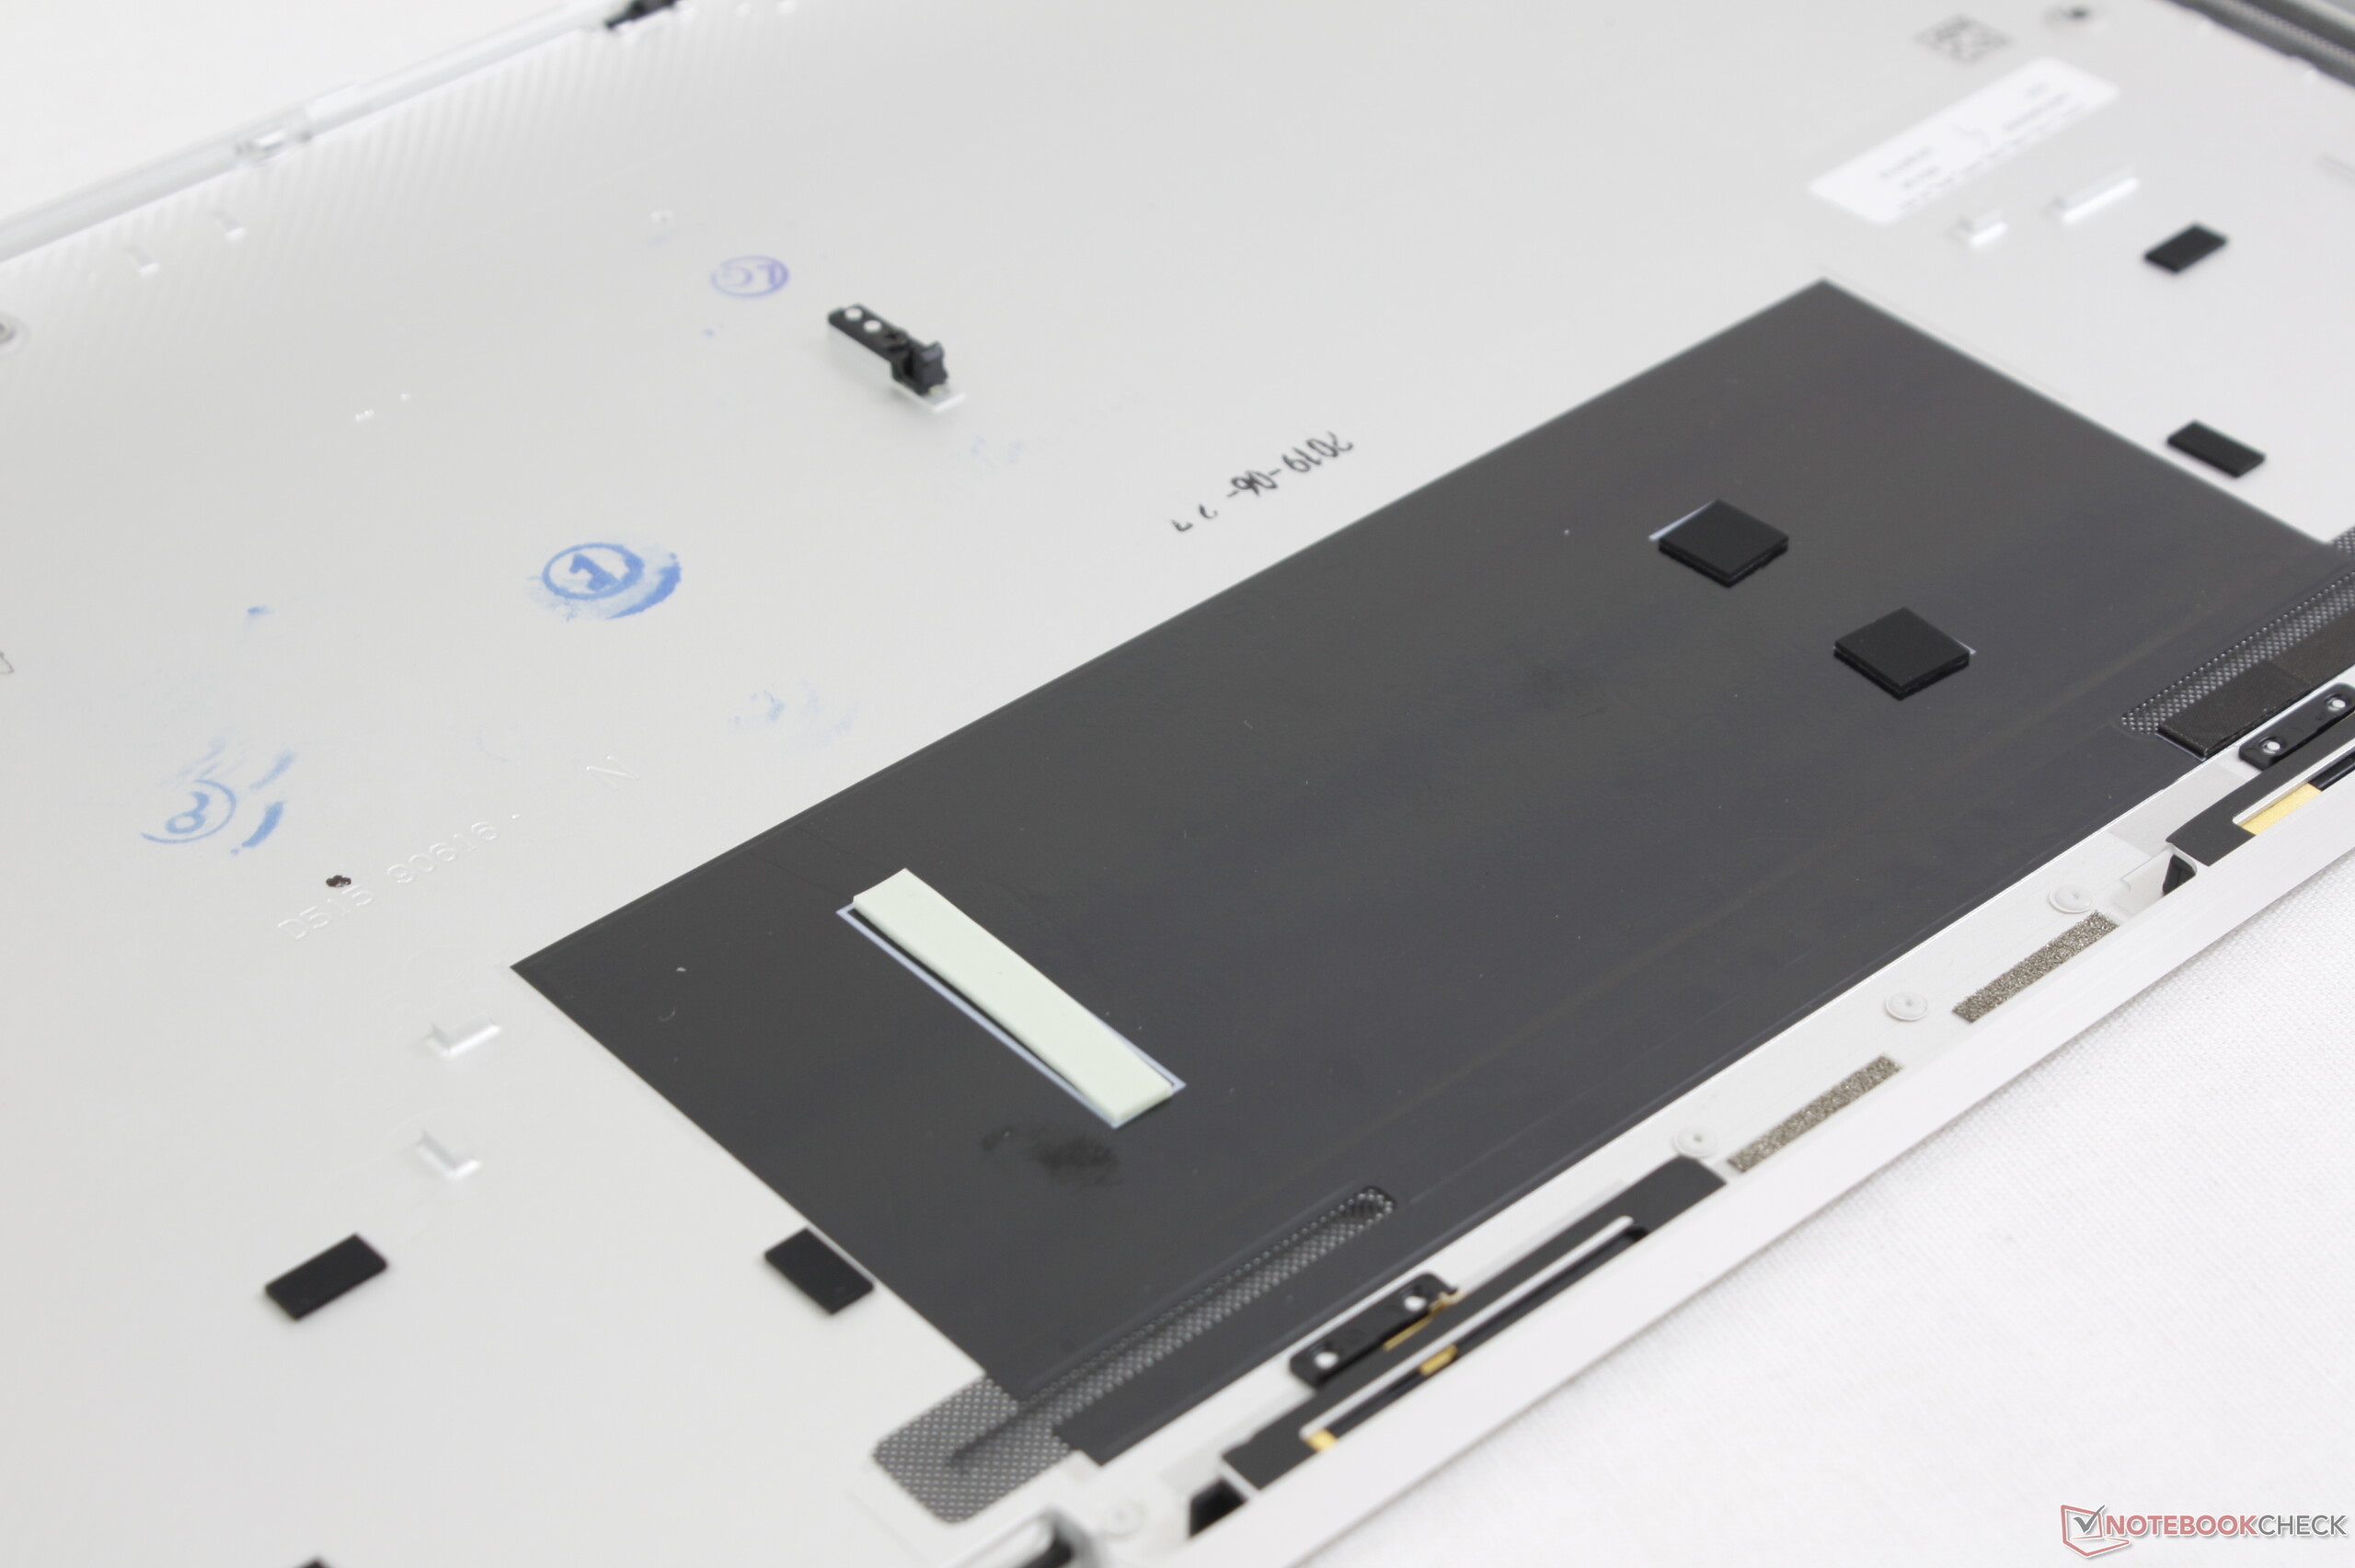
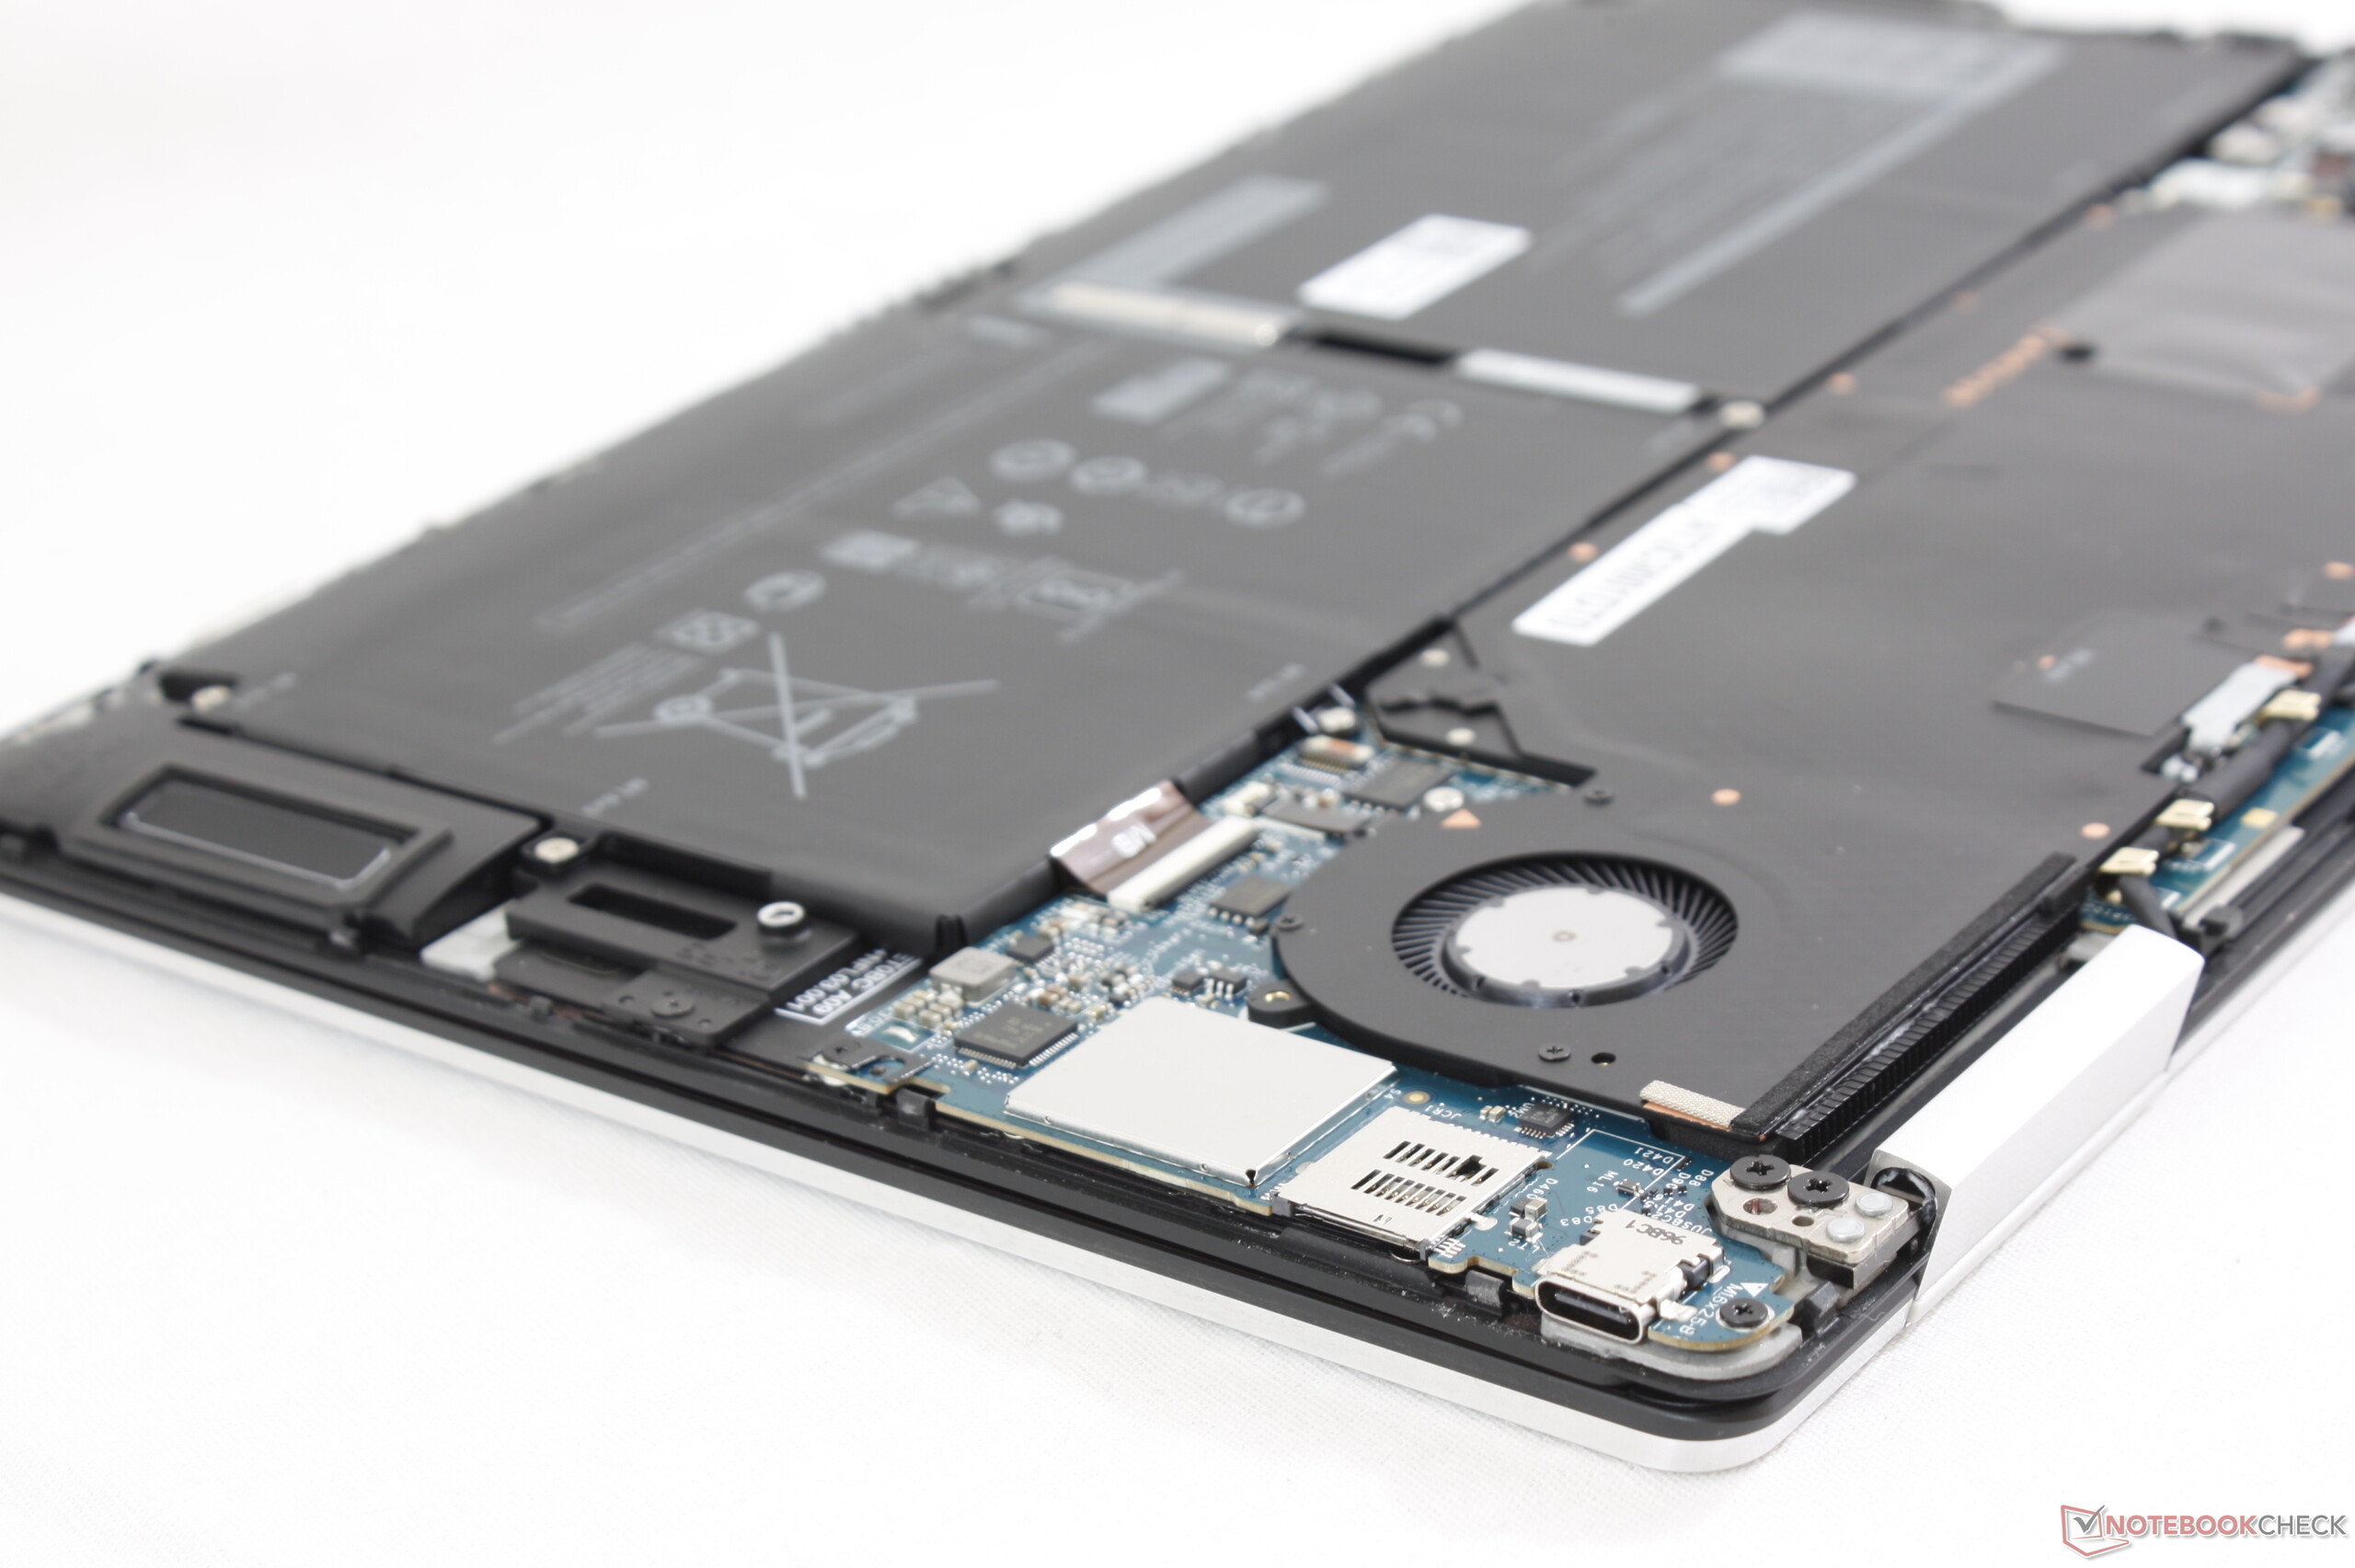
Pro
Contra
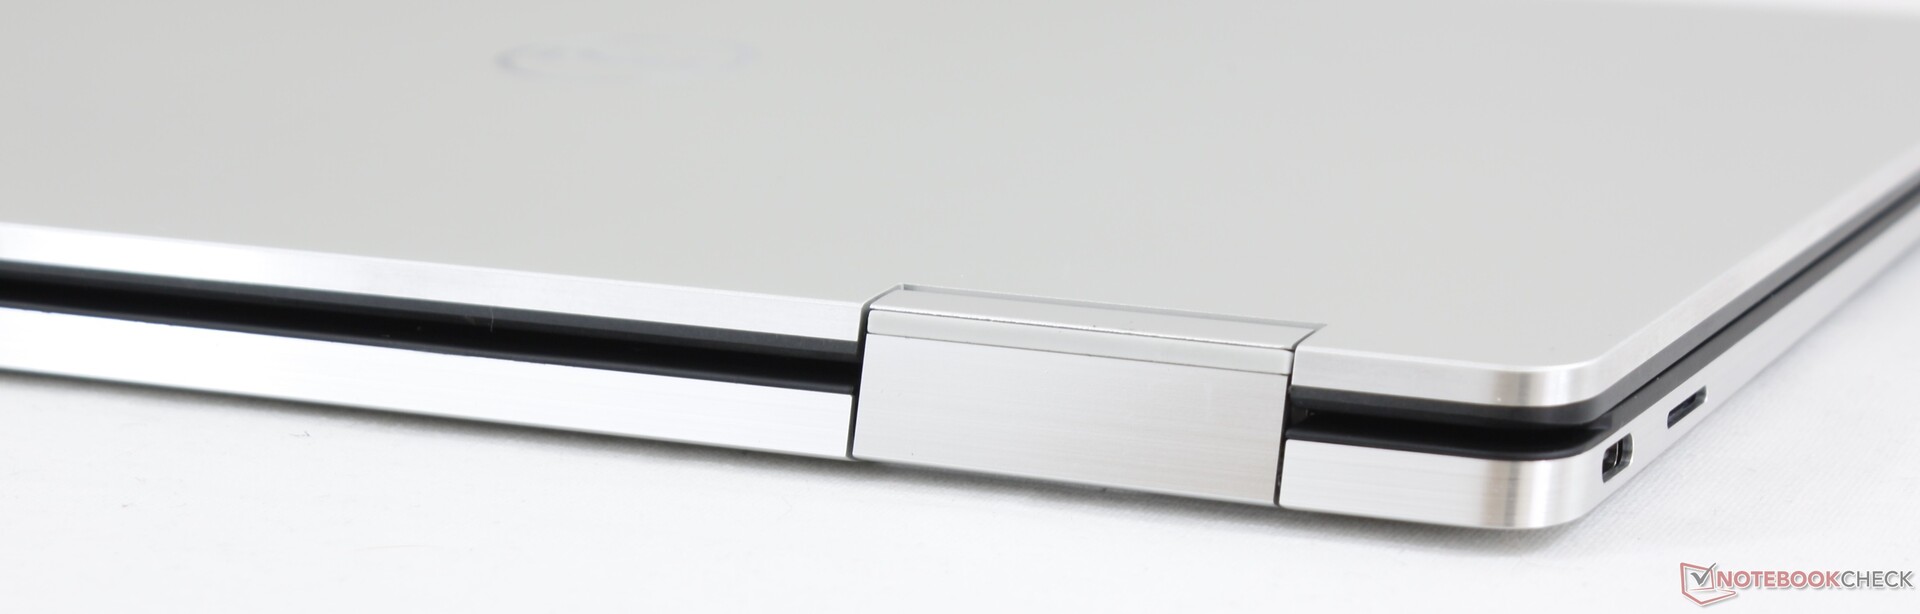
Os entusiastas inevitavelmente vão lamentar os componentes soldados do 2-em-1 XPS 13 7390. Embora seja definitivamente uma chatice que especificações importantes como RAM, WLAN ou mesmo armazenamento não possam ser reparadas ou atualizadas pelo usuário, a Dell está tem como alvo um público onde esses recursos não são potenciais obstáculos. O XPS 13 conversível tem como objetivo devorar o mercado de 2-em-1, onde desmontáveis como o Surface Pro já são muito limitados em termos de capacidade de atualização.
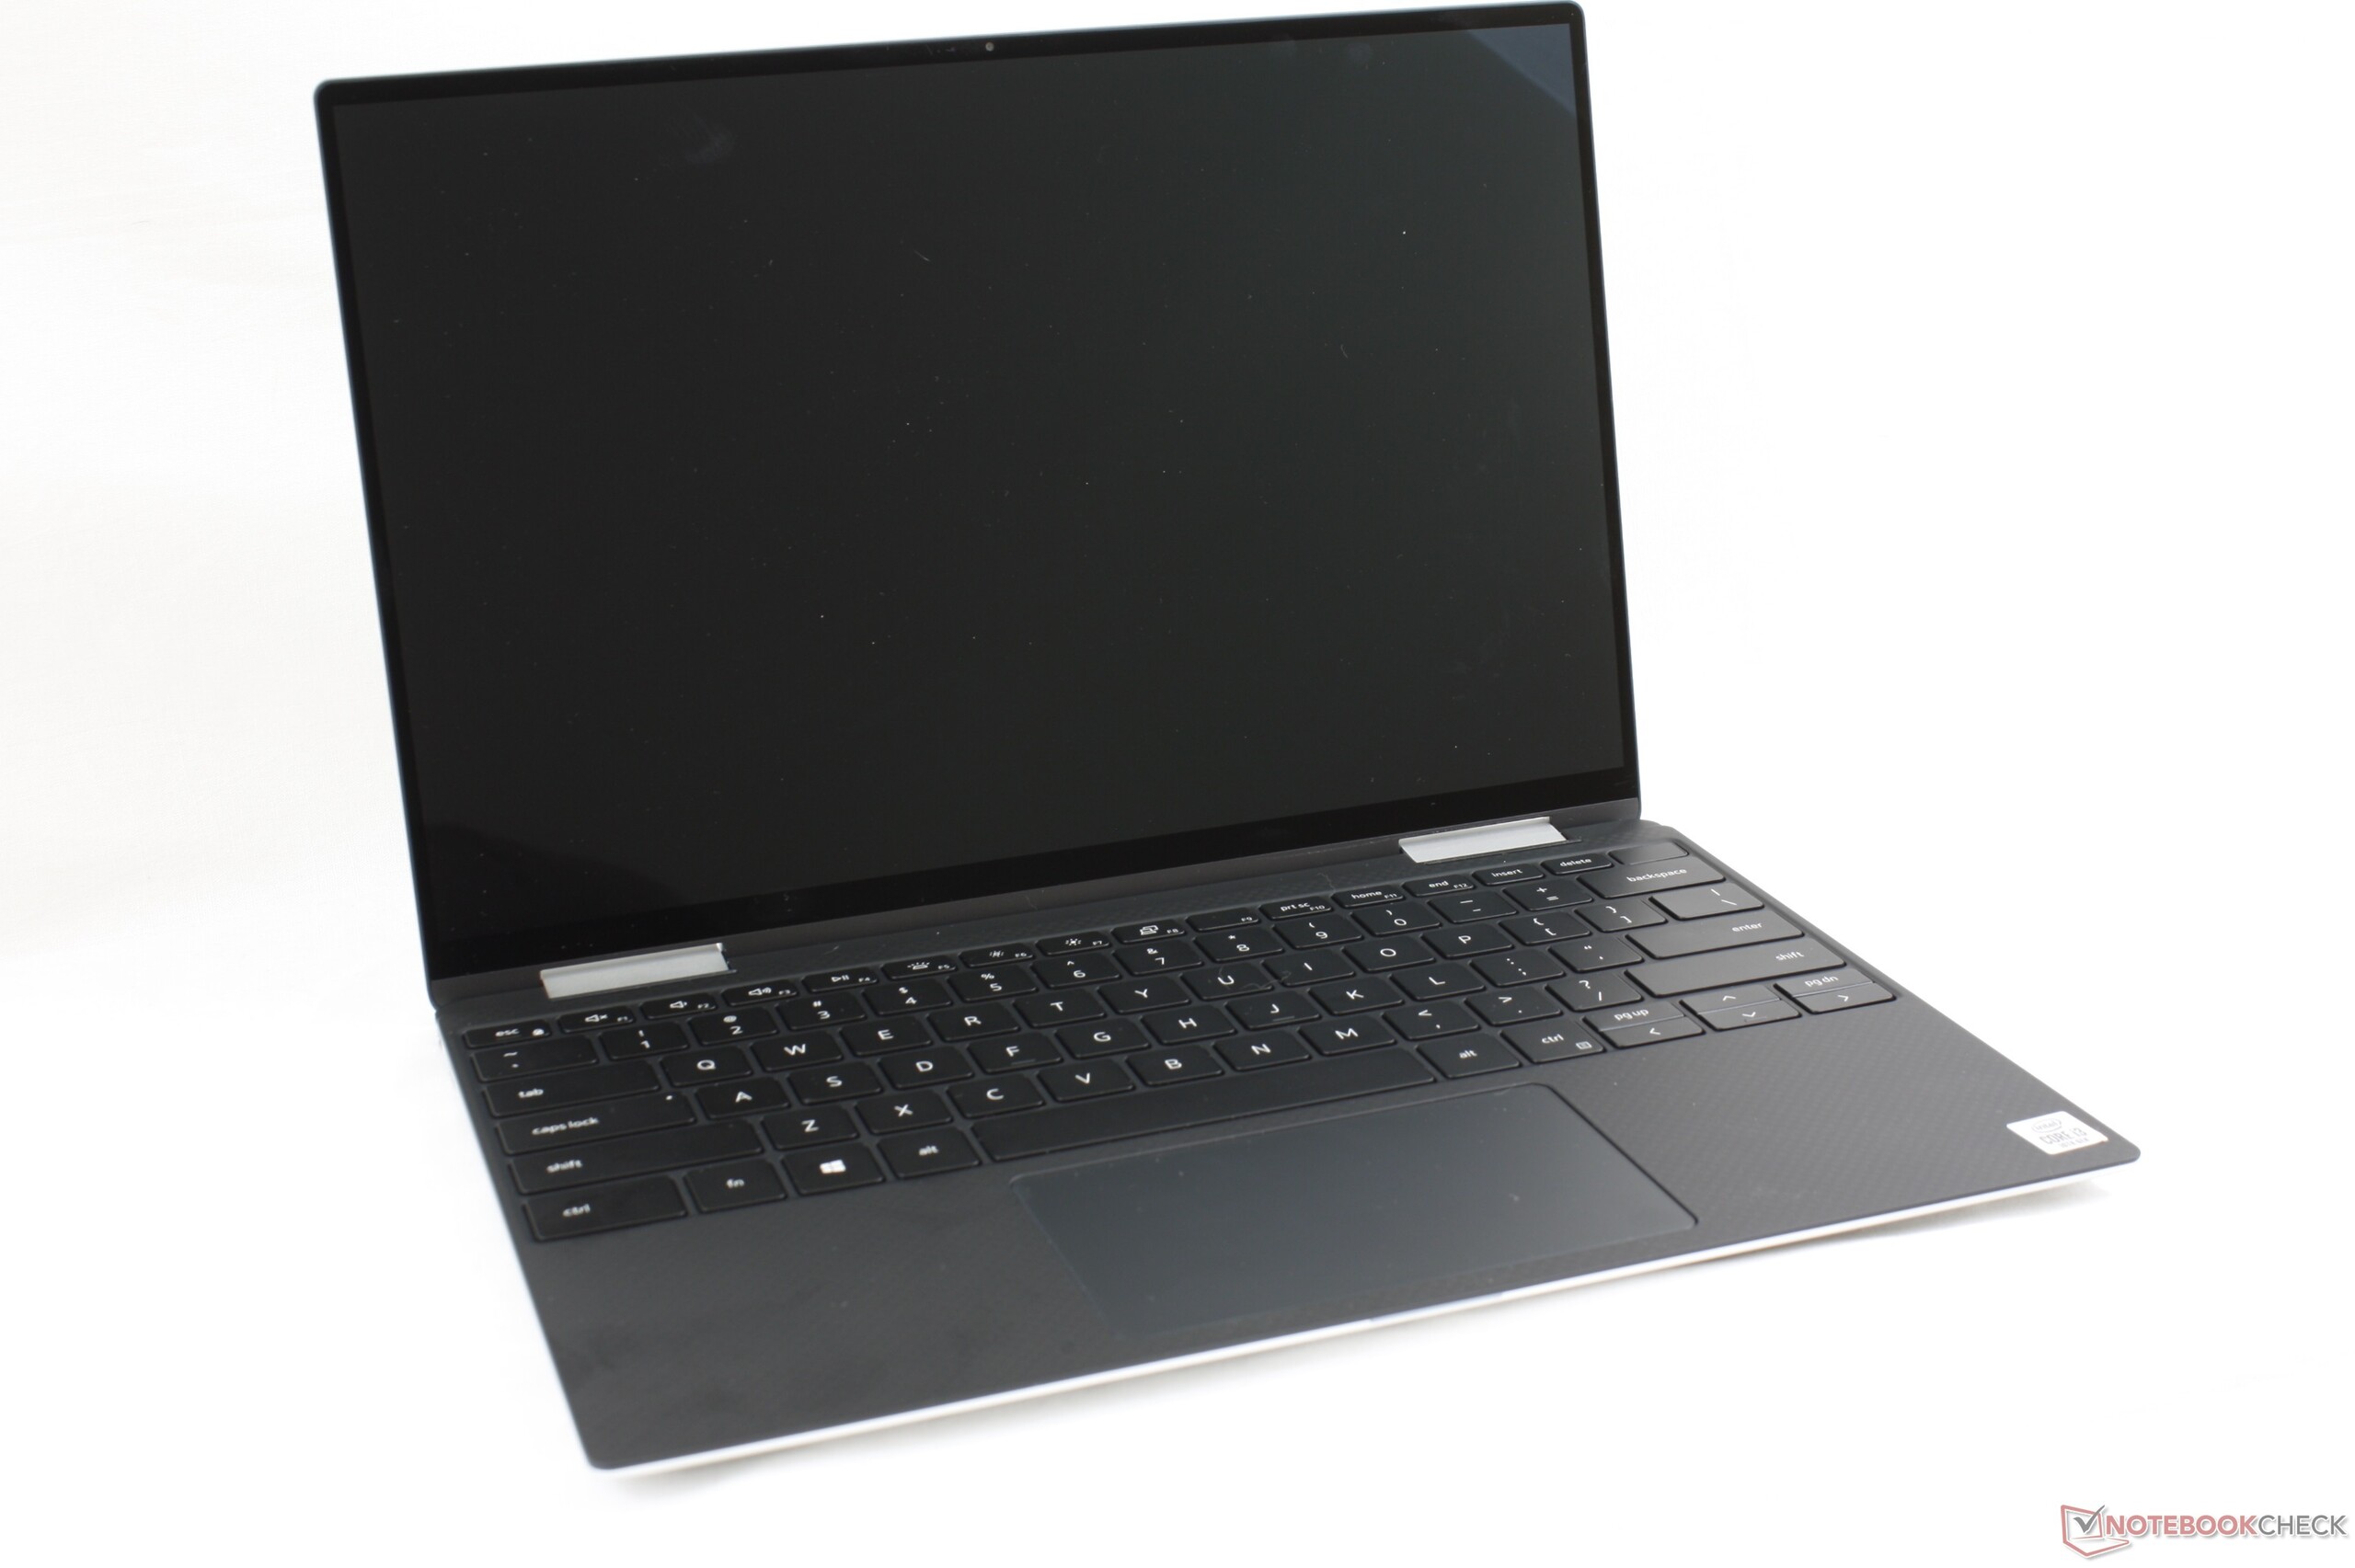
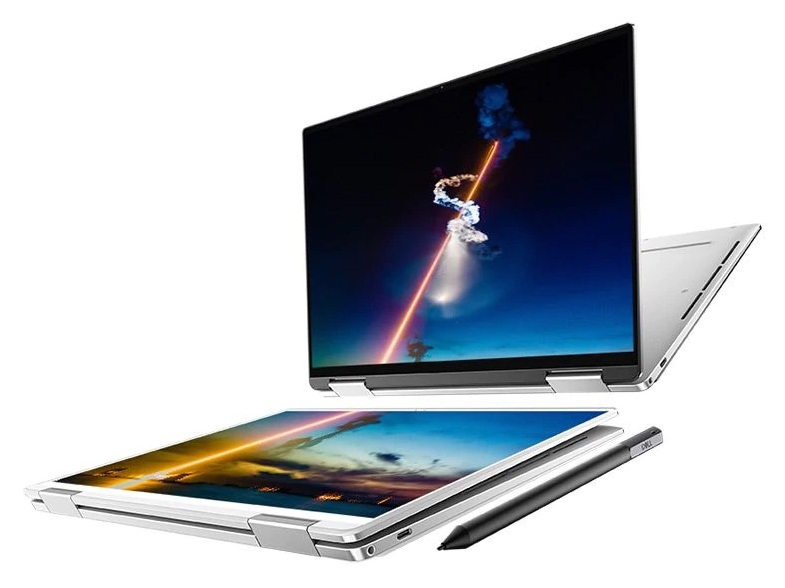
O melhor aspecto do conversível da Dell é sua tela, e não a nova e sofisticada CPU Intel Ice Lake-U. A tela no SKU Core i3 mais barato, é objetivamente melhor do que telas de muitos outros Ultrabooks carros-chefes, que custam centenas a mais. É notavelmente mais brilhante, melhor calibrado de fábrica e ainda mais amplo do que o que a maioria dos usuários está acostumada devido à maior altura do formato 16:10. Se você já quis um portátil conversível de 13 polegadas para viagens e uso em exteriores, esse sistema seria sua melhor aposta simplesmente por causa do brilho da tela quando comparada à concorrência.
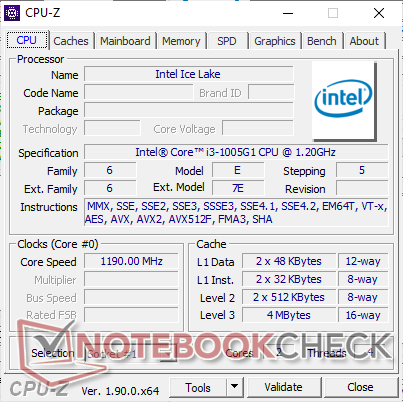
Quanto ao Core i3-1005G1, sua potência bruta de CPU é apenas um pouco melhor que a do Core i3-8145U, oferecendo o desempenho gráfico integrado do Core i7-8565U tudo em um design de 10 nm mais eficiente. A atualização de geração a geração é marginal nesse aspecto, mas ainda é melhor do que o que a antiga série XPS 13 9365 já foi capaz de oferecer com o Core 7Y54 ou Core 7Y75.
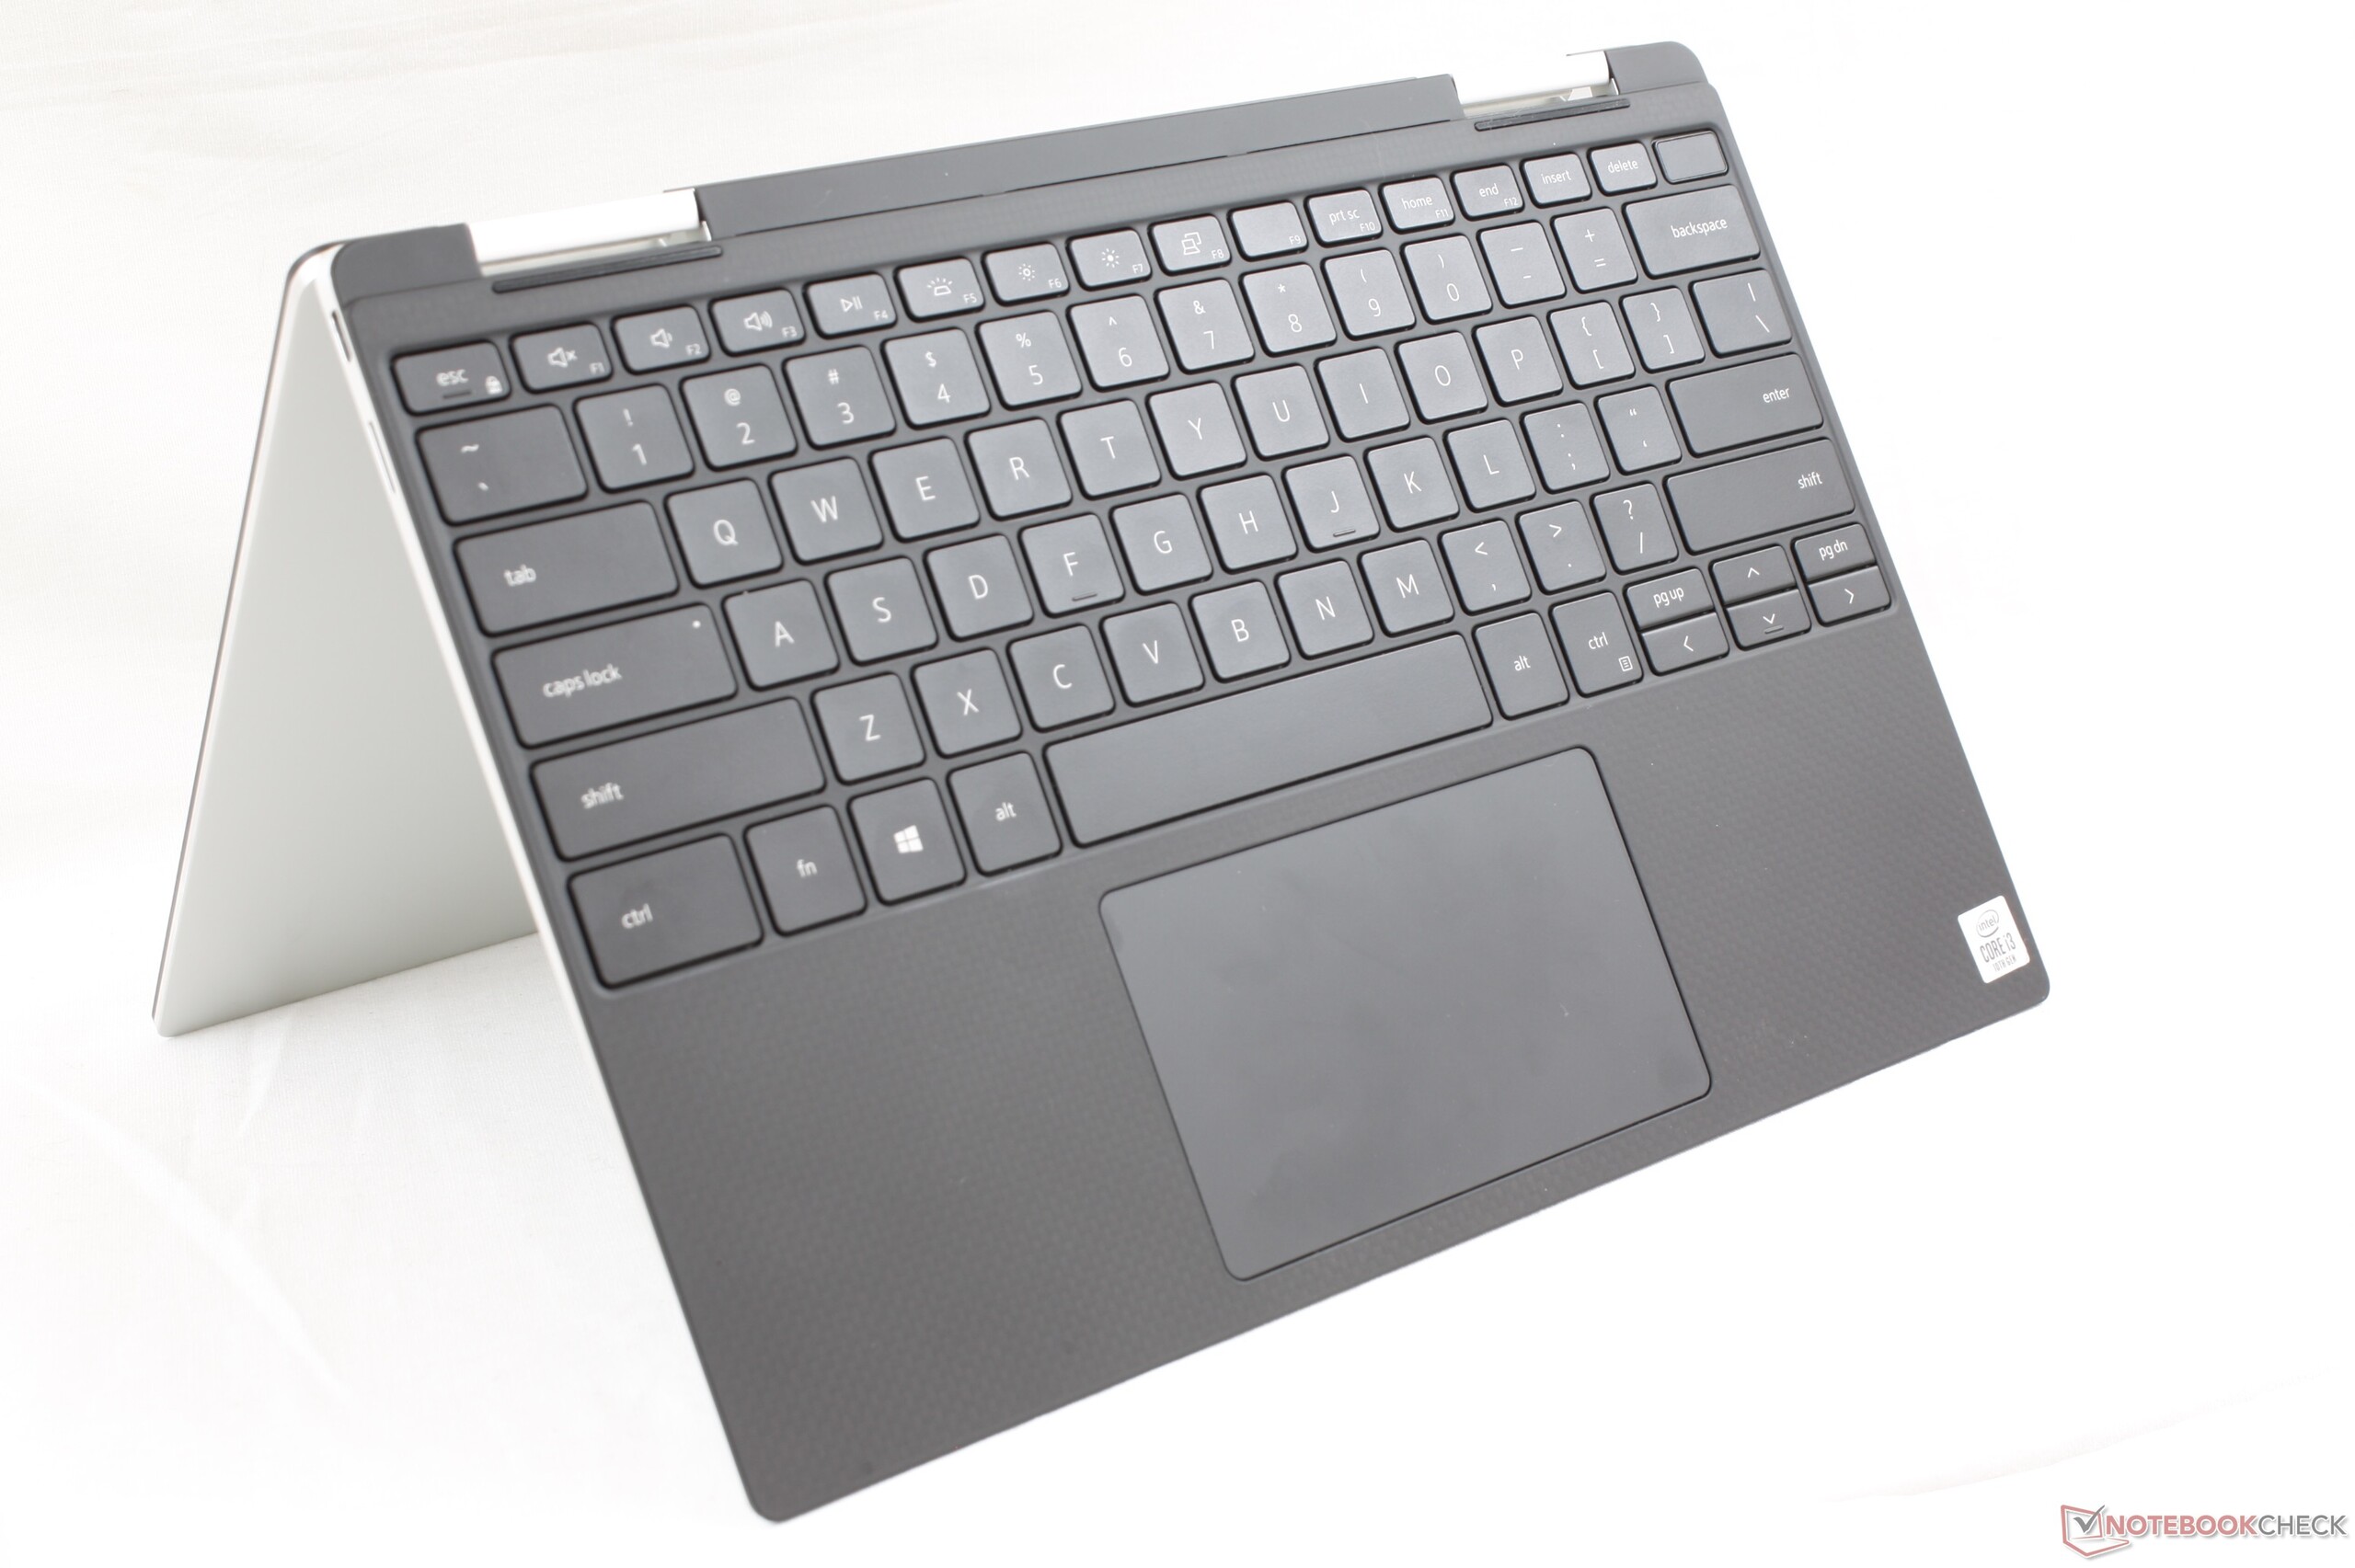
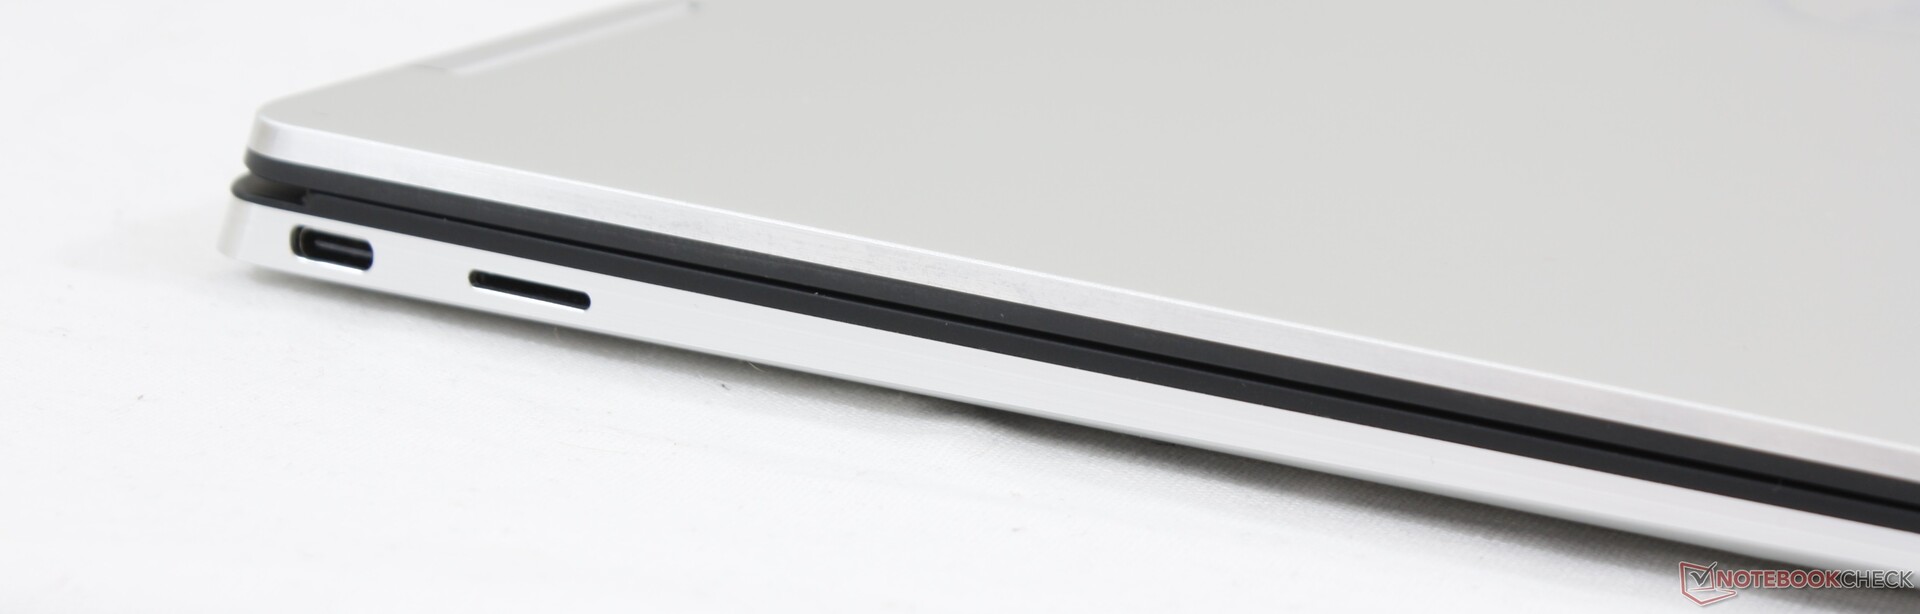
A maioria de nossas reclamações é relativamente pequena, o que resulta em aborrecimentos notórios. As teclas de seta apertadas, superfícies que adoram as digitais, tempos de resposta branco-preto lentos, problemas de latência do DPC e falta de taxa de atualização mais alta e opções de WWAN impedem que o Dell seja o "melhor" subportátil conversível. Alguns recursos do modelo de 2017, como o Noble Lock, a câmera IR e o armazenamento removível, foram todos descartados. Além disso, o uso intenso da CPU implicará uma temperatura de 99 °C, o que já nos preocupa com o desempenho das configurações do Core i7. A alternativa mais próxima da Dell que os usuários podem querer considerar seria o HP EliteBook x360 1040 G5 com tela de 14 polegadas que é o único subportátil que conhecemos a oferecer WWAN, uma tela super brilhante de 120 Hz, armazenamento atualizável pelo usuário e várias outras opções de portas que o Dell, tudo em um pacote quase tão pequeno.
Como tivemos alguns problemas relacionados com o hardware nesta unidade, é altamente recomendável que os compradores verifiquem quaisquer anormalidades imediatamente após a compra. Os alto-falantes distorcidos e os problemas de energia do USB tipo C são problemas sérios que só podemos esperar que sejam causados por nossa má sorte e não por algo mais profuso.
O XPS 13 7390 2-em-1 de 13,4 polegadas é uma atualização significativa do XPS 13 9365 2017 em quase todos os sentidos da palavra. Sua maior surpresa não é o novo processador, mas a tela bem calibrada que é visivelmente mais brilhante do que o que a maioria dos outros Ultrabooks tem a oferecer. Se você deseja um pouco mais, no entanto, o HP EliteBook x360 1040 G5 de 14 polegadas pode fazer quase tudo o que o XPS 2-em-1 pode, mas com melhor capacidade de atualização e mais conectividade.
Dell XPS 13 7390 2-in-1 Core i3
- 09/10/2019 v7 (old)
Allen Ngo
Price comparison
