Breve Análise do Portátil ASUS ROG Strix SCAR III G531GW (Core i9-9880H, RTX 2070)
| Networking | |
| iperf3 transmit AX12 | |
| MSI GE75 8SF | |
| Gigabyte Aero 15-X9 | |
| Asus Strix Scar III G531GW | |
| Schenker XMG Neo 17 | |
| Aorus 15 X9 | |
| iperf3 receive AX12 | |
| Asus Strix Scar III G531GW | |
| Gigabyte Aero 15-X9 | |
| Schenker XMG Neo 17 | |
| MSI GE75 8SF | |
| Aorus 15 X9 | |
| |||||||||||||||||||||||||
iluminação: 88 %
Contraste: 985:1 (Preto: 0.27 cd/m²)
ΔE ColorChecker Calman: 1.81 | ∀{0.5-29.43 Ø4.73}
calibrated: 1.03
ΔE Greyscale Calman: 2.44 | ∀{0.09-98 Ø4.97}
97% sRGB (Argyll 1.6.3 3D)
62% AdobeRGB 1998 (Argyll 1.6.3 3D)
67.5% AdobeRGB 1998 (Argyll 3D)
96.5% sRGB (Argyll 3D)
66.2% Display P3 (Argyll 3D)
Gamma: 2.42
CCT: 7005 K
| Asus Strix Scar III G531GW Sharp LQ156M1JW09 (SHP14D3), IPS, 1920x1080, 15.6" | Aorus 15 X9 LG Philips LP156WFG-SPB2, IPS, 1920x1080, 15.6" | Gigabyte Aero 15-X9 LGD05C0, IPS, 1920x1080, 15.6" | Schenker XMG Neo 17 BOEhydis NV173FHM-N44 (BOE07B6), IPS, 1920x1080, 17.3" | MSI GE75 8SF Chi Mei N173HCE-G33, IPS, 1920x1080, 17.3" | |
|---|---|---|---|---|---|
| Display | -2% | -4% | -2% | -3% | |
| Display P3 Coverage (%) | 66.2 | 64.9 -2% | 63.5 -4% | 65.2 -2% | 63.1 -5% |
| sRGB Coverage (%) | 96.5 | 95.6 -1% | 93.1 -4% | 92.2 -4% | 94.4 -2% |
| AdobeRGB 1998 Coverage (%) | 67.5 | 66.3 -2% | 64.5 -4% | 66.5 -1% | 65.2 -3% |
| Response Times | 1% | -8% | -8% | 26% | |
| Response Time Grey 50% / Grey 80% * (ms) | 17.2 ? | 15.2 ? 12% | 16.4 ? 5% | 18.8 ? -9% | 9.6 ? 44% |
| Response Time Black / White * (ms) | 11.2 ? | 12.4 ? -11% | 13.6 ? -21% | 12 ? -7% | 10.4 ? 7% |
| PWM Frequency (Hz) | 24040 ? | 971 ? | 25770 ? | ||
| Screen | -14% | 5% | -13% | 14% | |
| Brightness middle (cd/m²) | 266 | 305.1 15% | 250 -6% | 304 14% | 370.4 39% |
| Brightness (cd/m²) | 252 | 295 17% | 235 -7% | 289 15% | 348 38% |
| Brightness Distribution (%) | 88 | 78 -11% | 85 -3% | 90 2% | 89 1% |
| Black Level * (cd/m²) | 0.27 | 0.33 -22% | 0.29 -7% | 0.26 4% | 0.29 -7% |
| Contrast (:1) | 985 | 925 -6% | 862 -12% | 1169 19% | 1277 30% |
| Colorchecker dE 2000 * | 1.81 | 2.58 -43% | 1.46 19% | 2.65 -46% | 1.26 30% |
| Colorchecker dE 2000 max. * | 3.23 | 4.32 -34% | 2.47 24% | 6.11 -89% | 3.02 7% |
| Colorchecker dE 2000 calibrated * | 1.03 | 1.33 -29% | 1.5 -46% | 1.21 -17% | |
| Greyscale dE 2000 * | 2.44 | 3.4 -39% | 1.27 48% | 2.75 -13% | 1.4 43% |
| Gamma | 2.42 91% | 2.28 96% | 2.4 92% | 2.46 89% | 2.2 100% |
| CCT | 7005 93% | 6374 102% | 6749 96% | 6763 96% | 6747 96% |
| Color Space (Percent of AdobeRGB 1998) (%) | 62 | 60.7 -2% | 60 -3% | 60 -3% | 59.7 -4% |
| Color Space (Percent of sRGB) (%) | 97 | 95.2 -2% | 93 -4% | 92 -5% | 94.4 -3% |
| Média Total (Programa/Configurações) | -5% /
-10% | -2% /
1% | -8% /
-11% | 12% /
12% |
* ... menor é melhor
Exibir tempos de resposta
| ↔ Tempo de resposta preto para branco | ||
|---|---|---|
| 11.2 ms ... ascensão ↗ e queda ↘ combinadas | ↗ 6.8 ms ascensão | 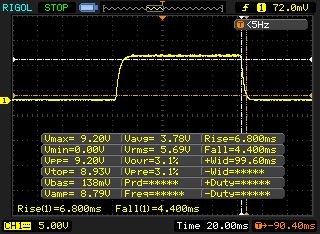 |
| ↘ 4.4 ms queda | ||
| A tela mostra boas taxas de resposta em nossos testes, mas pode ser muito lenta para jogadores competitivos. Em comparação, todos os dispositivos testados variam de 0.1 (mínimo) a 240 (máximo) ms. » 30 % de todos os dispositivos são melhores. Isso significa que o tempo de resposta medido é melhor que a média de todos os dispositivos testados (19.9 ms). | ||
| ↔ Tempo de resposta 50% cinza a 80% cinza | ||
| 17.2 ms ... ascensão ↗ e queda ↘ combinadas | ↗ 9.2 ms ascensão | 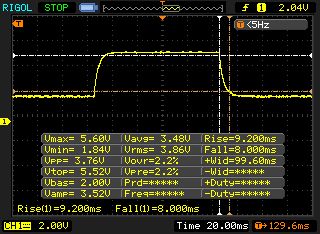 |
| ↘ 8 ms queda | ||
| A tela mostra boas taxas de resposta em nossos testes, mas pode ser muito lenta para jogadores competitivos. Em comparação, todos os dispositivos testados variam de 0.165 (mínimo) a 636 (máximo) ms. » 31 % de todos os dispositivos são melhores. Isso significa que o tempo de resposta medido é melhor que a média de todos os dispositivos testados (31.1 ms). | ||
Cintilação da tela / PWM (modulação por largura de pulso)
| Tela tremeluzindo/PWM detectado | 24040 Hz | ≤ 29 % configuração de brilho | 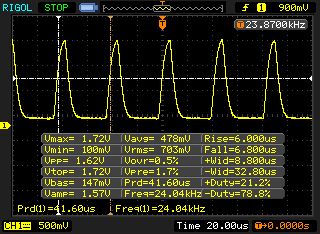 |
A luz de fundo da tela pisca em 24040 Hz (pior caso, por exemplo, utilizando PWM) Cintilação detectada em uma configuração de brilho de 29 % e abaixo. Não deve haver cintilação ou PWM acima desta configuração de brilho. A frequência de 24040 Hz é bastante alta, então a maioria dos usuários sensíveis ao PWM não deve notar nenhuma oscilação. [pwm_comparison] Em comparação: 52 % de todos os dispositivos testados não usam PWM para escurecer a tela. Se PWM foi detectado, uma média de 7801 (mínimo: 5 - máximo: 343500) Hz foi medida. | |||
| PCMark 8 | |
| Home Score Accelerated v2 | |
| Média da turma Gaming (n=1últimos 2 anos) | |
| Aorus 15 X9 | |
| Asus Strix Scar III G531GW | |
| Gigabyte Aero 15-X9 | |
| MSI GE75 8SF | |
| MSI P65 Creator 9SF-657 | |
| Work Score Accelerated v2 | |
| Asus Strix Scar III G531GW | |
| Aorus 15 X9 | |
| Gigabyte Aero 15-X9 | |
| MSI GE75 8SF | |
| MSI P65 Creator 9SF-657 | |
| Média da turma Gaming (n=1últimos 2 anos) | |
| PCMark 8 Home Score Accelerated v2 | 4578 pontos | |
| PCMark 8 Work Score Accelerated v2 | 5919 pontos | |
| PCMark 10 Score | 5826 pontos | |
Ajuda | ||
| Asus Strix Scar III G531GW Intel SSD 660p 1TB SSDPEKNW010T8 | Schenker XMG Neo 17 Samsung SSD 970 EVO Plus 1TB | MSI GE75 8SF Kingston RBUSNS8154P3256GJ1 | Aorus 15 X9 Intel SSD 760p SSDPEKKW512G8 | Gigabyte Aero 15-X9 Intel SSD 760p SSDPEKKW010T8 | |
|---|---|---|---|---|---|
| CrystalDiskMark 5.2 / 6 | 1% | -40% | 21% | -9% | |
| Write 4K (MB/s) | 135 | 92.7 -31% | 73.3 -46% | 147.2 9% | 97.1 -28% |
| Read 4K (MB/s) | 54.9 | 41.4 -25% | 33.35 -39% | 63.7 16% | 53.7 -2% |
| Write Seq (MB/s) | 1649 | 1363 -17% | 849 -49% | 1573 -5% | 1526 -7% |
| Read Seq (MB/s) | 1449 | 1259 -13% | 964 -33% | 2602 80% | 2020 39% |
| Write 4K Q32T1 (MB/s) | 508 | 289.7 -43% | 236.2 -54% | 531 5% | 285.6 -44% |
| Read 4K Q32T1 (MB/s) | 559 | 337.5 -40% | 384.7 -31% | 598 7% | 321.8 -42% |
| Write Seq Q32T1 (MB/s) | 1759 | 3332 89% | 867 -51% | 1592 -9% | 1533 -13% |
| Read Seq Q32T1 (MB/s) | 1826 | 3477 90% | 1586 -13% | 2981 63% | 2351 29% |
| AS SSD | 109% | -14% | 32% | 31% | |
| Seq Read (MB/s) | 1574 | 2359 50% | 949 -40% | 1912 21% | 2113 34% |
| Seq Write (MB/s) | 1591 | 2469 55% | 823 -48% | 1553 -2% | 1471 -8% |
| 4K Read (MB/s) | 26.79 | 53.5 100% | 25.36 -5% | 56.5 111% | 55 105% |
| 4K Write (MB/s) | 105.1 | 117.6 12% | 67.1 -36% | 119.6 14% | 107.1 2% |
| 4K-64 Read (MB/s) | 583 | 1579 171% | 748 28% | 869 49% | 914 57% |
| 4K-64 Write (MB/s) | 603 | 2048 240% | 650 8% | 584 -3% | 703 17% |
| Access Time Read * (ms) | 0.128 | 0.048 62% | 0.173 -35% | 0.049 62% | 0.114 11% |
| Access Time Write * (ms) | 0.043 | 0.03 30% | 0.059 -37% | 0.031 28% | 0.034 21% |
| Score Read (Points) | 768 | 1869 143% | 869 13% | 1116 45% | 1180 54% |
| Score Write (Points) | 867 | 2413 178% | 799 -8% | 859 -1% | 957 10% |
| Score Total (Points) | 2033 | 5248 158% | 2109 4% | 2544 25% | 2722 34% |
| Copy ISO MB/s (MB/s) | 1121 | 1329 | 1864 | ||
| Copy Program MB/s (MB/s) | 532 | 404.3 | 362.6 | ||
| Copy Game MB/s (MB/s) | 380.5 | 1071 | 936 | ||
| Média Total (Programa/Configurações) | 55% /
64% | -27% /
-25% | 27% /
27% | 11% /
14% |
* ... menor é melhor

| 3DMark 11 Performance | 19674 pontos | |
| 3DMark Cloud Gate Standard Score | 37721 pontos | |
| 3DMark Fire Strike Score | 16068 pontos | |
| 3DMark Time Spy Score | 6909 pontos | |
Ajuda | ||
| The Witcher 3 - 1920x1080 Ultra Graphics & Postprocessing (HBAO+) | |
| Média da turma Gaming (95 - 240, n=8, últimos 2 anos) | |
| Média NVIDIA GeForce RTX 2070 Mobile (64 - 82.1, n=21) | |
| Schenker XMG Neo 17 | |
| Aorus 15 X9 | |
| MSI GE75 8SF | |
| Asus Strix Scar III G531GW | |
| Gigabyte Aero 15-X9 | |
| BioShock Infinite - 1920x1080 Ultra Preset, DX11 (DDOF) | |
| Asus Strix Scar III G531GW | |
| Média NVIDIA GeForce RTX 2070 Mobile (136.9 - 187.8, n=9) | |
| Aorus 15 X9 | |
| MSI GE75 8SF | |
| Gigabyte Aero 15-X9 | |
| Dota 2 Reborn - 1920x1080 ultra (3/3) best looking | |
| Média da turma Gaming (84.8 - 248, n=113, últimos 2 anos) | |
| Asus Strix Scar III G531GW | |
| Média NVIDIA GeForce RTX 2070 Mobile (98.4 - 124, n=9) | |
| baixo | média | alto | ultra | |
|---|---|---|---|---|
| BioShock Infinite (2013) | 362.2 | 305.4 | 291.9 | 167.4 |
| The Witcher 3 (2015) | 67 | |||
| Dota 2 Reborn (2015) | 137.4 | 126.5 | 122.1 | 117.1 |
Barulho
| Ocioso |
| 30 / 37 / 39 dB |
| Carga |
| 54 / 54 dB |
 | ||
30 dB silencioso 40 dB(A) audível 50 dB(A) ruidosamente alto |
||
min: | ||
(-) A temperatura máxima no lado superior é 51 °C / 124 F, em comparação com a média de 40.4 °C / 105 F , variando de 21.2 a 68.8 °C para a classe Gaming.
(-) A parte inferior aquece até um máximo de 49 °C / 120 F, em comparação com a média de 43.2 °C / 110 F
(+) Em uso inativo, a temperatura média para o lado superior é 28.9 °C / 84 F, em comparação com a média do dispositivo de 33.9 °C / ### class_avg_f### F.
(-) Jogando The Witcher 3, a temperatura média para o lado superior é 40.4 °C / 105 F, em comparação com a média do dispositivo de 33.9 °C / ## #class_avg_f### F.
(+) Os apoios para as mãos e o touchpad estão atingindo a temperatura máxima da pele (33 °C / 91.4 F) e, portanto, não estão quentes.
(-) A temperatura média da área do apoio para as mãos de dispositivos semelhantes foi 28.8 °C / 83.8 F (-4.2 °C / -7.6 F).
Asus Strix Scar III G531GW análise de áudio
(+) | os alto-falantes podem tocar relativamente alto (###valor### dB)
Graves 100 - 315Hz
(±) | graves reduzidos - em média 5.5% menor que a mediana
(±) | a linearidade dos graves é média (11.3% delta para a frequência anterior)
Médios 400 - 2.000 Hz
(+) | médios equilibrados - apenas 4.9% longe da mediana
(+) | médios são lineares (3.7% delta para frequência anterior)
Altos 2 - 16 kHz
(+) | agudos equilibrados - apenas 2.1% longe da mediana
(+) | os máximos são lineares (6.5% delta da frequência anterior)
Geral 100 - 16.000 Hz
(+) | o som geral é linear (11% diferença em relação à mediana)
Comparado com a mesma classe
» 7% de todos os dispositivos testados nesta classe foram melhores, 3% semelhantes, 89% piores
» O melhor teve um delta de 6%, a média foi 18%, o pior foi 132%
Comparado com todos os dispositivos testados
» 6% de todos os dispositivos testados foram melhores, 2% semelhantes, 92% piores
» O melhor teve um delta de 4%, a média foi 24%, o pior foi 134%
Asus GL504GS análise de áudio
(±) | o volume do alto-falante é médio, mas bom (###valor### dB)
Graves 100 - 315Hz
(+) | bons graves - apenas 2.9% longe da mediana
(±) | a linearidade dos graves é média (7.8% delta para a frequência anterior)
Médios 400 - 2.000 Hz
(+) | médios equilibrados - apenas 3.3% longe da mediana
(+) | médios são lineares (4.5% delta para frequência anterior)
Altos 2 - 16 kHz
(+) | agudos equilibrados - apenas 4.6% longe da mediana
(+) | os máximos são lineares (4.2% delta da frequência anterior)
Geral 100 - 16.000 Hz
(+) | o som geral é linear (11.6% diferença em relação à mediana)
Comparado com a mesma classe
» 10% de todos os dispositivos testados nesta classe foram melhores, 3% semelhantes, 87% piores
» O melhor teve um delta de 6%, a média foi 18%, o pior foi 132%
Comparado com todos os dispositivos testados
» 8% de todos os dispositivos testados foram melhores, 2% semelhantes, 90% piores
» O melhor teve um delta de 4%, a média foi 24%, o pior foi 134%
| desligado | |
| Ocioso | |
| Carga |
|
Key:
min: | |
| Asus Strix Scar III G531GW i9-9880H, GeForce RTX 2070 Mobile | Schenker XMG Neo 17 i7-8750H, GeForce RTX 2070 Mobile | MSI GE75 8SF i7-8750H, GeForce RTX 2070 Mobile | Aorus 15 X9 i7-8750H, GeForce RTX 2070 Mobile | Gigabyte Aero 15-X9 i7-8750H, GeForce RTX 2070 Max-Q | Média da turma Gaming | |
|---|---|---|---|---|---|---|
| Power Consumption | 33% | 21% | 8% | 38% | 29% | |
| Idle Minimum * (Watt) | 29 | 13 55% | 16.4 43% | 26 10% | 16 45% | 13.3 ? 54% |
| Idle Average * (Watt) | 32 | 16 50% | 21.9 32% | 30.8 4% | 18 44% | 19 ? 41% |
| Idle Maximum * (Watt) | 37 | 21 43% | 25.4 31% | 34.9 6% | 23 38% | 24.5 ? 34% |
| Load Average * (Watt) | 157 | 96 39% | 90.7 42% | 90.7 42% | 88 44% | 108.1 ? 31% |
| Witcher 3 ultra * (Watt) | 173 | 172 1% | 203.3 -18% | 175 -1% | 120 31% | |
| Load Maximum * (Watt) | 217 | 191 12% | 222.9 -3% | 241.2 -11% | 167 23% | 254 ? -17% |
* ... menor é melhor
| Asus Strix Scar III G531GW i9-9880H, GeForce RTX 2070 Mobile, 66 Wh | Schenker XMG Neo 17 i7-8750H, GeForce RTX 2070 Mobile, 46.74 Wh | MSI GE75 8SF i7-8750H, GeForce RTX 2070 Mobile, 65 Wh | Aorus 15 X9 i7-8750H, GeForce RTX 2070 Mobile, 62 Wh | Gigabyte Aero 15-X9 i7-8750H, GeForce RTX 2070 Max-Q, 94.24 Wh | Média da turma Gaming | |
|---|---|---|---|---|---|---|
| Duração da bateria | -6% | 17% | -48% | 96% | 66% | |
| Reader / Idle (h) | 5.5 | 5.3 -4% | 1.8 -67% | 9.2 67% | 8.71 ? 58% | |
| WiFi v1.3 (h) | 3 | 3.7 23% | 3.5 17% | 1.6 -47% | 6.4 113% | 7.01 ? 134% |
| Load (h) | 1.4 | 0.9 -36% | 1 -29% | 2.9 107% | 1.47 ? 5% |
Pro
Contra
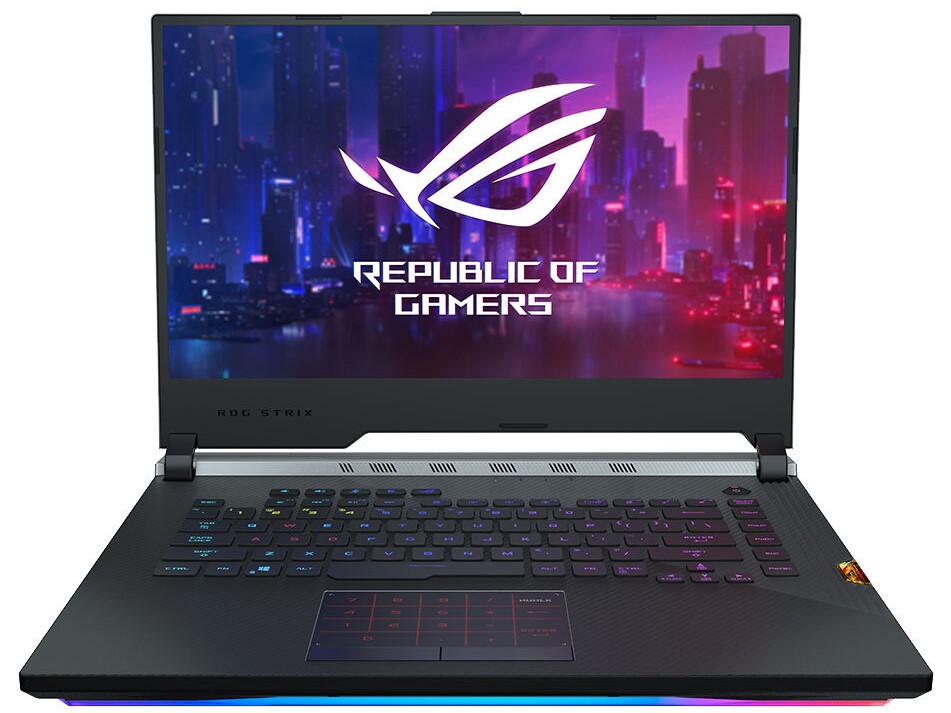
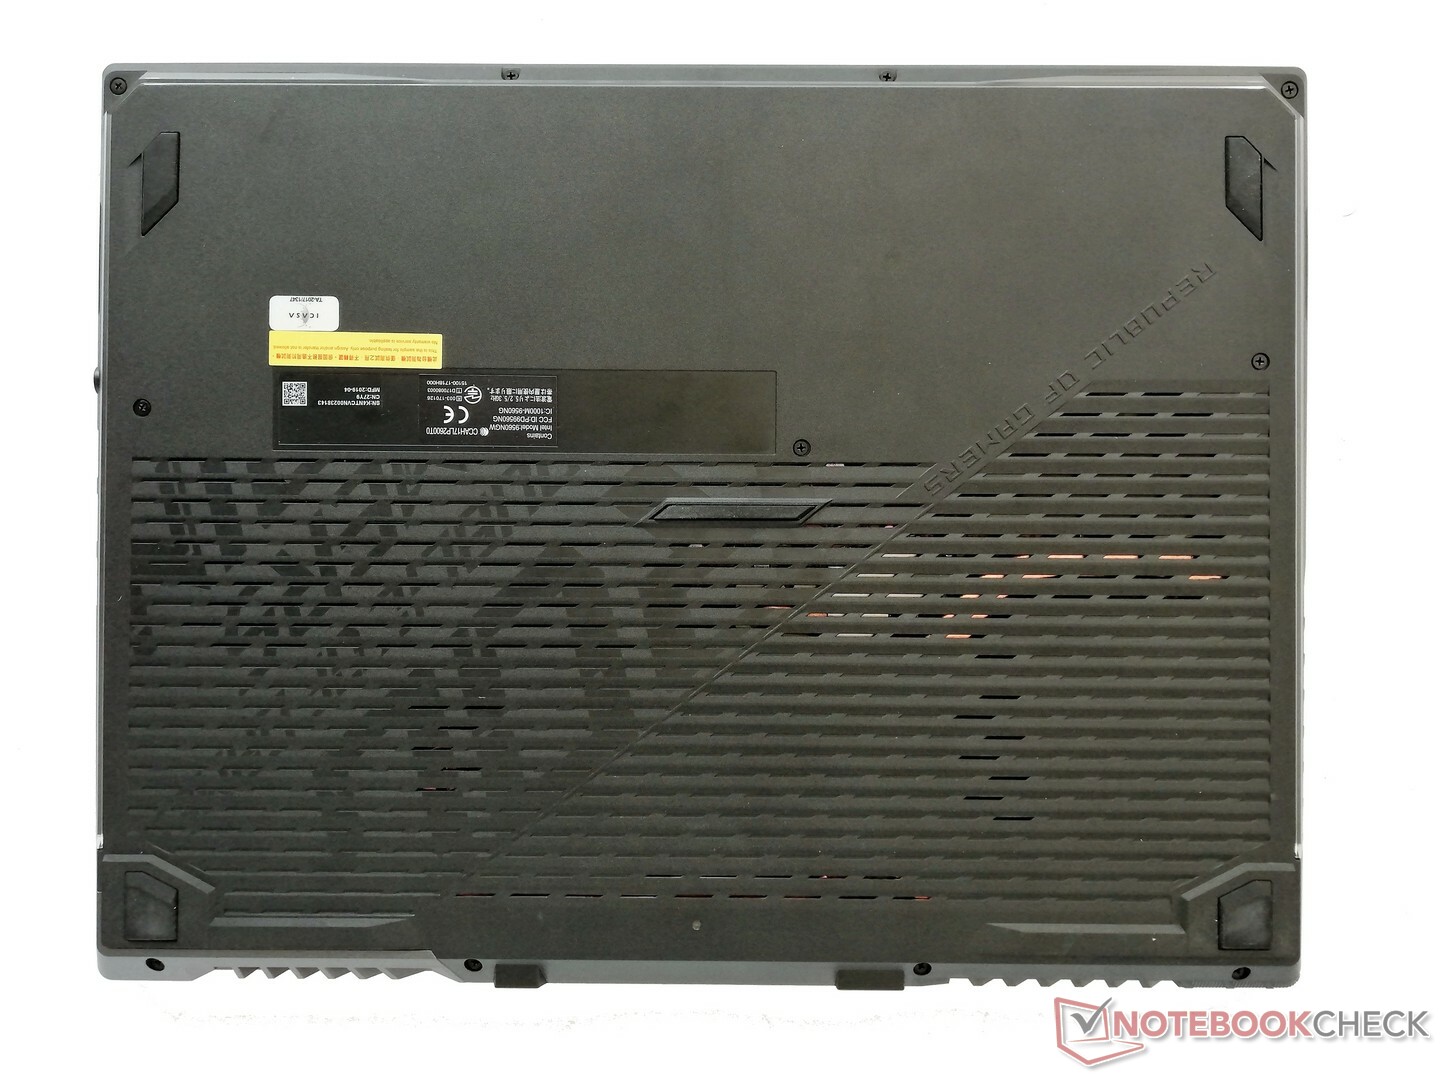
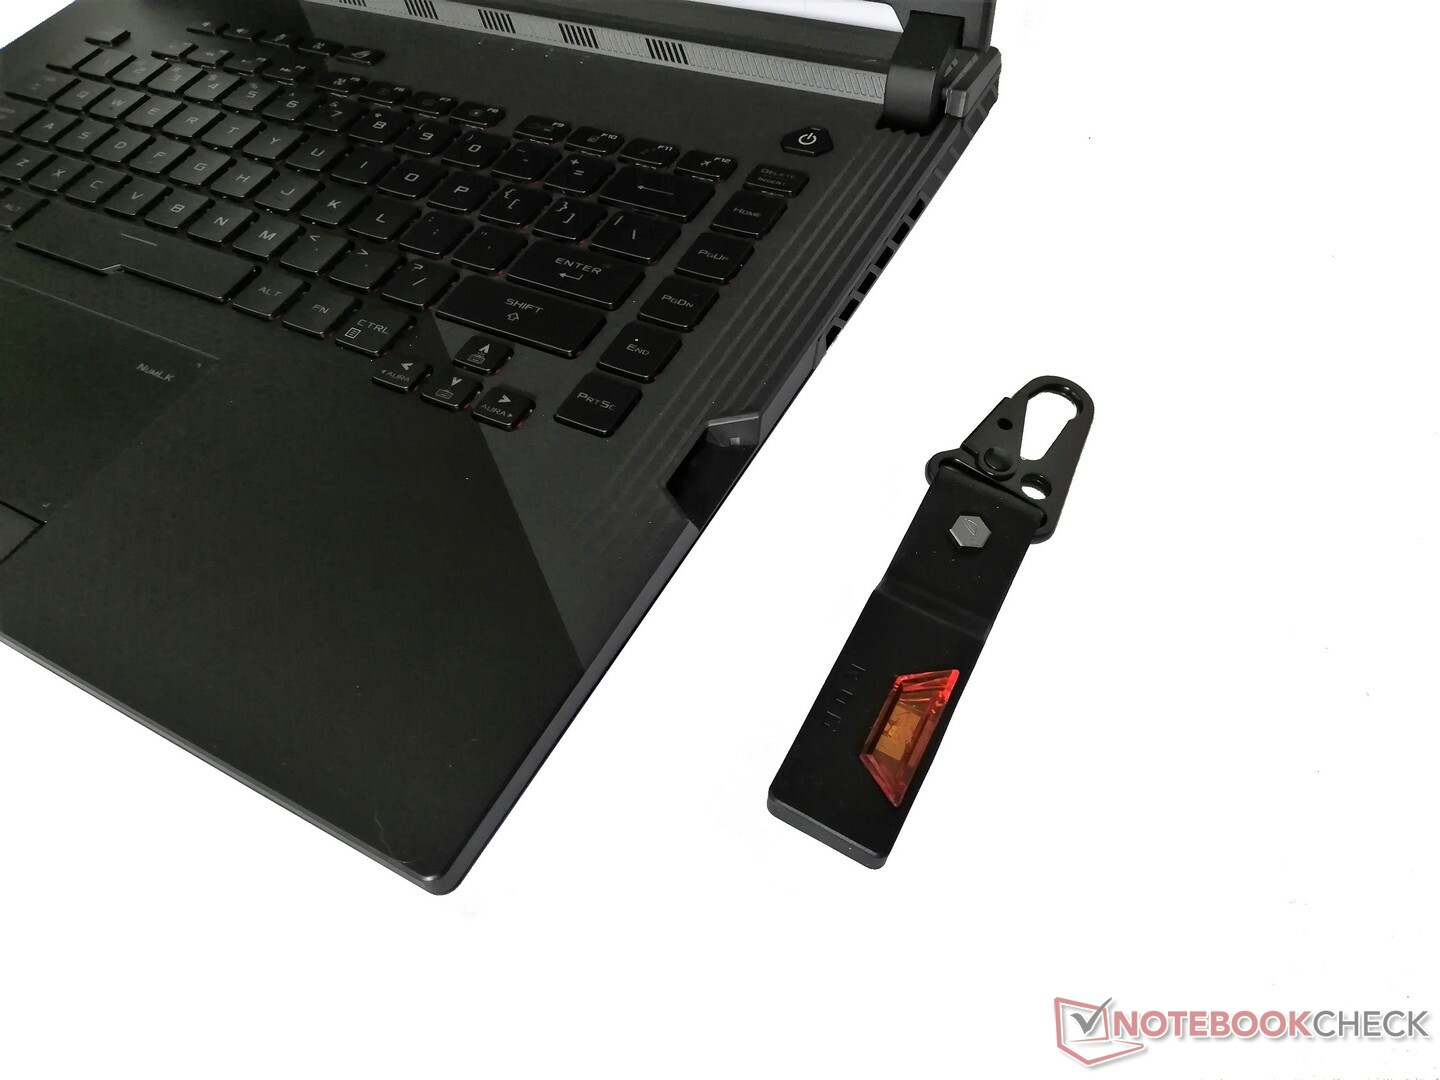
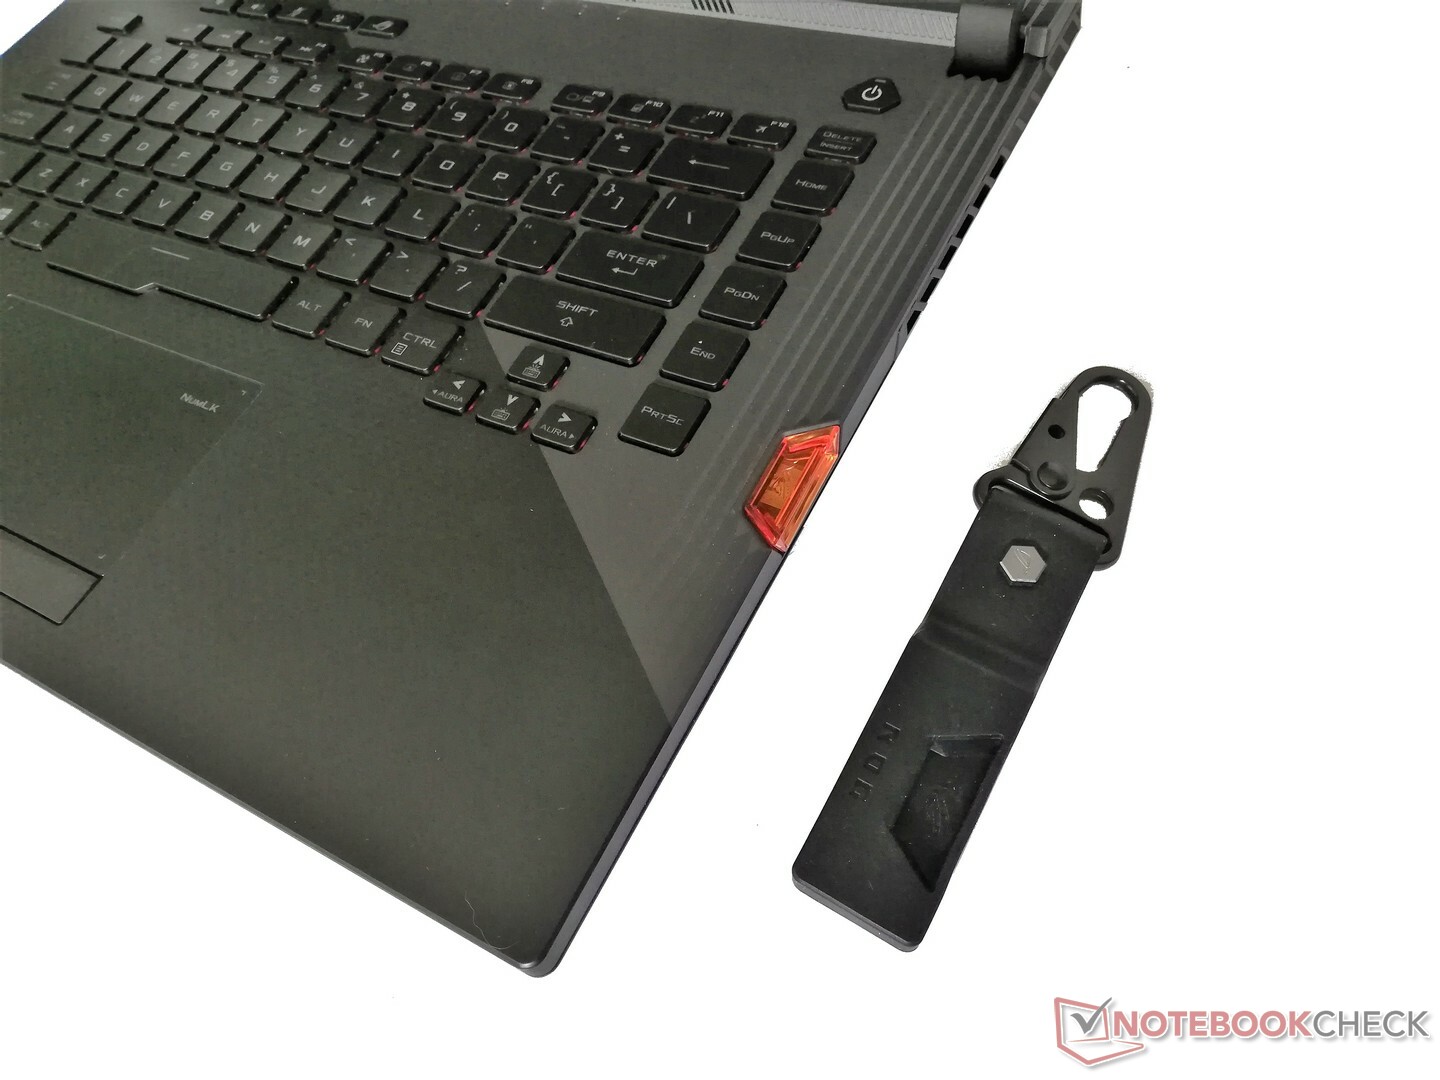
O ASUS ROG Strix SCAR III G531WG é um portátil de jogos sólido. Como era de se esperar, os modernos jogos triple-A rodam sem problemas em sua tela Full HD de 240 Hz, enquanto a GPU RTX 2070 é poderosa para lidar com jogos em 4K também em monitores externos. O laptop é fácil de reparar e manter também, e somos fãs da inclusão da segurança Keystone. O teclado numérico integrado no trackpad também é um toque agradável e distingue o ROG Strix de seus concorrentes.
O ASUS ROG Strix SCAR III G531GW é um sólido portátil para jogos de15,6 polegadas. No entanto, seus ventiladores barulhentos e o baixo desempenho da RTX 2070 impedem que ele alcance as melhores avaliações.
Lamentavelmente, o ROG Strix não teve o desempenho esperado nos benchmarks e nos nossos testes de jogos. Outros portáteis simplesmente têm mais desempenho com um hardware semelhante ao da nossa unidade de análise. Além disso, a ASUS equipou o dispositivo com ventiladores barulhentos, que abafam seus impressionantes alto-falantes. Infelizmente, você só poderá apreciar os alto-falantes quando não estiver jogando. É uma pena que a ASUS também não ofereça uma opção de tela 4K, já que o ROG Strix é poderoso o suficiente para reproduzir títulos triplo A modernos nessa resolução. No geral, o ROG Strix SCAR III G531GW tem muito a seu favor, mas é prejudicado por algumas deficiências significativas.
Asus Strix Scar III G531GW
- 06/03/2019 v6 (old)
Mike Wobker
Price comparison
