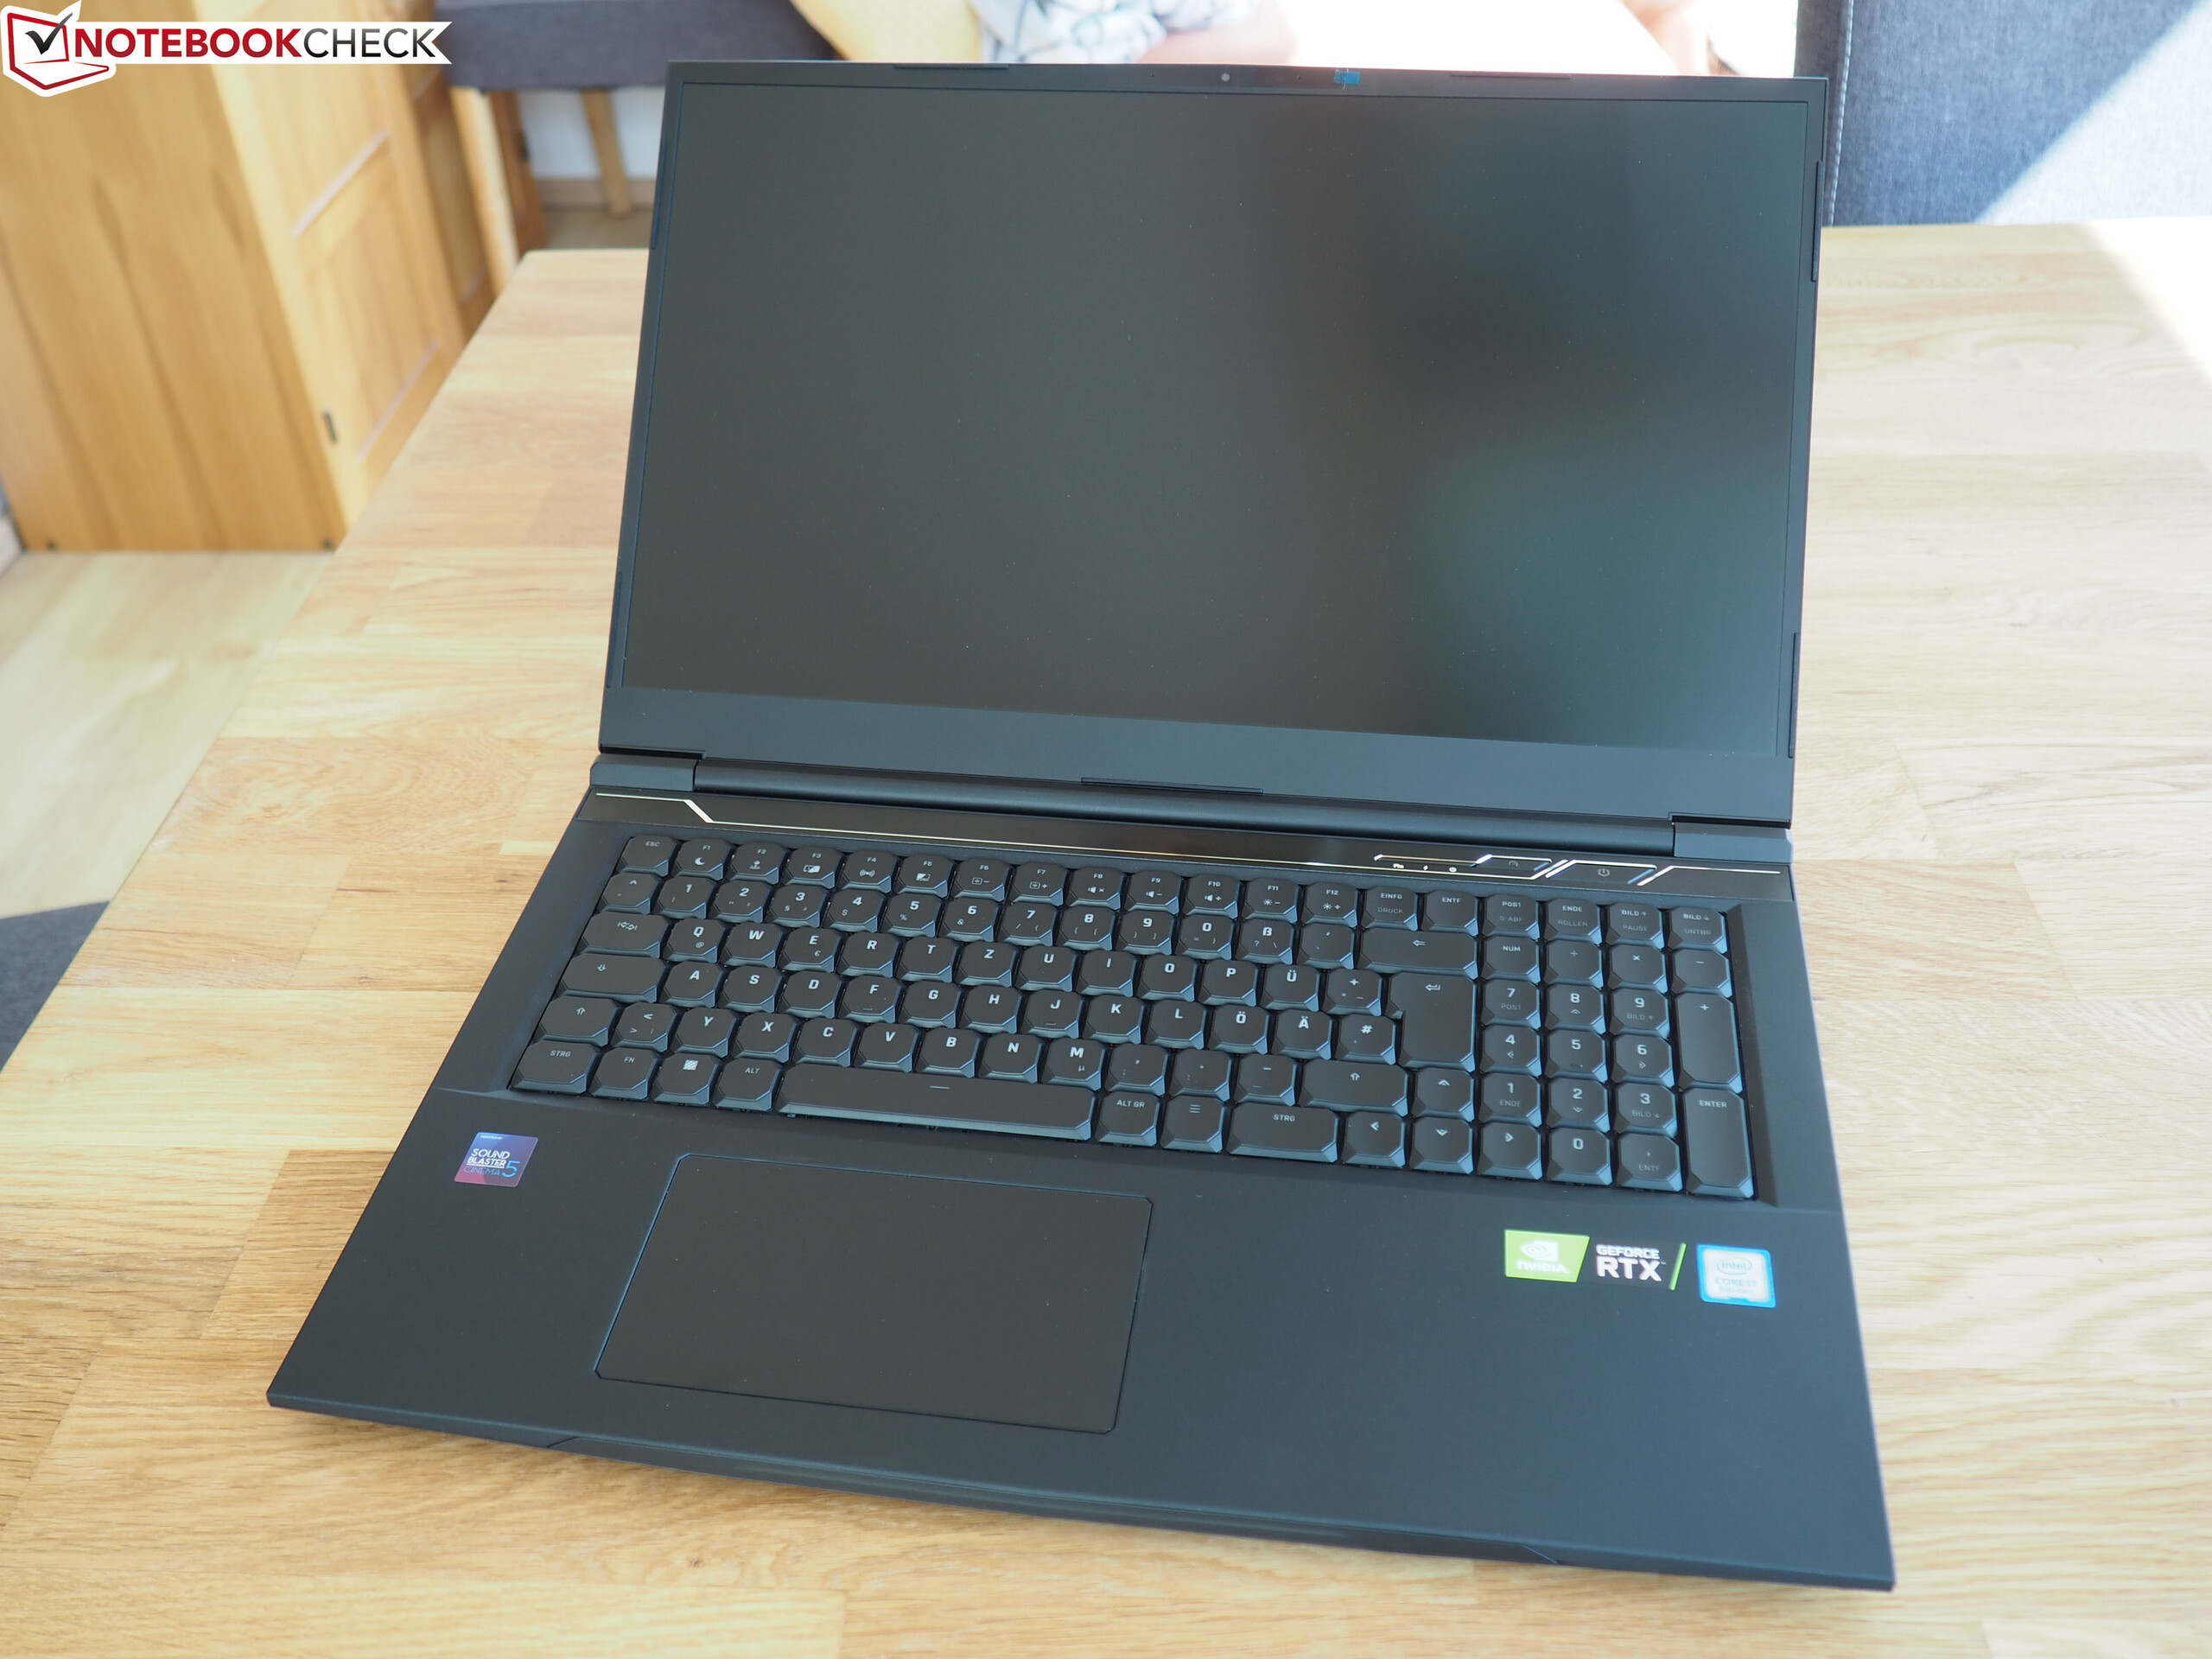
Breve Análise do Portátil Schenker XMG Neo 17 (Core i7-8750H, GeForce RTX 2070) Tongfang GK7CP7S
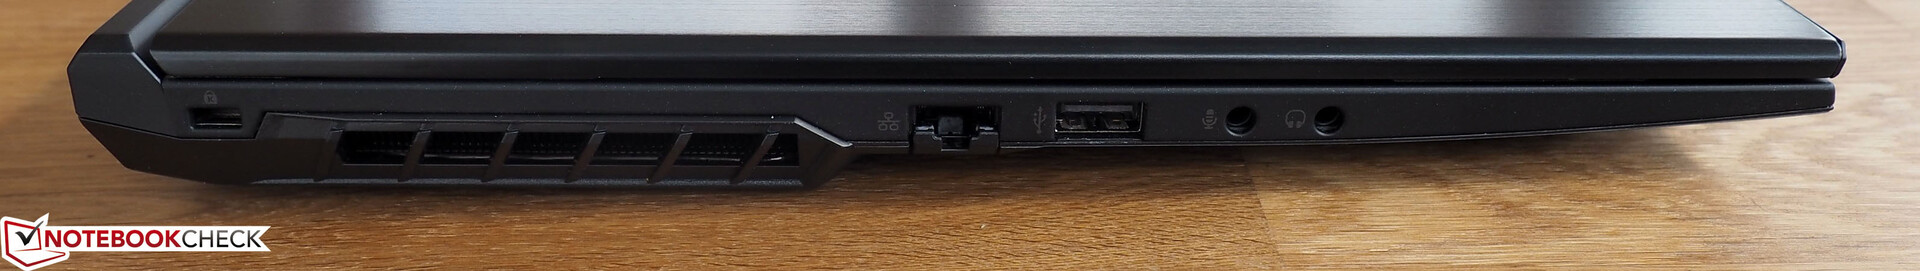
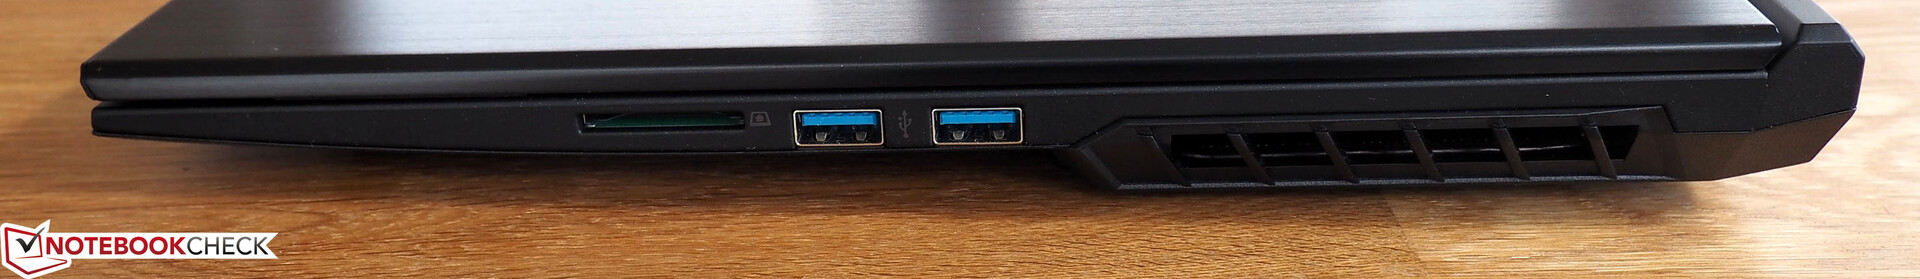
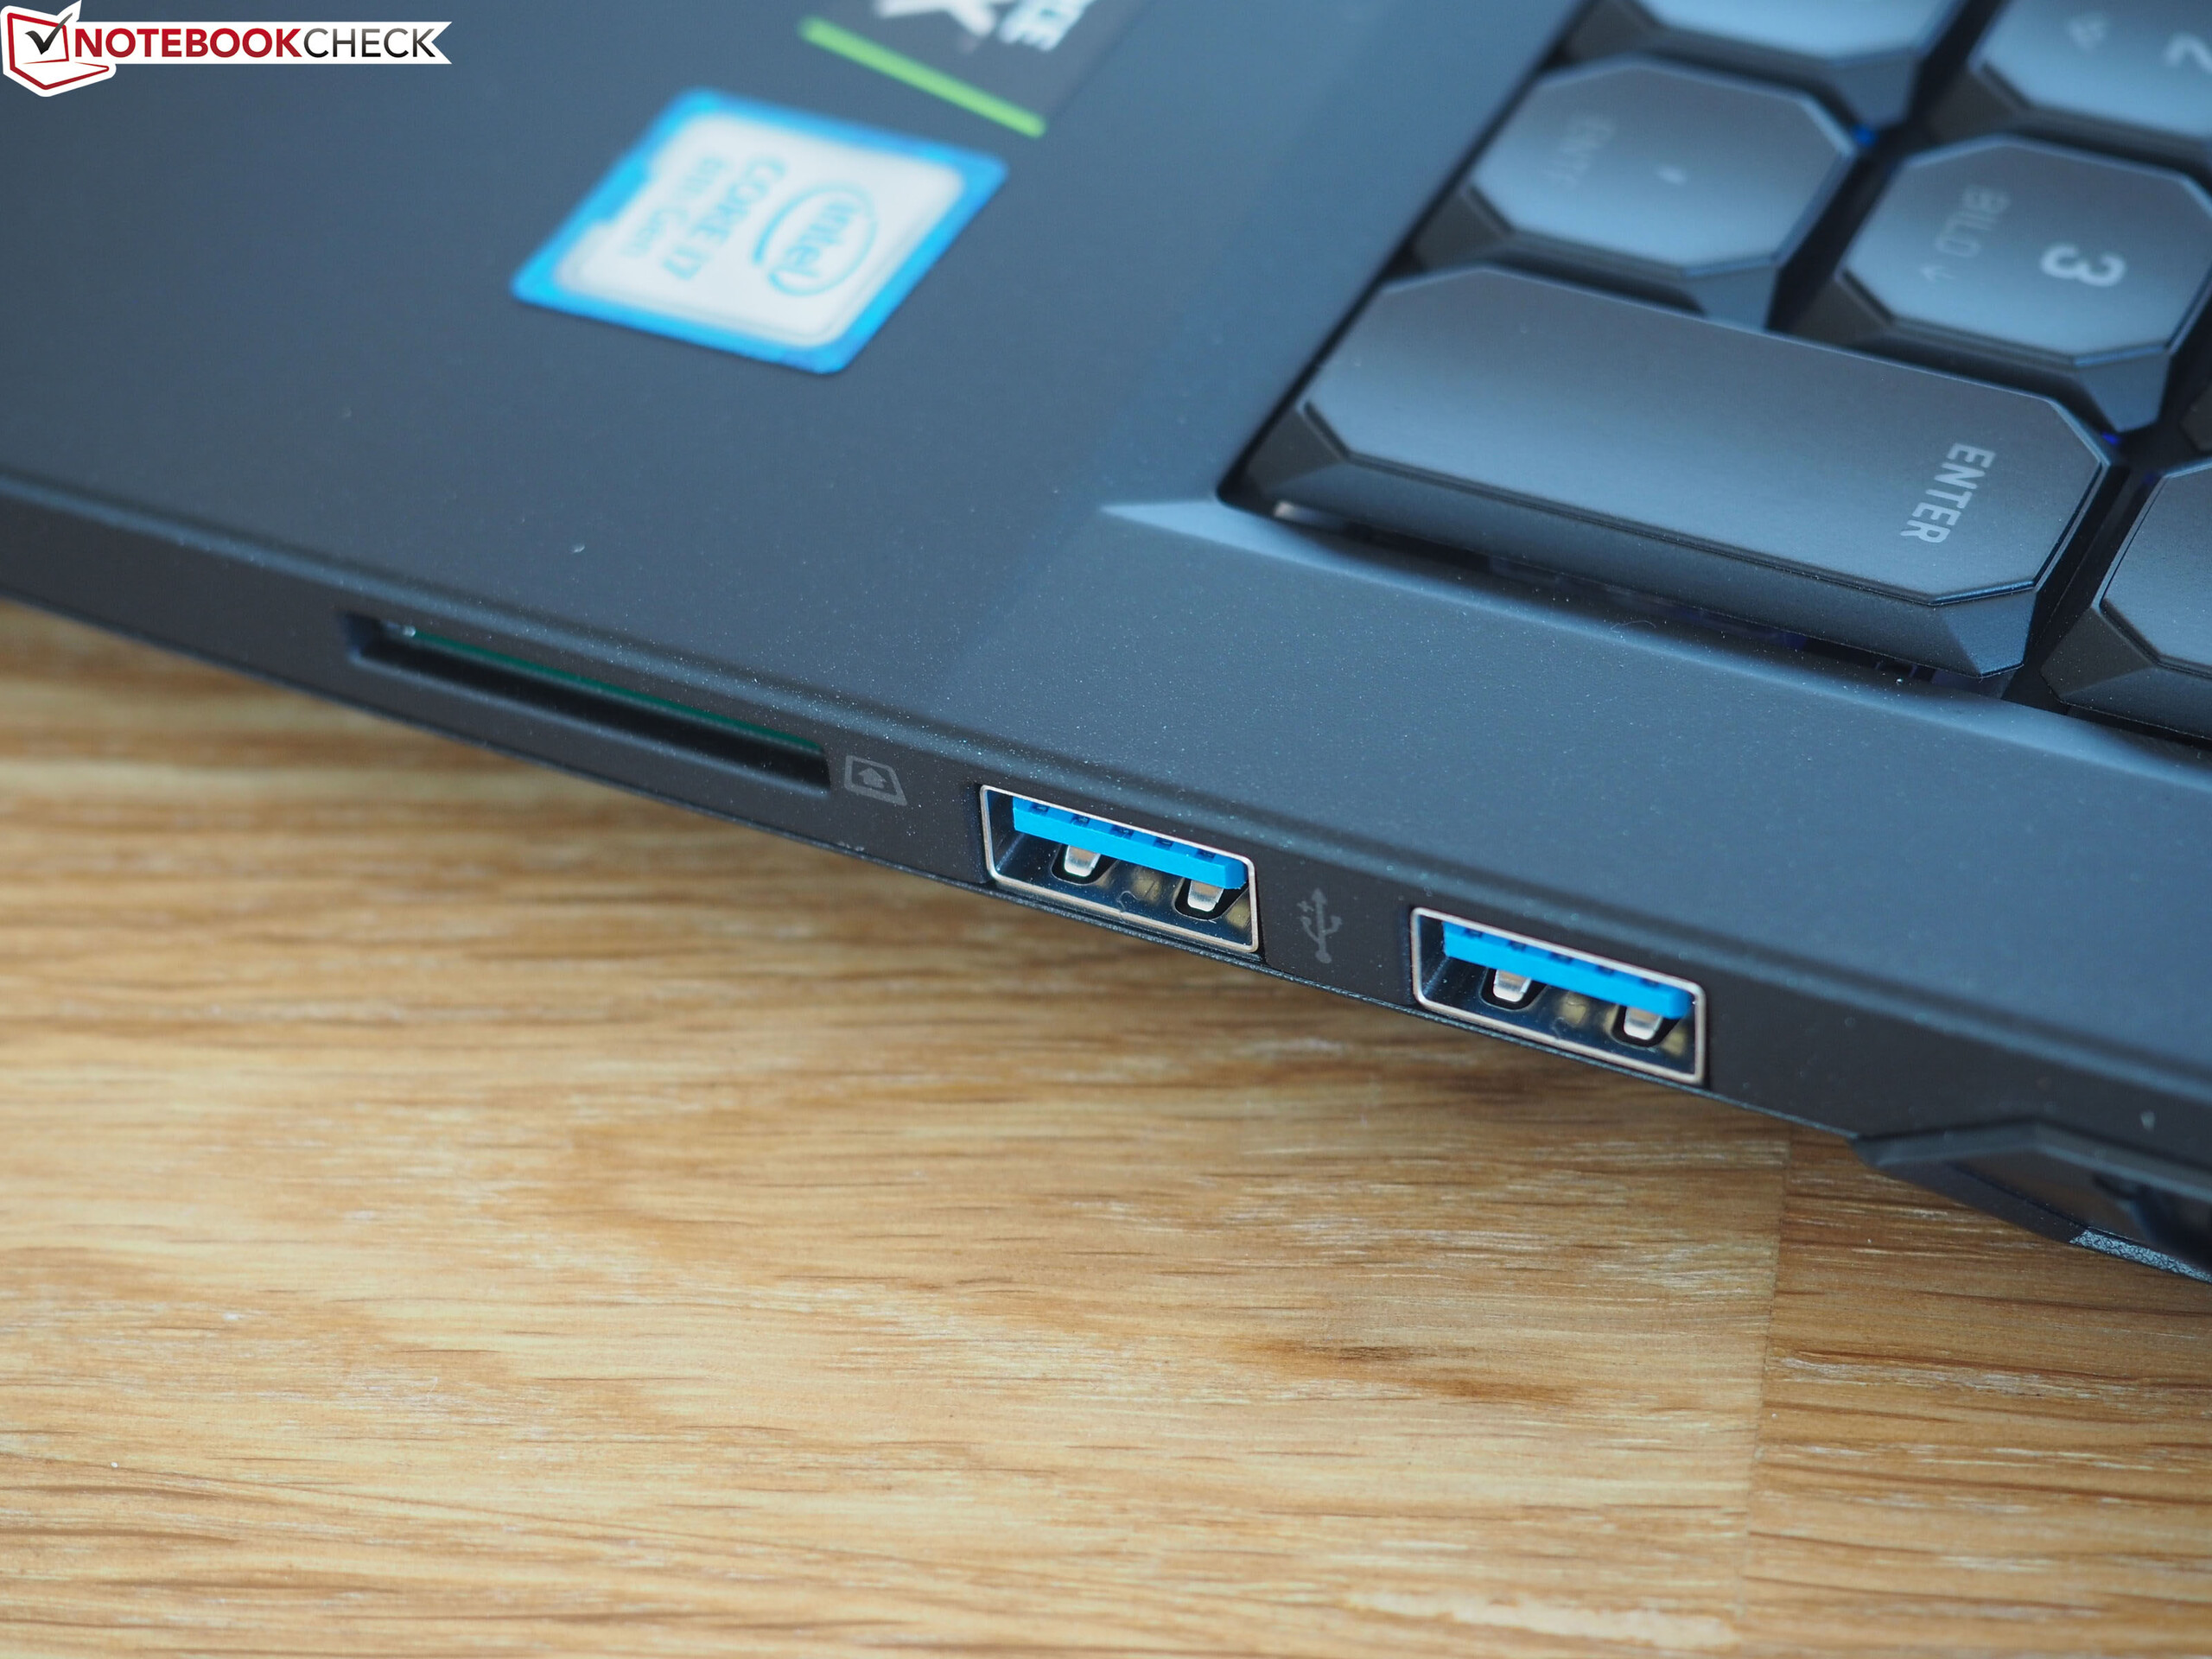
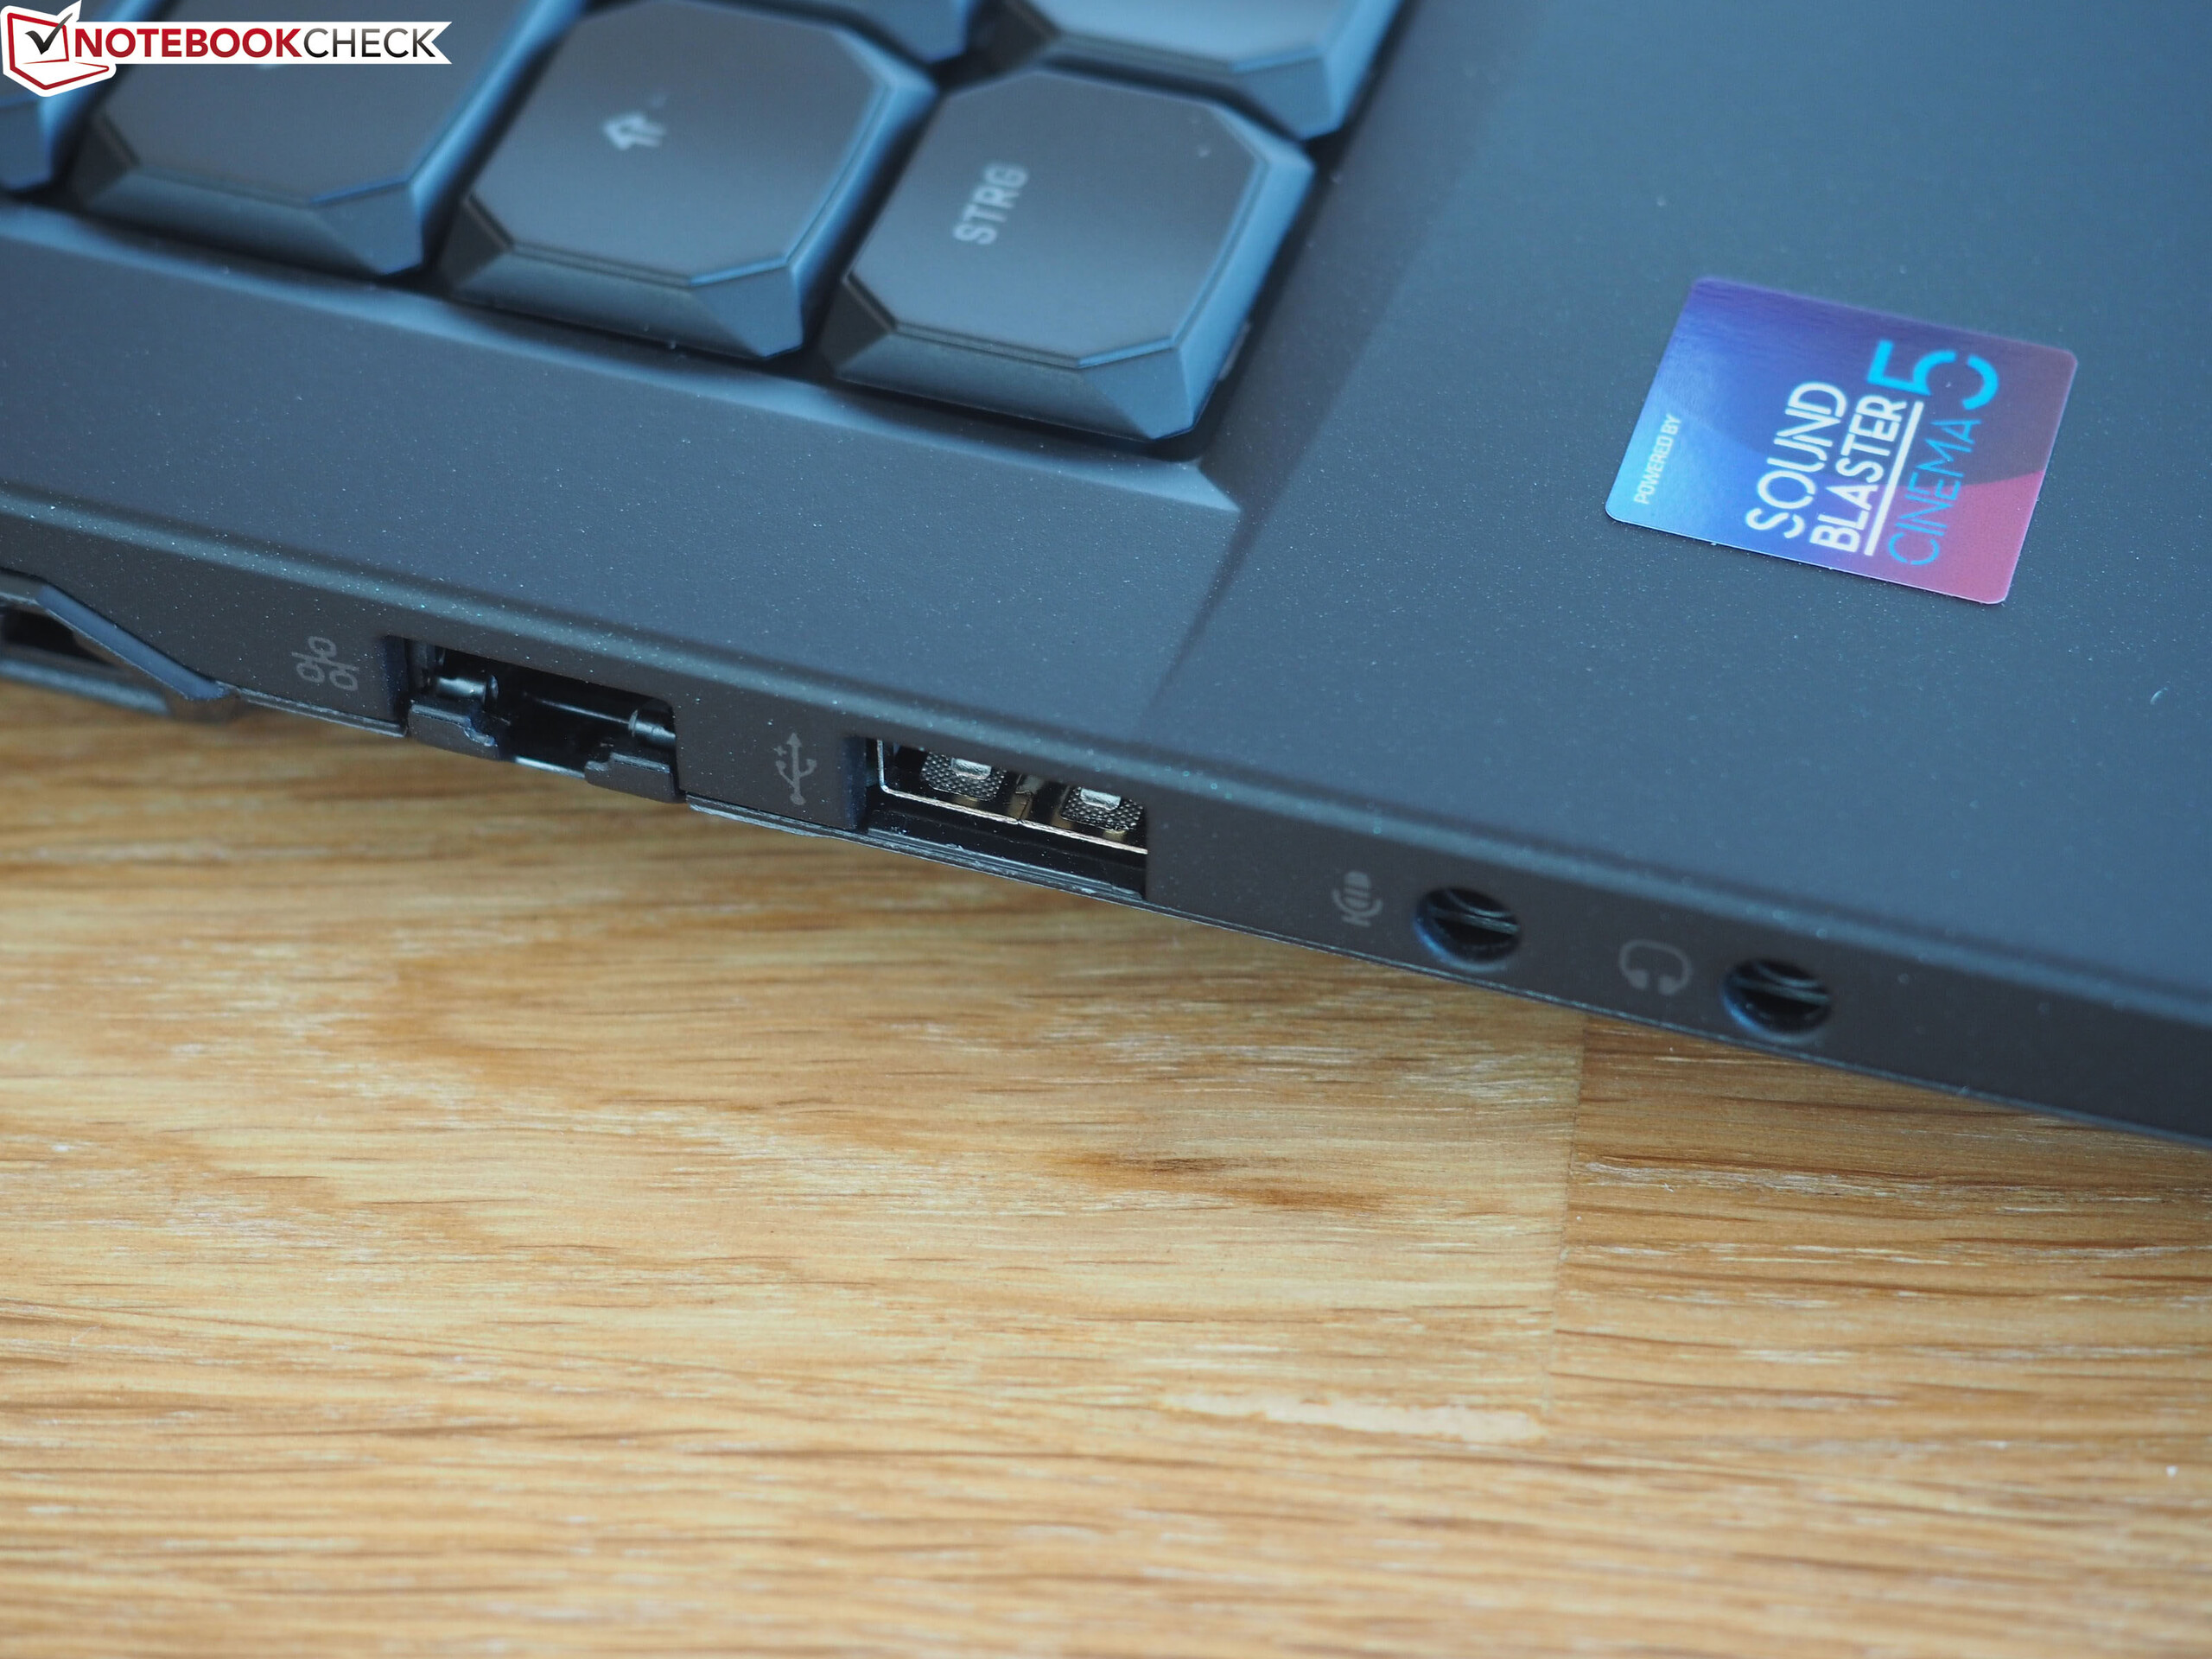
| SD Card Reader | |
| average JPG Copy Test (av. of 3 runs) | |
| Média da turma Gaming (20.9 - 210, n=54, últimos 2 anos) | |
| Asus ROG Strix Scar II GL704GW (Toshiba Exceria Pro SDXC 64 GB UHS-II) | |
| Schenker XMG Neo 17 (Toshiba Exceria Pro SDXC 64 GB UHS-II) | |
| MSI GE75 8SF (Toshiba Exceria Pro SDXC 64 GB UHS-II) | |
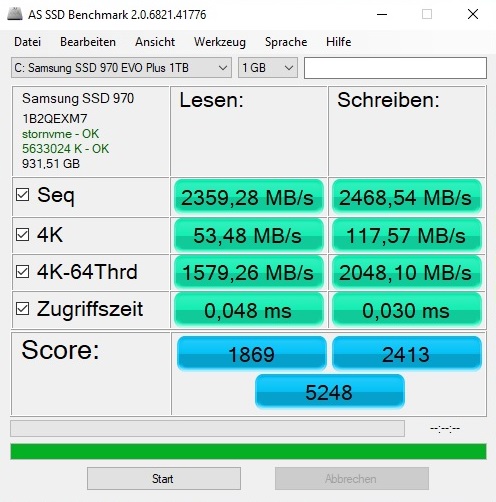
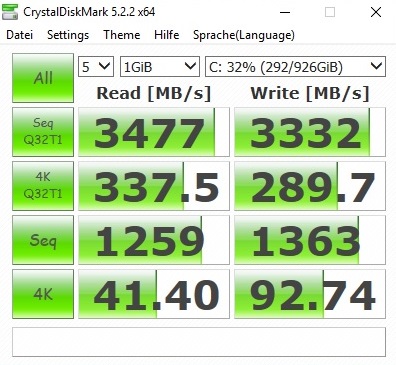
| maximum AS SSD Seq Read Test (1GB) | |
| Média da turma Gaming (25.5 - 261, n=51, últimos 2 anos) | |
| Schenker XMG Neo 17 (Toshiba Exceria Pro SDXC 64 GB UHS-II) | |
| Asus ROG Strix Scar II GL704GW (Toshiba Exceria Pro SDXC 64 GB UHS-II) | |
| MSI GE75 8SF (Toshiba Exceria Pro SDXC 64 GB UHS-II) | |
| |||||||||||||||||||||||||
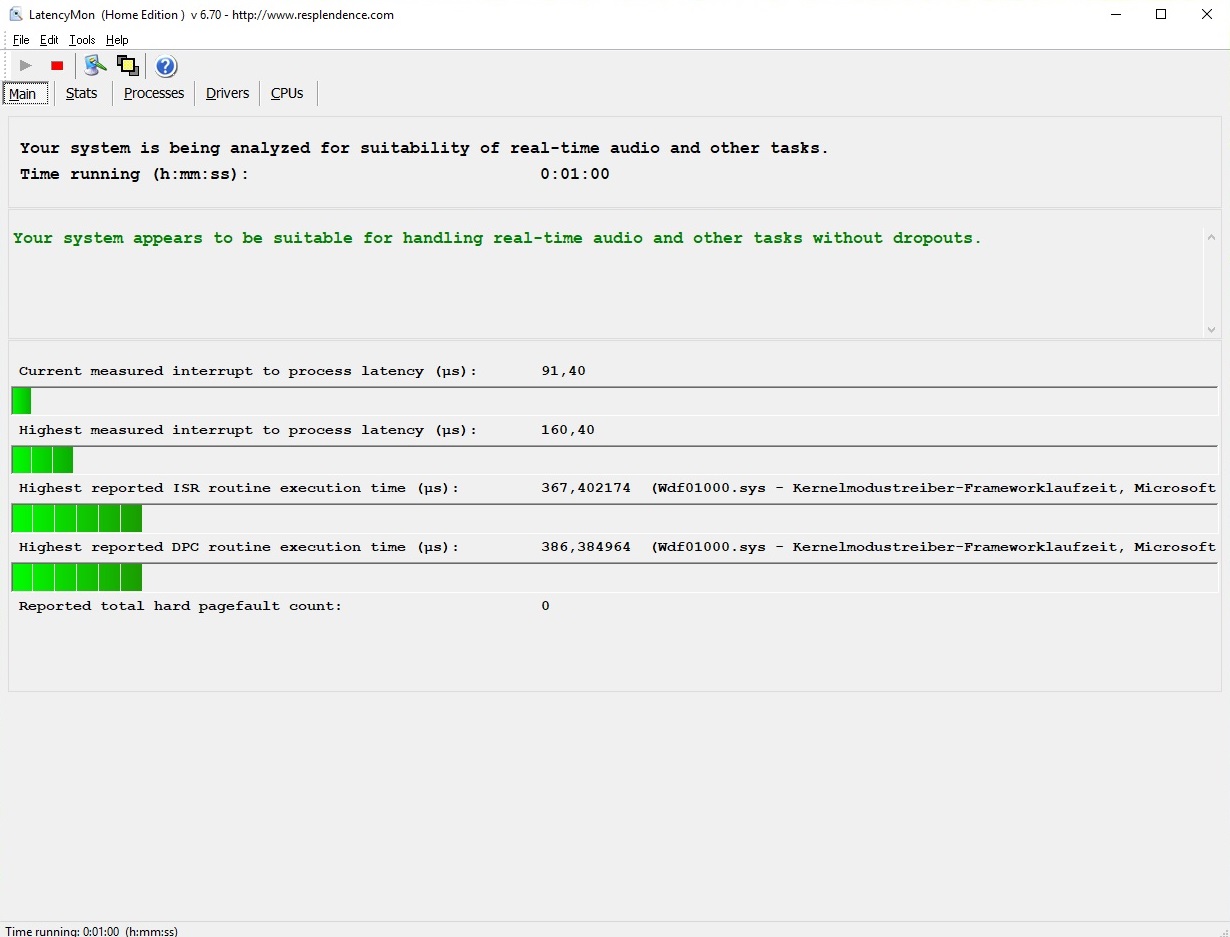
iluminação: 90 %
iluminação com acumulador: 304 cd/m²
Contraste: 1169:1 (Preto: 0.26 cd/m²)
ΔE ColorChecker Calman: 2.65 | ∀{0.5-29.43 Ø4.71}
calibrated: 1.5
ΔE Greyscale Calman: 2.75 | ∀{0.09-98 Ø4.96}
92% sRGB (Argyll 1.6.3 3D)
60% AdobeRGB 1998 (Argyll 1.6.3 3D)
66.5% AdobeRGB 1998 (Argyll 3D)
92.2% sRGB (Argyll 3D)
65.2% Display P3 (Argyll 3D)
Gamma: 2.46
CCT: 6763 K
| Schenker XMG Neo 17 BOEhydis NV173FHM-N44 (BOE07B6), IPS, 1920x1080 | Asus ROG Strix Scar II GL704GW B173HAN04.0 (AUO409D), AHVA, 1920x1080 | MSI GE75 8SF Chi Mei N173HCE-G33, IPS, 1920x1080 | Lenovo Legion Y740-17ICH AU Optronics B173HAN03.2, IPS, 1920x1080 | Asus Zephyrus S GX701GX B173HAN04.0 (AUO409D), IPS, 1920x1080 | |
|---|---|---|---|---|---|
| Display | -5% | -1% | -2% | -4% | |
| Display P3 Coverage (%) | 65.2 | 62.9 -4% | 63.1 -3% | 64 -2% | 62.9 -4% |
| sRGB Coverage (%) | 92.2 | 87.1 -6% | 94.4 2% | 90.4 -2% | 87.8 -5% |
| AdobeRGB 1998 Coverage (%) | 66.5 | 63.7 -4% | 65.2 -2% | 64.8 -3% | 63.9 -4% |
| Response Times | 7% | 31% | 5% | 41% | |
| Response Time Grey 50% / Grey 80% * (ms) | 18.8 ? | 17.6 ? 6% | 9.6 ? 49% | 15.6 ? 17% | 7.2 ? 62% |
| Response Time Black / White * (ms) | 12 ? | 11.2 ? 7% | 10.4 ? 13% | 12.8 ? -7% | 9.6 ? 20% |
| PWM Frequency (Hz) | 971 ? | 25770 ? | |||
| Screen | -6% | 19% | -42% | 4% | |
| Brightness middle (cd/m²) | 304 | 295 -3% | 370.4 22% | 299.1 -2% | 288 -5% |
| Brightness (cd/m²) | 289 | 291 1% | 348 20% | 273 -6% | 287 -1% |
| Brightness Distribution (%) | 90 | 96 7% | 89 -1% | 81 -10% | 91 1% |
| Black Level * (cd/m²) | 0.26 | 0.24 8% | 0.29 -12% | 0.27 -4% | 0.2 23% |
| Contrast (:1) | 1169 | 1229 5% | 1277 9% | 1108 -5% | 1440 23% |
| Colorchecker dE 2000 * | 2.65 | 3.2 -21% | 1.26 52% | 5.07 -91% | 2.33 12% |
| Colorchecker dE 2000 max. * | 6.11 | 6.64 -9% | 3.02 51% | 10.55 -73% | 5.34 13% |
| Colorchecker dE 2000 calibrated * | 1.5 | 2.52 -68% | 1.21 19% | 3.31 -121% | 2.47 -65% |
| Greyscale dE 2000 * | 2.75 | 2.16 21% | 1.4 49% | 6.8 -147% | 1.19 57% |
| Gamma | 2.46 89% | 2.46 89% | 2.2 100% | 2.46 89% | 2.41 91% |
| CCT | 6763 96% | 6872 95% | 6747 96% | 7805 83% | 6710 97% |
| Color Space (Percent of AdobeRGB 1998) (%) | 60 | 57 -5% | 59.7 0% | 58.5 -2% | 57 -5% |
| Color Space (Percent of sRGB) (%) | 92 | 87 -5% | 94.4 3% | 89.9 -2% | 88 -4% |
| Média Total (Programa/Configurações) | -1% /
-4% | 16% /
17% | -13% /
-29% | 14% /
7% |
* ... menor é melhor
Exibir tempos de resposta
| ↔ Tempo de resposta preto para branco | ||
|---|---|---|
| 12 ms ... ascensão ↗ e queda ↘ combinadas | ↗ 6.8 ms ascensão | 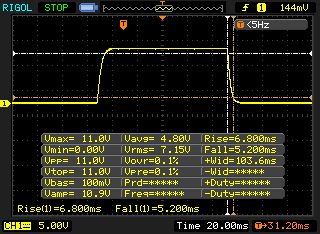 |
| ↘ 5.2 ms queda | ||
| A tela mostra boas taxas de resposta em nossos testes, mas pode ser muito lenta para jogadores competitivos. Em comparação, todos os dispositivos testados variam de 0.1 (mínimo) a 240 (máximo) ms. » 32 % de todos os dispositivos são melhores. Isso significa que o tempo de resposta medido é melhor que a média de todos os dispositivos testados (19.8 ms). | ||
| ↔ Tempo de resposta 50% cinza a 80% cinza | ||
| 18.8 ms ... ascensão ↗ e queda ↘ combinadas | ↗ 9.6 ms ascensão | 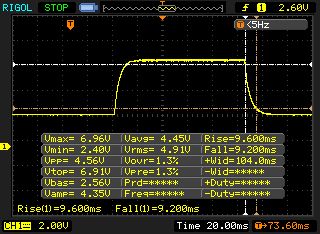 |
| ↘ 9.2 ms queda | ||
| A tela mostra boas taxas de resposta em nossos testes, mas pode ser muito lenta para jogadores competitivos. Em comparação, todos os dispositivos testados variam de 0.165 (mínimo) a 636 (máximo) ms. » 32 % de todos os dispositivos são melhores. Isso significa que o tempo de resposta medido é melhor que a média de todos os dispositivos testados (31 ms). | ||
Cintilação da tela / PWM (modulação por largura de pulso)
| Tela tremeluzindo/PWM detectado | 971 Hz | ≤ 99 % configuração de brilho | 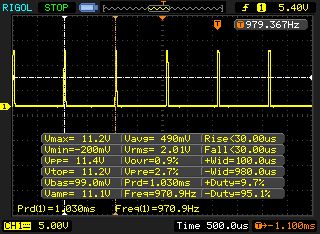 |
A luz de fundo da tela pisca em 971 Hz (pior caso, por exemplo, utilizando PWM) Cintilação detectada em uma configuração de brilho de 99 % e abaixo. Não deve haver cintilação ou PWM acima desta configuração de brilho. A frequência de 971 Hz é bastante alta, então a maioria dos usuários sensíveis ao PWM não deve notar nenhuma oscilação. [pwm_comparison] Em comparação: 52 % de todos os dispositivos testados não usam PWM para escurecer a tela. Se PWM foi detectado, uma média de 7757 (mínimo: 5 - máximo: 343500) Hz foi medida. | |||
| Cinebench R11.5 | |
| CPU Single 64Bit | |
| Média da turma Gaming (3.3 - 4.16, n=9, últimos 2 anos) | |
| Schenker XMG Neo 17 | |
| Asus Zephyrus S GX701GX | |
| CPU Multi 64Bit | |
| Média da turma Gaming (29.8 - 76.7, n=9, últimos 2 anos) | |
| Asus Zephyrus S GX701GX | |
| Schenker XMG Neo 17 | |
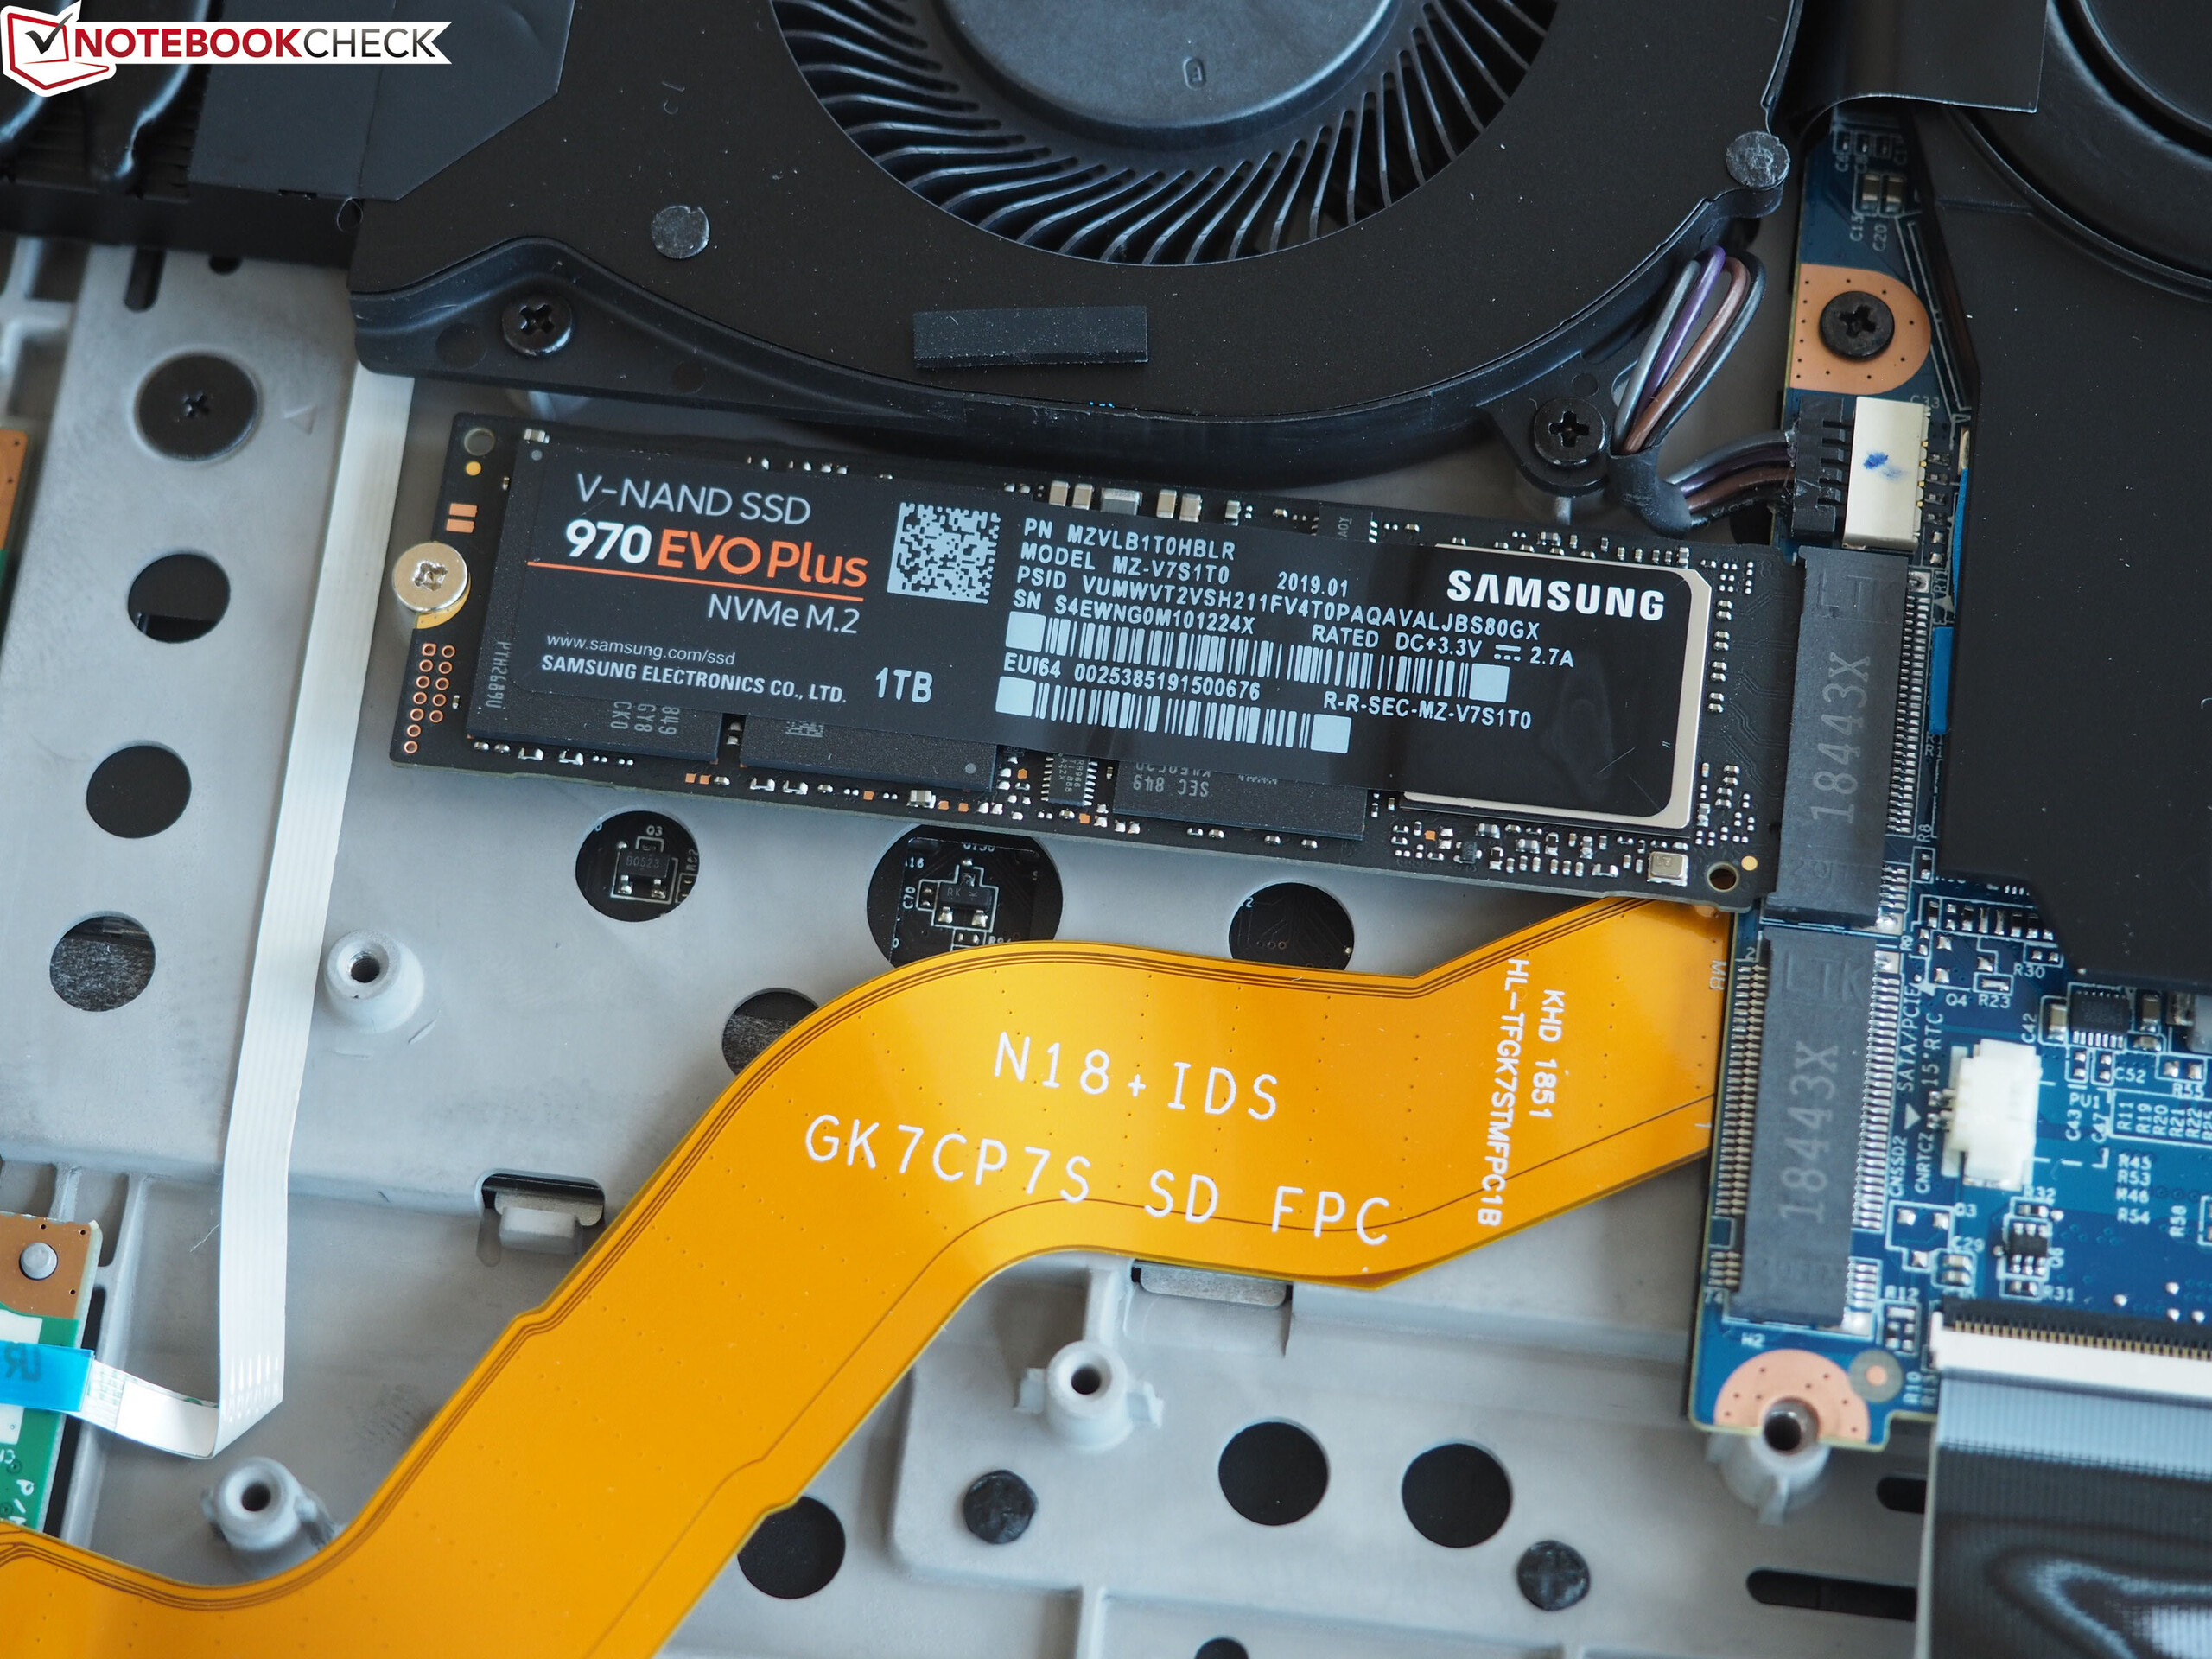
| Schenker XMG Neo 17 Samsung SSD 970 EVO Plus 1TB | Asus ROG Strix Scar II GL704GW Intel SSD 660p SSDPEKNW512G8 | MSI GE75 8SF Kingston RBUSNS8154P3256GJ1 | Lenovo Legion Y740-17ICH Samsung SSD PM981 MZVLB256HAHQ | Asus Zephyrus S GX701GX Samsung SSD PM981 MZVLB1T0HALR | |
|---|---|---|---|---|---|
| AS SSD | -57% | -80% | -41% | -16% | |
| Seq Read (MB/s) | 2359 | 1315 -44% | 949 -60% | 1153 -51% | 911 -61% |
| Seq Write (MB/s) | 2469 | 927 -62% | 823 -67% | 1328 -46% | 2347 -5% |
| 4K Read (MB/s) | 53.5 | 52.4 -2% | 25.36 -53% | 35.05 -34% | 53 -1% |
| 4K Write (MB/s) | 117.6 | 122.8 4% | 67.1 -43% | 96 -18% | 122.5 4% |
| 4K-64 Read (MB/s) | 1579 | 326.5 -79% | 748 -53% | 727 -54% | 1577 0% |
| 4K-64 Write (MB/s) | 2048 | 727 -65% | 650 -68% | 1212 -41% | 1734 -15% |
| Access Time Read * (ms) | 0.048 | 0.11 -129% | 0.173 -260% | 0.063 -31% | 0.08 -67% |
| Access Time Write * (ms) | 0.03 | 0.045 -50% | 0.059 -97% | 0.04 -33% | 0.031 -3% |
| Score Read (Points) | 1869 | 510 -73% | 869 -54% | 878 -53% | 1721 -8% |
| Score Write (Points) | 2413 | 942 -61% | 799 -67% | 1441 -40% | 2091 -13% |
| Score Total (Points) | 5248 | 1715 -67% | 2109 -60% | 2784 -47% | 4771 -9% |
* ... menor é melhor

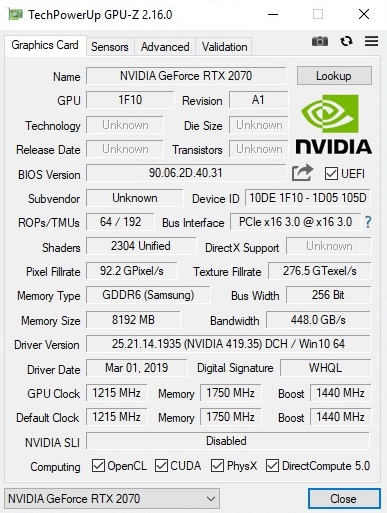
| 3DMark 11 Performance | 18150 pontos | |
| 3DMark Cloud Gate Standard Score | 29348 pontos | |
| 3DMark Fire Strike Score | 15686 pontos | |
Ajuda | ||
| The Witcher 3 | |
| 1920x1080 High Graphics & Postprocessing (Nvidia HairWorks Off) | |
| Média da turma Gaming (341 - 404, n=2, últimos 2 anos) | |
| Asus Zephyrus S GX701GX | |
| Lenovo Legion Y740-17ICH | |
| Schenker XMG Neo 17 | |
| Asus ROG Strix Scar II GL704GW | |
| MSI GE75 8SF | |
| 1920x1080 Ultra Graphics & Postprocessing (HBAO+) | |
| Média da turma Gaming (104.7 - 240, n=7, últimos 2 anos) | |
| Asus Zephyrus S GX701GX | |
| Lenovo Legion Y740-17ICH | |
| Schenker XMG Neo 17 | |
| Asus ROG Strix Scar II GL704GW | |
| MSI GE75 8SF | |
| baixo | média | alto | ultra | QHD | 4K | |
|---|---|---|---|---|---|---|
| The Witcher 3 (2015) | 137 | 73 | 49.5 | |||
| Apex Legends (2019) | 143 | 134 | 132 | 88.2 | 45.4 | |
| Far Cry New Dawn (2019) | 94 | 92 | 82 | 74 | 42 | |
| Metro Exodus (2019) | 87.9 | 66.4 | 54.1 | 42 | 26.1 | |
| Anthem (2019) | 88.8 | 85.4 | 79.8 | 62 | 35.5 | |
| Dirt Rally 2.0 (2019) | 143 | 117 | 75.2 | 62.1 | ||
| The Division 2 (2019) | 113 | 95 | 78 | 60 | 33 |
Barulho
| Ocioso |
| 29 / 32 / 33 dB |
| Carga |
| 42 / 49 dB |
 | ||
30 dB silencioso 40 dB(A) audível 50 dB(A) ruidosamente alto |
||
min: | ||
| Schenker XMG Neo 17 GeForce RTX 2070 Mobile, i7-8750H | Asus ROG Strix Scar II GL704GW GeForce RTX 2070 Mobile, i7-8750H | MSI GE75 8SF GeForce RTX 2070 Mobile, i7-8750H | Lenovo Legion Y740-17ICH GeForce RTX 2080 Max-Q, i7-8750H | Asus Zephyrus S GX701GX GeForce RTX 2080 Max-Q, i7-8750H | Média da turma Gaming | |
|---|---|---|---|---|---|---|
| Noise | -6% | -5% | 6% | -2% | 6% | |
| desligado / ambiente * (dB) | 29 | 29 -0% | 28.3 2% | 28.3 2% | 29 -0% | 24.1 ? 17% |
| Idle Minimum * (dB) | 29 | 29 -0% | 33.5 -16% | 31.5 -9% | 29 -0% | 26 ? 10% |
| Idle Average * (dB) | 32 | 32 -0% | 33.6 -5% | 31.6 1% | 32 -0% | 27.4 ? 14% |
| Idle Maximum * (dB) | 33 | 40 -21% | 35 -6% | 31.6 4% | 33 -0% | 30.1 ? 9% |
| Load Average * (dB) | 42 | 46 -10% | 38 10% | 32.3 23% | 47 -12% | 43.6 ? -4% |
| Witcher 3 ultra * (dB) | 49 | 51 -4% | 50 -2% | 43 12% | 49 -0% | |
| Load Maximum * (dB) | 49 | 52 -6% | 56.9 -16% | 45.5 7% | 51 -4% | 54.2 ? -11% |
* ... menor é melhor
(-) A temperatura máxima no lado superior é 47 °C / 117 F, em comparação com a média de 40.4 °C / 105 F , variando de 21.2 a 68.8 °C para a classe Gaming.
(-) A parte inferior aquece até um máximo de 56 °C / 133 F, em comparação com a média de 43.2 °C / 110 F
(+) Em uso inativo, a temperatura média para o lado superior é 26.6 °C / 80 F, em comparação com a média do dispositivo de 33.9 °C / ### class_avg_f### F.
(-) Jogando The Witcher 3, a temperatura média para o lado superior é 39.2 °C / 103 F, em comparação com a média do dispositivo de 33.9 °C / ## #class_avg_f### F.
(+) Os apoios para as mãos e o touchpad estão atingindo a temperatura máxima da pele (35 °C / 95 F) e, portanto, não estão quentes.
(-) A temperatura média da área do apoio para as mãos de dispositivos semelhantes foi 28.8 °C / 83.8 F (-6.2 °C / -11.2 F).
| Schenker XMG Neo 17 GeForce RTX 2070 Mobile, i7-8750H | Asus ROG Strix Scar II GL704GW GeForce RTX 2070 Mobile, i7-8750H | MSI GE75 8SF GeForce RTX 2070 Mobile, i7-8750H | Lenovo Legion Y740-17ICH GeForce RTX 2080 Max-Q, i7-8750H | Asus Zephyrus S GX701GX GeForce RTX 2080 Max-Q, i7-8750H | Média da turma Gaming | |
|---|---|---|---|---|---|---|
| Heat | -14% | 9% | 4% | 1% | -2% | |
| Maximum Upper Side * (°C) | 47 | 59 -26% | 41.2 12% | 38.6 18% | 53 -13% | 45.2 ? 4% |
| Maximum Bottom * (°C) | 56 | 54 4% | 46 18% | 43.6 22% | 50 11% | 48.1 ? 14% |
| Idle Upper Side * (°C) | 28 | 33 -18% | 26.2 6% | 30.2 -8% | 27 4% | 31 ? -11% |
| Idle Bottom * (°C) | 30 | 35 -17% | 30.2 -1% | 35 -17% | 30 -0% | 34.2 ? -14% |
* ... menor é melhor
Schenker XMG Neo 17 análise de áudio
(-) | alto-falantes não muito altos (###valor### dB)
Graves 100 - 315Hz
(±) | graves reduzidos - em média 8.2% menor que a mediana
(±) | a linearidade dos graves é média (14.3% delta para a frequência anterior)
Médios 400 - 2.000 Hz
(±) | médios mais altos - em média 6.4% maior que a mediana
(+) | médios são lineares (6.9% delta para frequência anterior)
Altos 2 - 16 kHz
(+) | agudos equilibrados - apenas 2.6% longe da mediana
(±) | a linearidade dos máximos é média (10.1% delta para frequência anterior)
Geral 100 - 16.000 Hz
(±) | a linearidade do som geral é média (19.1% diferença em relação à mediana)
Comparado com a mesma classe
» 64% de todos os dispositivos testados nesta classe foram melhores, 7% semelhantes, 28% piores
» O melhor teve um delta de 6%, a média foi 18%, o pior foi 132%
Comparado com todos os dispositivos testados
» 46% de todos os dispositivos testados foram melhores, 7% semelhantes, 47% piores
» O melhor teve um delta de 4%, a média foi 23%, o pior foi 134%
Asus ROG Strix Scar II GL704GW análise de áudio
(±) | o volume do alto-falante é médio, mas bom (###valor### dB)
Graves 100 - 315Hz
(±) | graves reduzidos - em média 6.1% menor que a mediana
(±) | a linearidade dos graves é média (10.4% delta para a frequência anterior)
Médios 400 - 2.000 Hz
(+) | médios equilibrados - apenas 2.2% longe da mediana
(+) | médios são lineares (2.4% delta para frequência anterior)
Altos 2 - 16 kHz
(+) | agudos equilibrados - apenas 3.1% longe da mediana
(+) | os máximos são lineares (4% delta da frequência anterior)
Geral 100 - 16.000 Hz
(+) | o som geral é linear (12.3% diferença em relação à mediana)
Comparado com a mesma classe
» 13% de todos os dispositivos testados nesta classe foram melhores, 5% semelhantes, 82% piores
» O melhor teve um delta de 6%, a média foi 18%, o pior foi 132%
Comparado com todos os dispositivos testados
» 10% de todos os dispositivos testados foram melhores, 3% semelhantes, 87% piores
» O melhor teve um delta de 4%, a média foi 23%, o pior foi 134%
| desligado | |
| Ocioso | |
| Carga |
|
Key:
min: | |
| Schenker XMG Neo 17 GeForce RTX 2070 Mobile, i7-8750H | Asus ROG Strix Scar II GL704GW GeForce RTX 2070 Mobile, i7-8750H | MSI GE75 8SF GeForce RTX 2070 Mobile, i7-8750H | Lenovo Legion Y740-17ICH GeForce RTX 2080 Max-Q, i7-8750H | Asus Zephyrus S GX701GX GeForce RTX 2080 Max-Q, i7-8750H | Média da turma Gaming | |
|---|---|---|---|---|---|---|
| Power Consumption | -27% | -19% | -22% | -23% | -17% | |
| Idle Minimum * (Watt) | 13 | 19 -46% | 16.4 -26% | 20.2 -55% | 19 -46% | 13 ? -0% |
| Idle Average * (Watt) | 16 | 22 -38% | 21.9 -37% | 27.2 -70% | 22 -38% | 19 ? -19% |
| Idle Maximum * (Watt) | 21 | 29 -38% | 25.4 -21% | 28.7 -37% | 30 -43% | 24.6 ? -17% |
| Load Average * (Watt) | 96 | 102 -6% | 90.7 6% | 90.8 5% | 104 -8% | 110.7 ? -15% |
| Witcher 3 ultra * (Watt) | 172 | 190 -10% | 203.3 -18% | 152.1 12% | 167 3% | |
| Load Maximum * (Watt) | 191 | 231 -21% | 222.9 -17% | 165.4 13% | 203 -6% | 259 ? -36% |
* ... menor é melhor
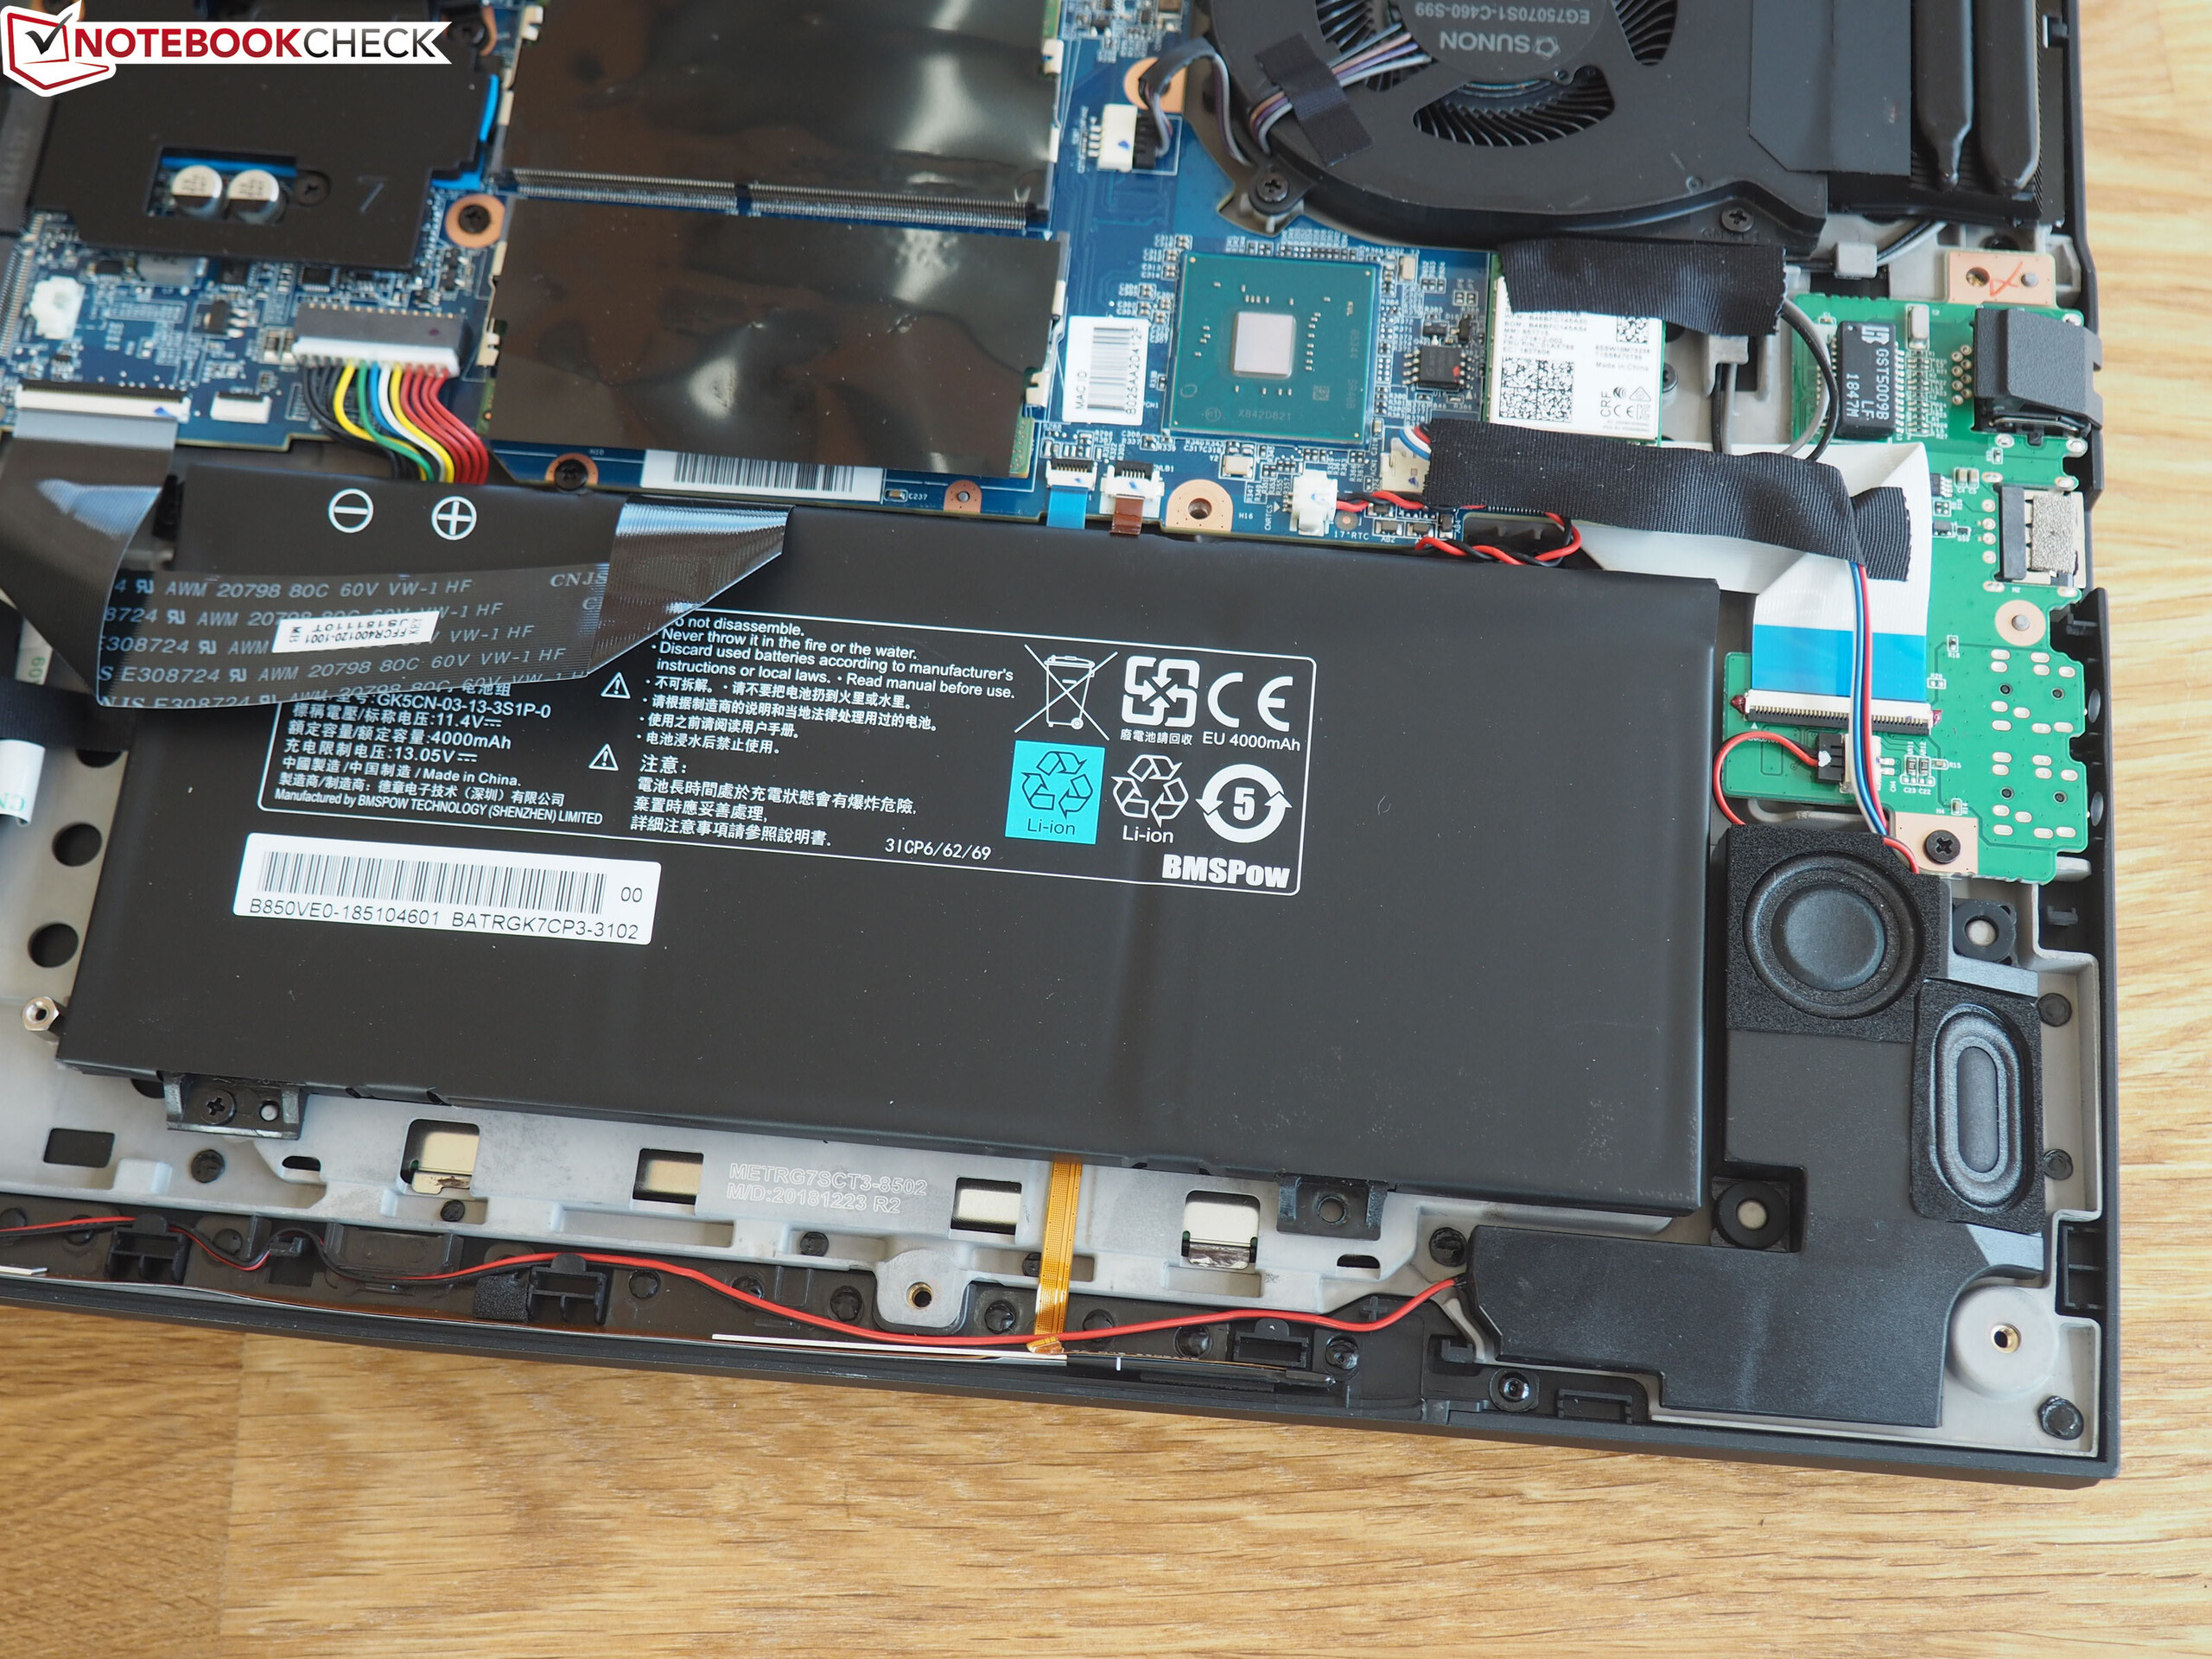
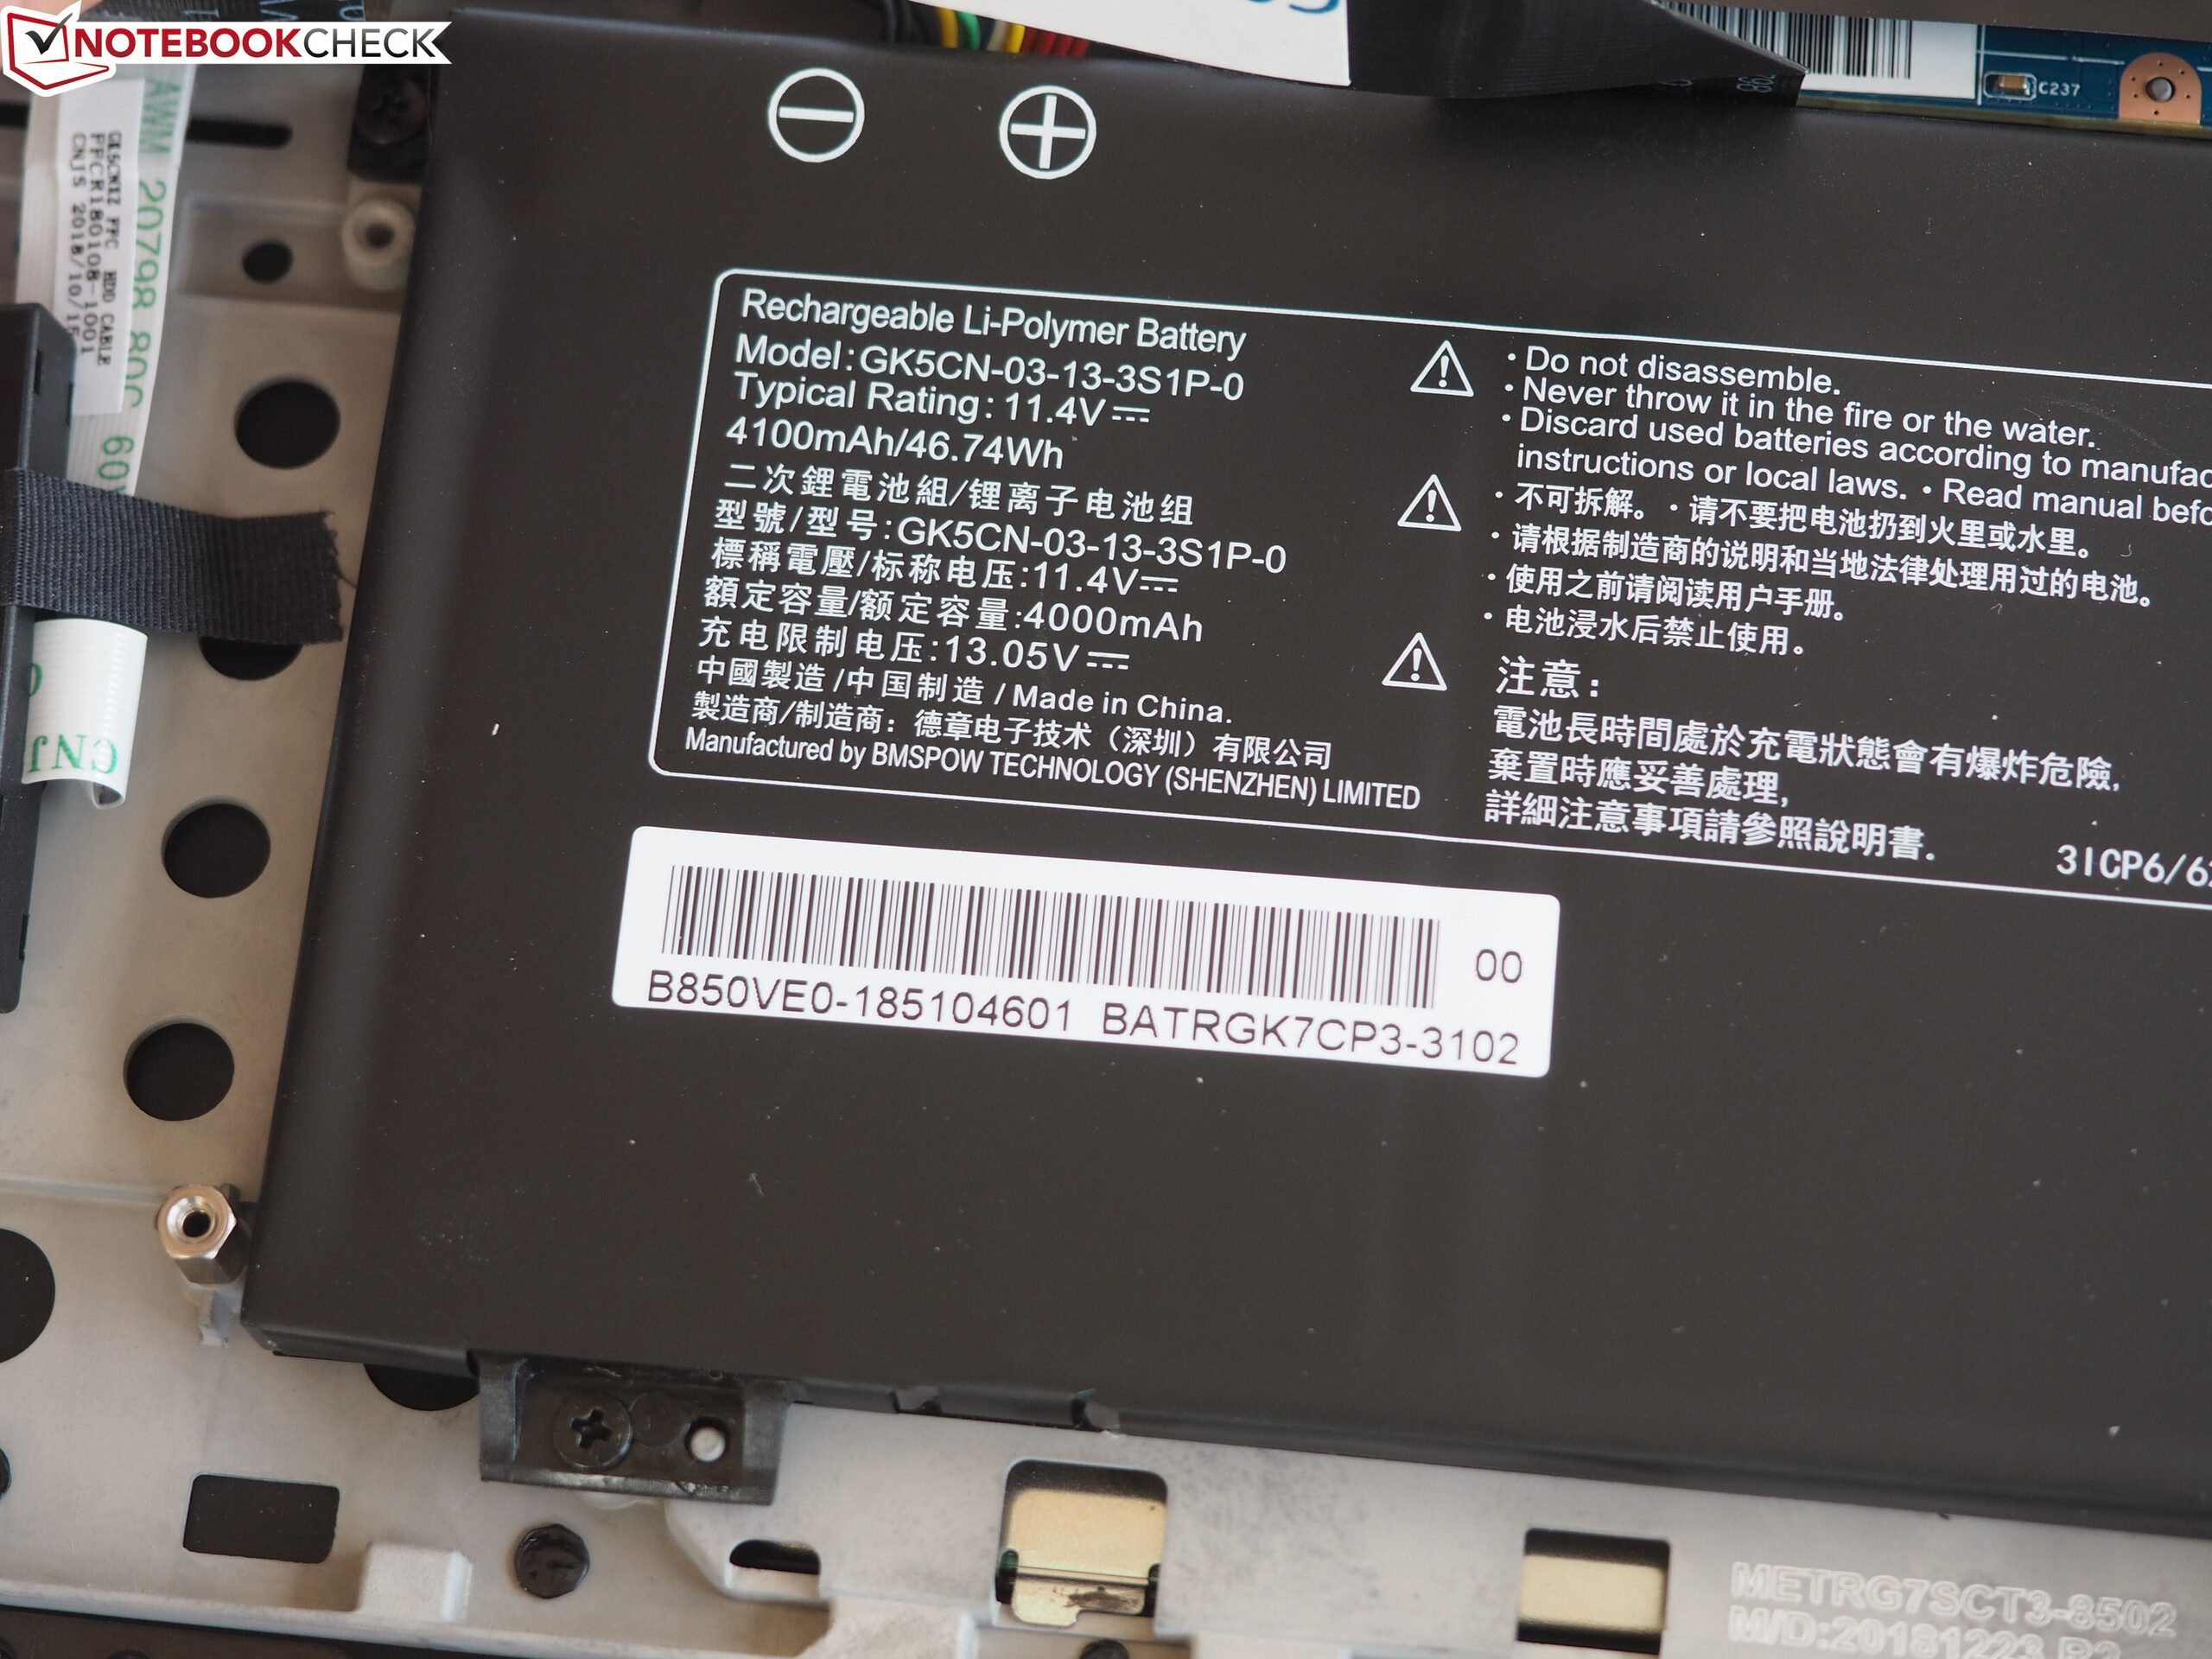
| Schenker XMG Neo 17 GeForce RTX 2070 Mobile, i7-8750H, 46.74 Wh | Asus ROG Strix Scar II GL704GW GeForce RTX 2070 Mobile, i7-8750H, 66 Wh | MSI GE75 8SF GeForce RTX 2070 Mobile, i7-8750H, 65 Wh | Lenovo Legion Y740-17ICH GeForce RTX 2080 Max-Q, i7-8750H, 76 Wh | Asus Zephyrus S GX701GX GeForce RTX 2080 Max-Q, i7-8750H, 76 Wh | Média da turma Gaming | |
|---|---|---|---|---|---|---|
| Duração da bateria | 15% | -5% | -14% | -1% | 72% | |
| Reader / Idle (h) | 5.3 | 6.2 17% | 5 -6% | 8.27 ? 56% | ||
| WiFi v1.3 (h) | 3.7 | 3.9 5% | 3.5 -5% | 3.2 -14% | 3.8 3% | 7.11 ? 92% |
| Load (h) | 0.9 | 1.1 22% | 0.9 0% | 1.502 ? 67% | ||
| Witcher 3 ultra (h) | 0.9 |
Pro
Contra
O Schenker XMG Neo 17 é em grande parte um excelente portátil para jogos de 17 polegadas. A tela é um deleite com sua alta relação de contraste e taxa de atualização de 144 Hz, juntamente com seus marcos finos. Além disso, impressionou nos nossos testes de jogos graças à sua GPU RTX 2070, enquanto o seu teclado RGB mecânico é um prazer para a digitação.
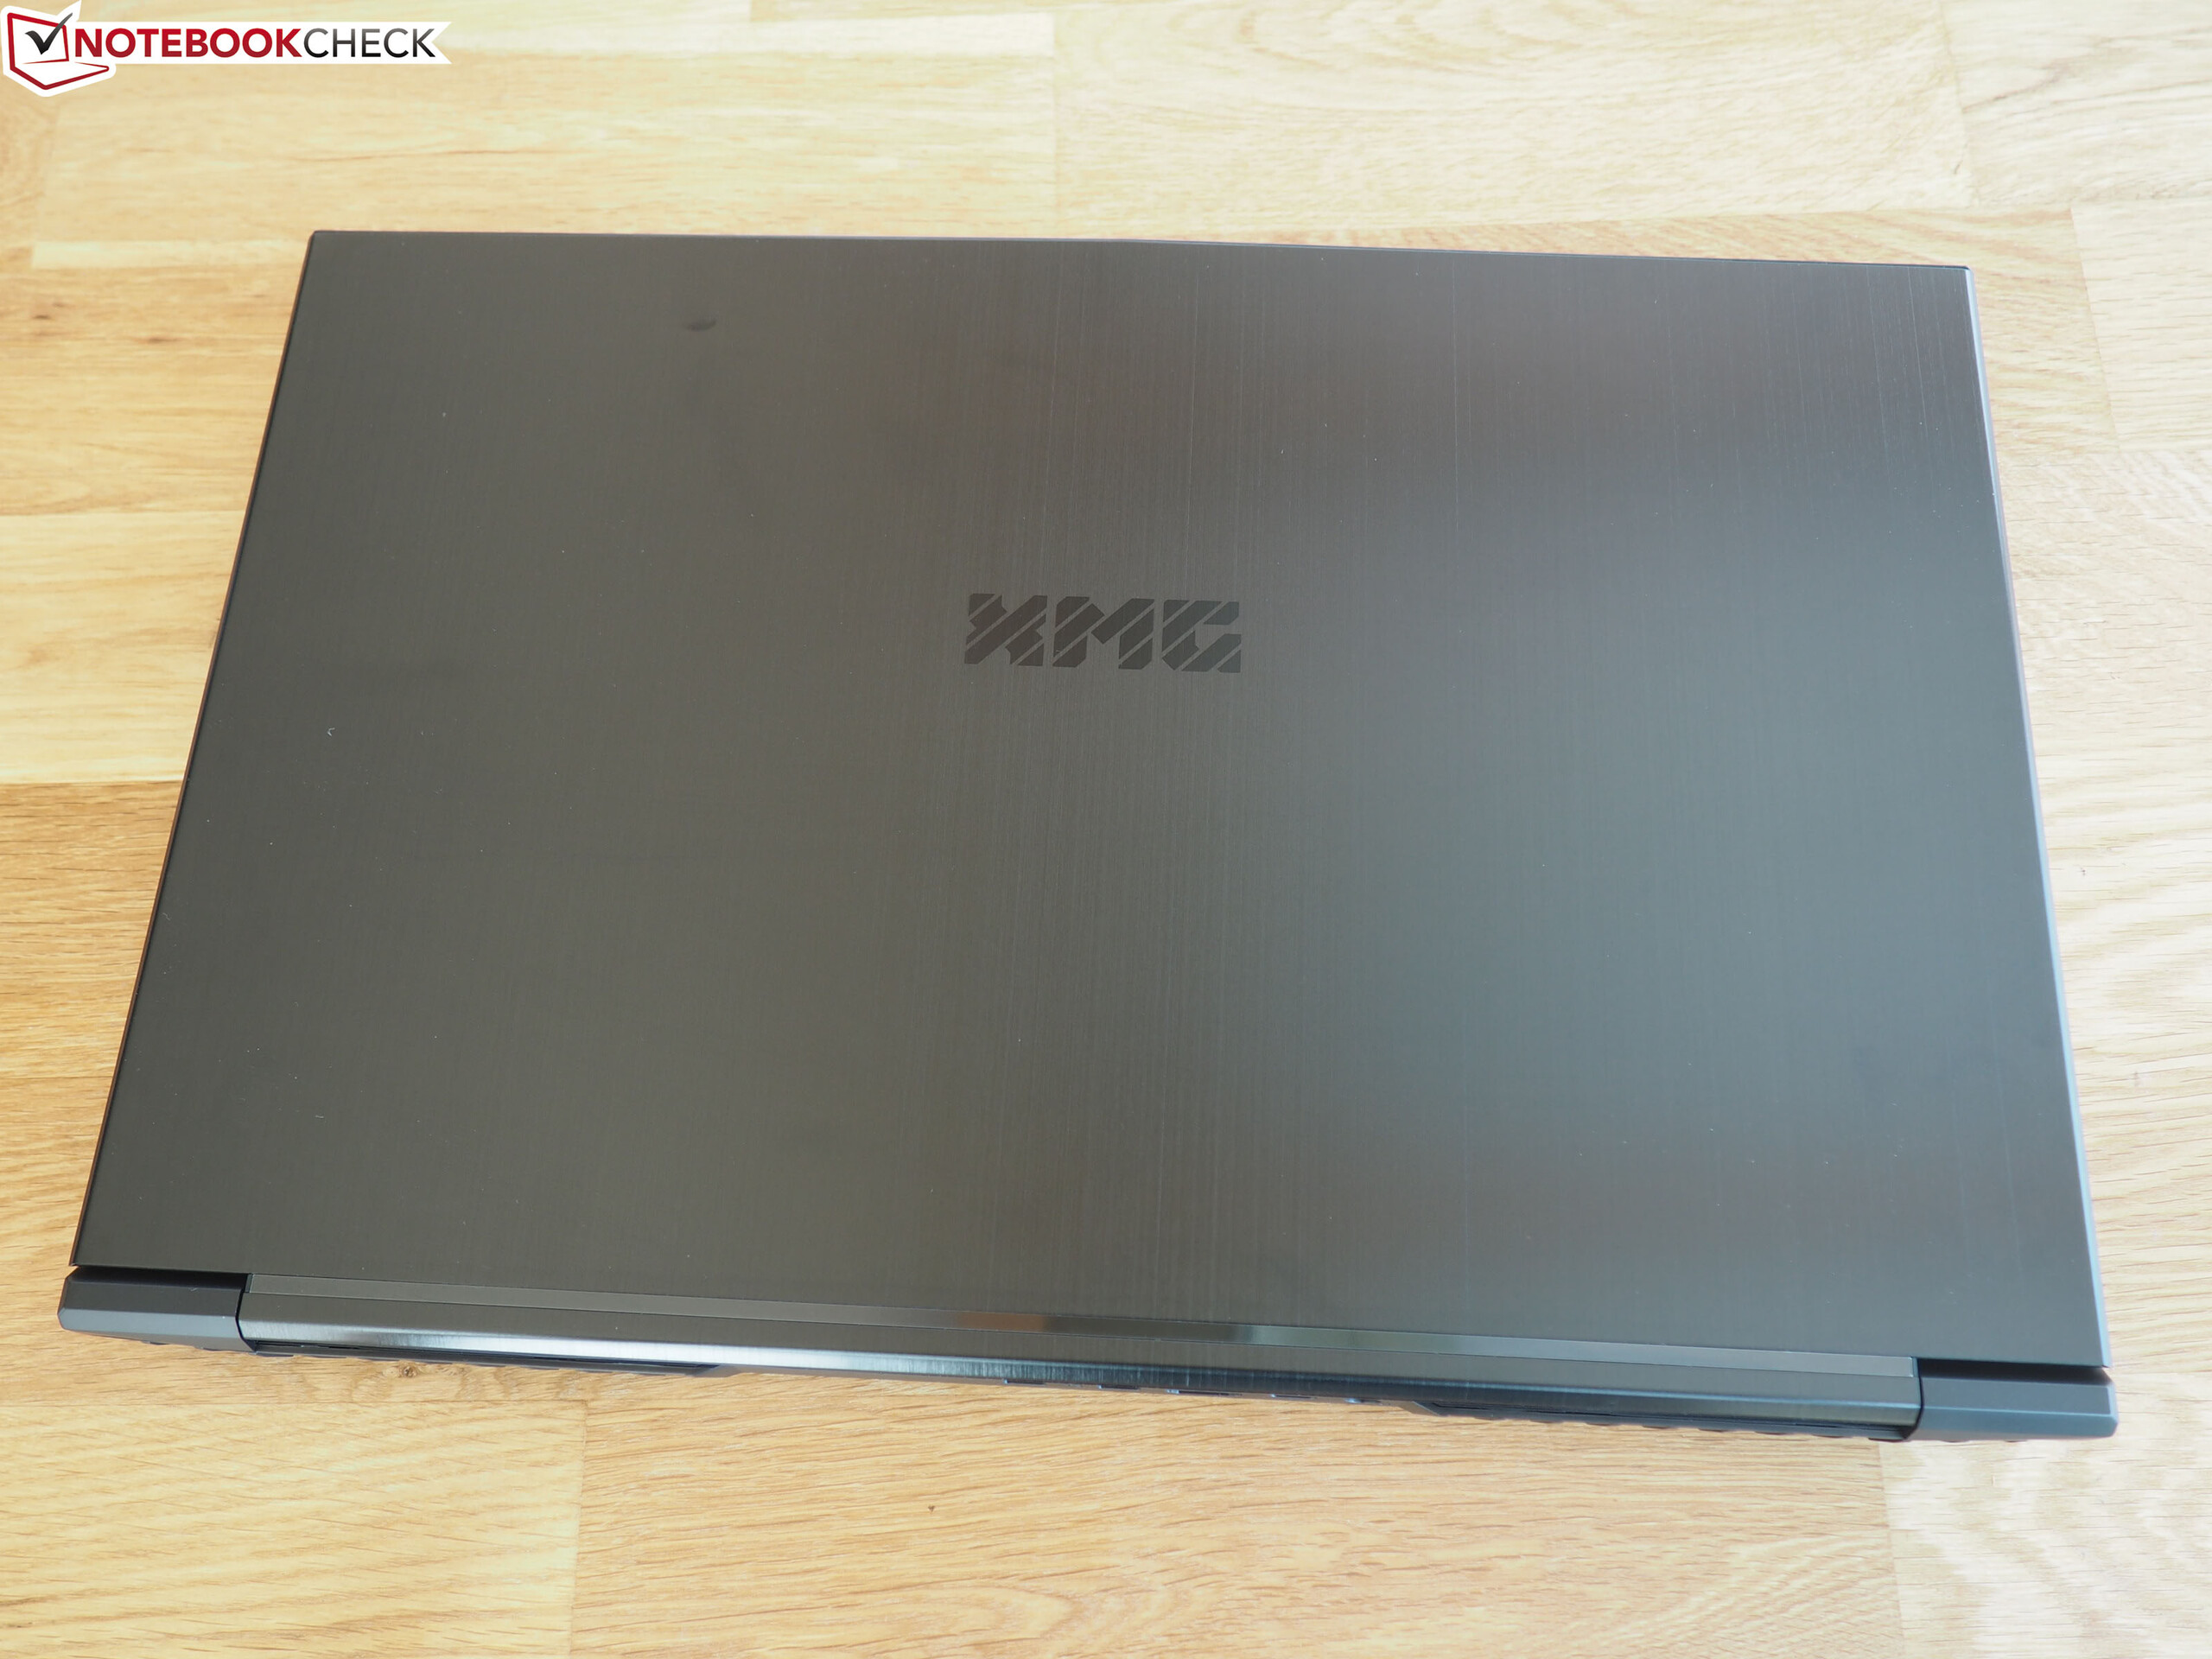
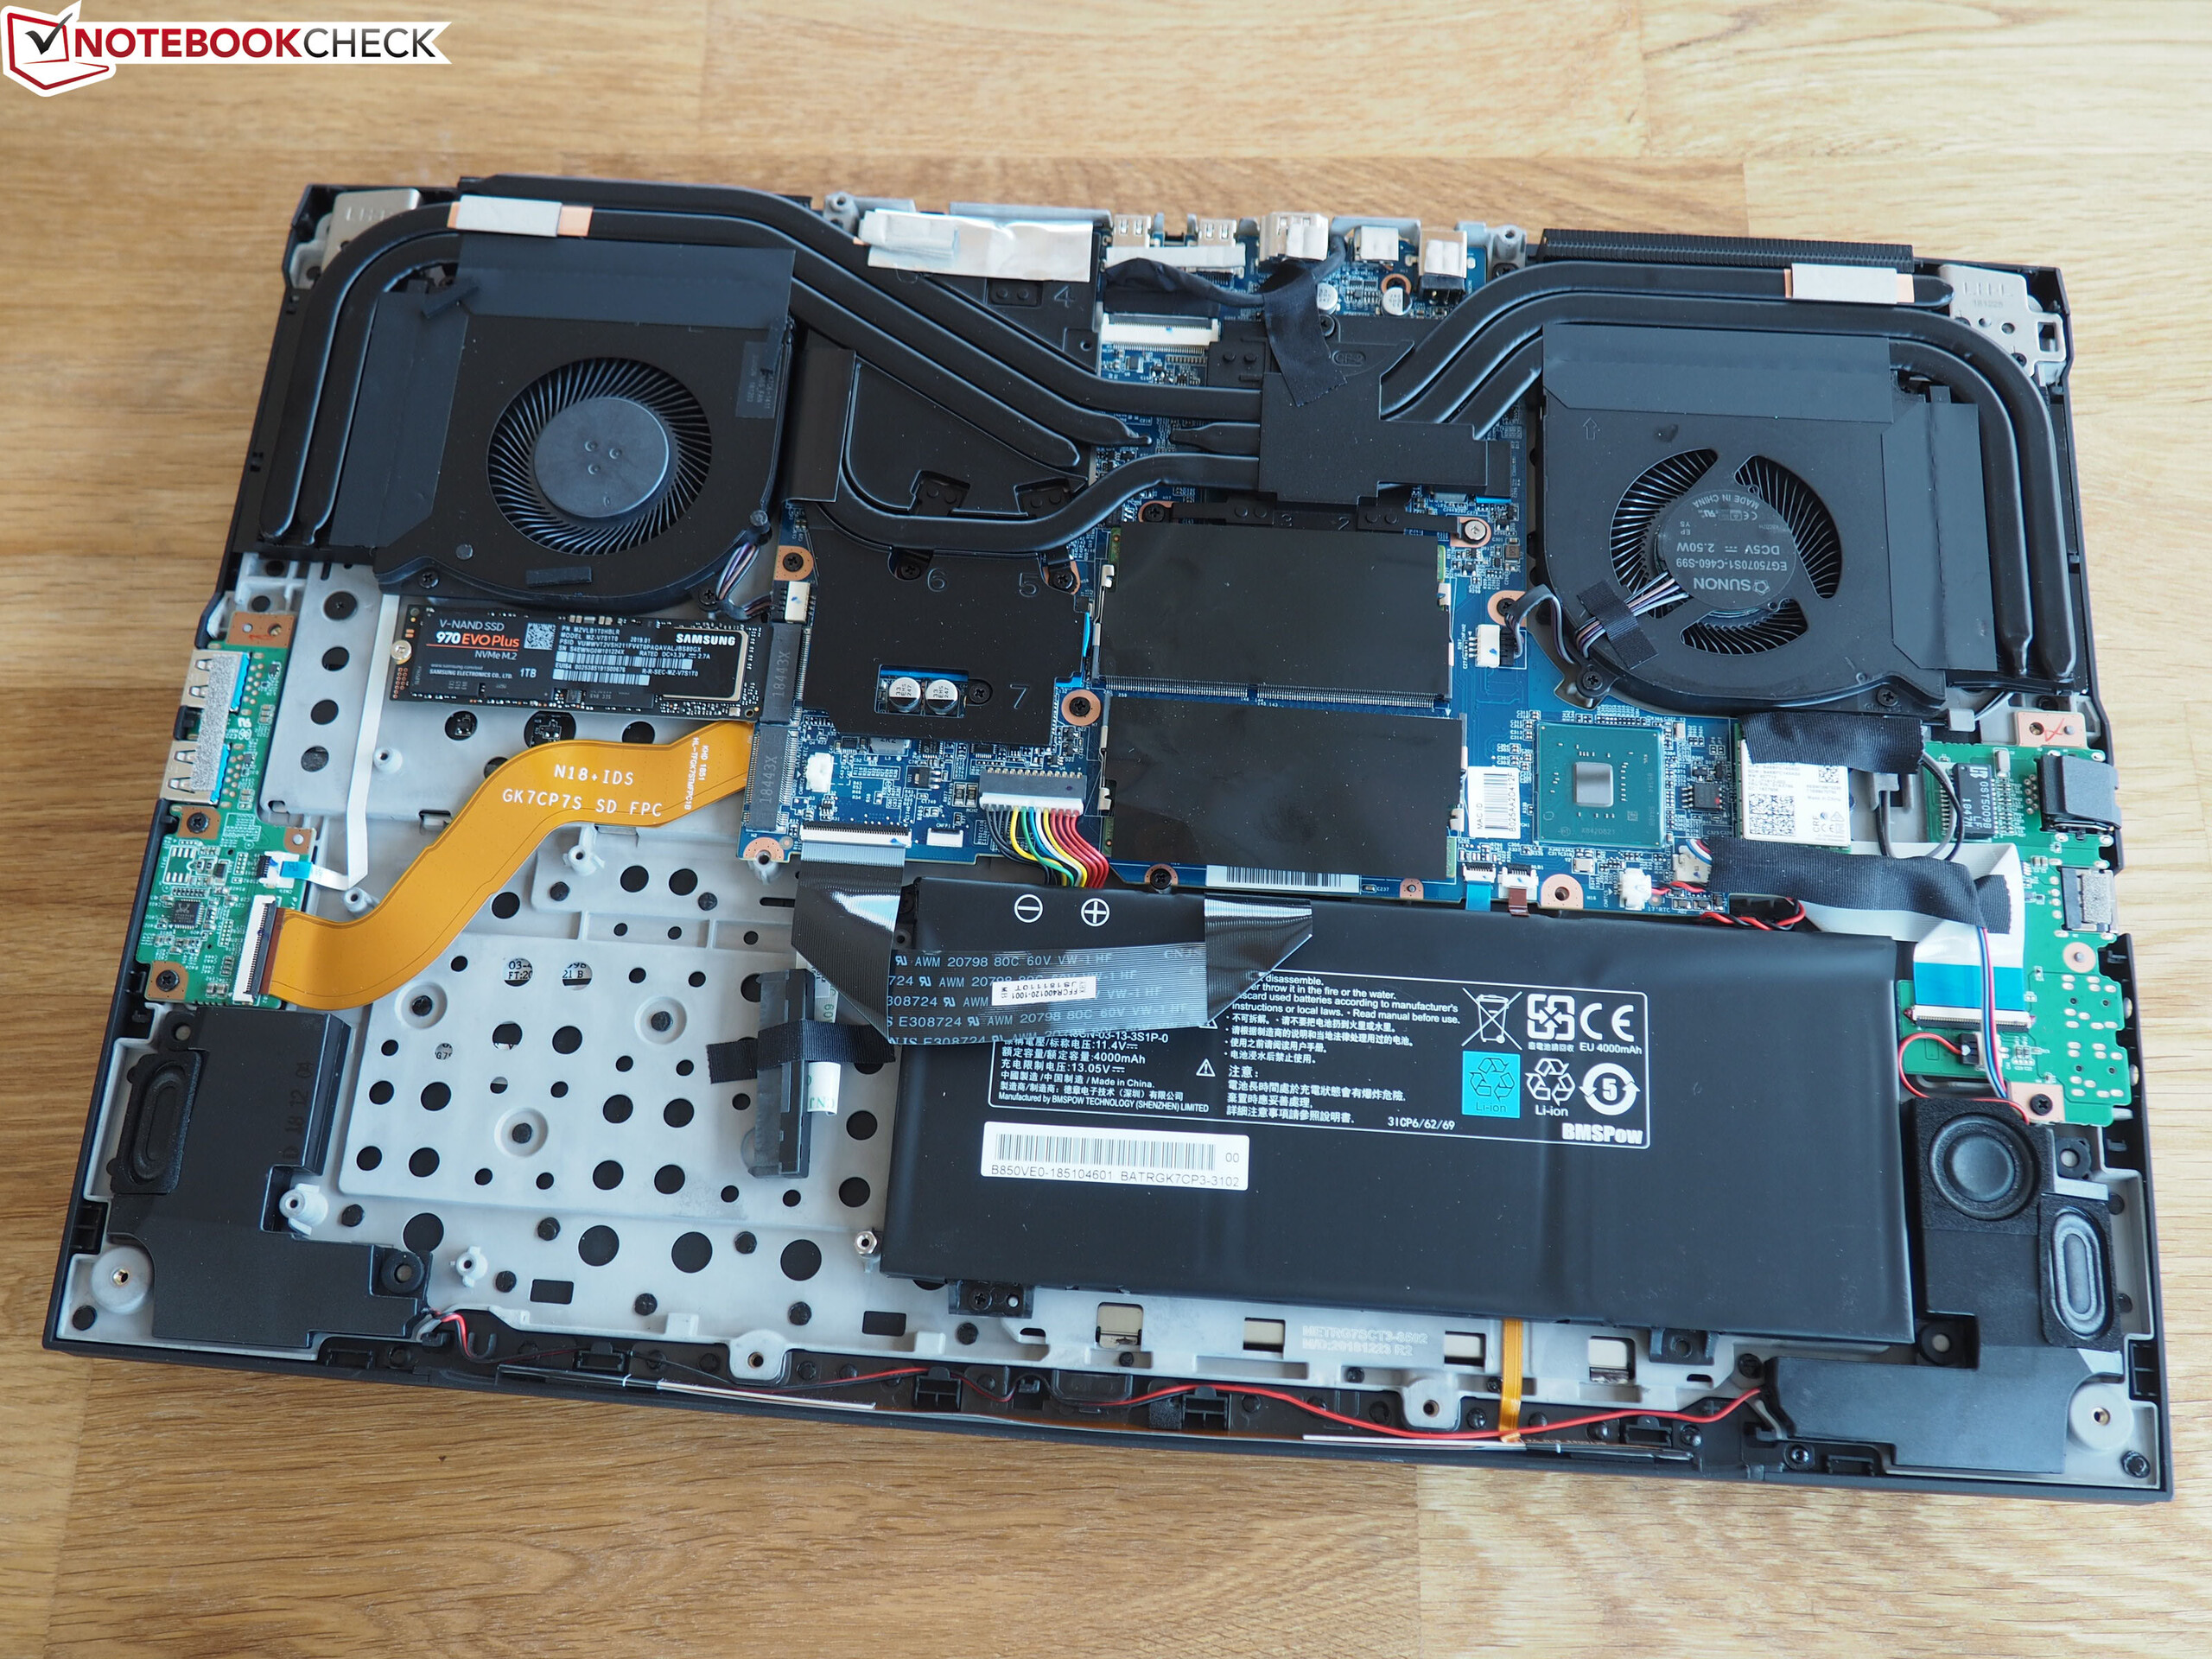
Além disso, o Neo 17 é quase livremente configurável e vem com uma tonelada de acessórios, o sempre são bem-vindos. A carcaça Tongfang Barebones é comparativamente compacta e leve também, embora seja bastante grossa.
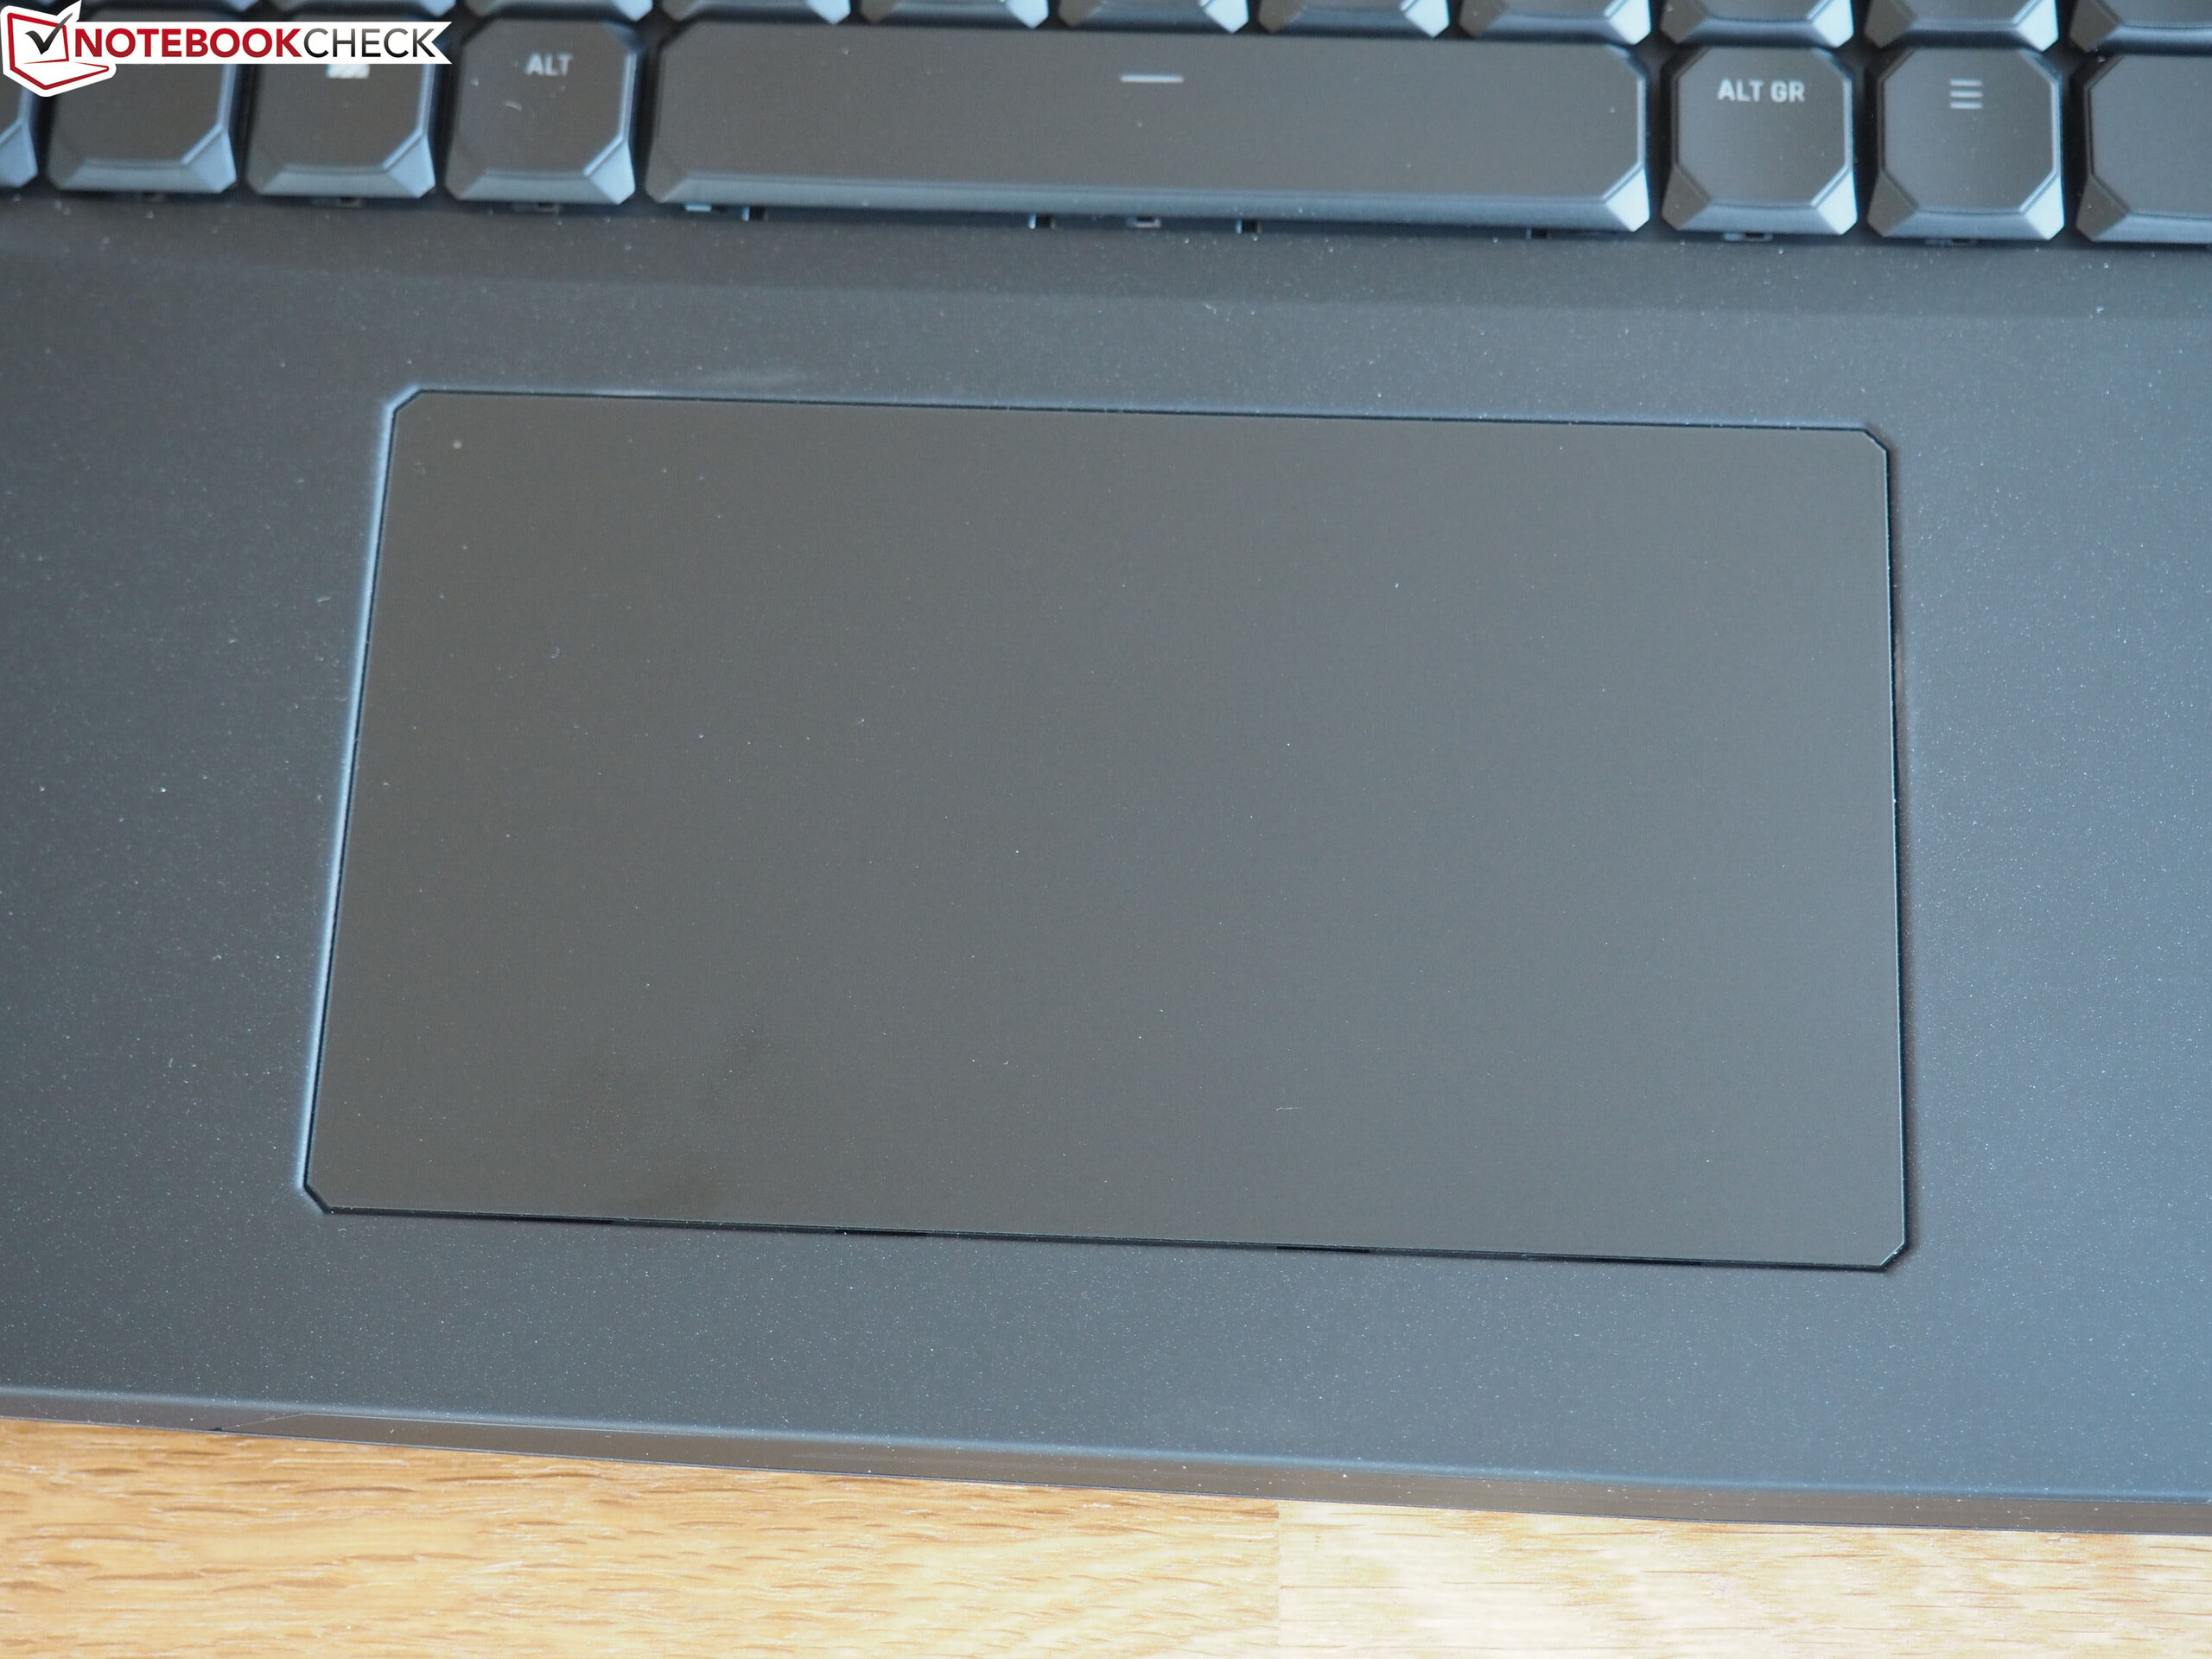
No entanto, Schenker precisaria abordar várias áreas para alcançar as melhores pontuações. Em primeiro lugar, o sucessor do Neo 17 precisaria de pelo menos a opção para uma bateria maior, juntamente com um melhor trackpad e alto-falantes. Além disso, a empresa precisaria reposicionar a placa Wi-Fi para aproveitar ao máximo seu potencial e ajustar o controle do ventilador para utilizar o turbo da CPU no modo de ventilador balanceado. No geral, essas deficiências não impedem que o XMG Neo 17 receba uma pontuação média decente, mas o impedem de ser o portátil de jogos de 17 polegadas para bater este ano.
Schenker XMG Neo 17
- 05/14/2020 v7 (old)
Florian Glaser
Price comparison