Breve Análise do Portátil MSI GE75 Raider 8SF (i7-8750H, RTX 2070)


| SD Card Reader | |
| average JPG Copy Test (av. of 3 runs) | |
| MSI GE73VR 7RF Raider (Toshiba Exceria Pro SDXC 64 GB UHS-II) | |
| MSI GT75 8RG-090 Titan (Toshiba Exceria Pro SDXC 64 GB UHS-II) | |
| Asus ROG Strix Scar II GL704GW (Toshiba Exceria Pro SDXC 64 GB UHS-II) | |
| MSI GE75 8SF (Toshiba Exceria Pro SDXC 64 GB UHS-II) | |
| maximum AS SSD Seq Read Test (1GB) | |
| MSI GE73VR 7RF Raider (Toshiba Exceria Pro SDXC 64 GB UHS-II) | |
| MSI GT75 8RG-090 Titan (Toshiba Exceria Pro SDXC 64 GB UHS-II) | |
| Asus ROG Strix Scar II GL704GW (Toshiba Exceria Pro SDXC 64 GB UHS-II) | |
| MSI GE75 8SF (Toshiba Exceria Pro SDXC 64 GB UHS-II) | |
| Networking | |
| iperf3 transmit AX12 | |
| MSI GE75 8SF | |
| Asus Zephyrus S GX701GX | |
| Lenovo Legion Y740-17ICH | |
| Asus ROG Strix Scar II GL704GW | |
| iperf3 receive AX12 | |
| Asus Zephyrus S GX701GX | |
| MSI GE75 8SF | |
| Lenovo Legion Y740-17ICH | |
| Asus ROG Strix Scar II GL704GW | |
| |||||||||||||||||||||||||
iluminação: 89 %
iluminação com acumulador: 370.4 cd/m²
Contraste: 1277:1 (Preto: 0.29 cd/m²)
ΔE ColorChecker Calman: 1.26 | ∀{0.5-29.43 Ø4.71}
calibrated: 1.21
ΔE Greyscale Calman: 1.4 | ∀{0.09-98 Ø4.96}
94.4% sRGB (Argyll 1.6.3 3D)
59.7% AdobeRGB 1998 (Argyll 1.6.3 3D)
65.2% AdobeRGB 1998 (Argyll 3D)
94.4% sRGB (Argyll 3D)
63.1% Display P3 (Argyll 3D)
Gamma: 2.2
CCT: 6747 K
| MSI GE75 8SF Chi Mei N173HCE-G33, IPS, 17.3", 1920x1080 | Lenovo Legion Y740-17ICH AU Optronics B173HAN03.2, IPS, 17.3", 1920x1080 | Asus Zephyrus S GX701GX B173HAN04.0 (AUO409D), IPS, 17.3", 1920x1080 | Asus ROG Strix Scar II GL704GW B173HAN04.0 (AUO409D), AHVA, 17.3", 1920x1080 | MSI GE73 8RF-008 Raider RGB Chi Mei N173HHE-G32 (CMN1747), TN WLED, 17.3", 1920x1080 | MSI GT75 8RG-090 Titan CMN N173HHE-G32 (CMN1747), TN, 17.3", 1920x1080 | |
|---|---|---|---|---|---|---|
| Display | -1% | -3% | -3% | 27% | 27% | |
| Display P3 Coverage (%) | 63.1 | 64 1% | 62.9 0% | 62.9 0% | 90.8 44% | 90.9 44% |
| sRGB Coverage (%) | 94.4 | 90.4 -4% | 87.8 -7% | 87.1 -8% | 99.9 6% | 100 6% |
| AdobeRGB 1998 Coverage (%) | 65.2 | 64.8 -1% | 63.9 -2% | 63.7 -2% | 85.8 32% | 86.2 32% |
| Response Times | -43% | 17% | -46% | -112% | 32% | |
| Response Time Grey 50% / Grey 80% * (ms) | 9.6 ? | 15.6 ? -63% | 7.2 ? 25% | 17.6 ? -83% | 28 ? -192% | 8 ? 17% |
| Response Time Black / White * (ms) | 10.4 ? | 12.8 ? -23% | 9.6 ? 8% | 11.2 ? -8% | 13.6 ? -31% | 5.6 ? 46% |
| PWM Frequency (Hz) | 25770 ? | 25000 ? | 26000 ? | |||
| Screen | -107% | -23% | -42% | -46% | -19% | |
| Brightness middle (cd/m²) | 370.4 | 299.1 -19% | 288 -22% | 295 -20% | 273 -26% | 240 -35% |
| Brightness (cd/m²) | 348 | 273 -22% | 287 -18% | 291 -16% | 273 -22% | 248 -29% |
| Brightness Distribution (%) | 89 | 81 -9% | 91 2% | 96 8% | 90 1% | 83 -7% |
| Black Level * (cd/m²) | 0.29 | 0.27 7% | 0.2 31% | 0.24 17% | 0.26 10% | 0.22 24% |
| Contrast (:1) | 1277 | 1108 -13% | 1440 13% | 1229 -4% | 1050 -18% | 1091 -15% |
| Colorchecker dE 2000 * | 1.26 | 5.07 -302% | 2.33 -85% | 3.2 -154% | 3.52 -179% | 2.14 -70% |
| Colorchecker dE 2000 max. * | 3.02 | 10.55 -249% | 5.34 -77% | 6.64 -120% | 6.34 -110% | 5.04 -67% |
| Colorchecker dE 2000 calibrated * | 1.21 | 3.31 -174% | 2.47 -104% | 2.52 -108% | 2.09 -73% | 1.54 -27% |
| Greyscale dE 2000 * | 1.4 | 6.8 -386% | 1.19 15% | 2.16 -54% | 3.11 -122% | 1.62 -16% |
| Gamma | 2.2 100% | 2.46 89% | 2.41 91% | 2.46 89% | 2.43 91% | 2.28 96% |
| CCT | 6747 96% | 7805 83% | 6710 97% | 6872 95% | 6999 93% | 6846 95% |
| Color Space (Percent of AdobeRGB 1998) (%) | 59.7 | 58.5 -2% | 57 -5% | 57 -5% | 76 27% | 77 29% |
| Color Space (Percent of sRGB) (%) | 94.4 | 89.9 -5% | 88 -7% | 87 -8% | 100 6% | 100 6% |
| Média Total (Programa/Configurações) | -50% /
-79% | -3% /
-15% | -30% /
-35% | -44% /
-40% | 13% /
-4% |
* ... menor é melhor
Exibir tempos de resposta
| ↔ Tempo de resposta preto para branco | ||
|---|---|---|
| 10.4 ms ... ascensão ↗ e queda ↘ combinadas | ↗ 5.2 ms ascensão | 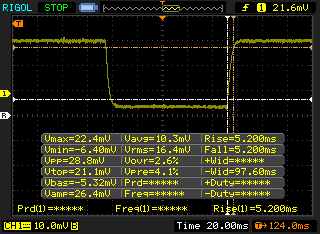 |
| ↘ 5.2 ms queda | ||
| A tela mostra boas taxas de resposta em nossos testes, mas pode ser muito lenta para jogadores competitivos. Em comparação, todos os dispositivos testados variam de 0.1 (mínimo) a 240 (máximo) ms. » 28 % de todos os dispositivos são melhores. Isso significa que o tempo de resposta medido é melhor que a média de todos os dispositivos testados (19.8 ms). | ||
| ↔ Tempo de resposta 50% cinza a 80% cinza | ||
| 9.6 ms ... ascensão ↗ e queda ↘ combinadas | ↗ 5.2 ms ascensão | 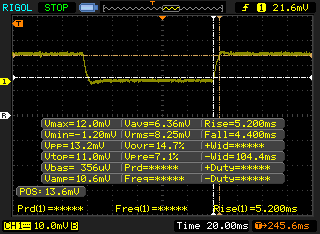 |
| ↘ 4.4 ms queda | ||
| A tela mostra taxas de resposta rápidas em nossos testes e deve ser adequada para jogos. Em comparação, todos os dispositivos testados variam de 0.165 (mínimo) a 636 (máximo) ms. » 23 % de todos os dispositivos são melhores. Isso significa que o tempo de resposta medido é melhor que a média de todos os dispositivos testados (31 ms). | ||
Cintilação da tela / PWM (modulação por largura de pulso)
| Tela tremeluzindo/PWM detectado | 25770 Hz | ≤ 17 % configuração de brilho | 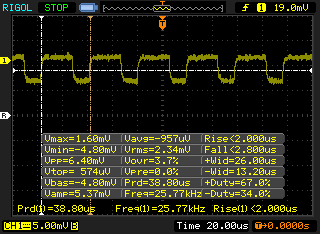 |
A luz de fundo da tela pisca em 25770 Hz (pior caso, por exemplo, utilizando PWM) Cintilação detectada em uma configuração de brilho de 17 % e abaixo. Não deve haver cintilação ou PWM acima desta configuração de brilho. A frequência de 25770 Hz é bastante alta, então a maioria dos usuários sensíveis ao PWM não deve notar nenhuma oscilação. [pwm_comparison] Em comparação: 52 % de todos os dispositivos testados não usam PWM para escurecer a tela. Se PWM foi detectado, uma média de 7757 (mínimo: 5 - máximo: 343500) Hz foi medida. | |||
| PCMark 8 Home Score Accelerated v2 | 3662 pontos | |
| PCMark 8 Work Score Accelerated v2 | 5338 pontos | |
| PCMark 10 Score | 5138 pontos | |
Ajuda | ||
| MSI GE75 8SF Kingston RBUSNS8154P3256GJ1 | Lenovo Legion Y740-17ICH Samsung SSD PM981 MZVLB256HAHQ | Asus Zephyrus S GX701GX Samsung SSD PM981 MZVLB1T0HALR | Asus ROG Strix Scar II GL704GW Intel SSD 660p SSDPEKNW512G8 | MSI GE73 8RF-008 Raider RGB Toshiba HG6 THNSNJ256G8NY | MSI GT75 8RG-090 Titan 2x Samsung PM961 MZVLW256HEHP (RAID 0) | |
|---|---|---|---|---|---|---|
| AS SSD | 51% | 103% | 20% | -53% | 95% | |
| Seq Read (MB/s) | 949 | 1153 21% | 911 -4% | 1315 39% | 511 -46% | 3058 222% |
| Seq Write (MB/s) | 823 | 1328 61% | 2347 185% | 927 13% | 425.7 -48% | 2196 167% |
| 4K Read (MB/s) | 25.36 | 35.05 38% | 53 109% | 52.4 107% | 14.07 -45% | 38.37 51% |
| 4K Write (MB/s) | 67.1 | 96 43% | 122.5 83% | 122.8 83% | 38.34 -43% | 97.7 46% |
| 4K-64 Read (MB/s) | 748 | 727 -3% | 1577 111% | 326.5 -56% | 351.4 -53% | 1347 80% |
| 4K-64 Write (MB/s) | 650 | 1212 86% | 1734 167% | 727 12% | 172.7 -73% | 1236 90% |
| Access Time Read * (ms) | 0.173 | 0.063 64% | 0.08 54% | 0.11 36% | 0.235 -36% | 0.056 68% |
| Access Time Write * (ms) | 0.059 | 0.04 32% | 0.031 47% | 0.045 24% | 0.097 -64% | 0.038 36% |
| Score Read (Points) | 869 | 878 1% | 1721 98% | 510 -41% | 417 -52% | 1691 95% |
| Score Write (Points) | 799 | 1441 80% | 2091 162% | 942 18% | 254 -68% | 1553 94% |
| Score Total (Points) | 2109 | 2784 32% | 4771 126% | 1715 -19% | 881 -58% | 4066 93% |
| Copy ISO MB/s (MB/s) | 1121 | 1487 33% | 412.5 -63% | |||
| Copy Program MB/s (MB/s) | 532 | 608 14% | 192.9 -64% | |||
| Copy Game MB/s (MB/s) | 380.5 | 1162 205% | 295.5 -22% |
* ... menor é melhor

| 3DMark 11 Performance | 17817 pontos | |
| 3DMark Cloud Gate Standard Score | 25784 pontos | |
| 3DMark Fire Strike Score | 16541 pontos | |
| 3DMark Time Spy Score | 7061 pontos | |
Ajuda | ||
| baixo | média | alto | ultra | |
|---|---|---|---|---|
| BioShock Infinite (2013) | 231 | 208.9 | 193.1 | 136.9 |
| The Witcher 3 (2015) | 193.9 | 154 | 115.7 | 70.9 |
| Rise of the Tomb Raider (2016) | 120 | 111.3 | 92.2 | 89.4 |
| MSI GE75 8SF GeForce RTX 2070 Mobile, i7-8750H, Kingston RBUSNS8154P3256GJ1 | Lenovo Legion Y740-17ICH GeForce RTX 2080 Max-Q, i7-8750H, Samsung SSD PM981 MZVLB256HAHQ | Asus Zephyrus S GX701GX GeForce RTX 2080 Max-Q, i7-8750H, Samsung SSD PM981 MZVLB1T0HALR | Asus ROG Strix Scar II GL704GW GeForce RTX 2070 Mobile, i7-8750H, Intel SSD 660p SSDPEKNW512G8 | MSI GE73 8RF-008 Raider RGB GeForce GTX 1070 Mobile, i7-8750H, Toshiba HG6 THNSNJ256G8NY | MSI GT75 8RG-090 Titan GeForce GTX 1080 Mobile, i9-8950HK, 2x Samsung PM961 MZVLW256HEHP (RAID 0) | |
|---|---|---|---|---|---|---|
| Noise | 10% | 1% | -2% | 0% | -6% | |
| desligado / ambiente * (dB) | 28.3 | 28.3 -0% | 29 -2% | 29 -2% | 30 -6% | 30 -6% |
| Idle Minimum * (dB) | 33.5 | 31.5 6% | 29 13% | 29 13% | 32 4% | 32 4% |
| Idle Average * (dB) | 33.6 | 31.6 6% | 32 5% | 32 5% | 33 2% | 34 -1% |
| Idle Maximum * (dB) | 35 | 31.6 10% | 33 6% | 40 -14% | 34 3% | 37 -6% |
| Load Average * (dB) | 38 | 32.3 15% | 47 -24% | 46 -21% | 41 -8% | 43 -13% |
| Witcher 3 ultra * (dB) | 50 | 43 14% | 49 2% | 51 -2% | 50 -0% | 57 -14% |
| Load Maximum * (dB) | 56.9 | 45.5 20% | 51 10% | 52 9% | 54 5% | 62 -9% |
* ... menor é melhor
Barulho
| Ocioso |
| 33.5 / 33.6 / 35 dB |
| Carga |
| 38 / 56.9 dB |
 | ||
30 dB silencioso 40 dB(A) audível 50 dB(A) ruidosamente alto |
||
min: | ||
(±) A temperatura máxima no lado superior é 41.2 °C / 106 F, em comparação com a média de 40.4 °C / 105 F , variando de 21.2 a 68.8 °C para a classe Gaming.
(-) A parte inferior aquece até um máximo de 46 °C / 115 F, em comparação com a média de 43.2 °C / 110 F
(+) Em uso inativo, a temperatura média para o lado superior é 24.6 °C / 76 F, em comparação com a média do dispositivo de 33.9 °C / ### class_avg_f### F.
(+) Jogando The Witcher 3, a temperatura média para o lado superior é 30.7 °C / 87 F, em comparação com a média do dispositivo de 33.9 °C / ## #class_avg_f### F.
(+) Os apoios para as mãos e o touchpad são mais frios que a temperatura da pele, com um máximo de 27.4 °C / 81.3 F e, portanto, são frios ao toque.
(±) A temperatura média da área do apoio para as mãos de dispositivos semelhantes foi 28.8 °C / 83.8 F (+1.4 °C / 2.5 F).
MSI GE75 8SF análise de áudio
(+) | os alto-falantes podem tocar relativamente alto (###valor### dB)
Graves 100 - 315Hz
(±) | graves reduzidos - em média 13.7% menor que a mediana
(+) | o baixo é linear (6.8% delta para a frequência anterior)
Médios 400 - 2.000 Hz
(±) | médios reduzidos - em média 5.1% menor que a mediana
(±) | a linearidade dos médios é média (7.4% delta para frequência anterior)
Altos 2 - 16 kHz
(+) | agudos equilibrados - apenas 3.3% longe da mediana
(+) | os máximos são lineares (6.4% delta da frequência anterior)
Geral 100 - 16.000 Hz
(±) | a linearidade do som geral é média (16.2% diferença em relação à mediana)
Comparado com a mesma classe
» 40% de todos os dispositivos testados nesta classe foram melhores, 7% semelhantes, 53% piores
» O melhor teve um delta de 6%, a média foi 18%, o pior foi 132%
Comparado com todos os dispositivos testados
» 26% de todos os dispositivos testados foram melhores, 6% semelhantes, 68% piores
» O melhor teve um delta de 4%, a média foi 23%, o pior foi 134%
Apple MacBook 12 (Early 2016) 1.1 GHz análise de áudio
(+) | os alto-falantes podem tocar relativamente alto (###valor### dB)
Graves 100 - 315Hz
(±) | graves reduzidos - em média 11.3% menor que a mediana
(±) | a linearidade dos graves é média (14.2% delta para a frequência anterior)
Médios 400 - 2.000 Hz
(+) | médios equilibrados - apenas 2.4% longe da mediana
(+) | médios são lineares (5.5% delta para frequência anterior)
Altos 2 - 16 kHz
(+) | agudos equilibrados - apenas 2% longe da mediana
(+) | os máximos são lineares (4.5% delta da frequência anterior)
Geral 100 - 16.000 Hz
(+) | o som geral é linear (10.2% diferença em relação à mediana)
Comparado com a mesma classe
» 7% de todos os dispositivos testados nesta classe foram melhores, 2% semelhantes, 90% piores
» O melhor teve um delta de 5%, a média foi 18%, o pior foi 53%
Comparado com todos os dispositivos testados
» 5% de todos os dispositivos testados foram melhores, 1% semelhantes, 94% piores
» O melhor teve um delta de 4%, a média foi 23%, o pior foi 134%
| desligado | |
| Ocioso | |
| Carga |
|
Key:
min: | |
| MSI GE75 8SF i7-8750H, GeForce RTX 2070 Mobile, Kingston RBUSNS8154P3256GJ1, IPS, 1920x1080, 17.3" | Lenovo Legion Y740-17ICH i7-8750H, GeForce RTX 2080 Max-Q, Samsung SSD PM981 MZVLB256HAHQ, IPS, 1920x1080, 17.3" | Asus ROG Strix Scar II GL704GW i7-8750H, GeForce RTX 2070 Mobile, Intel SSD 660p SSDPEKNW512G8, AHVA, 1920x1080, 17.3" | MSI GE73 8RF-008 Raider RGB i7-8750H, GeForce GTX 1070 Mobile, Toshiba HG6 THNSNJ256G8NY, TN WLED, 1920x1080, 17.3" | MSI GT75 8RG-090 Titan i9-8950HK, GeForce GTX 1080 Mobile, 2x Samsung PM961 MZVLW256HEHP (RAID 0), TN, 1920x1080, 17.3" | |
|---|---|---|---|---|---|
| Power Consumption | -2% | -7% | 2% | -62% | |
| Idle Minimum * (Watt) | 16.4 | 20.2 -23% | 19 -16% | 15 9% | 31 -89% |
| Idle Average * (Watt) | 21.9 | 27.2 -24% | 22 -0% | 20 9% | 35 -60% |
| Idle Maximum * (Watt) | 25.4 | 28.7 -13% | 29 -14% | 26 -2% | 45 -77% |
| Load Average * (Watt) | 90.7 | 90.8 -0% | 102 -12% | 97 -7% | 130 -43% |
| Witcher 3 ultra * (Watt) | 203.3 | 152.1 25% | 190 7% | 186 9% | 268 -32% |
| Load Maximum * (Watt) | 222.9 | 165.4 26% | 231 -4% | 239 -7% | 374 -68% |
* ... menor é melhor
| MSI GE75 8SF i7-8750H, GeForce RTX 2070 Mobile, 65 Wh | Lenovo Legion Y740-17ICH i7-8750H, GeForce RTX 2080 Max-Q, 76 Wh | Asus Zephyrus S GX701GX i7-8750H, GeForce RTX 2080 Max-Q, 76 Wh | Asus ROG Strix Scar II GL704GW i7-8750H, GeForce RTX 2070 Mobile, 66 Wh | MSI GE73 8RF-008 Raider RGB i7-8750H, GeForce GTX 1070 Mobile, 51 Wh | MSI GT75 8RG-090 Titan i9-8950HK, GeForce GTX 1080 Mobile, 75 Wh | |
|---|---|---|---|---|---|---|
| Duração da bateria | -9% | 9% | 11% | -11% | ||
| WiFi v1.3 (h) | 3.5 | 3.2 -9% | 3.8 9% | 3.9 11% | 3.1 -11% | |
| Reader / Idle (h) | 5 | 6.2 | 5.1 | 3.8 | ||
| Load (h) | 0.9 | 1.1 | 0.6 | 1.1 | ||
| Witcher 3 ultra (h) | 0.9 |
Pro
Contra

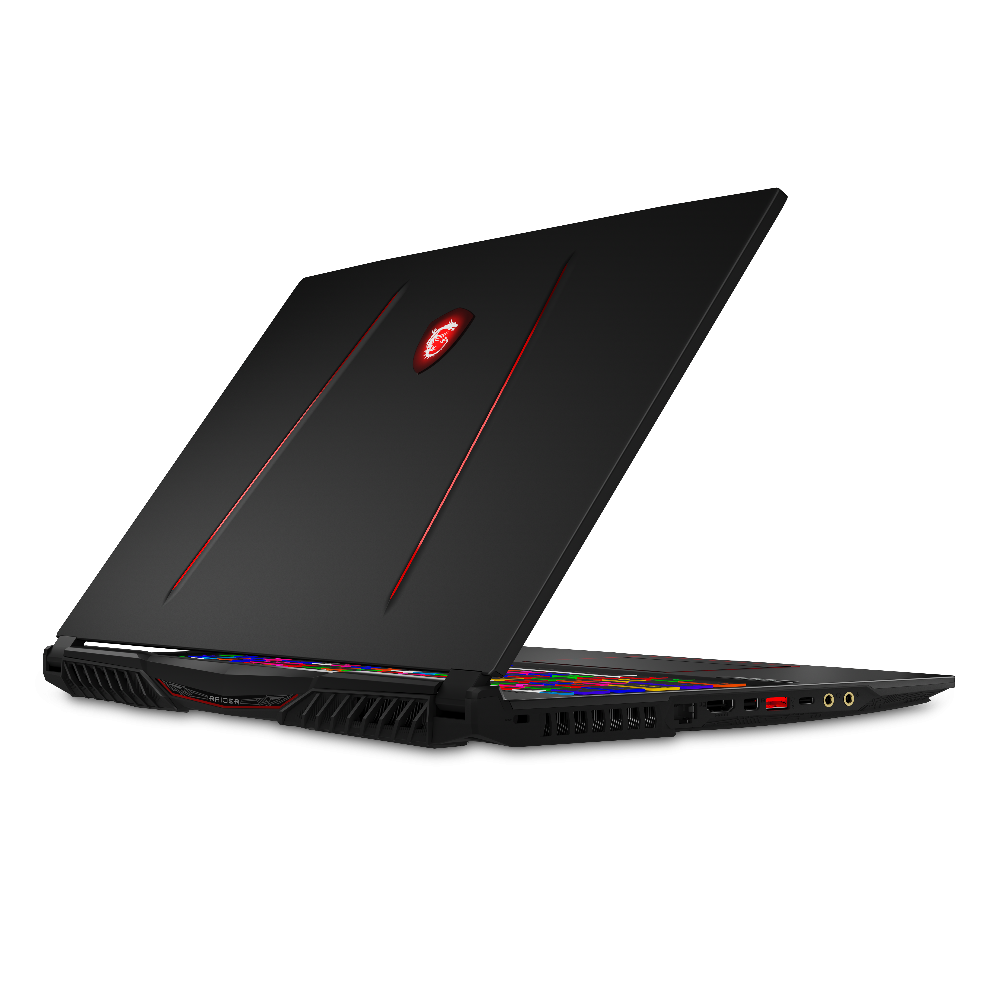
O GE75 é uma boa alternativa para o recém lançado GS75. É um pouco mais barato, um pouco mais grosso e um pouco mais rápido, pois não depende das GPUs Max-Q. Também faz com que o GE73 de última geração, pareça obsoleto, já que é 19 por cento menor e 10 por cento mais leve, sendo 35 por cento mais brilhante e até 35 por cento mais rápida. Os upgrades gen-to-gen são certamente tangíveis e estão longe de ser menores.
Ainda há alguns aspectos que esperamos que futuras revisões abordem. O ruído do ventilador não melhorou e a duração da bateria não é muito melhor. A facilidade de manutenção poderia ser mais direta e a falta do Thunderbolt 3 é indesculpável para uma faixa de preço de $2.000. O G-Sync também teria sido melhor para a série GE, em vez do Optimus para aproveitar mais a tela de 144 Hz.
O maior concorrente do GE75 no momento é a série Asus ROG GL704. Embora o sistema Asus seja mais fraco e não tenha iluminação RGB por tecla, achamos que ele tem o chassi mais rígido e os componentes mais úteis que o público gamer alvo apreciaria. Ainda é a ligação entre os dois.
Menor, mais leve e mais rápido. O GE75 é um amálgama da principal série GT e da super-fina série GS para dar o melhor dos dois mundos por um preço inicial mais barato. Existem alguns cantos recortados, como o leitor SD lento e a falta de Thunderbolt 3 e Ethernet de 10 Gbps, mas eles não prejudicam a experiência de jogo.
MSI GE75 8SF
- 10/03/2019 v7 (old)
Allen Ngo
Price comparison
