Breve Análise do Portátil Acer Aspire 5 A515-52G (i5-8265U, MX150, SSD, FHD)
| SD Card Reader | |
| average JPG Copy Test (av. of 3 runs) | |
| Média da turma Multimedia (23 - 531, n=41, últimos 2 anos) | |
| Lenovo IdeaPad 720-15IKB (Toshiba Exceria Pro SDXC 64 GB UHS-II) | |
| Acer Aspire 5 A515-51G-509A (Toshiba Exceria Pro M510 microSD) | |
| Acer Aspire 5 A515-52G-53PU (Toshiba Exceria Pro SDXC 64 GB UHS-II) | |
| Acer Aspire 5 A515-51G-51RL (Toshiba Exceria Pro SDXC 64 GB UHS-II) | |
| HP Pavilion 15-cw0003ng (Toshiba Exceria Pro SDXC 64 GB UHS-II) | |
| Asus VivoBook 15 X542UF-DM143T (Toshiba Exceria Pro SDXC 64 GB UHS-II) | |
| Dell G3 15 3579 (Toshiba Exceria Pro SDXC 64 GB UHS-II) | |
| maximum AS SSD Seq Read Test (1GB) | |
| Média da turma Multimedia (37.3 - 1455, n=40, últimos 2 anos) | |
| Lenovo IdeaPad 720-15IKB (Toshiba Exceria Pro SDXC 64 GB UHS-II) | |
| Acer Aspire 5 A515-51G-509A (Toshiba Exceria Pro M510 microSD) | |
| Acer Aspire 5 A515-51G-51RL (Toshiba Exceria Pro SDXC 64 GB UHS-II) | |
| Acer Aspire 5 A515-52G-53PU (Toshiba Exceria Pro SDXC 64 GB UHS-II) | |
| HP Pavilion 15-cw0003ng (Toshiba Exceria Pro SDXC 64 GB UHS-II) | |
| Asus VivoBook 15 X542UF-DM143T (Toshiba Exceria Pro SDXC 64 GB UHS-II) | |
| Dell G3 15 3579 (Toshiba Exceria Pro SDXC 64 GB UHS-II) | |
| Networking | |
| iperf3 transmit AX12 | |
| Acer Aspire 5 A515-52G-53PU | |
| Acer Aspire 5 A515-51G-509A | |
| Dell G3 15 3579 | |
| Acer Aspire 5 A515-51G-51RL | |
| Asus VivoBook 15 X542UF-DM143T | |
| HP Pavilion 15-cw0003ng | |
| Lenovo IdeaPad 720-15IKB | |
| iperf3 receive AX12 | |
| Acer Aspire 5 A515-52G-53PU | |
| Asus VivoBook 15 X542UF-DM143T | |
| Dell G3 15 3579 | |
| Acer Aspire 5 A515-51G-51RL | |
| Acer Aspire 5 A515-51G-509A | |
| HP Pavilion 15-cw0003ng | |
| Lenovo IdeaPad 720-15IKB | |
| |||||||||||||||||||||||||
iluminação: 81 %
iluminação com acumulador: 292 cd/m²
Contraste: 987:1 (Preto: 0.3 cd/m²)
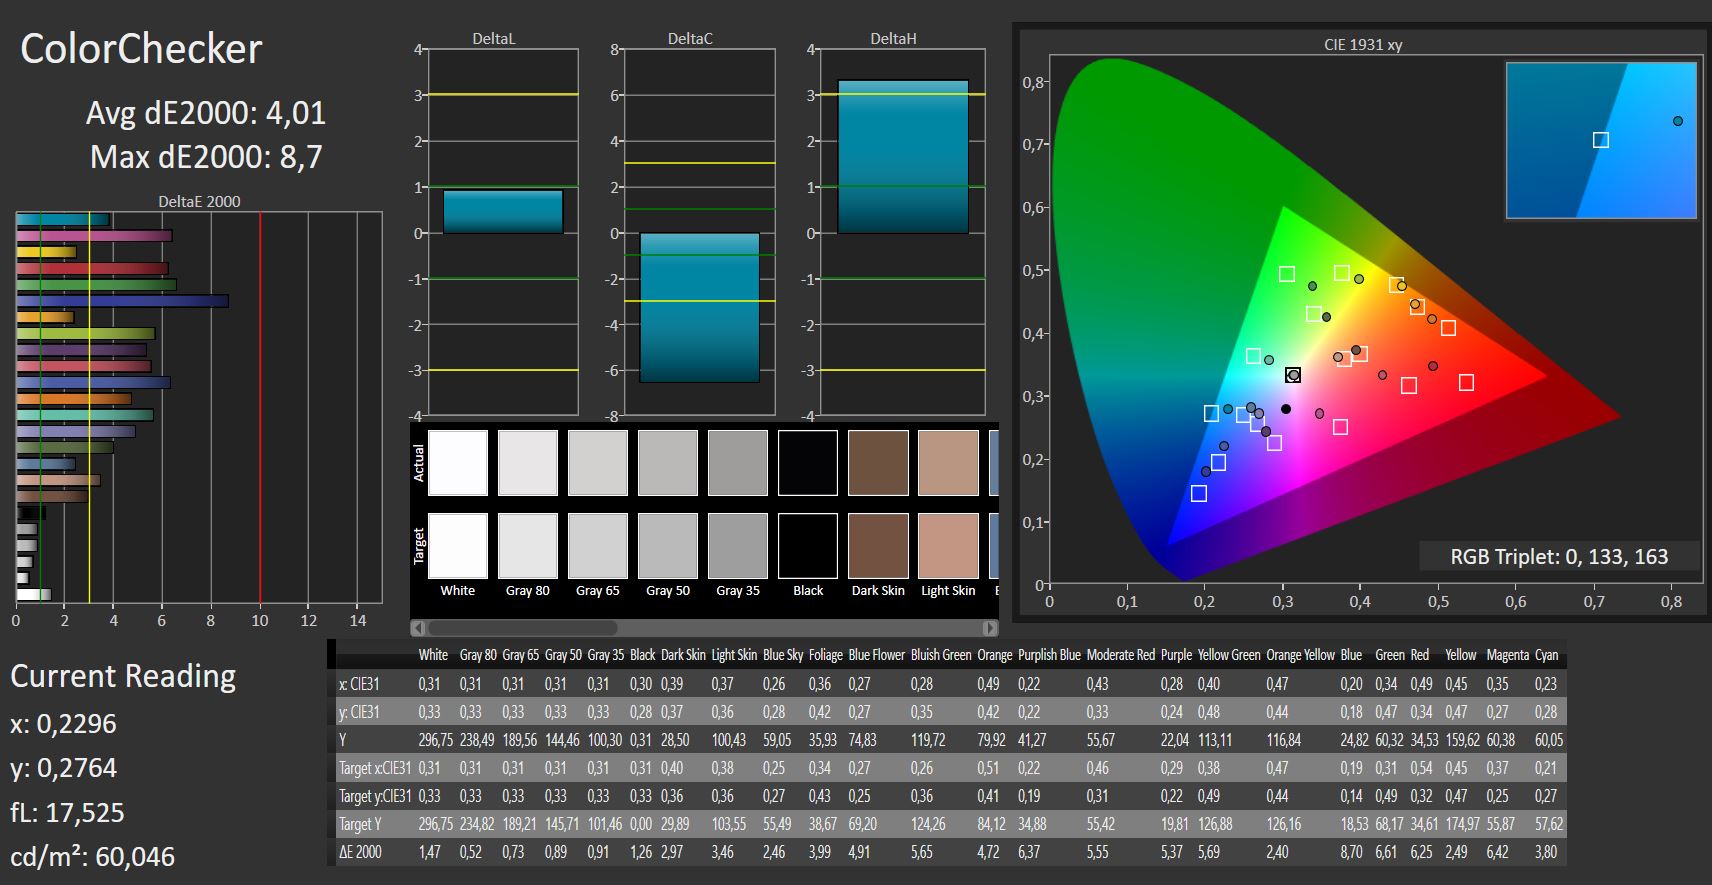
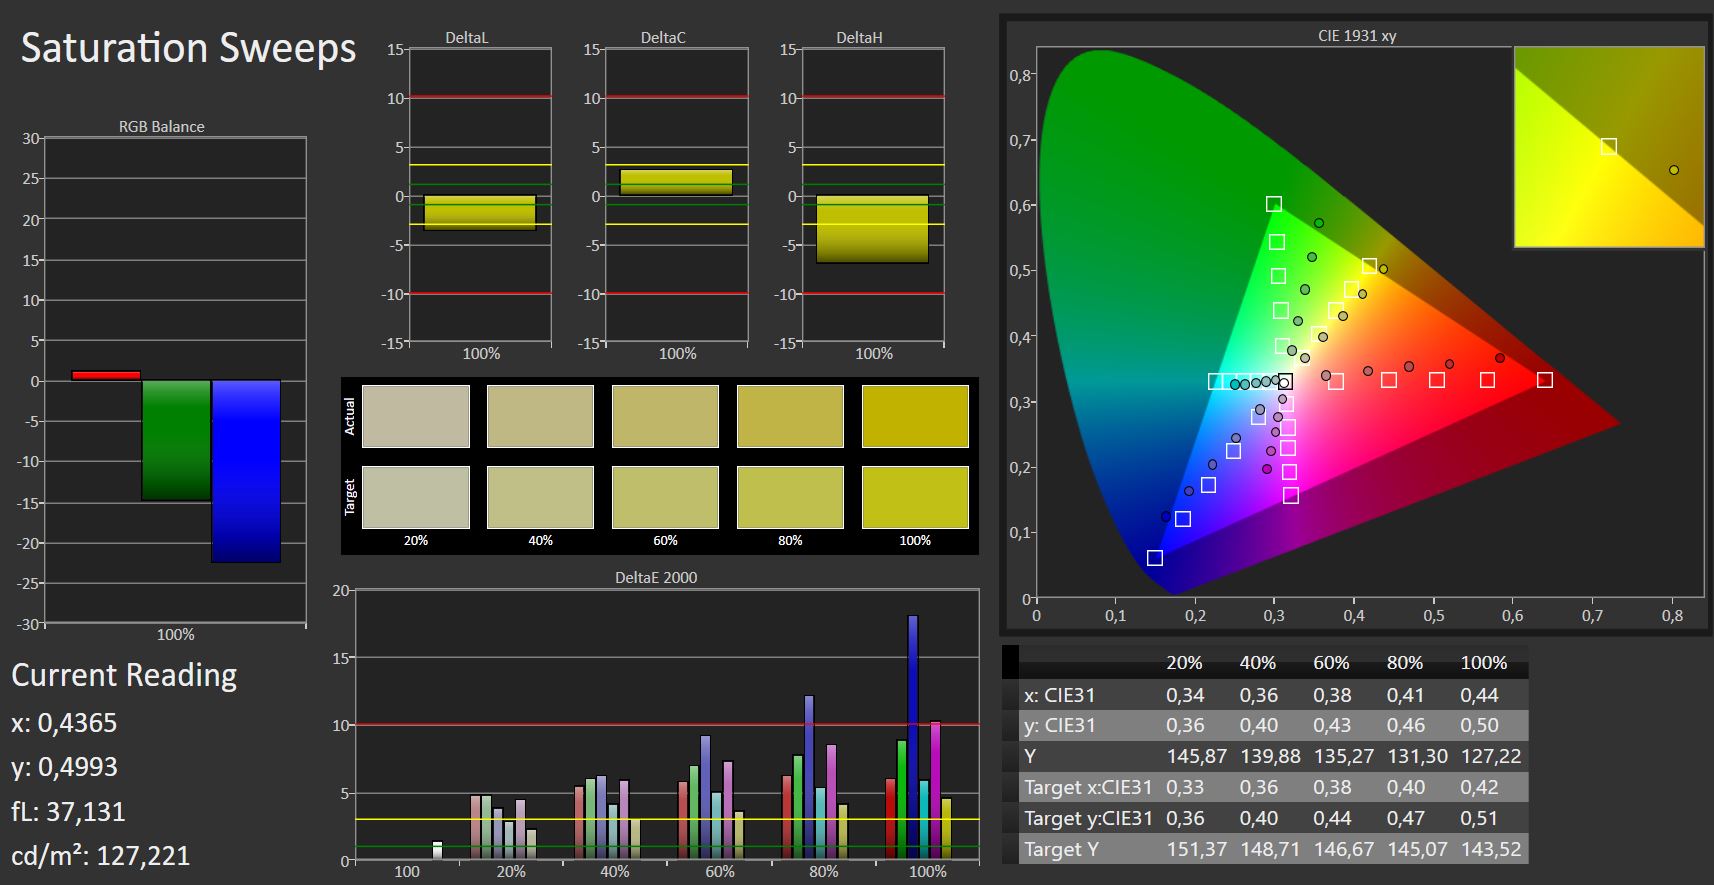
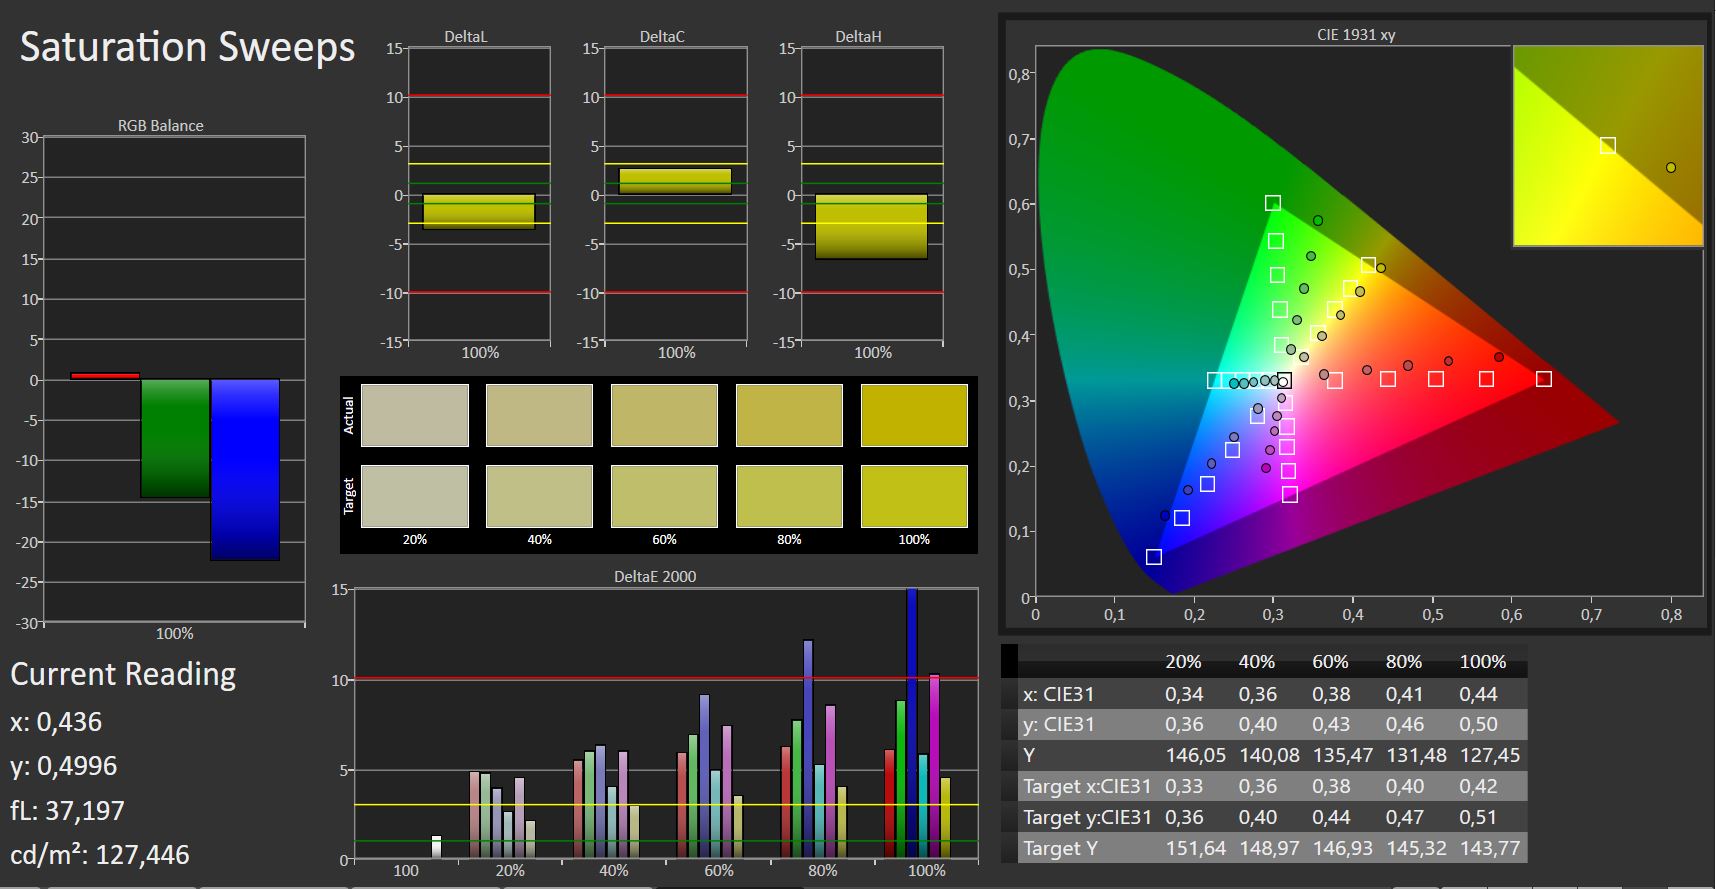
ΔE ColorChecker Calman: 4.01 | ∀{0.5-29.43 Ø4.72}
calibrated: 4
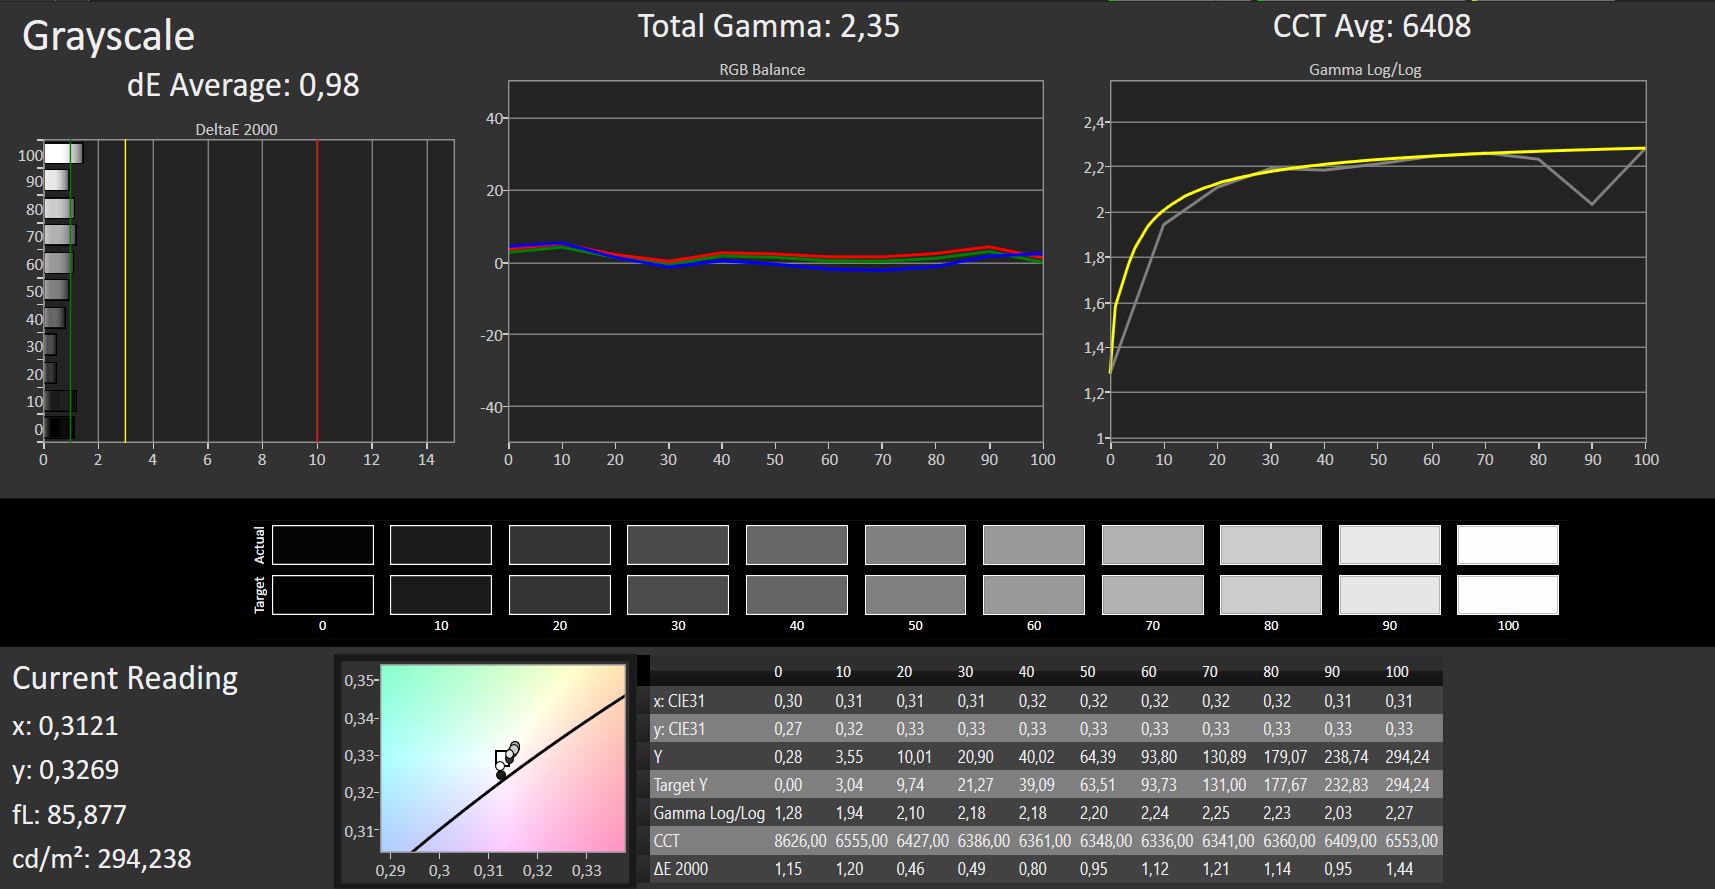
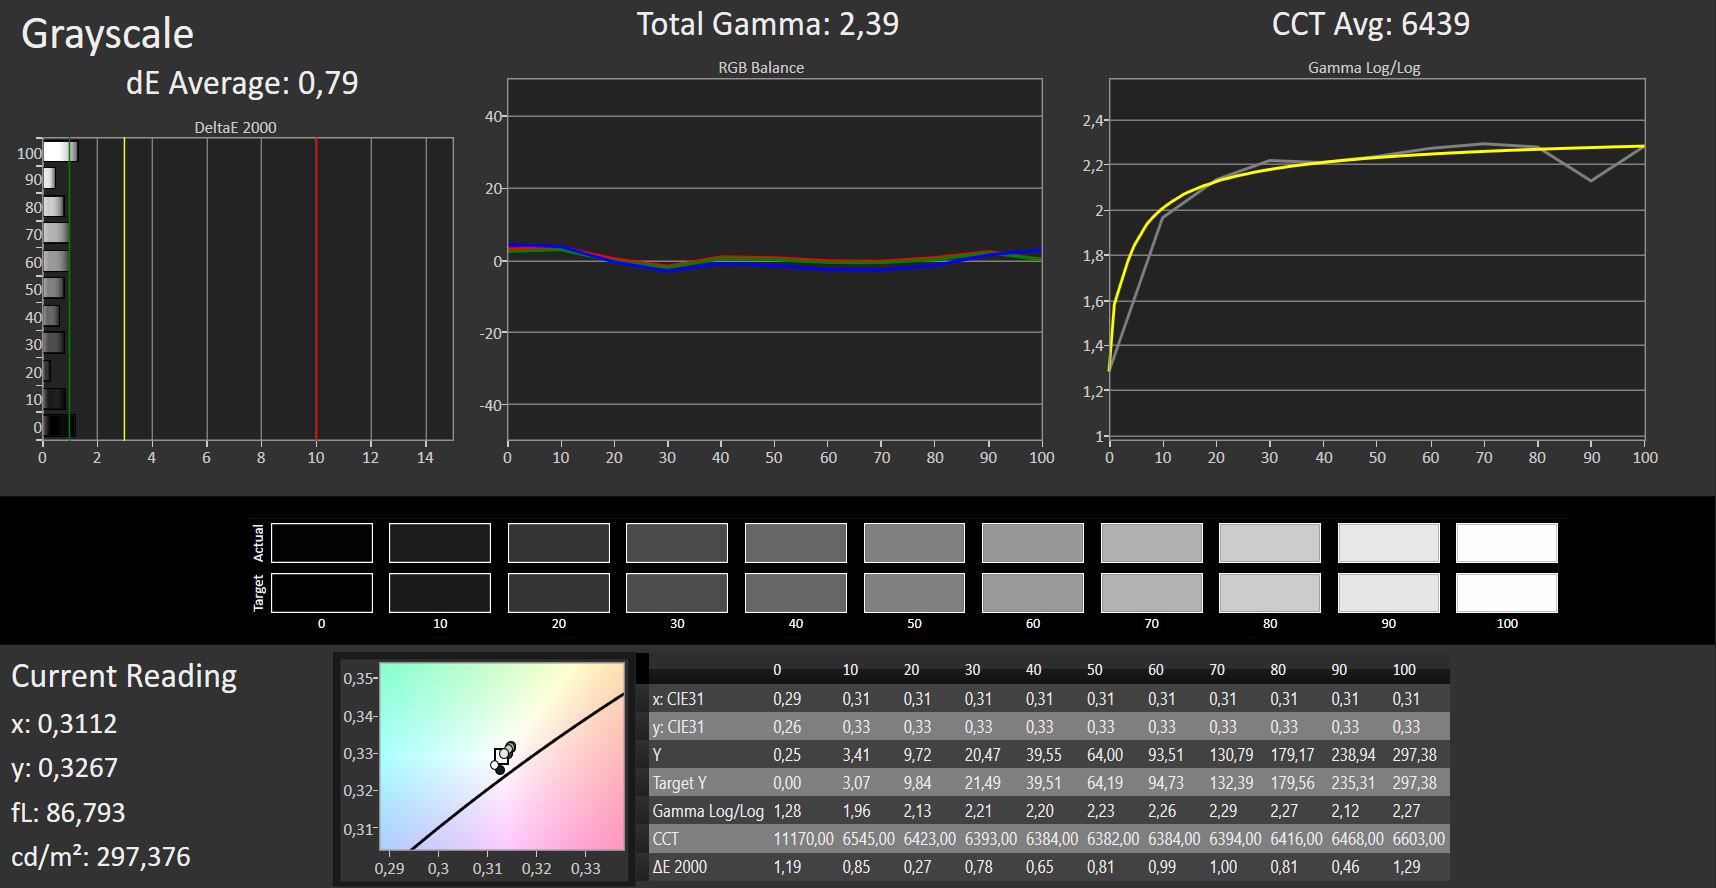
ΔE Greyscale Calman: 0.98 | ∀{0.09-98 Ø4.97}
58% sRGB (Argyll 1.6.3 3D)
38% AdobeRGB 1998 (Argyll 1.6.3 3D)
41.17% AdobeRGB 1998 (Argyll 3D)
58.7% sRGB (Argyll 3D)
39.85% Display P3 (Argyll 3D)
Gamma: 2.35
CCT: 6408 K
| Acer Aspire 5 A515-52G-53PU IPS, 1920x1080, 15.6" | Acer Aspire 5 A515-51G-509A TN, 1920x1080, 15.6" | Acer Aspire 5 A515-51G-51RL IPS, 1920x1080, 15.6" | HP Pavilion 15-cw0003ng IPS, 1920x1080, 15.6" | Lenovo IdeaPad 720-15IKB IPS, 1920x1080, 15.6" | Asus VivoBook 15 X542UF-DM143T TN LED, 1920x1080, 15.6" | Dell G3 15 3579 IPS, 1920x1080, 15.6" | |
|---|---|---|---|---|---|---|---|
| Display | -3% | -7% | -2% | -5% | -2% | ||
| Display P3 Coverage (%) | 39.85 | 38.3 -4% | 36.7 -8% | 38.62 -3% | 37.47 -6% | 38.48 -3% | |
| sRGB Coverage (%) | 58.7 | 57.6 -2% | 55 -6% | 58.1 -1% | 56.4 -4% | 57.9 -1% | |
| AdobeRGB 1998 Coverage (%) | 41.17 | 39.57 -4% | 37.91 -8% | 39.91 -3% | 38.71 -6% | 39.75 -3% | |
| Response Times | 33% | 18% | 19% | 17% | 28% | 31% | |
| Response Time Grey 50% / Grey 80% * (ms) | 45 ? | 43.3 ? 4% | 41 ? 9% | 40 ? 11% | 42 ? 7% | 41 ? 9% | 32.4 ? 28% |
| Response Time Black / White * (ms) | 35 ? | 13.8 ? 61% | 26 ? 26% | 26 ? 26% | 26 ? 26% | 19 ? 46% | 23.2 ? 34% |
| PWM Frequency (Hz) | 20000 ? | 25970 ? | 7000 ? | ||||
| Screen | -189% | -21% | -43% | -48% | -31% | -47% | |
| Brightness middle (cd/m²) | 296 | 246 -17% | 235 -21% | 186 -37% | 270 -9% | 230 -22% | 208.2 -30% |
| Brightness (cd/m²) | 268 | 225 -16% | 236 -12% | 180 -33% | 250 -7% | 221 -18% | 203 -24% |
| Brightness Distribution (%) | 81 | 81 0% | 80 -1% | 88 9% | 87 7% | 91 12% | 81 0% |
| Black Level * (cd/m²) | 0.3 | 0.51 -70% | 0.17 43% | 0.15 50% | 0.25 17% | 0.45 -50% | 0.34 -13% |
| Contrast (:1) | 987 | 482 -51% | 1382 40% | 1240 26% | 1080 9% | 511 -48% | 612 -38% |
| Colorchecker dE 2000 * | 4.01 | 11 -174% | 4.69 -17% | 5.94 -48% | 4.79 -19% | 3.6 10% | 4.65 -16% |
| Colorchecker dE 2000 max. * | 8.7 | 32.4 -272% | 7.9 9% | 10.81 -24% | 8.83 -1% | 5.59 36% | 15.99 -84% |
| Colorchecker dE 2000 calibrated * | 4 | 4.6 -15% | 6.07 -52% | 3.84 4% | |||
| Greyscale dE 2000 * | 0.98 | 11.6 -1084% | 3.34 -241% | 4.44 -353% | 5.66 -478% | 3.13 -219% | 4.1 -318% |
| Gamma | 2.35 94% | 1.91 115% | 2.63 84% | 2.81 78% | 2.64 83% | 2.45 90% | 2.3 96% |
| CCT | 6408 101% | 11807 55% | 6801 96% | 6272 104% | 7179 91% | 7244 90% | 7352 88% |
| Color Space (Percent of AdobeRGB 1998) (%) | 38 | 36 -5% | 35 -8% | 37 -3% | 36 -5% | 36.7 -3% | |
| Color Space (Percent of sRGB) (%) | 58 | 57 -2% | 55 -5% | 59 2% | 56 -3% | 57.9 0% | |
| Média Total (Programa/Configurações) | -78% /
-149% | -2% /
-12% | -10% /
-29% | -11% /
-30% | -3% /
-18% | -6% /
-29% |
* ... menor é melhor
Cintilação da tela / PWM (modulação por largura de pulso)
| Tela tremeluzindo/PWM detectado | 20000 Hz | ≤ 90 % configuração de brilho | 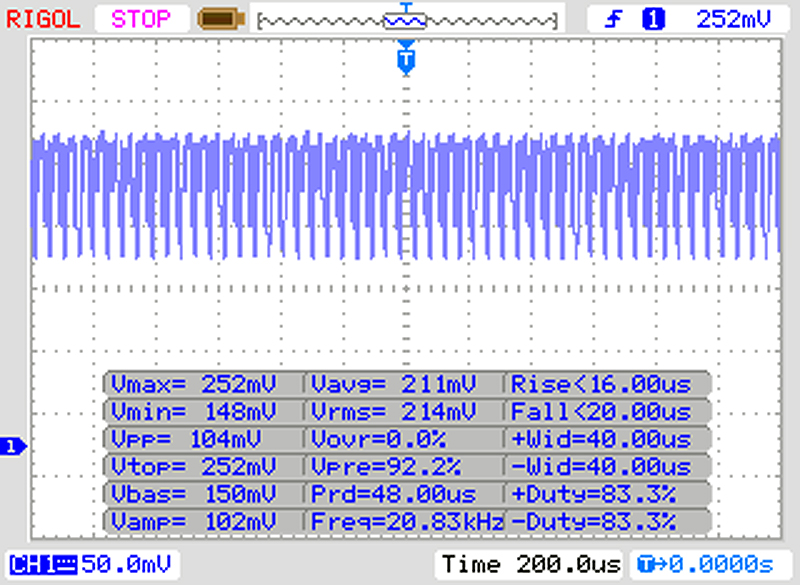 |
A luz de fundo da tela pisca em 20000 Hz (pior caso, por exemplo, utilizando PWM) Cintilação detectada em uma configuração de brilho de 90 % e abaixo. Não deve haver cintilação ou PWM acima desta configuração de brilho. A frequência de 20000 Hz é bastante alta, então a maioria dos usuários sensíveis ao PWM não deve notar nenhuma oscilação. [pwm_comparison] Em comparação: 52 % de todos os dispositivos testados não usam PWM para escurecer a tela. Se PWM foi detectado, uma média de 7750 (mínimo: 5 - máximo: 343500) Hz foi medida. | |||

Exibir tempos de resposta
| ↔ Tempo de resposta preto para branco | ||
|---|---|---|
| 35 ms ... ascensão ↗ e queda ↘ combinadas | ↗ 19 ms ascensão | 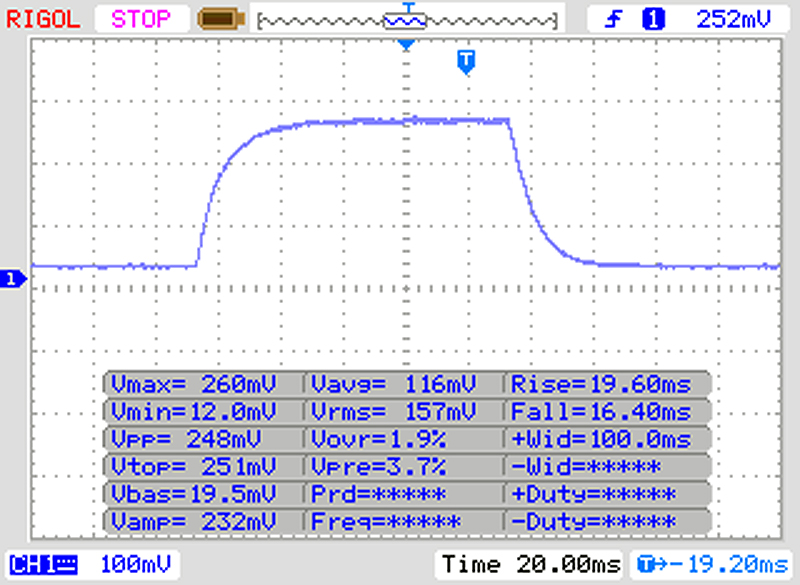 |
| ↘ 16 ms queda | ||
| A tela mostra taxas de resposta lentas em nossos testes e será insatisfatória para os jogadores. Em comparação, todos os dispositivos testados variam de 0.1 (mínimo) a 240 (máximo) ms. » 92 % de todos os dispositivos são melhores. Isso significa que o tempo de resposta medido é pior que a média de todos os dispositivos testados (19.8 ms). | ||
| ↔ Tempo de resposta 50% cinza a 80% cinza | ||
| 45 ms ... ascensão ↗ e queda ↘ combinadas | ↗ 24 ms ascensão | 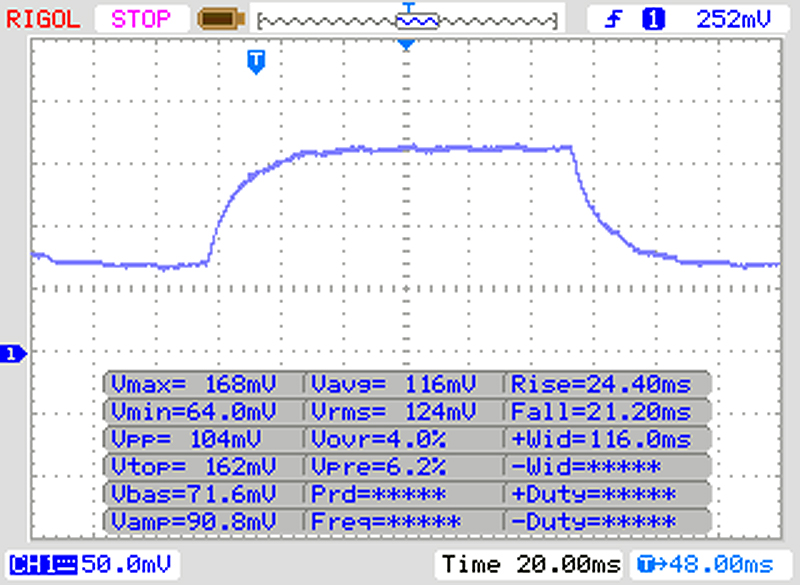 |
| ↘ 21 ms queda | ||
| A tela mostra taxas de resposta lentas em nossos testes e será insatisfatória para os jogadores. Em comparação, todos os dispositivos testados variam de 0.165 (mínimo) a 636 (máximo) ms. » 77 % de todos os dispositivos são melhores. Isso significa que o tempo de resposta medido é pior que a média de todos os dispositivos testados (31 ms). | ||
| Cinebench R15 | |
| CPU Single 64Bit | |
| Média da turma Multimedia (184.8 - 326, n=63, últimos 2 anos) | |
| Dell G3 15 3579 | |
| Acer Aspire 5 A515-52G-53PU | |
| Média Intel Core i5-8265U (111 - 164, n=35) | |
| Asus VivoBook 15 X542UF-DM143T | |
| Acer Aspire 5 A515-51G-509A | |
| Acer Aspire 5 A515-51G-51RL | |
| Lenovo IdeaPad 720-15IKB | |
| HP Pavilion 15-cw0003ng | |
| CPU Multi 64Bit | |
| Média da turma Multimedia (856 - 5224, n=65, últimos 2 anos) | |
| Dell G3 15 3579 | |
| Asus VivoBook 15 X542UF-DM143T | |
| HP Pavilion 15-cw0003ng | |
| Média Intel Core i5-8265U (457 - 750, n=38) | |
| Acer Aspire 5 A515-52G-53PU | |
| Acer Aspire 5 A515-51G-509A | |
| Lenovo IdeaPad 720-15IKB | |
| Acer Aspire 5 A515-51G-51RL | |
| Cinebench R10 | |
| Rendering Multiple CPUs 32Bit | |
| Média da turma Multimedia (17722 - 84729, n=8, últimos 2 anos) | |
| Asus VivoBook 15 X542UF-DM143T | |
| Acer Aspire 5 A515-51G-509A | |
| Média Intel Core i5-8265U (16318 - 22962, n=9) | |
| Acer Aspire 5 A515-52G-53PU | |
| Acer Aspire 5 A515-51G-51RL | |
| Shading 32Bit | |
| Média da turma Multimedia (8886 - 22668, n=6, últimos 2 anos) | |
| Média Intel Core i5-8265U (4095 - 8949, n=10) | |
| Acer Aspire 5 A515-52G-53PU | |
| Asus VivoBook 15 X542UF-DM143T | |
| Acer Aspire 5 A515-51G-509A | |
| Acer Aspire 5 A515-51G-51RL | |
| Geekbench 3 | |
| 32 Bit Multi-Core Score | |
| Acer Aspire 5 A515-52G-53PU | |
| Média Intel Core i5-8265U (12198 - 14499, n=6) | |
| Asus VivoBook 15 X542UF-DM143T | |
| Acer Aspire 5 A515-51G-51RL | |
| 32 Bit Single-Core Score | |
| Acer Aspire 5 A515-52G-53PU | |
| Média Intel Core i5-8265U (3470 - 3842, n=6) | |
| Asus VivoBook 15 X542UF-DM143T | |
| Acer Aspire 5 A515-51G-51RL | |
| Geekbench 4.0 | |
| 64 Bit Multi-Core Score | |
| Média da turma Multimedia (n=1últimos 2 anos) | |
| Acer Aspire 5 A515-52G-53PU | |
| Média Intel Core i5-8265U (13168 - 14390, n=3) | |
| Asus VivoBook 15 X542UF-DM143T | |
| Acer Aspire 5 A515-51G-51RL | |
| 64 Bit Single-Core Score | |
| Média da turma Multimedia (n=1últimos 2 anos) | |
| Acer Aspire 5 A515-52G-53PU | |
| Média Intel Core i5-8265U (4229 - 4605, n=3) | |
| Asus VivoBook 15 X542UF-DM143T | |
| Acer Aspire 5 A515-51G-51RL | |
| Geekbench 4.4 | |
| 64 Bit Multi-Core Score | |
| Média da turma Multimedia (n=1últimos 2 anos) | |
| Acer Aspire 5 A515-52G-53PU | |
| Média Intel Core i5-8265U (7144 - 16249, n=19) | |
| Asus VivoBook 15 X542UF-DM143T | |
| Acer Aspire 5 A515-51G-51RL | |
| 64 Bit Single-Core Score | |
| Média da turma Multimedia (n=1últimos 2 anos) | |
| Acer Aspire 5 A515-52G-53PU | |
| Média Intel Core i5-8265U (2106 - 4830, n=19) | |
| Asus VivoBook 15 X542UF-DM143T | |
| Acer Aspire 5 A515-51G-51RL | |
| Mozilla Kraken 1.1 - Total | |
| Lenovo IdeaPad 720-15IKB | |
| HP Pavilion 15-cw0003ng | |
| Acer Aspire 5 A515-51G-509A | |
| Acer Aspire 5 A515-51G-51RL (Edge 40) | |
| Acer Aspire 5 A515-52G-53PU (Edge 42) | |
| Dell G3 15 3579 (Edge 42.17134.1.0) | |
| Média Intel Core i5-8265U (851 - 1245, n=25) | |
| Média da turma Multimedia (228 - 835, n=70, últimos 2 anos) | |
| Octane V2 - Total Score | |
| Média da turma Multimedia (64079 - 153175, n=32, últimos 2 anos) | |
| Acer Aspire 5 A515-52G-53PU (Edge 42) | |
| Dell G3 15 3579 (Edge 42.17134.1.0) | |
| Média Intel Core i5-8265U (12842 - 35563, n=23) | |
| Acer Aspire 5 A515-51G-51RL (Edge 40) | |
| Lenovo IdeaPad 720-15IKB | |
| JetStream 1.1 - 1.1 Total | |
| Média da turma Multimedia (n=1últimos 2 anos) | |
| Acer Aspire 5 A515-52G-53PU (Edge 42) | |
| Dell G3 15 3579 (Edge 42.17134.1.0) | |
| Asus VivoBook 15 X542UF-DM143T (Edge 41) | |
| Média Intel Core i5-8265U (193.7 - 244, n=19) | |
| Acer Aspire 5 A515-51G-509A | |
| Acer Aspire 5 A515-51G-51RL (Edge 40) | |
| HP Pavilion 15-cw0003ng | |
| Lenovo IdeaPad 720-15IKB | |
* ... menor é melhor
| PCMark 7 Score | 6028 pontos | |
| PCMark 8 Home Score Accelerated v2 | 3725 pontos | |
| PCMark 8 Creative Score Accelerated v2 | 4506 pontos | |
| PCMark 8 Work Score Accelerated v2 | 4924 pontos | |
| PCMark 10 Score | 3960 pontos | |
Ajuda | ||
| PCMark 8 | |
| Home Score Accelerated v2 | |
| Média da turma Multimedia (n=1últimos 2 anos) | |
| Lenovo IdeaPad 720-15IKB | |
| Dell G3 15 3579 | |
| Acer Aspire 5 A515-51G-509A | |
| Acer Aspire 5 A515-52G-53PU | |
| Média Intel Core i5-8265U, NVIDIA GeForce MX150 (n=1) | |
| Asus VivoBook 15 X542UF-DM143T | |
| Acer Aspire 5 A515-51G-51RL | |
| HP Pavilion 15-cw0003ng | |
| Work Score Accelerated v2 | |
| Acer Aspire 5 A515-52G-53PU | |
| Média Intel Core i5-8265U, NVIDIA GeForce MX150 (n=1) | |
| Dell G3 15 3579 | |
| Lenovo IdeaPad 720-15IKB | |
| Asus VivoBook 15 X542UF-DM143T | |
| Acer Aspire 5 A515-51G-509A | |
| Acer Aspire 5 A515-51G-51RL | |
| HP Pavilion 15-cw0003ng | |

| Acer Aspire 5 A515-52G-53PU Micron 1100 MTFDDAV256TBN | Acer Aspire 5 A515-51G-509A SK Hynix HFS256G39TND-N210A | Acer Aspire 5 A515-51G-51RL Kingston RBUSNS8180DS3128GH | HP Pavilion 15-cw0003ng Intel SSD 600p SSDPEKKW512G7 | Lenovo IdeaPad 720-15IKB Samsung PM961 MZVLW256HEHP | Asus VivoBook 15 X542UF-DM143T Micron 1100 MTFDDAV256TBN | Média Micron 1100 MTFDDAV256TBN | |
|---|---|---|---|---|---|---|---|
| CrystalDiskMark 3.0 | 8% | -18% | 19% | 135% | 7% | -0% | |
| Read Seq (MB/s) | 452.9 | 499.5 10% | 407.5 -10% | 1040 130% | 1713 278% | 468.5 3% | 465 ? 3% |
| Write Seq (MB/s) | 414.2 | 265.8 -36% | 283.5 -32% | 179.9 -57% | 1129 173% | 378.4 -9% | 379 ? -8% |
| Read 512 (MB/s) | 298.3 | 314.3 5% | 282.4 -5% | 641 115% | 926 210% | 342.5 15% | 315 ? 6% |
| Write 512 (MB/s) | 312.3 | 266.3 -15% | 72.7 -77% | 300.3 -4% | 721 131% | 368.7 18% | 315 ? 1% |
| Read 4k (MB/s) | 19.13 | 29.24 53% | 26.81 40% | 19.99 4% | 55.5 190% | 26.93 41% | 24.6 ? 29% |
| Write 4k (MB/s) | 84.8 | 78.4 -8% | 73.7 -13% | 72 -15% | 124.5 47% | 88.1 4% | 80.8 ? -5% |
| Read 4k QD32 (MB/s) | 247.4 | 402.5 63% | 294.8 19% | 264.5 7% | 374.2 51% | 247.8 0% | 227 ? -8% |
| Write 4k QD32 (MB/s) | 290 | 264.9 -9% | 89.6 -69% | 206.1 -29% | 290.4 0% | 246.5 -15% | 233 ? -20% |
| 3DMark 06 Standard Score | 22890 pontos | |
| 3DMark 11 Performance | 4749 pontos | |
| 3DMark Ice Storm Standard Score | 69823 pontos | |
| 3DMark Cloud Gate Standard Score | 12652 pontos | |
| 3DMark Fire Strike Score | 3230 pontos | |
| 3DMark Fire Strike Extreme Score | 1620 pontos | |
| 3DMark Time Spy Score | 1166 pontos | |
Ajuda | ||
| 3DMark 11 - 1280x720 Performance GPU | |
| Média da turma Multimedia (3749 - 60002, n=60, últimos 2 anos) | |
| Lenovo IdeaPad 720-15IKB | |
| Dell G3 15 3579 | |
| Acer Aspire 5 A515-51G-51RL | |
| Acer Aspire 5 A515-52G-53PU | |
| Média NVIDIA GeForce MX150 (2796 - 4905, n=47) | |
| Acer Aspire 5 A515-51G-509A | |
| Asus VivoBook 15 X542UF-DM143T | |
| HP Pavilion 15-cw0003ng | |
| 3DMark | |
| 1280x720 Cloud Gate Standard Graphics | |
| Média da turma Multimedia (16765 - 143501, n=34, últimos 2 anos) | |
| Dell G3 15 3579 | |
| Lenovo IdeaPad 720-15IKB | |
| Acer Aspire 5 A515-52G-53PU | |
| Média NVIDIA GeForce MX150 (16227 - 22183, n=43) | |
| Acer Aspire 5 A515-51G-51RL | |
| Acer Aspire 5 A515-51G-509A | |
| Asus VivoBook 15 X542UF-DM143T | |
| HP Pavilion 15-cw0003ng | |
| 1920x1080 Fire Strike Graphics | |
| Média da turma Multimedia (2328 - 48907, n=63, últimos 2 anos) | |
| Dell G3 15 3579 | |
| Lenovo IdeaPad 720-15IKB | |
| Acer Aspire 5 A515-52G-53PU | |
| Acer Aspire 5 A515-51G-51RL | |
| Média NVIDIA GeForce MX150 (2323 - 3739, n=44) | |
| Acer Aspire 5 A515-51G-509A | |
| Asus VivoBook 15 X542UF-DM143T | |
| HP Pavilion 15-cw0003ng | |
| baixo | média | alto | ultra | |
|---|---|---|---|---|
| Tomb Raider (2013) | 244.7 | 132.8 | 85.9 | 39.8 |
| BioShock Infinite (2013) | 183.9 | 105.9 | 89.8 | 33.7 |
| The Witcher 3 (2015) | 58.8 | 35.2 | 19.3 | 10.7 |
| Fortnite (2018) | 130.1 | 52.5 | 36.7 | 22.7 |
| Far Cry 5 (2018) | 45 | 18 | 16 | 15 |
| The Crew 2 (2018) | 56.8 | 24.2 | 21.4 | 18 |
| Monster Hunter World (2018) | 53.4 | 19.6 | 17.5 | 12.8 |
| F1 2018 (2018) | 65 | 35 | 26 | 15 |
| Shadow of the Tomb Raider (2018) | 45 | 18 | 15 | 10 |
| FIFA 19 (2018) | 141.5 | 114.3 | 108.2 | 97.2 |
| Forza Horizon 4 (2018) | 57 | 25 | 21 | 14 |
| Assassin´s Creed Odyssey (2018) | 41 | 17 | 12 | 6 |
| Call of Duty Black Ops 4 (2018) | 60.3 | 19.3 | 19.2 | 15.4 |
| BioShock Infinite - 1366x768 High Preset | |
| Dell G3 15 3579 | |
| Lenovo IdeaPad 720-15IKB | |
| Acer Aspire 5 A515-52G-53PU | |
| Média NVIDIA GeForce MX150 (59.7 - 98, n=33) | |
| Acer Aspire 5 A515-51G-51RL | |
| Asus VivoBook 15 X542UF-DM143T | |
| The Witcher 3 - 1024x768 Low Graphics & Postprocessing | |
| Média da turma Multimedia (68 - 380, n=8, últimos 2 anos) | |
| Dell G3 15 3579 | |
| Lenovo IdeaPad 720-15IKB | |
| Acer Aspire 5 A515-51G-51RL | |
| Acer Aspire 5 A515-52G-53PU | |
| Média NVIDIA GeForce MX150 (42.6 - 72, n=24) | |
| Asus VivoBook 15 X542UF-DM143T | |
| Far Cry 5 - 1280x720 Low Preset AA:T | |
| Média da turma Multimedia (37 - 182, n=20, últimos 2 anos) | |
| Lenovo IdeaPad 720-15IKB | |
| Acer Aspire 5 A515-52G-53PU | |
| Média NVIDIA GeForce MX150 (31 - 46, n=7) | |
| Asus VivoBook 15 X542UF-DM143T | |
| HP Pavilion 15-cw0003ng | |
| Fortnite - 1920x1080 Medium Preset | |
| Lenovo IdeaPad 720-15IKB | |
| Média NVIDIA GeForce MX150 (33.7 - 86.7, n=5) | |
| Acer Aspire 5 A515-52G-53PU | |
| Asus VivoBook 15 X542UF-DM143T | |
Barulho
| Ocioso |
| 30.5 / 30.5 / 30.9 dB |
| Carga |
| 41.2 / 41.9 dB |
 | ||
30 dB silencioso 40 dB(A) audível 50 dB(A) ruidosamente alto |
||
min: | ||
| Acer Aspire 5 A515-52G-53PU i5-8265U, GeForce MX150 | Acer Aspire 5 A515-51G-509A i5-8250U, GeForce MX130 | Acer Aspire 5 A515-51G-51RL i5-7200U, GeForce MX150 | HP Pavilion 15-cw0003ng R5 2500U, Vega 8 | Lenovo IdeaPad 720-15IKB i5-7200U, Radeon RX 560 (Laptop) | Asus VivoBook 15 X542UF-DM143T i5-8250U, GeForce MX130 | Dell G3 15 3579 i5-8300H, GeForce GTX 1050 Mobile | Média NVIDIA GeForce MX150 | Média da turma Multimedia | |
|---|---|---|---|---|---|---|---|---|---|
| Noise | -4% | 1% | 4% | 3% | 2% | 1% | -1% | 12% | |
| desligado / ambiente * (dB) | 30.5 | 31.1 -2% | 30.1 1% | 30.5 -0% | 30.3 1% | 30 2% | 28 8% | 35.9 ? -18% | 24.2 ? 21% |
| Idle Minimum * (dB) | 30.5 | 31.4 -3% | 30.1 1% | 31.4 -3% | 30.3 1% | 30.9 -1% | 29.8 2% | 29.8 ? 2% | 24.3 ? 20% |
| Idle Average * (dB) | 30.5 | 31.9 -5% | 30.2 1% | 31.4 -3% | 30.3 1% | 30.9 -1% | 29.8 2% | 29.9 ? 2% | 24.7 ? 19% |
| Idle Maximum * (dB) | 30.9 | 32.2 -4% | 30.5 1% | 31.6 -2% | 30.3 2% | 30.9 -0% | 30 3% | 30.5 ? 1% | 26.4 ? 15% |
| Load Average * (dB) | 41.2 | 41 -0% | 41.1 -0% | 33.5 19% | 39.2 5% | 39 5% | 38.6 6% | 38.5 ? 7% | 37.5 ? 9% |
| Load Maximum * (dB) | 41.9 | 46.4 -11% | 41.2 2% | 35.9 14% | 39.2 6% | 38 9% | 49.4 -18% | 41.3 ? 1% | 46.1 ? -10% |
| Witcher 3 ultra * (dB) | 41.3 | 40.4 | 41.6 | 46.9 |
* ... menor é melhor
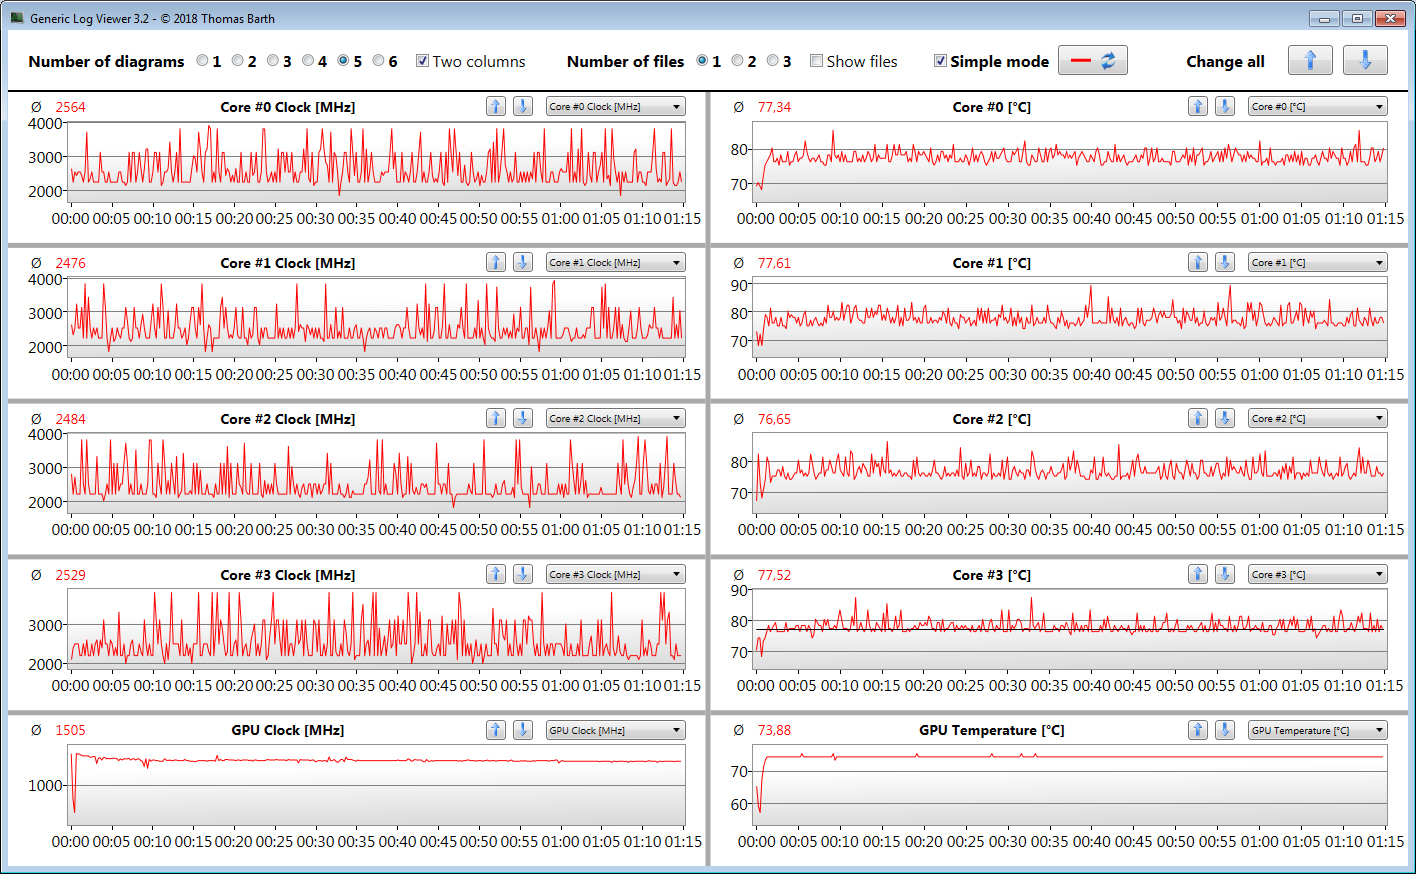
(-) A temperatura máxima no lado superior é 52.9 °C / 127 F, em comparação com a média de 36.8 °C / 98 F , variando de 21 a 71 °C para a classe Multimedia.
(-) A parte inferior aquece até um máximo de 51.5 °C / 125 F, em comparação com a média de 39.1 °C / 102 F
(+) Em uso inativo, a temperatura média para o lado superior é 25.6 °C / 78 F, em comparação com a média do dispositivo de 31.3 °C / ### class_avg_f### F.
(+) Os apoios para as mãos e o touchpad são mais frios que a temperatura da pele, com um máximo de 24.3 °C / 75.7 F e, portanto, são frios ao toque.
(+) A temperatura média da área do apoio para as mãos de dispositivos semelhantes foi 28.7 °C / 83.7 F (+4.4 °C / 8 F).
| Acer Aspire 5 A515-52G-53PU i5-8265U, GeForce MX150 | Acer Aspire 5 A515-51G-509A i5-8250U, GeForce MX130 | Acer Aspire 5 A515-51G-51RL i5-7200U, GeForce MX150 | HP Pavilion 15-cw0003ng R5 2500U, Vega 8 | Lenovo IdeaPad 720-15IKB i5-7200U, Radeon RX 560 (Laptop) | Asus VivoBook 15 X542UF-DM143T i5-8250U, GeForce MX130 | Dell G3 15 3579 i5-8300H, GeForce GTX 1050 Mobile | Média NVIDIA GeForce MX150 | Média da turma Multimedia | |
|---|---|---|---|---|---|---|---|---|---|
| Heat | 10% | 6% | 24% | 24% | 15% | -12% | 10% | 12% | |
| Maximum Upper Side * (°C) | 52.9 | 41 22% | 41.3 22% | 37.3 29% | 41.2 22% | 40.2 24% | 47 11% | 44.6 ? 16% | 41.1 ? 22% |
| Maximum Bottom * (°C) | 51.5 | 49 5% | 48.7 5% | 37.3 28% | 36.4 29% | 46.6 10% | 61.2 -19% | 45.6 ? 11% | 43.6 ? 15% |
| Idle Upper Side * (°C) | 28.4 | 26 8% | 28.7 -1% | 23.7 17% | 22 23% | 25.1 12% | 34 -20% | 26.8 ? 6% | 27 ? 5% |
| Idle Bottom * (°C) | 29.7 | 28 6% | 30.8 -4% | 23.9 20% | 23.6 21% | 25.8 13% | 35.8 -21% | 27.3 ? 8% | 28 ? 6% |
* ... menor é melhor
Acer Aspire 5 A515-52G-53PU análise de áudio
(-) | alto-falantes não muito altos (###valor### dB)
Graves 100 - 315Hz
(-) | quase nenhum baixo - em média 23.9% menor que a mediana
(±) | a linearidade dos graves é média (11.2% delta para a frequência anterior)
Médios 400 - 2.000 Hz
(+) | médios equilibrados - apenas 2.6% longe da mediana
(±) | a linearidade dos médios é média (8.6% delta para frequência anterior)
Altos 2 - 16 kHz
(+) | agudos equilibrados - apenas 1.8% longe da mediana
(+) | os máximos são lineares (3.8% delta da frequência anterior)
Geral 100 - 16.000 Hz
(±) | a linearidade do som geral é média (21.9% diferença em relação à mediana)
Comparado com a mesma classe
» 78% de todos os dispositivos testados nesta classe foram melhores, 5% semelhantes, 17% piores
» O melhor teve um delta de 5%, a média foi 17%, o pior foi 45%
Comparado com todos os dispositivos testados
» 63% de todos os dispositivos testados foram melhores, 7% semelhantes, 30% piores
» O melhor teve um delta de 4%, a média foi 23%, o pior foi 134%
Apple MacBook 12 (Early 2016) 1.1 GHz análise de áudio
(+) | os alto-falantes podem tocar relativamente alto (###valor### dB)
Graves 100 - 315Hz
(±) | graves reduzidos - em média 11.3% menor que a mediana
(±) | a linearidade dos graves é média (14.2% delta para a frequência anterior)
Médios 400 - 2.000 Hz
(+) | médios equilibrados - apenas 2.4% longe da mediana
(+) | médios são lineares (5.5% delta para frequência anterior)
Altos 2 - 16 kHz
(+) | agudos equilibrados - apenas 2% longe da mediana
(+) | os máximos são lineares (4.5% delta da frequência anterior)
Geral 100 - 16.000 Hz
(+) | o som geral é linear (10.2% diferença em relação à mediana)
Comparado com a mesma classe
» 7% de todos os dispositivos testados nesta classe foram melhores, 2% semelhantes, 91% piores
» O melhor teve um delta de 5%, a média foi 18%, o pior foi 53%
Comparado com todos os dispositivos testados
» 5% de todos os dispositivos testados foram melhores, 1% semelhantes, 94% piores
» O melhor teve um delta de 4%, a média foi 23%, o pior foi 134%
| desligado | |
| Ocioso | |
| Carga |
|
Key:
min: | |
| Acer Aspire 5 A515-52G-53PU i5-8265U, GeForce MX150 | Acer Aspire 5 A515-51G-509A i5-8250U, GeForce MX130 | Acer Aspire 5 A515-51G-51RL i5-7200U, GeForce MX150 | HP Pavilion 15-cw0003ng R5 2500U, Vega 8 | Lenovo IdeaPad 720-15IKB i5-7200U, Radeon RX 560 (Laptop) | Asus VivoBook 15 X542UF-DM143T i5-8250U, GeForce MX130 | Dell G3 15 3579 i5-8300H, GeForce GTX 1050 Mobile | Média NVIDIA GeForce MX150 | Média da turma Multimedia | |
|---|---|---|---|---|---|---|---|---|---|
| Power Consumption | -6% | 14% | 9% | -52% | 0% | -71% | -7% | -45% | |
| Idle Minimum * (Watt) | 3.8 | 5.1 -34% | 2.9 24% | 4.5 -18% | 9.9 -161% | 4.75 -25% | 7.9 -108% | 4.48 ? -18% | 5.67 ? -49% |
| Idle Average * (Watt) | 6.3 | 7.6 -21% | 5.9 6% | 7.3 -16% | 9.5 -51% | 6.9 -10% | 9.6 -52% | 7.88 ? -25% | 10.1 ? -60% |
| Idle Maximum * (Watt) | 9.6 | 8.2 15% | 6.4 33% | 9.4 2% | 10.7 -11% | 7 27% | 13 -35% | 9.76 ? -2% | 12.3 ? -28% |
| Load Average * (Watt) | 59.5 | 49.4 17% | 54 9% | 34 43% | 62 -4% | 53 11% | 93 -56% | 54.7 ? 8% | 65.6 ? -10% |
| Load Maximum * (Watt) | 64.4 | 68 -6% | 66 -2% | 41.9 35% | 86.7 -35% | 65.3 -1% | 132.7 -106% | 63.5 ? 1% | 113.2 ? -76% |
| Witcher 3 ultra * (Watt) | 42.1 | 51 | 84 | 100.6 |
* ... menor é melhor
| Acer Aspire 5 A515-52G-53PU i5-8265U, GeForce MX150, 48 Wh | Acer Aspire 5 A515-51G-509A i5-8250U, GeForce MX130, 48 Wh | Acer Aspire 5 A515-51G-51RL i5-7200U, GeForce MX150, 48 Wh | HP Pavilion 15-cw0003ng R5 2500U, Vega 8, 41 Wh | Lenovo IdeaPad 720-15IKB i5-7200U, Radeon RX 560 (Laptop), 40 Wh | Asus VivoBook 15 X542UF-DM143T i5-8250U, GeForce MX130, 38 Wh | Dell G3 15 3579 i5-8300H, GeForce GTX 1050 Mobile, 56 Wh | Média da turma Multimedia | |
|---|---|---|---|---|---|---|---|---|
| Duração da bateria | 18% | 32% | -23% | -2% | -9% | 8% | 70% | |
| Reader / Idle (h) | 14.1 | 14.5 3% | 20.9 48% | 8.4 -40% | 16.1 14% | 25.2 ? 79% | ||
| H.264 (h) | 6.7 | 8.8 31% | 8.2 22% | 3.8 -43% | 9.2 37% | 16.3 ? 143% | ||
| WiFi v1.3 (h) | 7.5 | 5.8 -23% | 8.6 15% | 5 -33% | 7.1 -5% | 6.8 -9% | 6.5 -13% | 12.1 ? 61% |
| Load (h) | 1.7 | 2.7 59% | 2.4 41% | 2.1 24% | 0.8 -53% | 2.2 29% | 1.654 ? -3% |
Pro
Contra
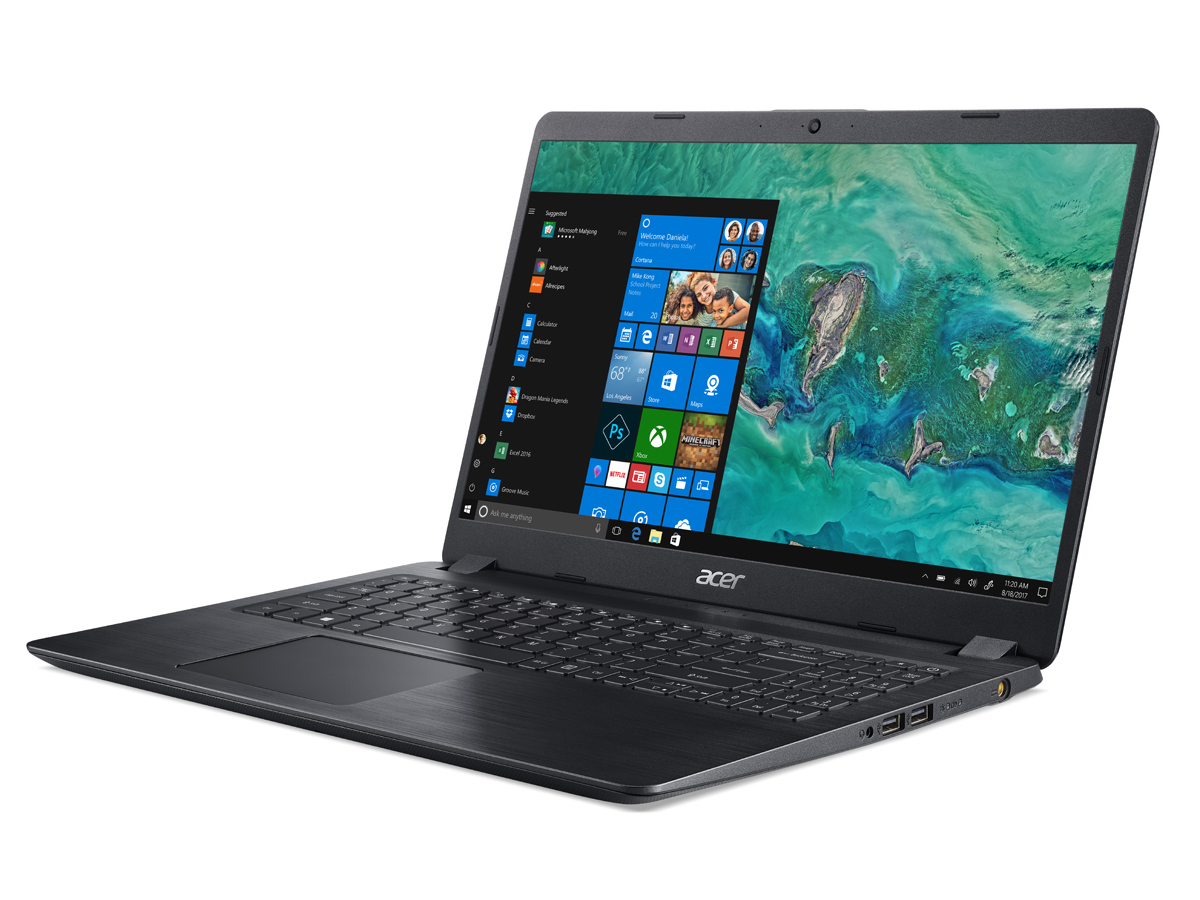
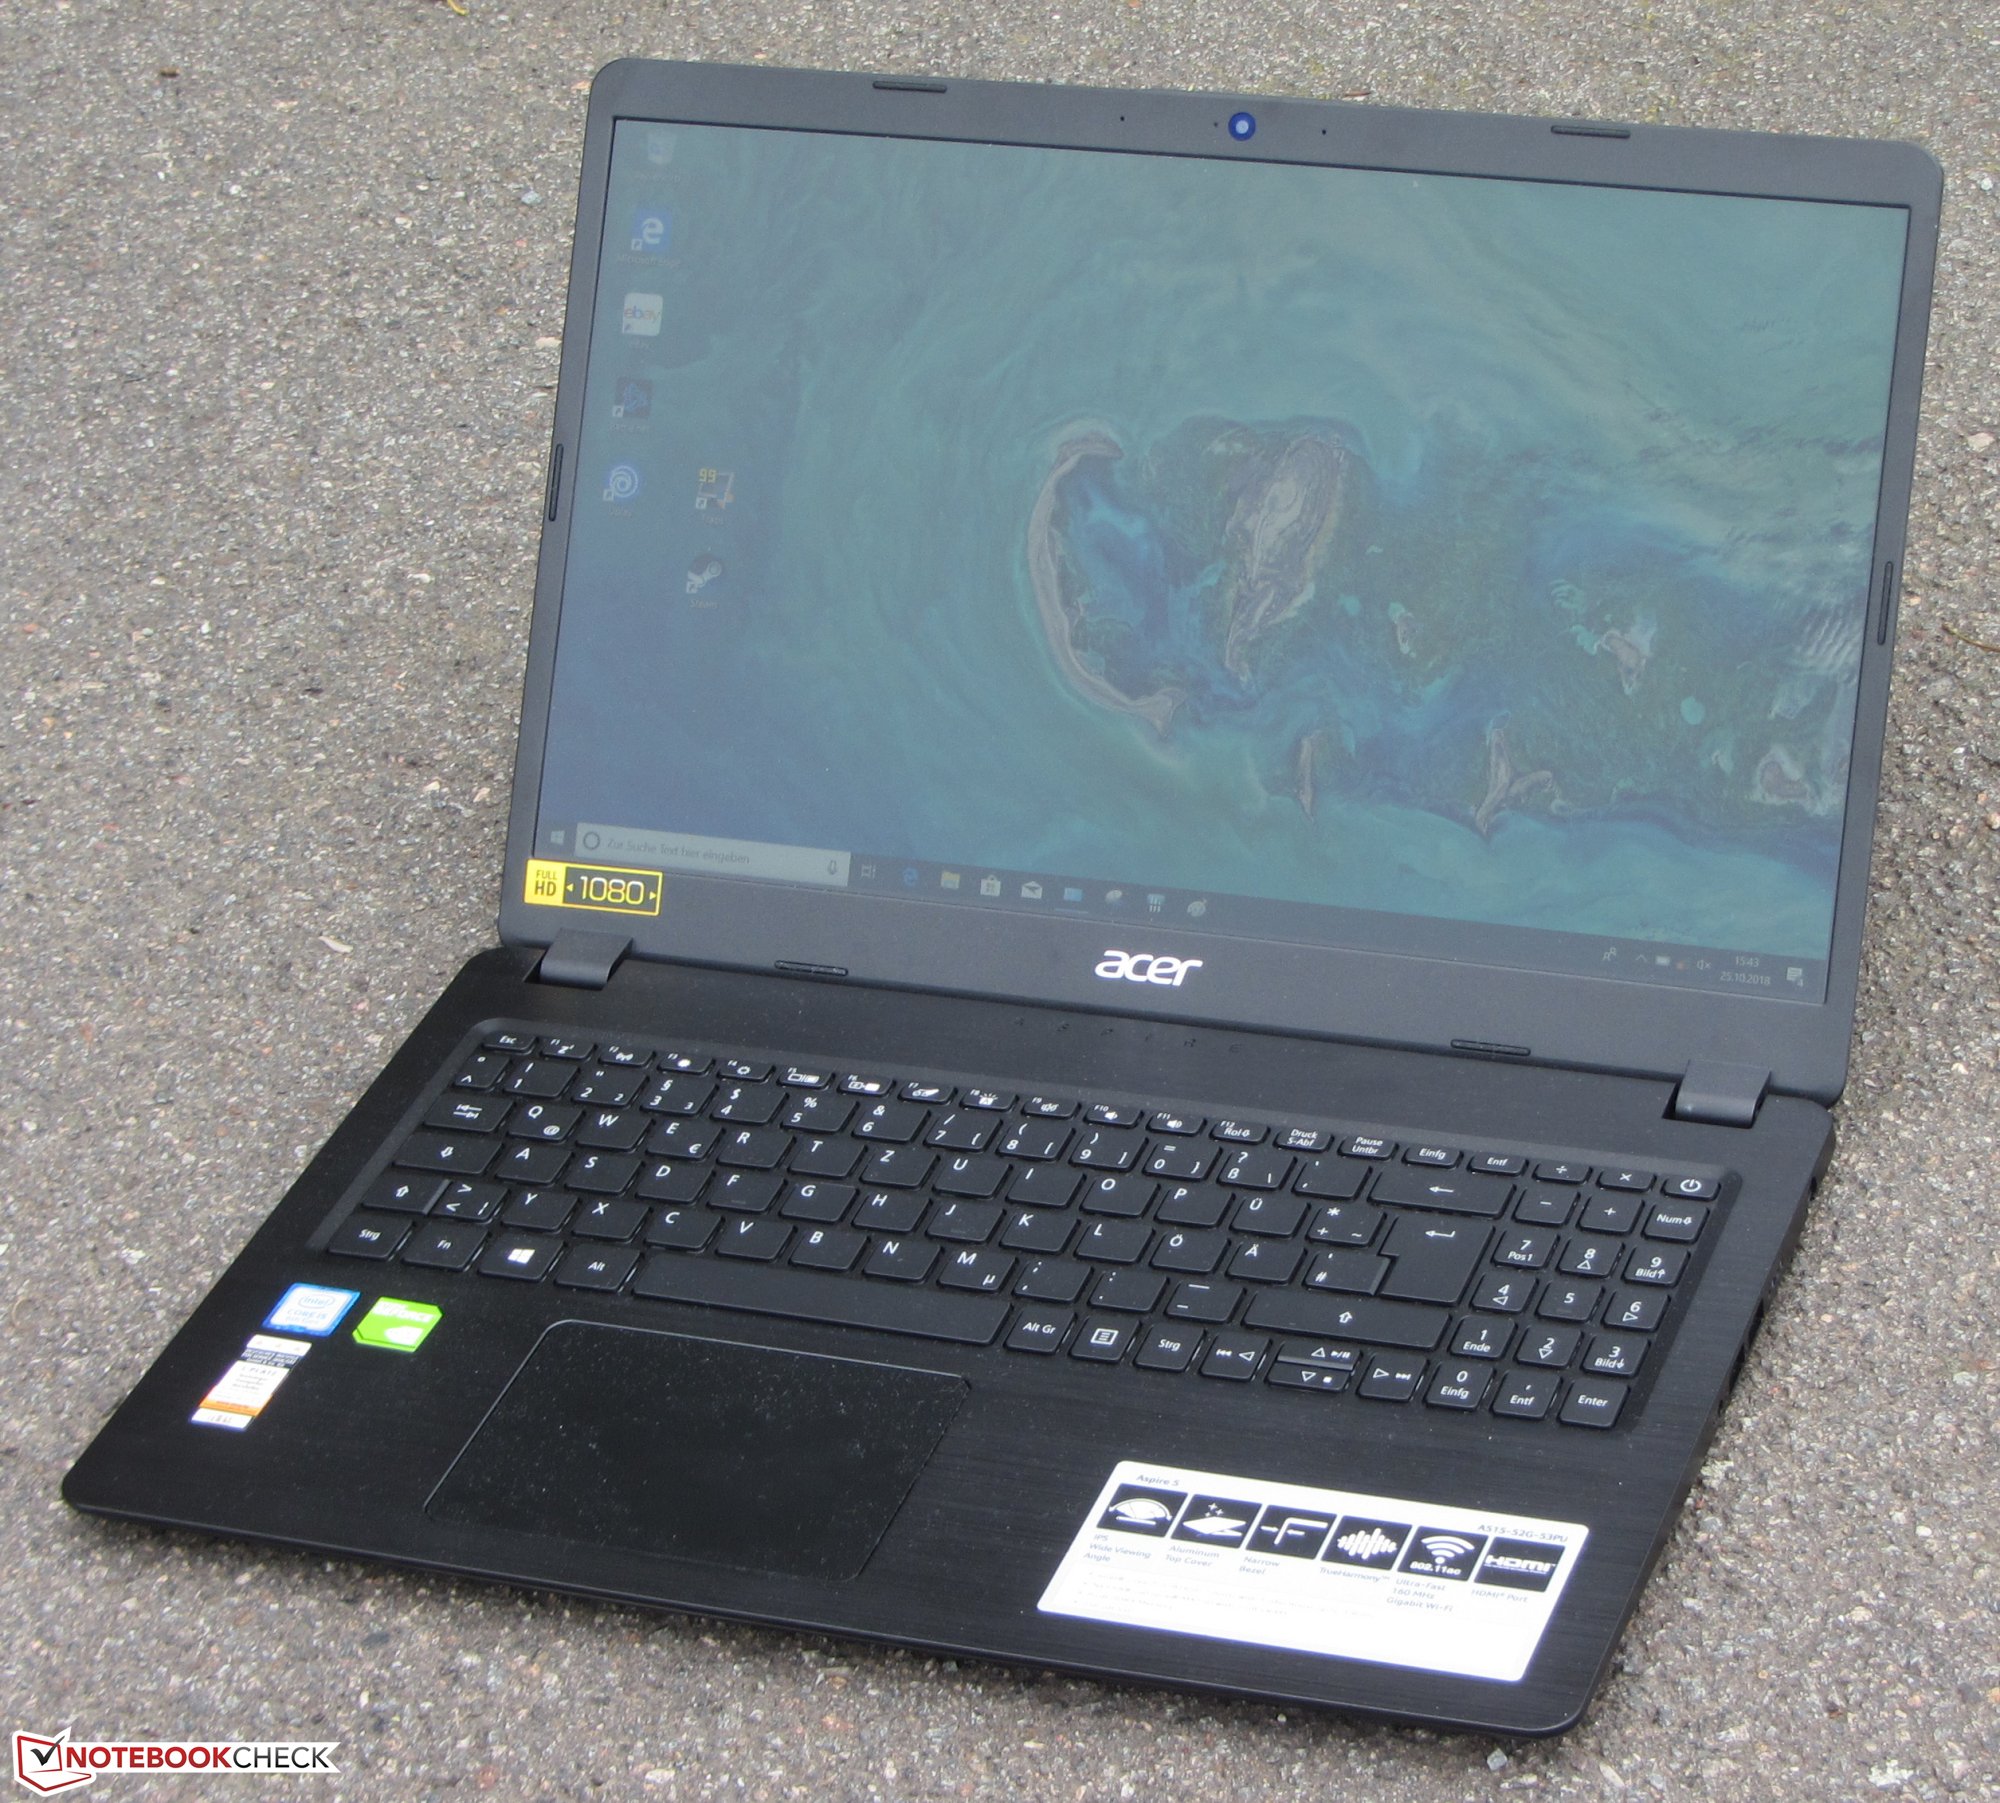
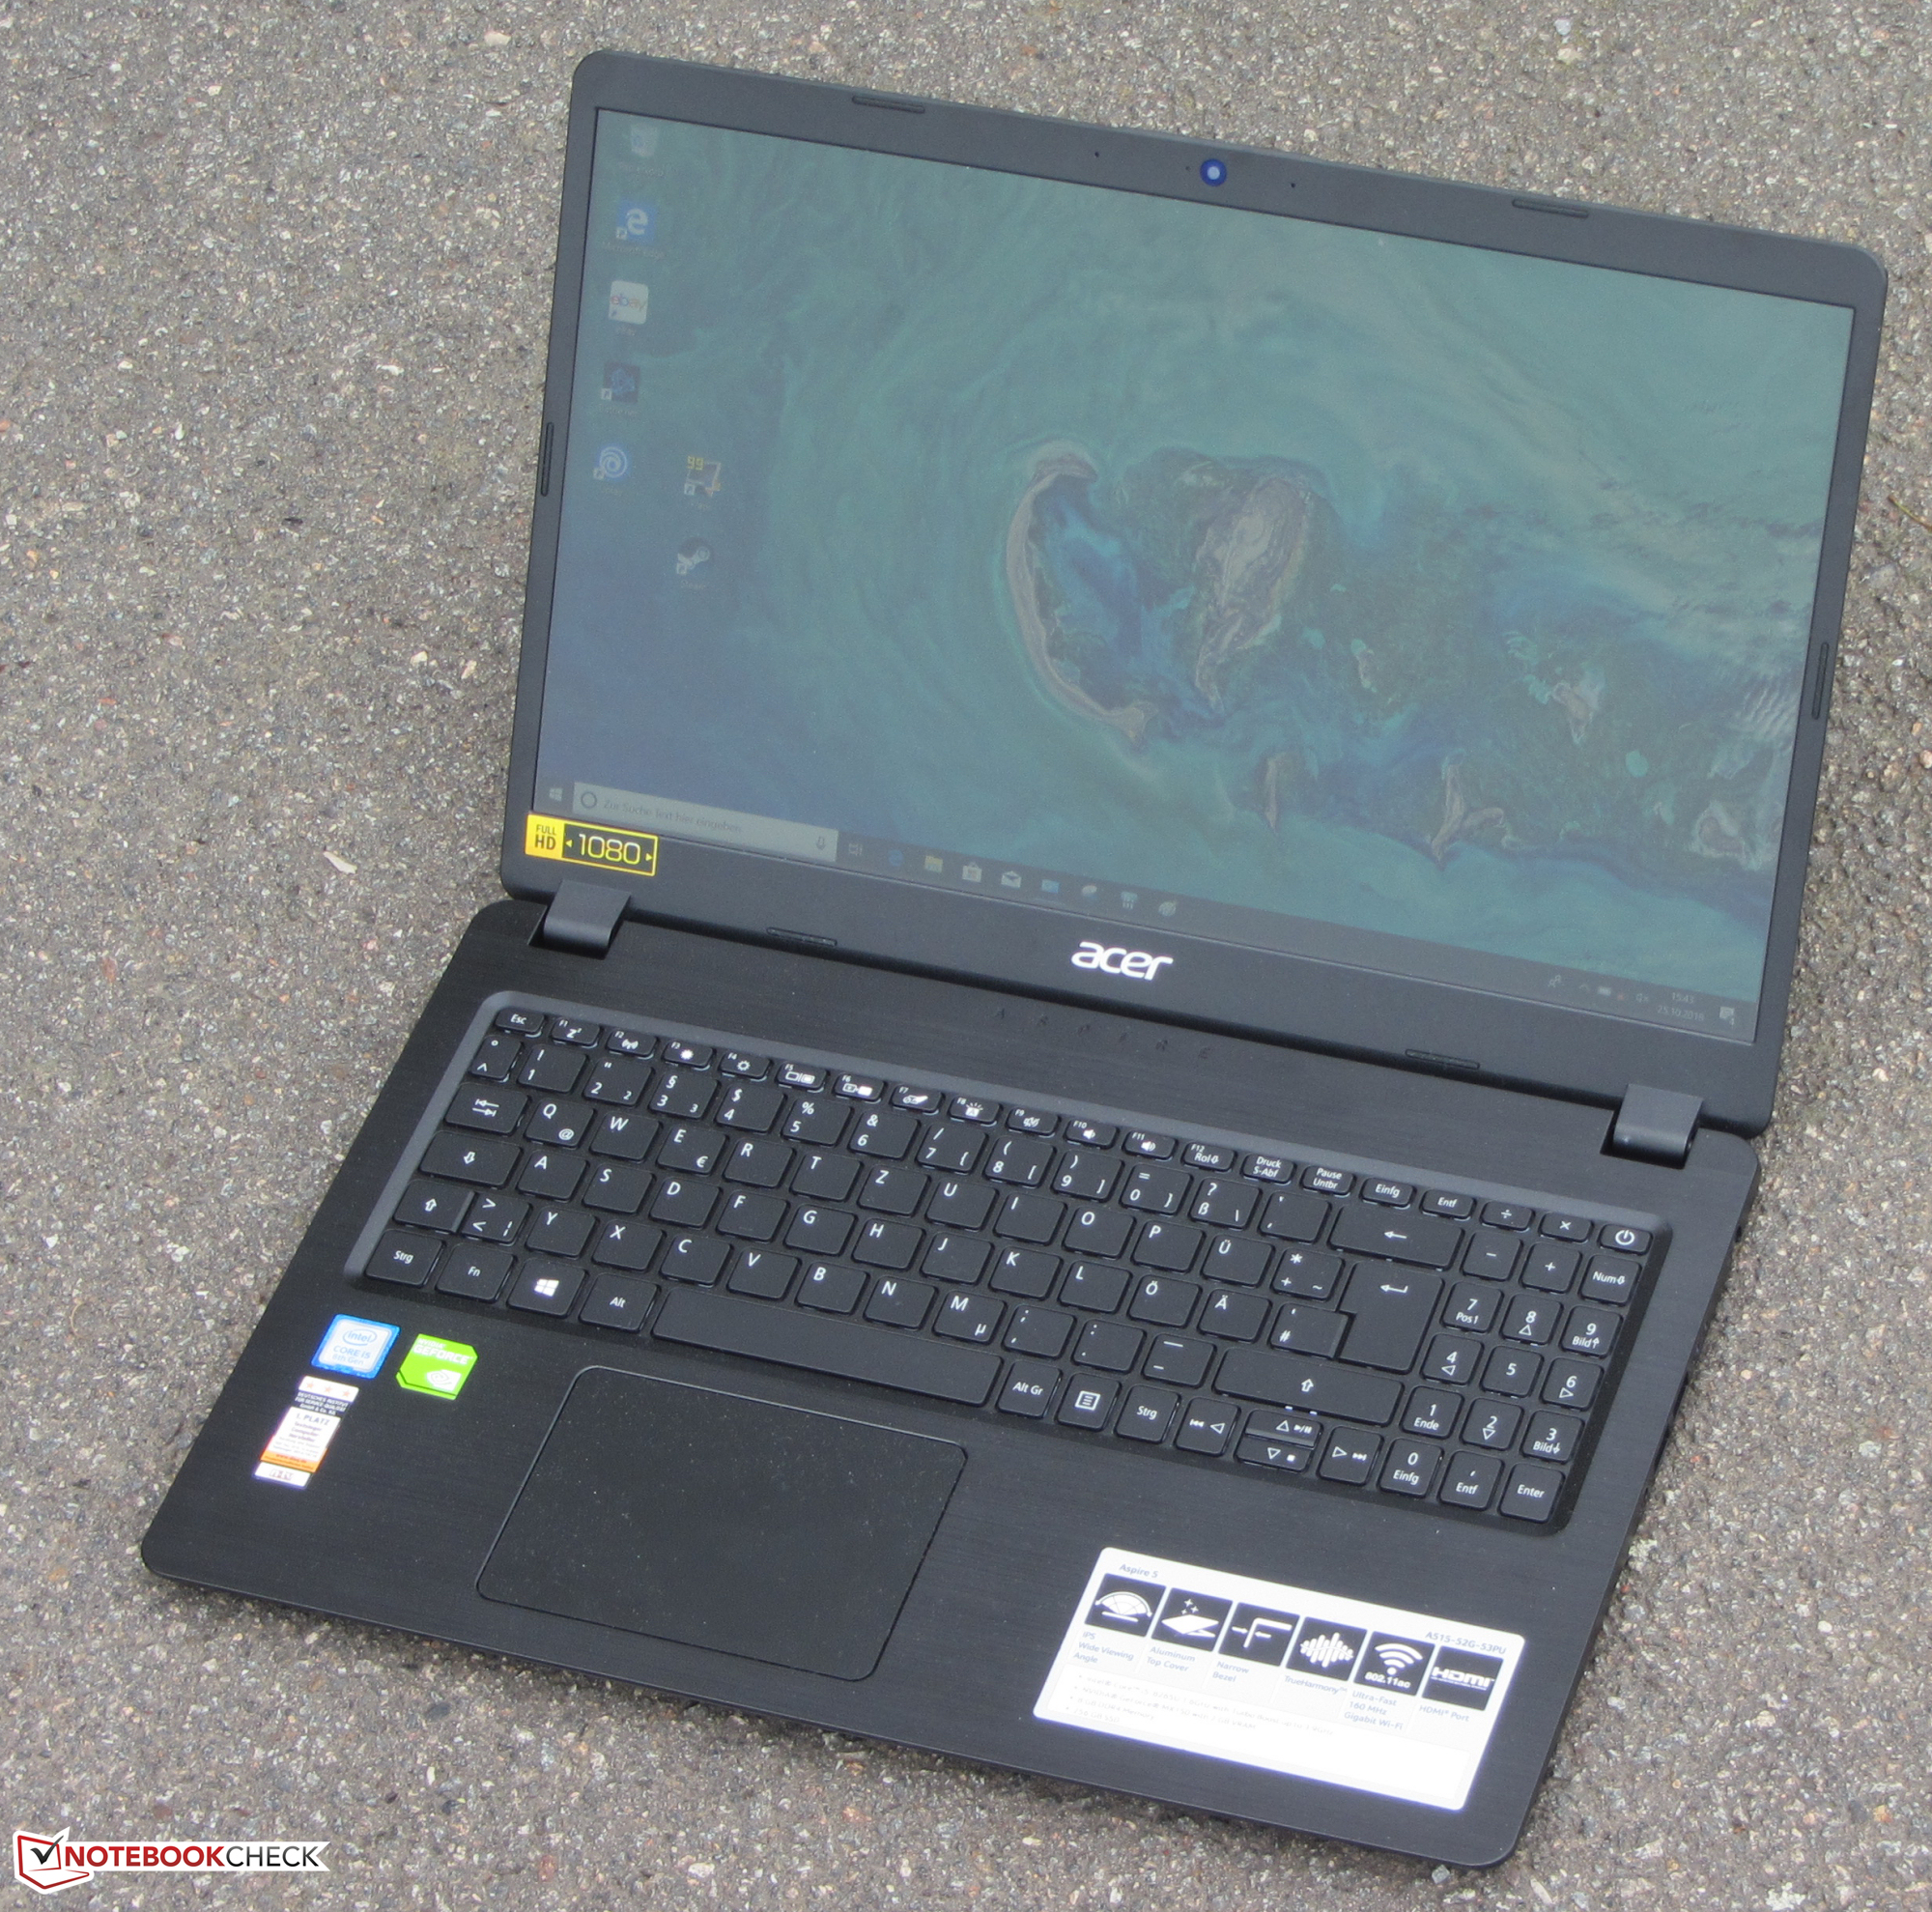
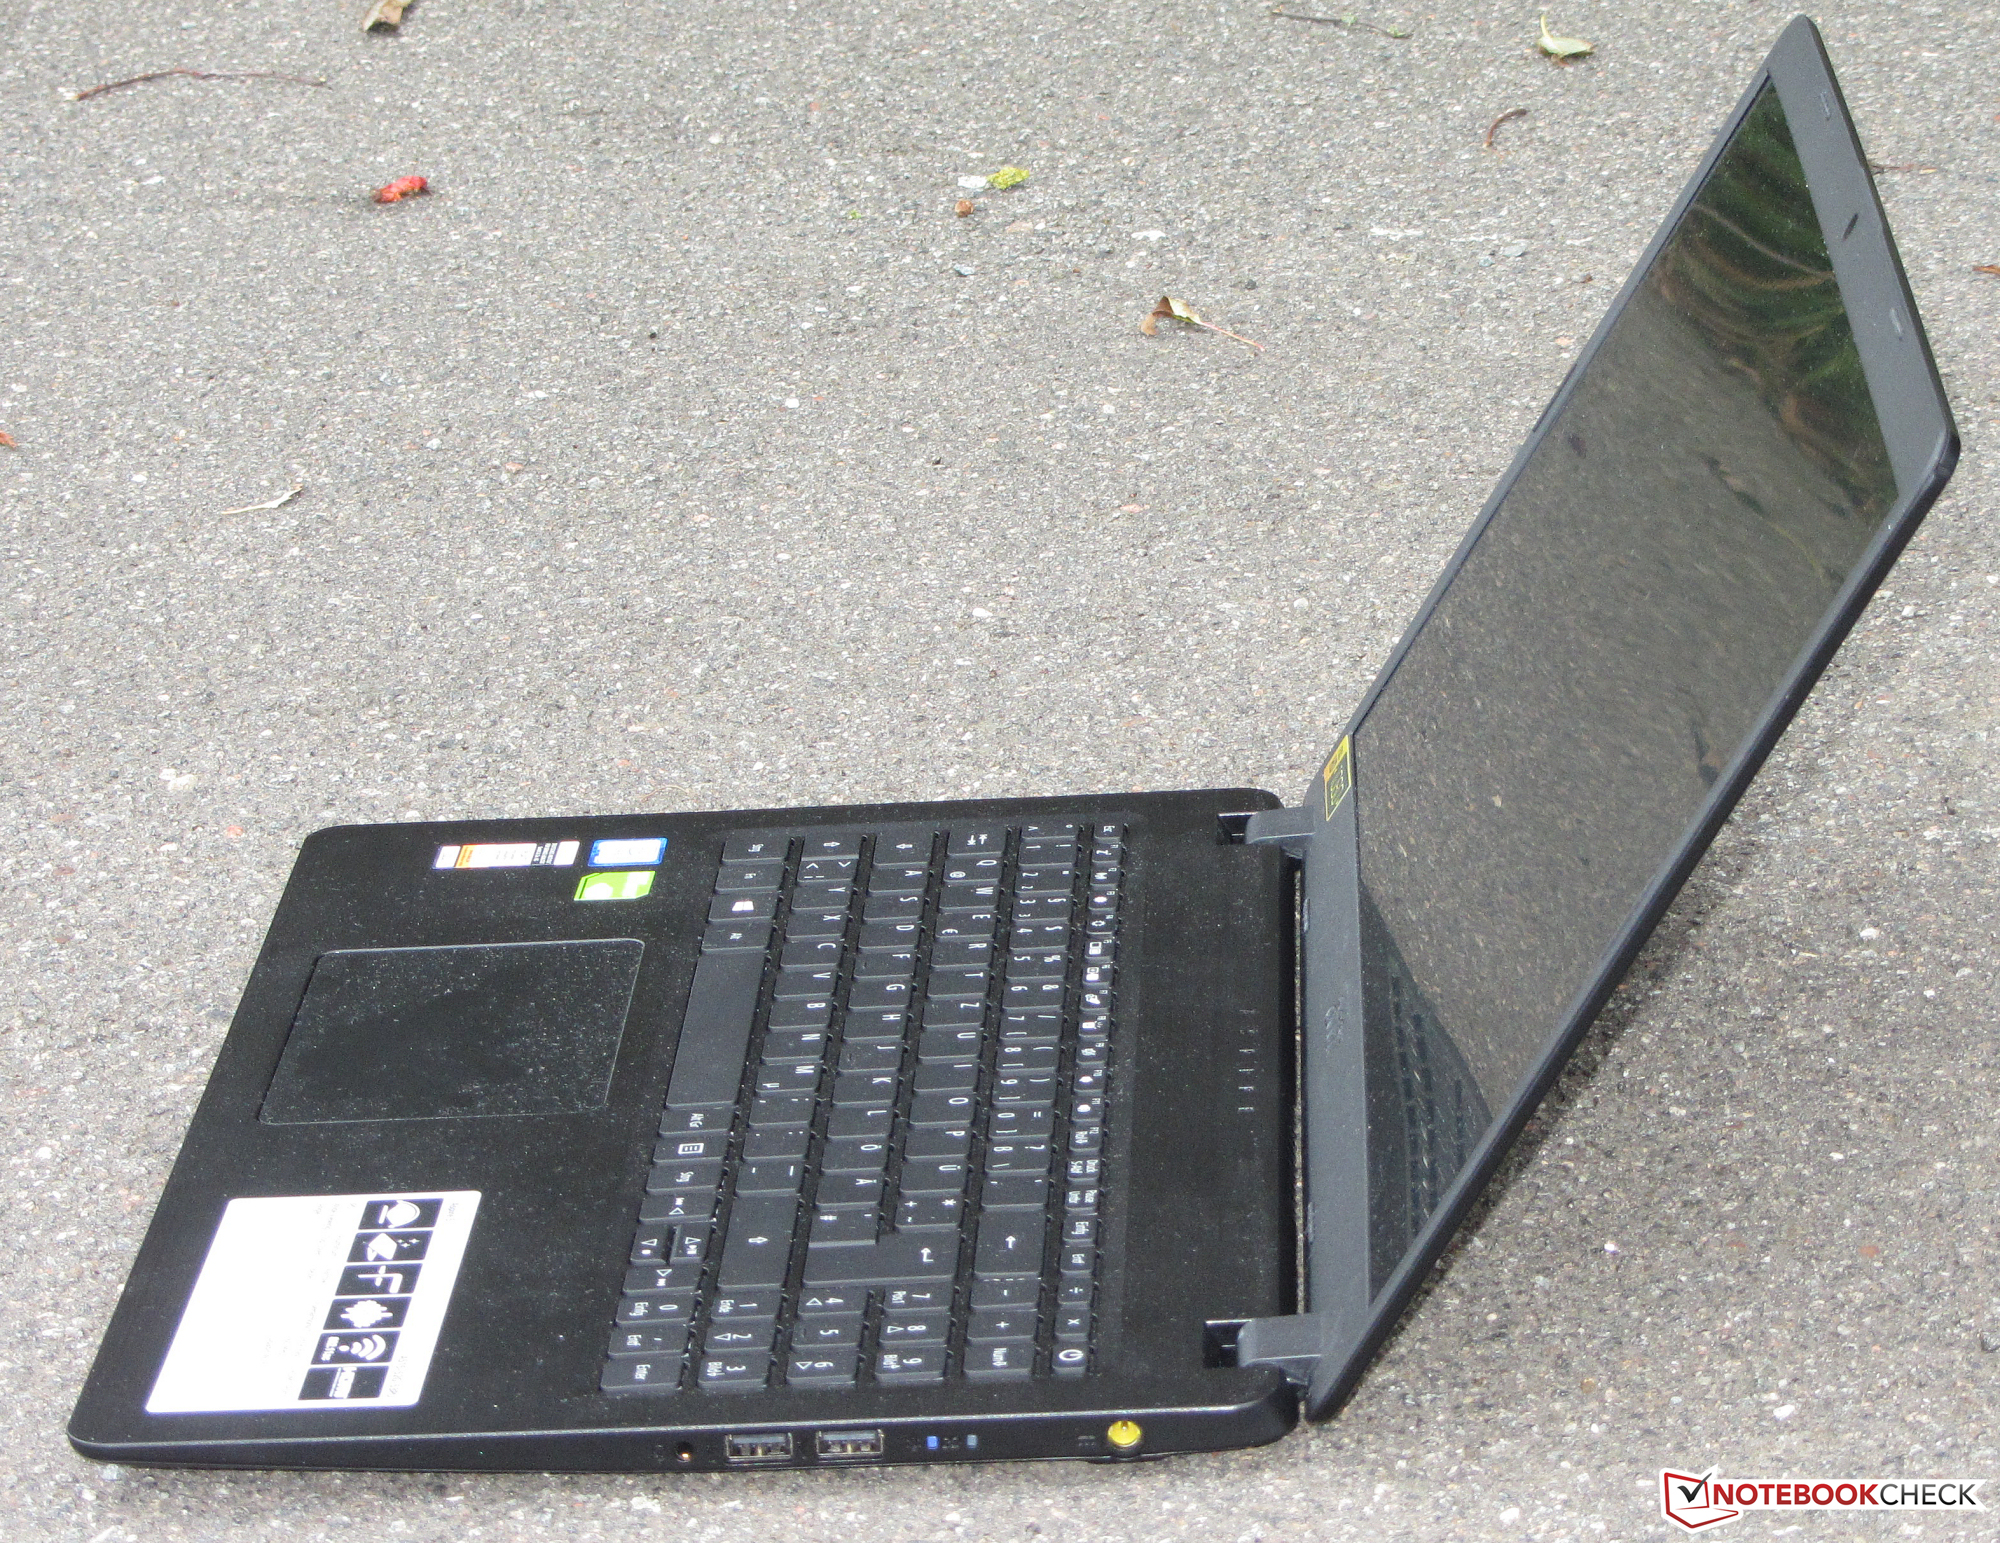
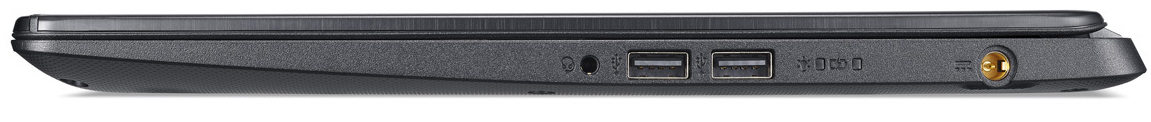
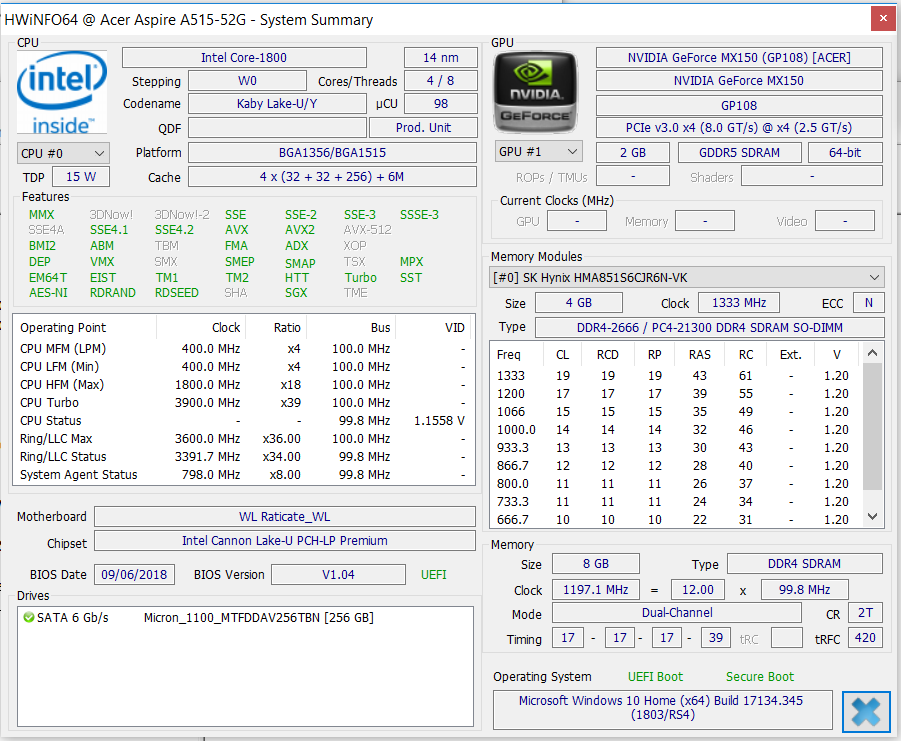
O Aspire 5 A515-52G é um poli funcional multimídia de 15 polegadas da Acer. A carcaça já fina do antecessor tornou-se ainda mais fina e compacta e o peso diminuiu.
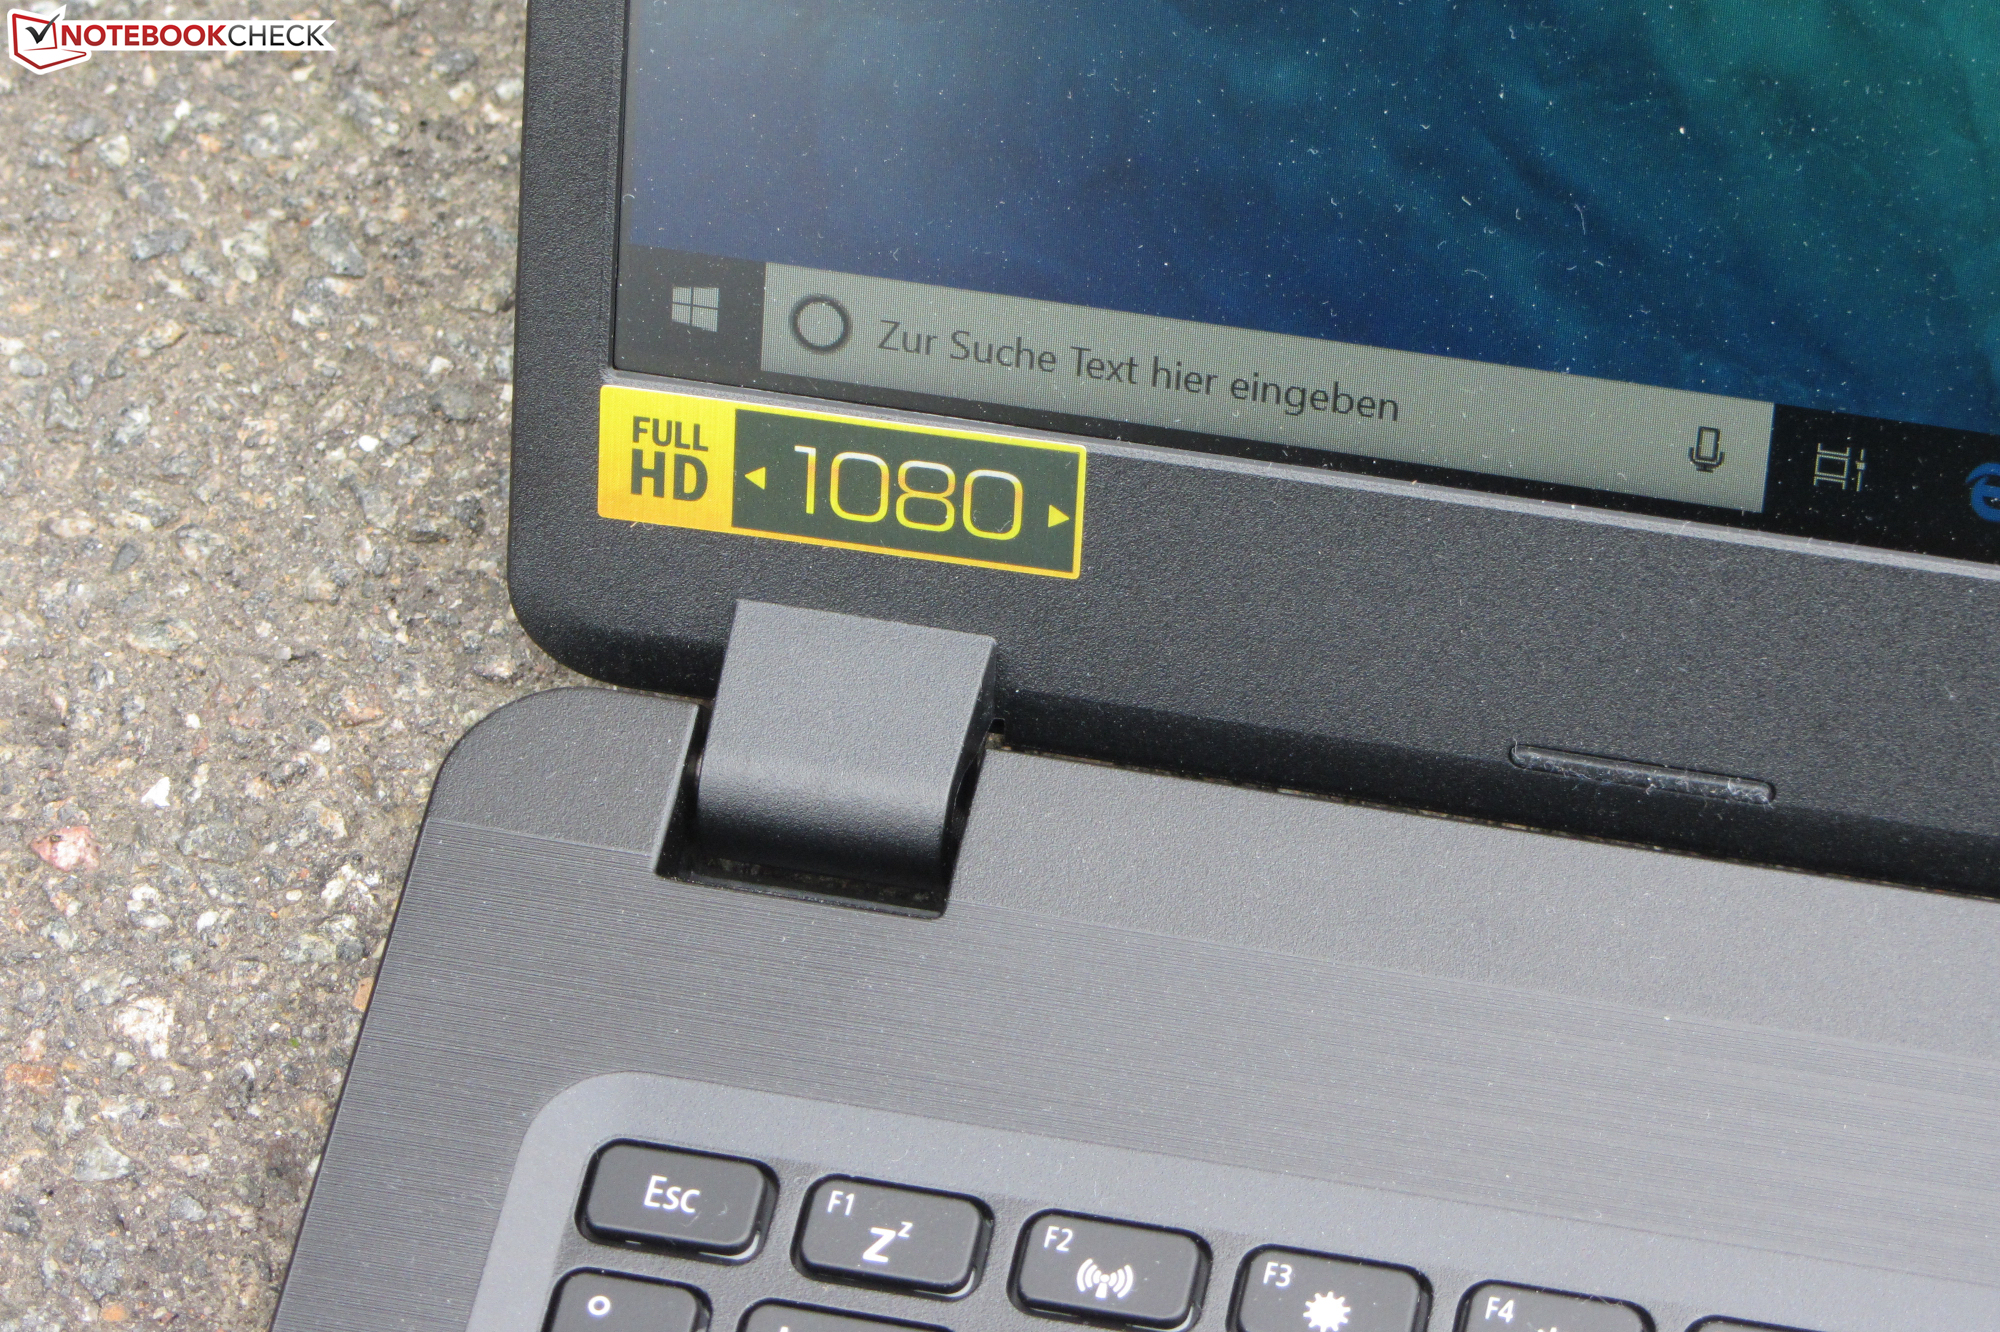
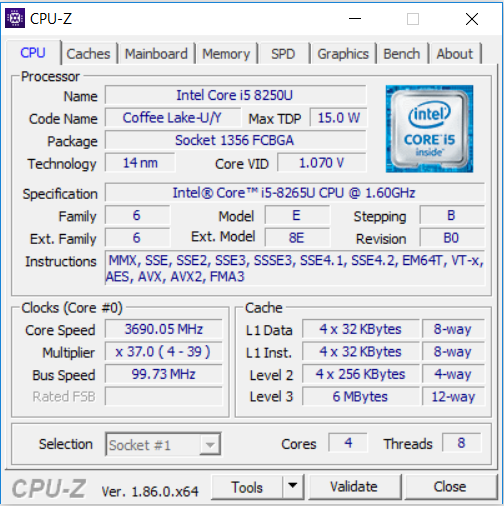
O dispositivo é alimentado por um novo processador Core i5 da geração Whiskey Lake. Isso oferece desempenho suficiente para todos os cenários de uso normal. O aumento do desempenho em comparação com o seu antecessor (Core i5-8250U) é apenas devido à maior velocidade. O desempenho por MHz não mudou. Combinado com a GPU GeForce MX150, este processador pode rodar todos os jogos de computador atuais na tela Full HD mate.
Com o Aspire 5 A515-52G, a Acer criou um poli funcional que também é adequado para jogos e tem poucas fraquezas visíveis.
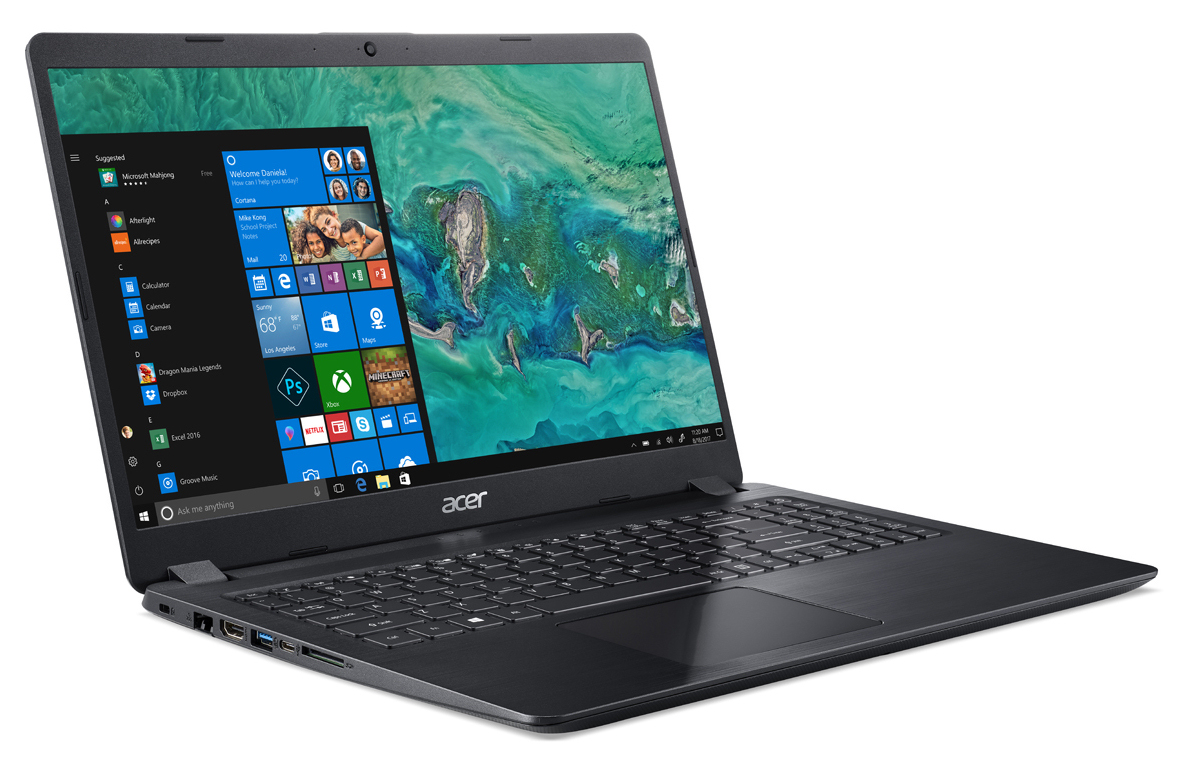
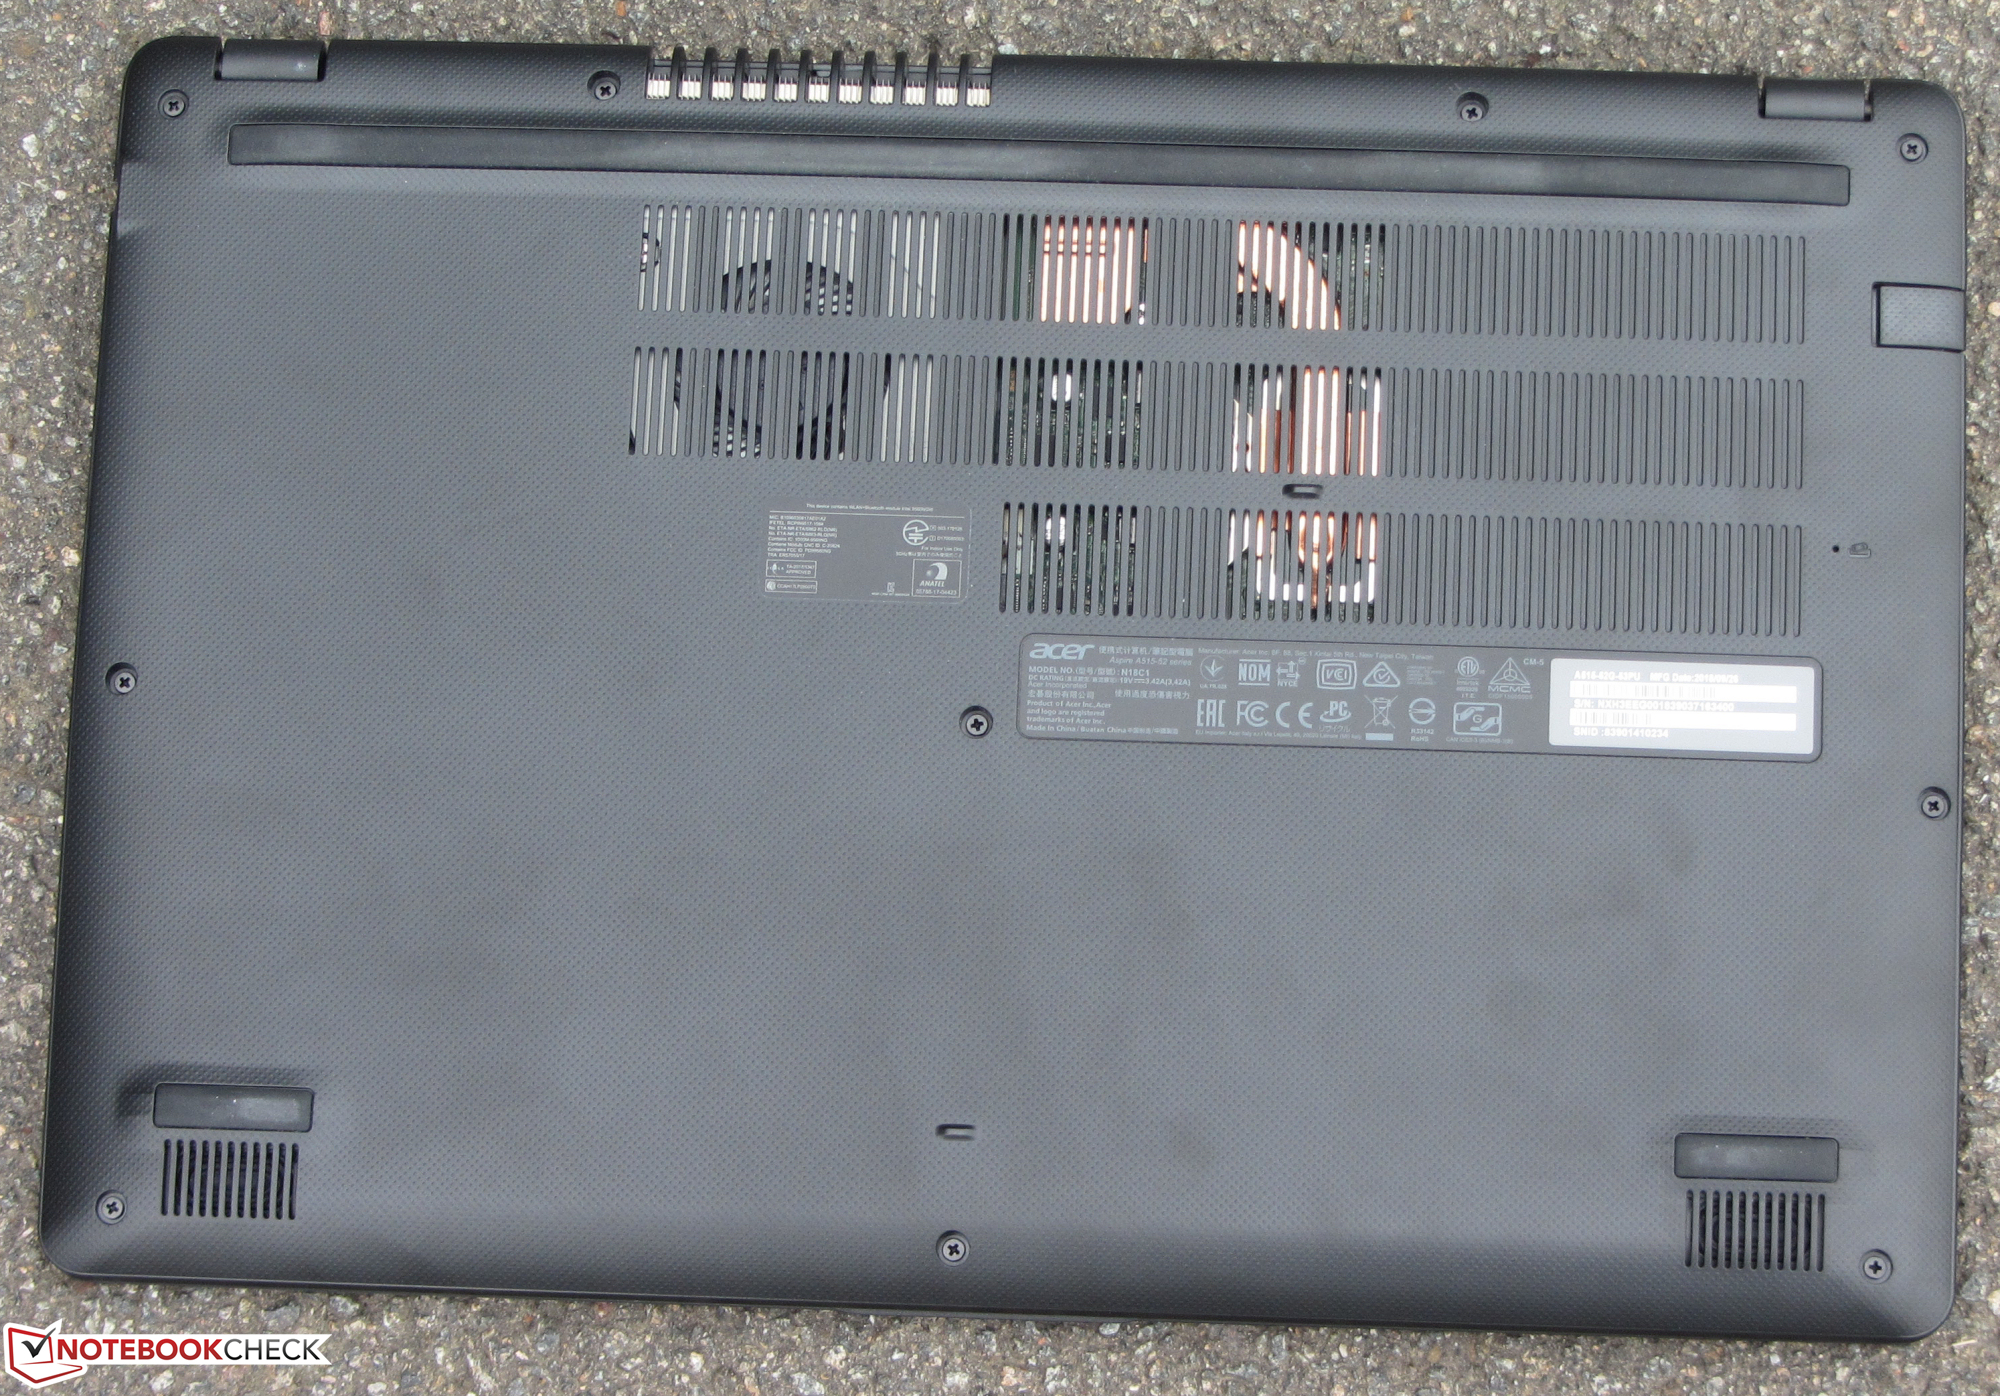
Um SSD NVMe permite um sistema fluente. Os usuários podem abrir o dispositivo e substituir o SSD SATA III existente por um modelo NVMe mais veloz. Há também um slot livre para um disco rígido de 2,5 polegadas. No entanto, você precisaria de hardware adicional para instalar esse modelo.
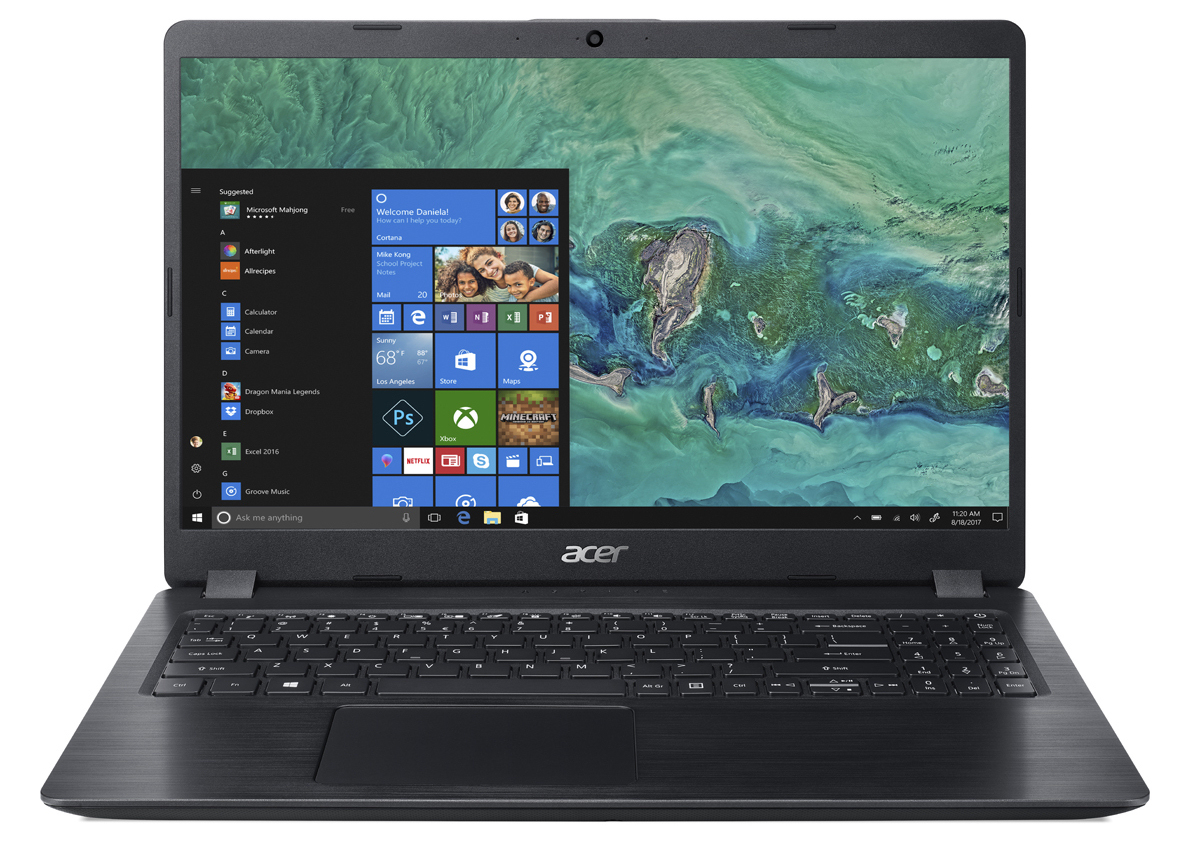
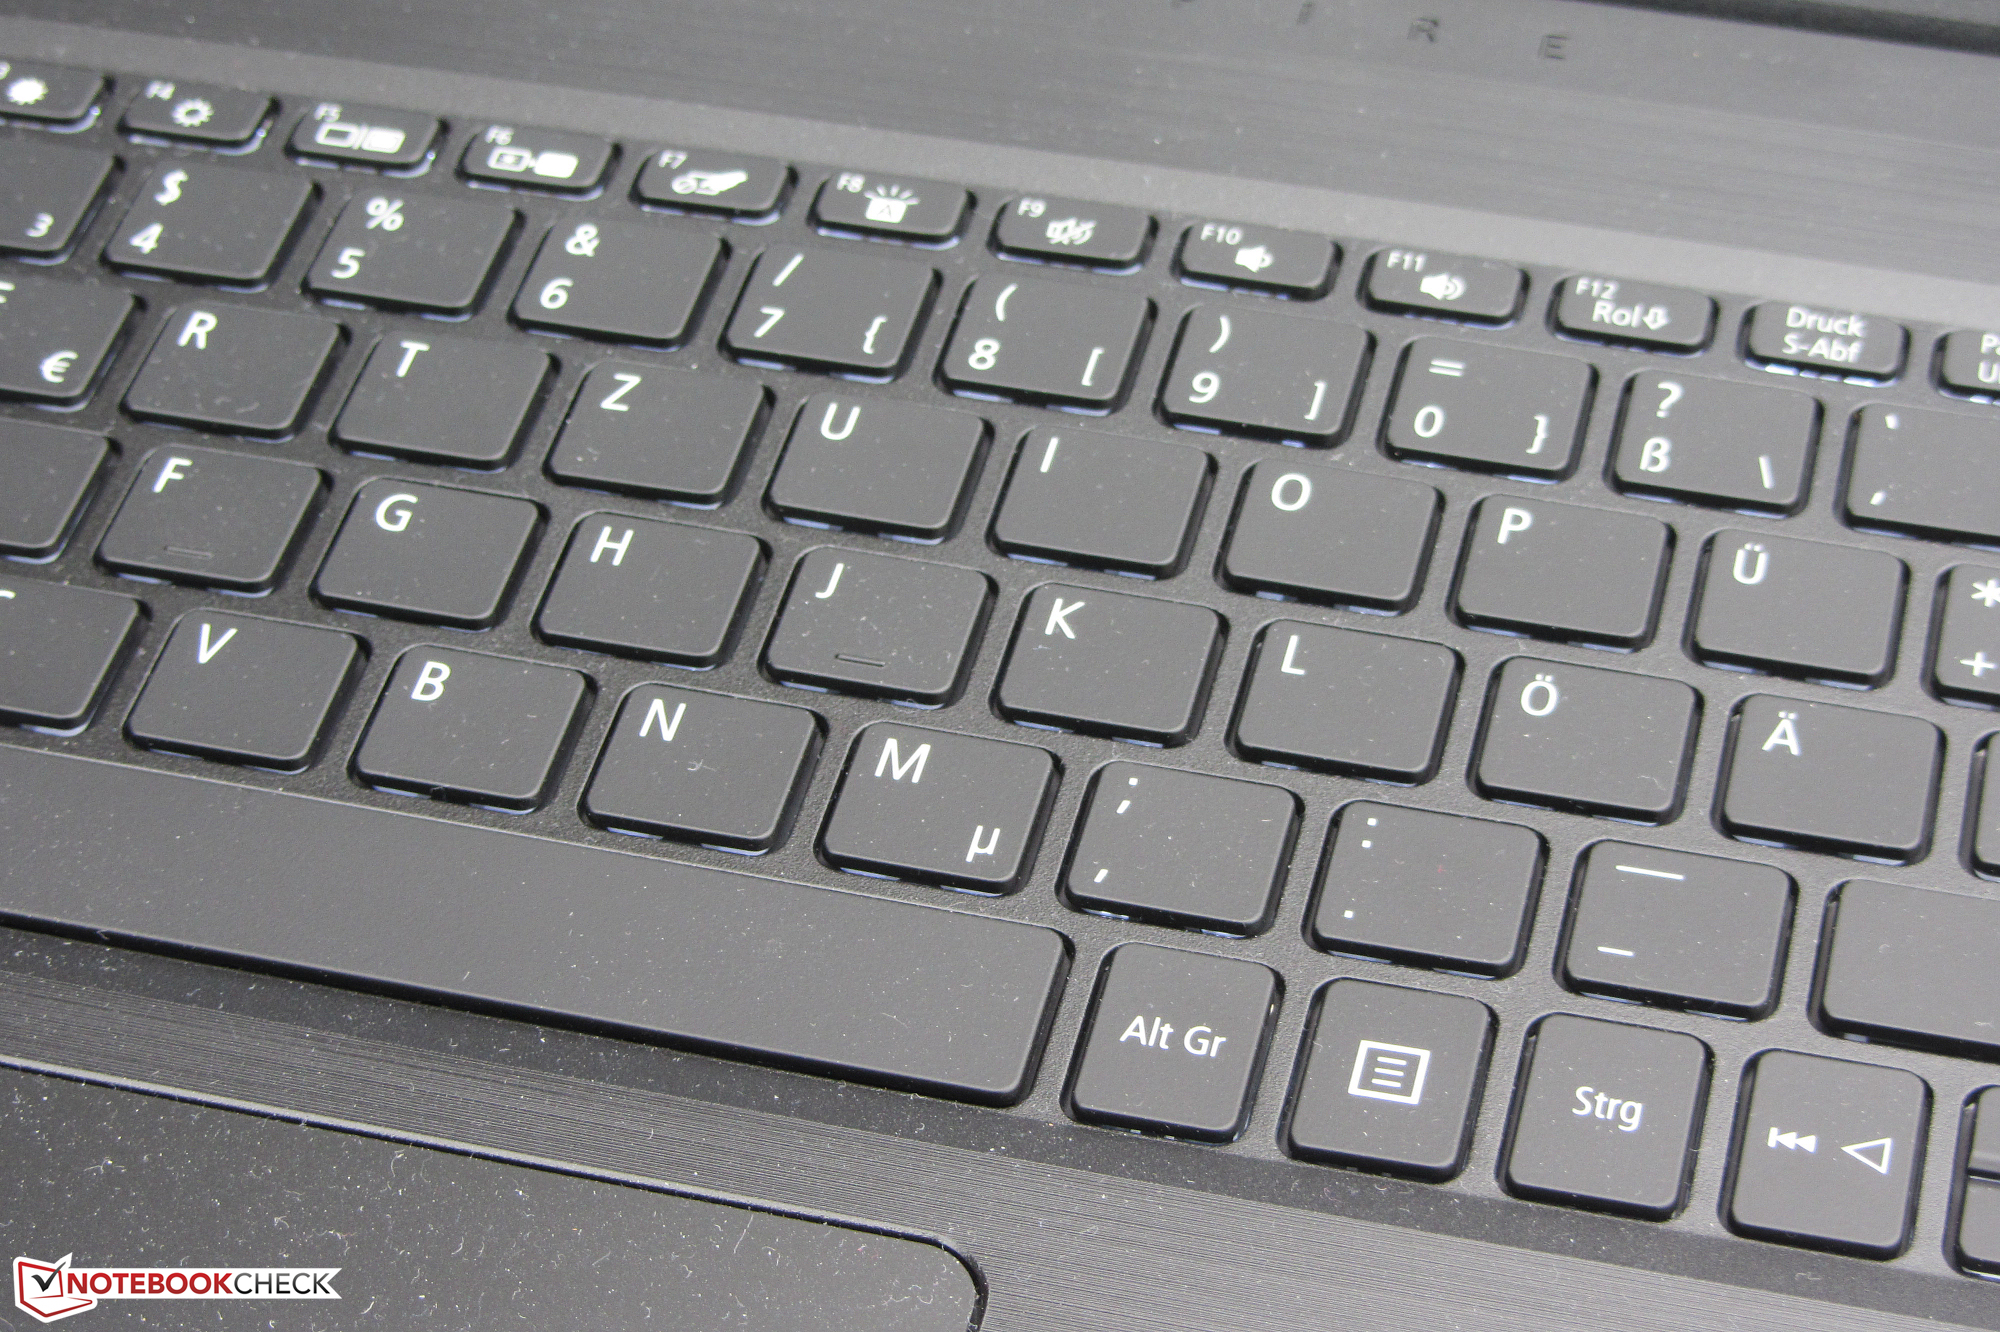
O Aspire tem um teclado decente com luz de fundo (um nível de brilho) e bons tempos de duração da bateria. A tela mate de 15,6 polegadas oferece ângulos de visão estáveis, uma relação de contraste decente a boa, e uma apresentação de cor satisfatória. O brilho da tela deveria ser melhor em um portátil desta faixa de preços.
No geral, ficamos bastante contentes com o Aspire 5. No entanto, o dispositivo não conta com um ponto de vendas singular. Usuários que não precisam de uma CPU da mais nova geração e estão satisfeitos com um máximo de 12 GB de RAM podem querer dar uma olhada no modelo anterior, o Acer Aspire 5 A515-51G. O desempenho de jogos da nossa unidade de teste está no mesmo nível do seu antecessor. Esta seria uma maneira de economizar um pouco de dinheiro dado que um modelo A515-51G com uma configuração semelhante à que nossa unidade de teste de hoje está disponível por $580.
Acer Aspire 5 A515-52G-53PU
- 11/01/2018 v6 (old)
Sascha Mölck
Price comparison
