Breve Análise do Portátil Dell G3 15 3579 (i5-8300H, GTX 1050, FHD)
| SD Card Reader | |
| average JPG Copy Test (av. of 3 runs) | |
| MSI GS63VR 7RG-005 (Toshiba Exceria Pro SDXC 64 GB UHS-II) | |
| Dell Inspiron 15 7000 7577 4K (Toshiba Exceria Pro SDXC 64 GB UHS-II) | |
| Dell G3 15 3579 (Toshiba Exceria Pro SDXC 64 GB UHS-II) | |
| MSI GL63 8RC-069US (Toshiba Exceria Pro SDXC 64 GB UHS-II) | |
| maximum AS SSD Seq Read Test (1GB) | |
| MSI GS63VR 7RG-005 (Toshiba Exceria Pro SDXC 64 GB UHS-II) | |
| Dell Inspiron 15 7000 7577 4K (Toshiba Exceria Pro SDXC 64 GB UHS-II) | |
| Dell G3 15 3579 (Toshiba Exceria Pro SDXC 64 GB UHS-II) | |
| MSI GL63 8RC-069US (Toshiba Exceria Pro SDXC 64 GB UHS-II) | |
| Networking | |
| iperf3 transmit AX12 | |
| Lenovo Yoga 730-15IKB | |
| Dell Inspiron 15 7000 7577 4K | |
| Dell G3 15 3579 | |
| MSI GL63 8RC-069US | |
| iperf3 receive AX12 | |
| Dell Inspiron 15 7000 7577 4K | |
| Lenovo Yoga 730-15IKB | |
| MSI GL63 8RC-069US | |
| Dell G3 15 3579 | |
| |||||||||||||||||||||||||
iluminação: 81 %
iluminação com acumulador: 208.2 cd/m²
Contraste: 612:1 (Preto: 0.34 cd/m²)
ΔE ColorChecker Calman: 4.65 | ∀{0.5-29.43 Ø4.71}
calibrated: 3.84
ΔE Greyscale Calman: 4.1 | ∀{0.09-98 Ø4.96}
57.9% sRGB (Argyll 1.6.3 3D)
36.7% AdobeRGB 1998 (Argyll 1.6.3 3D)
39.75% AdobeRGB 1998 (Argyll 3D)
57.9% sRGB (Argyll 3D)
38.48% Display P3 (Argyll 3D)
Gamma: 2.3
CCT: 7352 K
| Dell G3 15 3579 LG Philips LP156WF6, IPS, 15.6", 1920x1080 | MSI GL63 8RC-069US LG Philips LP156WF6-SPK6, IPS, 15.6", 1920x1080 | Asus FX504GD AU Optronics B156HTN03.8, TN LED, 15.6", 1920x1080 | Dell Inspiron 15 7000 7577 4K Name: AU Optronics B156ZAN, IPS, 15.6", 3840x2160 | Dell Inspiron 15 7000 7577 ID: LG Philips LGD053F, Name: 156WF6, Dell P/N: 4XK13, IPS, 15.6", 1920x1080 | |
|---|---|---|---|---|---|
| Display | 2% | -4% | 74% | 5% | |
| Display P3 Coverage (%) | 38.48 | 39.4 2% | 37.09 -4% | 68.4 78% | 40.4 5% |
| sRGB Coverage (%) | 57.9 | 59.2 2% | 55.8 -4% | 97.1 68% | 60.5 4% |
| AdobeRGB 1998 Coverage (%) | 39.75 | 40.72 2% | 38.34 -4% | 69.6 75% | 41.77 5% |
| Response Times | -4% | 3% | -16% | -24% | |
| Response Time Grey 50% / Grey 80% * (ms) | 32.4 ? | 33.6 ? -4% | 41.6 ? -28% | 35.2 ? -9% | 41 ? -27% |
| Response Time Black / White * (ms) | 23.2 ? | 24 ? -3% | 15.2 ? 34% | 28.4 ? -22% | 28 ? -21% |
| PWM Frequency (Hz) | |||||
| Screen | 6% | -19% | 33% | 25% | |
| Brightness middle (cd/m²) | 208.2 | 286.5 38% | 260 25% | 322.9 55% | 257 23% |
| Brightness (cd/m²) | 203 | 258 27% | 241 19% | 309 52% | 229 13% |
| Brightness Distribution (%) | 81 | 82 1% | 85 5% | 90 11% | 84 4% |
| Black Level * (cd/m²) | 0.34 | 0.34 -0% | 0.55 -62% | 0.36 -6% | 0.17 50% |
| Contrast (:1) | 612 | 843 38% | 473 -23% | 897 47% | 1512 147% |
| Colorchecker dE 2000 * | 4.65 | 5.57 -20% | 7 -51% | 3.99 14% | 5.34 -15% |
| Colorchecker dE 2000 max. * | 15.99 | 16.8 -5% | 22.52 -41% | 8.97 44% | 9.99 38% |
| Colorchecker dE 2000 calibrated * | 3.84 | 4.16 -8% | 5.27 -37% | ||
| Greyscale dE 2000 * | 4.1 | 4.6 -12% | 6.1 -49% | 5.3 -29% | 4.82 -18% |
| Gamma | 2.3 96% | 2.15 102% | 1.97 112% | 2.041 108% | 2.46 89% |
| CCT | 7352 88% | 7564 86% | 7894 82% | 6941 94% | 6587 99% |
| Color Space (Percent of AdobeRGB 1998) (%) | 36.7 | 37.4 2% | 35.5 -3% | 62.9 71% | 38 4% |
| Color Space (Percent of sRGB) (%) | 57.9 | 58.9 2% | 61 5% | 96.8 67% | 60 4% |
| Média Total (Programa/Configurações) | 1% /
4% | -7% /
-14% | 30% /
34% | 2% /
14% |
* ... menor é melhor
Exibir tempos de resposta
| ↔ Tempo de resposta preto para branco | ||
|---|---|---|
| 23.2 ms ... ascensão ↗ e queda ↘ combinadas | ↗ 13.2 ms ascensão | 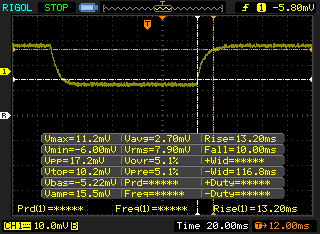 |
| ↘ 10 ms queda | ||
| A tela mostra boas taxas de resposta em nossos testes, mas pode ser muito lenta para jogadores competitivos. Em comparação, todos os dispositivos testados variam de 0.1 (mínimo) a 240 (máximo) ms. » 53 % de todos os dispositivos são melhores. Isso significa que o tempo de resposta medido é pior que a média de todos os dispositivos testados (19.8 ms). | ||
| ↔ Tempo de resposta 50% cinza a 80% cinza | ||
| 32.4 ms ... ascensão ↗ e queda ↘ combinadas | ↗ 14.8 ms ascensão | 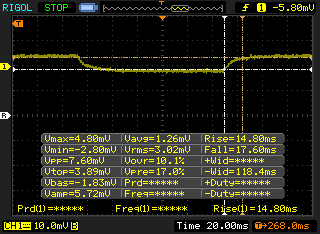 |
| ↘ 17.6 ms queda | ||
| A tela mostra taxas de resposta lentas em nossos testes e será insatisfatória para os jogadores. Em comparação, todos os dispositivos testados variam de 0.165 (mínimo) a 636 (máximo) ms. » 44 % de todos os dispositivos são melhores. Isso significa que o tempo de resposta medido é semelhante à média de todos os dispositivos testados (31 ms). | ||
Cintilação da tela / PWM (modulação por largura de pulso)
| Tela tremeluzindo / PWM não detectado | 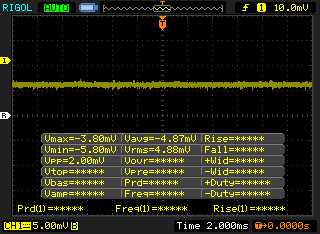 | ||
[pwm_comparison] Em comparação: 52 % de todos os dispositivos testados não usam PWM para escurecer a tela. Se PWM foi detectado, uma média de 7754 (mínimo: 5 - máximo: 343500) Hz foi medida. | |||
| Cinebench R15 | |
| CPU Single 64Bit | |
| Asus Chimera G703GI | |
| Eurocom Sky X4C | |
| MSI GT63 Titan 8RG-046 | |
| Média Intel Core i5-8300H (151 - 174, n=17) | |
| Dell G3 15 3579 | |
| Asus FX503VM-EH73 | |
| HP Spectre x360 15-ch011nr | |
| Lenovo Legion Y520-15IKBA-80WY001VGE | |
| Acer Swift 3 SF315-41-R6J9 | |
| Dell Inspiron 15 5579-9672 | |
| Lenovo IdeaPad 720-15IKB | |
| CPU Multi 64Bit | |
| Eurocom Sky X4C | |
| Asus Chimera G703GI | |
| MSI GT63 Titan 8RG-046 | |
| Dell G3 15 3579 | |
| Média Intel Core i5-8300H (609 - 850, n=17) | |
| Asus FX503VM-EH73 | |
| Acer Swift 3 SF315-41-R6J9 | |
| Dell Inspiron 15 5579-9672 | |
| HP Spectre x360 15-ch011nr | |
| Lenovo Legion Y520-15IKBA-80WY001VGE | |
| Lenovo IdeaPad 720-15IKB | |
| PCMark 10 - Score | |
| Asus FX503VM-EH73 | |
| Lenovo Yoga 730-15IKB | |
| Dell Inspiron 15 7000 7577 4K | |
| MSI GL63 8RC-069US | |
| Média Intel Core i5-8300H, NVIDIA GeForce GTX 1050 Mobile (3050 - 4479, n=6) | |
| Dell G3 15 3579 | |
| PCMark 8 Home Score Accelerated v2 | 3930 pontos | |
| PCMark 8 Work Score Accelerated v2 | 4922 pontos | |
| PCMark 10 Score | 3050 pontos | |
Ajuda | ||
| Dell G3 15 3579 Seagate Mobile HDD 1TB ST1000LX015-1U7172 | Asus VivoBook 15 F510UF-ES71 Seagate Mobile HDD 1TB ST1000LM035 | Asus FX504GD Seagate Mobile HDD 1TB ST1000LX015-1U7172 | Dell Latitude 7490 Toshiba KSG60ZMV256G | Dell Inspiron 15 7000 7577 Seagate Mobile HDD 1TB ST1000LX015-1U7172 | |
|---|---|---|---|---|---|
| CrystalDiskMark 5.2 / 6 | 117% | 18% | 10991% | 3% | |
| Write 4K (MB/s) | 0.202 | 1.283 535% | 0.27 34% | 79.4 39207% | 0.42 108% |
| Read 4K (MB/s) | 0.461 | 0.493 7% | 0.586 27% | 27.37 5837% | 0.41 -11% |
| Write Seq (MB/s) | 53.5 | 79.3 48% | 86.8 62% | 343.9 543% | 55.6 4% |
| Read Seq (MB/s) | 107.2 | 136.7 28% | 113.2 6% | 472.7 341% | 114.3 7% |
| Write 4K Q32T1 (MB/s) | 0.882 | 2.266 157% | 0.242 -73% | 206 23256% | 0.238 -73% |
| Read 4K Q32T1 (MB/s) | 1.057 | 1.068 1% | 0.963 -9% | 188.3 17715% | 0.942 -11% |
| Write Seq Q32T1 (MB/s) | 63.7 | 108.7 71% | 98.4 54% | 343.3 439% | 68.2 7% |
| Read Seq Q32T1 (MB/s) | 77.1 | 143.7 86% | 110.2 43% | 533 591% | 69.6 -10% |

| 3DMark 11 | |
| 1280x720 Performance GPU | |
| Alienware 15 R4 | |
| MSI GV62 8RE-016US | |
| Razer Blade 15 GTX 1060 | |
| Asus Strix GL502VY-DS71 | |
| Alienware 13 R3 (i5-7300HQ, GTX 1050 Ti) | |
| Zotac GeForce GTX 1050 2GB | |
| Média NVIDIA GeForce GTX 1050 Mobile (6744 - 8903, n=42) | |
| Dell G3 15 3579 | |
| Asus GL552VW-DH74 | |
| HP Spectre x360 15-ch011nr | |
| Acer Aspire E5-575G-549D | |
| 1280x720 Performance Combined | |
| Alienware 15 R4 | |
| Razer Blade 15 GTX 1060 | |
| Asus Strix GL502VY-DS71 | |
| MSI GV62 8RE-016US | |
| Zotac GeForce GTX 1050 2GB | |
| Dell G3 15 3579 | |
| Média NVIDIA GeForce GTX 1050 Mobile (4446 - 7607, n=42) | |
| Alienware 13 R3 (i5-7300HQ, GTX 1050 Ti) | |
| Asus GL552VW-DH74 | |
| HP Spectre x360 15-ch011nr | |
| Acer Aspire E5-575G-549D | |
| 3DMark | |
| 1280x720 Cloud Gate Standard Graphics | |
| Alienware 15 R4 | |
| MSI GV62 8RE-016US | |
| Razer Blade 15 GTX 1060 | |
| Asus Strix GL502VY-DS71 | |
| Alienware 13 R3 (i5-7300HQ, GTX 1050 Ti) | |
| Zotac GeForce GTX 1050 2GB | |
| Dell G3 15 3579 | |
| Média NVIDIA GeForce GTX 1050 Mobile (14979 - 40201, n=40) | |
| Asus GL552VW-DH74 | |
| Acer Aspire E5-575G-549D | |
| HP Spectre x360 15-ch011nr | |
| 1920x1080 Fire Strike Graphics | |
| Alienware 15 R4 | |
| MSI GV62 8RE-016US | |
| Razer Blade 15 GTX 1060 | |
| Asus Strix GL502VY-DS71 | |
| Alienware 13 R3 (i5-7300HQ, GTX 1050 Ti) | |
| Zotac GeForce GTX 1050 2GB | |
| Dell G3 15 3579 | |
| Média NVIDIA GeForce GTX 1050 Mobile (4935 - 6651, n=43) | |
| Asus GL552VW-DH74 | |
| HP Spectre x360 15-ch011nr | |
| Acer Aspire E5-575G-549D | |
| 3DMark 11 Performance | 7741 pontos | |
| 3DMark Cloud Gate Standard Score | 21325 pontos | |
| 3DMark Fire Strike Score | 5640 pontos | |
Ajuda | ||
| baixo | média | alto | ultra | |
|---|---|---|---|---|
| BioShock Infinite (2013) | 224 | 184 | 163 | 65.4 |
| The Witcher 3 (2015) | 113.9 | 68.9 | 39.4 | 22 |
| Rise of the Tomb Raider (2016) | 94.3 | 73.5 | 39.1 | 33 |
Barulho
| Ocioso |
| 29.8 / 29.8 / 30 dB |
| Carga |
| 38.6 / 49.4 dB |
 | ||
30 dB silencioso 40 dB(A) audível 50 dB(A) ruidosamente alto |
||
min: | ||
| Dell G3 15 3579 GeForce GTX 1050 Mobile, i5-8300H, Seagate Mobile HDD 1TB ST1000LX015-1U7172 | MSI GL63 8RC-069US GeForce GTX 1050 Mobile, i5-8300H, Toshiba HG6 THNSNJ256G8NY | Lenovo Yoga 730-15IKB GeForce GTX 1050 Mobile, i5-8550U, SK Hynix PC401 512GB M.2 (HFS512GD9TNG) | Dell Inspiron 15 7000 7577 4K GeForce GTX 1060 Max-Q, i7-7700HQ, SK hynix SC311 M.2 | Alienware 13 R3 (i5-7300HQ, GTX 1050 Ti) GeForce GTX 1050 Ti Mobile, i5-7300HQ, Samsung PM961 MZVLW256HEHP | |
|---|---|---|---|---|---|
| Noise | -2% | 2% | 3% | 4% | |
| desligado / ambiente * (dB) | 28 | 28.6 -2% | 30.5 -9% | 28.5 -2% | 29.7 -6% |
| Idle Minimum * (dB) | 29.8 | 28.6 4% | 30.5 -2% | 28.8 3% | 29.7 -0% |
| Idle Average * (dB) | 29.8 | 31.6 -6% | 30.5 -2% | 29.2 2% | 29.7 -0% |
| Idle Maximum * (dB) | 30 | 31.6 -5% | 30.5 -2% | 29.2 3% | 29.7 1% |
| Load Average * (dB) | 38.6 | 38.6 -0% | 37.5 3% | 34.6 10% | 32.7 15% |
| Witcher 3 ultra * (dB) | 46.9 | 40.6 13% | 44.1 6% | 36.4 22% | |
| Load Maximum * (dB) | 49.4 | 56.8 -15% | 37.5 24% | 49.3 -0% | 50 -1% |
* ... menor é melhor
(-) A temperatura máxima no lado superior é 47 °C / 117 F, em comparação com a média de 40.4 °C / 105 F , variando de 21.2 a 68.8 °C para a classe Gaming.
(-) A parte inferior aquece até um máximo de 61.2 °C / 142 F, em comparação com a média de 43.2 °C / 110 F
(+) Em uso inativo, a temperatura média para o lado superior é 30.3 °C / 87 F, em comparação com a média do dispositivo de 33.9 °C / ### class_avg_f### F.
(+) Jogando The Witcher 3, a temperatura média para o lado superior é 31.2 °C / 88 F, em comparação com a média do dispositivo de 33.9 °C / ## #class_avg_f### F.
(+) Os apoios para as mãos e o touchpad são mais frios que a temperatura da pele, com um máximo de 31.6 °C / 88.9 F e, portanto, são frios ao toque.
(-) A temperatura média da área do apoio para as mãos de dispositivos semelhantes foi 28.8 °C / 83.8 F (-2.8 °C / -5.1 F).
Dell G3 15 3579 análise de áudio
(±) | o volume do alto-falante é médio, mas bom (###valor### dB)
Graves 100 - 315Hz
(-) | quase nenhum baixo - em média 15.5% menor que a mediana
(±) | a linearidade dos graves é média (13.3% delta para a frequência anterior)
Médios 400 - 2.000 Hz
(+) | médios equilibrados - apenas 2.8% longe da mediana
(±) | a linearidade dos médios é média (7.3% delta para frequência anterior)
Altos 2 - 16 kHz
(+) | agudos equilibrados - apenas 3.3% longe da mediana
(±) | a linearidade dos máximos é média (9% delta para frequência anterior)
Geral 100 - 16.000 Hz
(±) | a linearidade do som geral é média (18.1% diferença em relação à mediana)
Comparado com a mesma classe
» 57% de todos os dispositivos testados nesta classe foram melhores, 8% semelhantes, 35% piores
» O melhor teve um delta de 6%, a média foi 18%, o pior foi 132%
Comparado com todos os dispositivos testados
» 39% de todos os dispositivos testados foram melhores, 8% semelhantes, 54% piores
» O melhor teve um delta de 4%, a média foi 23%, o pior foi 134%
Apple MacBook 12 (Early 2016) 1.1 GHz análise de áudio
(+) | os alto-falantes podem tocar relativamente alto (###valor### dB)
Graves 100 - 315Hz
(±) | graves reduzidos - em média 11.3% menor que a mediana
(±) | a linearidade dos graves é média (14.2% delta para a frequência anterior)
Médios 400 - 2.000 Hz
(+) | médios equilibrados - apenas 2.4% longe da mediana
(+) | médios são lineares (5.5% delta para frequência anterior)
Altos 2 - 16 kHz
(+) | agudos equilibrados - apenas 2% longe da mediana
(+) | os máximos são lineares (4.5% delta da frequência anterior)
Geral 100 - 16.000 Hz
(+) | o som geral é linear (10.2% diferença em relação à mediana)
Comparado com a mesma classe
» 7% de todos os dispositivos testados nesta classe foram melhores, 2% semelhantes, 90% piores
» O melhor teve um delta de 5%, a média foi 18%, o pior foi 53%
Comparado com todos os dispositivos testados
» 5% de todos os dispositivos testados foram melhores, 1% semelhantes, 94% piores
» O melhor teve um delta de 4%, a média foi 23%, o pior foi 134%
| desligado | |
| Ocioso | |
| Carga |
|
Key:
min: | |
| Dell G3 15 3579 i5-8300H, GeForce GTX 1050 Mobile, Seagate Mobile HDD 1TB ST1000LX015-1U7172, IPS, 1920x1080, 15.6" | MSI GL63 8RC-069US i5-8300H, GeForce GTX 1050 Mobile, Toshiba HG6 THNSNJ256G8NY, IPS, 1920x1080, 15.6" | Lenovo Yoga 730-15IKB i5-8550U, GeForce GTX 1050 Mobile, SK Hynix PC401 512GB M.2 (HFS512GD9TNG), IPS, 3840x2160, 15.6" | Asus FX504GD i5-8300H, GeForce GTX 1050 Mobile, Seagate Mobile HDD 1TB ST1000LX015-1U7172, TN LED, 1920x1080, 15.6" | Dell Inspiron 15 7000 7577 4K i7-7700HQ, GeForce GTX 1060 Max-Q, SK hynix SC311 M.2, IPS, 3840x2160, 15.6" | |
|---|---|---|---|---|---|
| Power Consumption | 7% | 27% | 8% | 11% | |
| Idle Minimum * (Watt) | 7.9 | 7.1 10% | 4.8 39% | 7.2 9% | 5.5 30% |
| Idle Average * (Watt) | 9.6 | 9.8 -2% | 10.1 -5% | 10.2 -6% | 10.5 -9% |
| Idle Maximum * (Watt) | 13 | 10.4 20% | 10.7 18% | 10.9 16% | 10.9 16% |
| Load Average * (Watt) | 93 | 88.8 5% | 44 53% | 93.3 -0% | 72 23% |
| Witcher 3 ultra * (Watt) | 100.6 | 93.3 7% | 95.8 5% | 97.4 3% | |
| Load Maximum * (Watt) | 132.7 | 132.5 -0% | 94.7 29% | 102.5 23% | 130.4 2% |
* ... menor é melhor
| Dell G3 15 3579 i5-8300H, GeForce GTX 1050 Mobile, 56 Wh | MSI GL63 8RC-069US i5-8300H, GeForce GTX 1050 Mobile, 41 Wh | Lenovo Yoga 730-15IKB i5-8550U, GeForce GTX 1050 Mobile, 51.5 Wh | Asus FX504GD i5-8300H, GeForce GTX 1050 Mobile, 48 Wh | Dell Inspiron 15 7000 7577 4K i7-7700HQ, GeForce GTX 1060 Max-Q, 56 Wh | Asus FX503VM-EH73 i7-7700HQ, GeForce GTX 1060 Mobile, 64 Wh | |
|---|---|---|---|---|---|---|
| Duração da bateria | -51% | -35% | -51% | -25% | -40% | |
| Reader / Idle (h) | 7.3 | 11.6 | 7.5 | 10 | 5.7 | |
| WiFi v1.3 (h) | 6.5 | 4.3 -34% | 6.2 -5% | 3.7 -43% | 5.4 -17% | 4.6 -29% |
| Load (h) | 2.2 | 0.7 -68% | 0.8 -64% | 0.9 -59% | 1.5 -32% | 1.1 -50% |
Pro
Contra
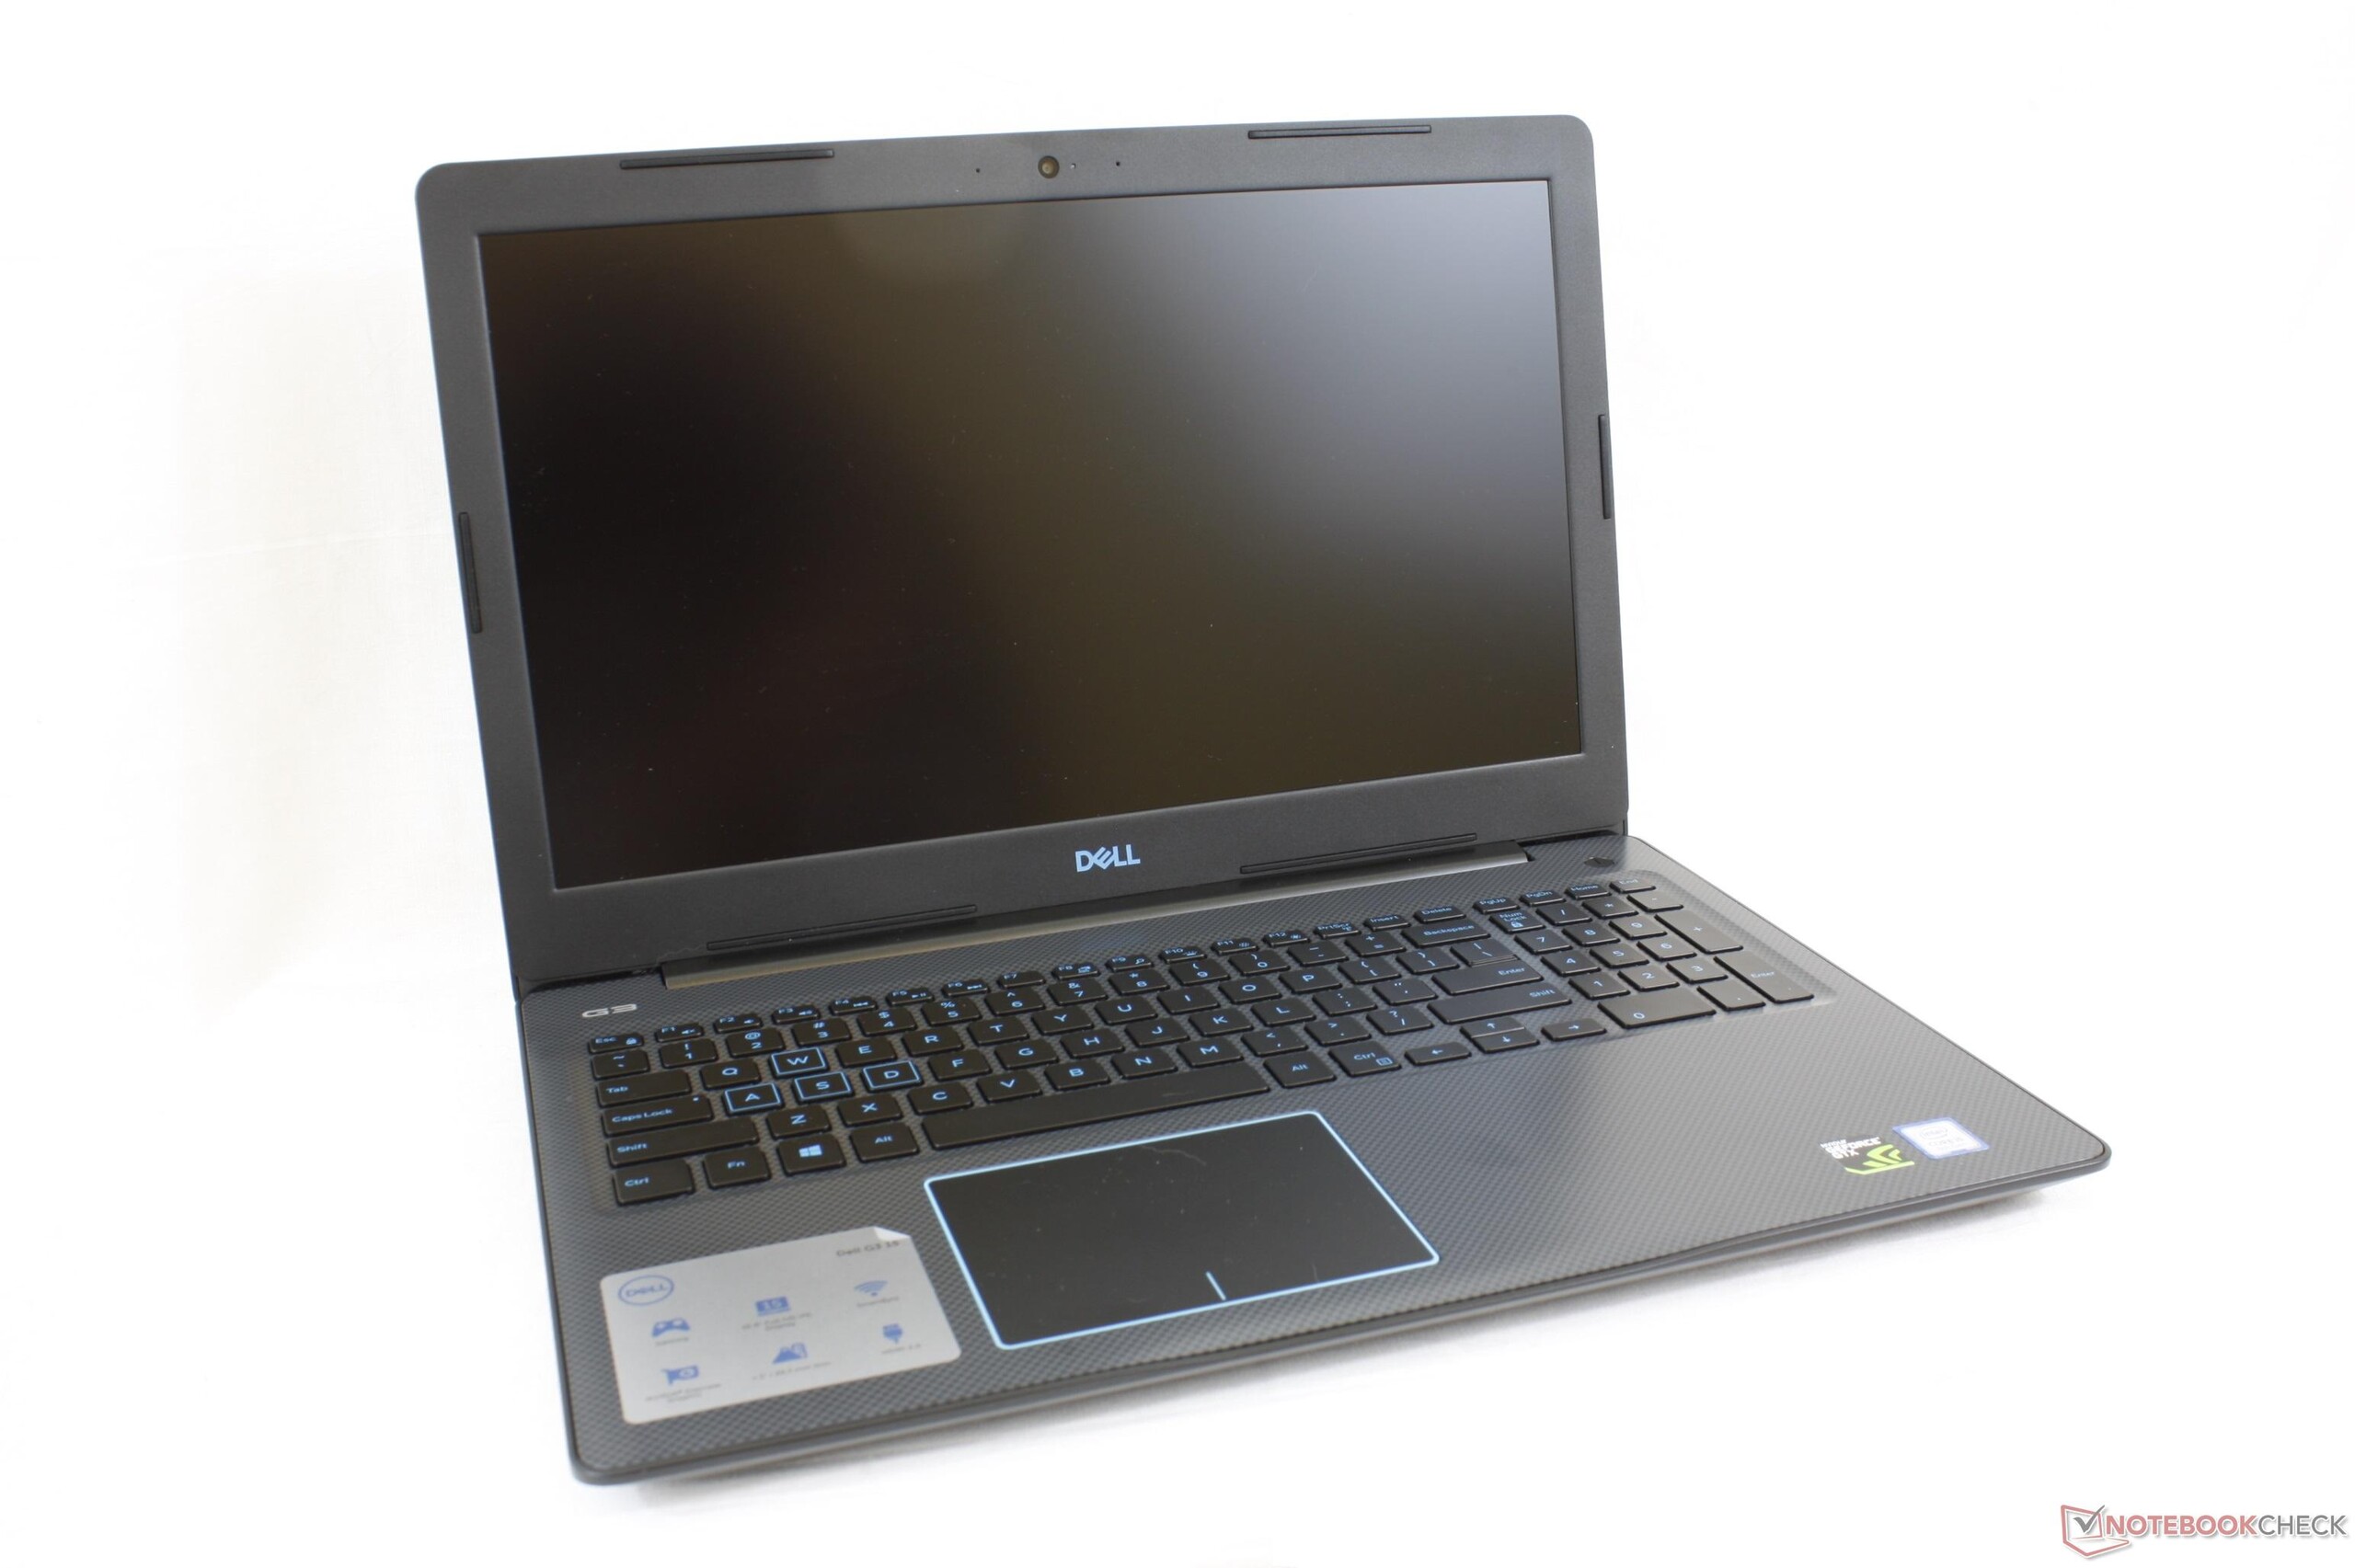
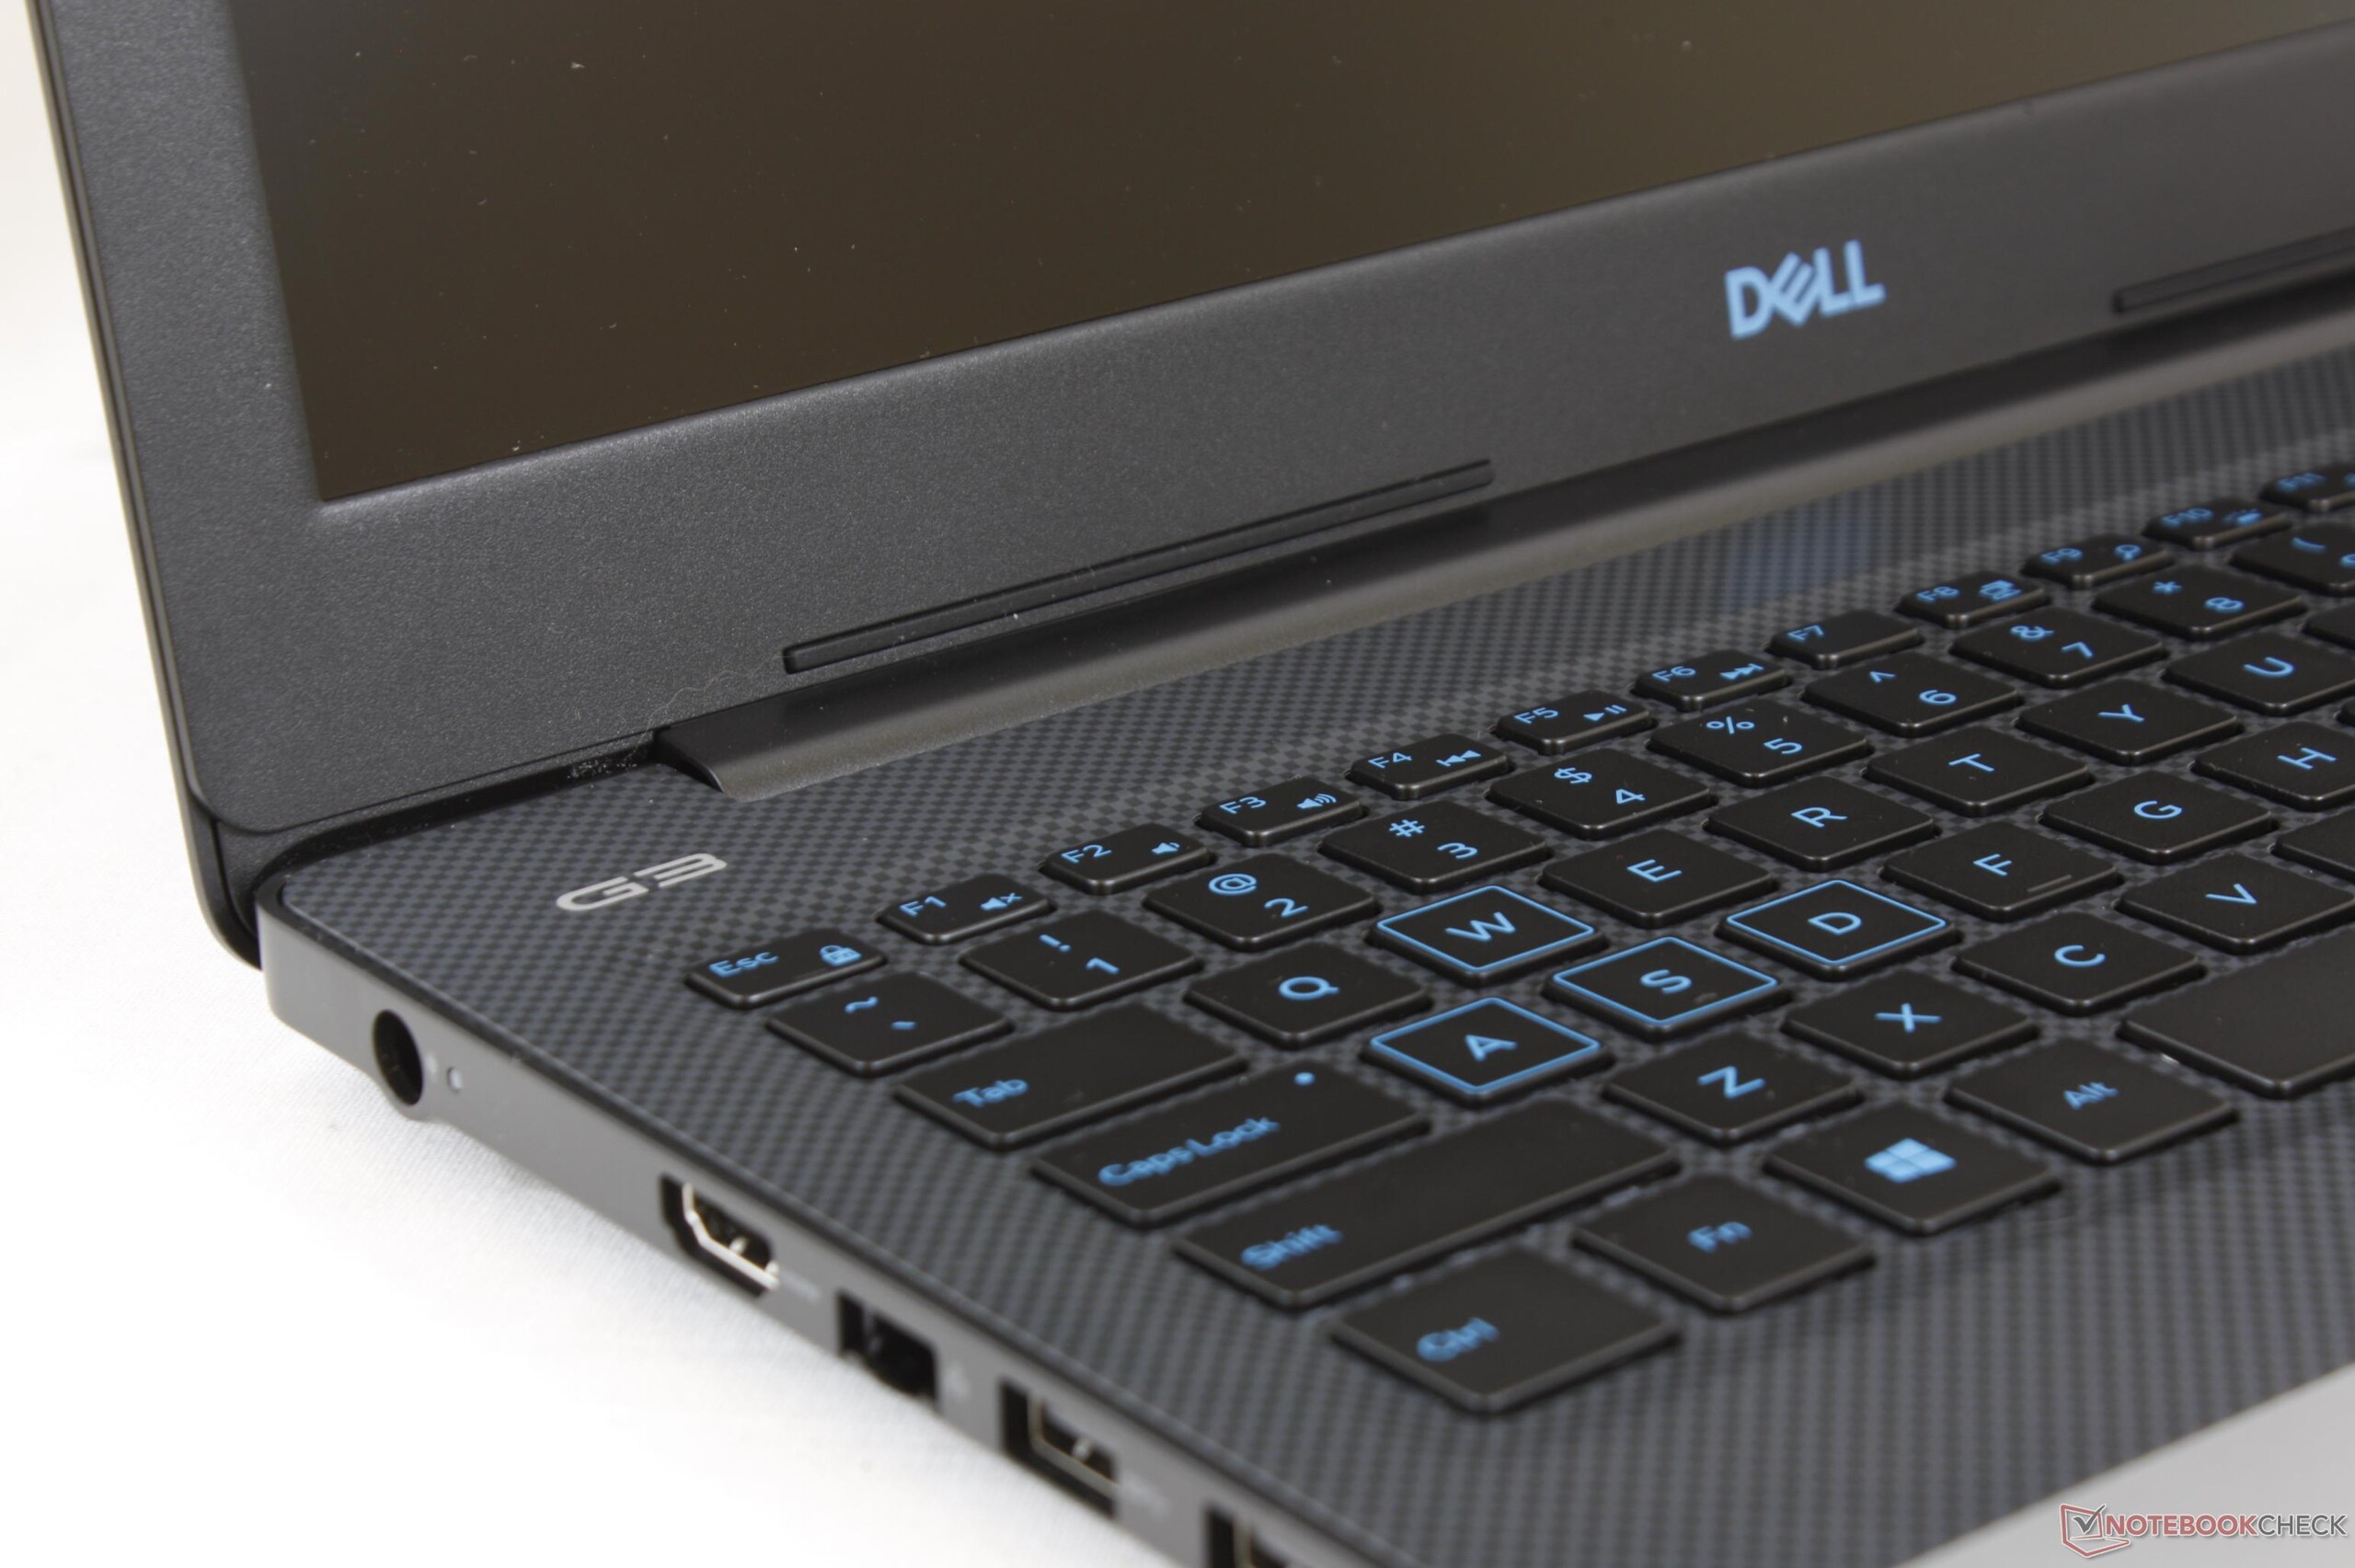
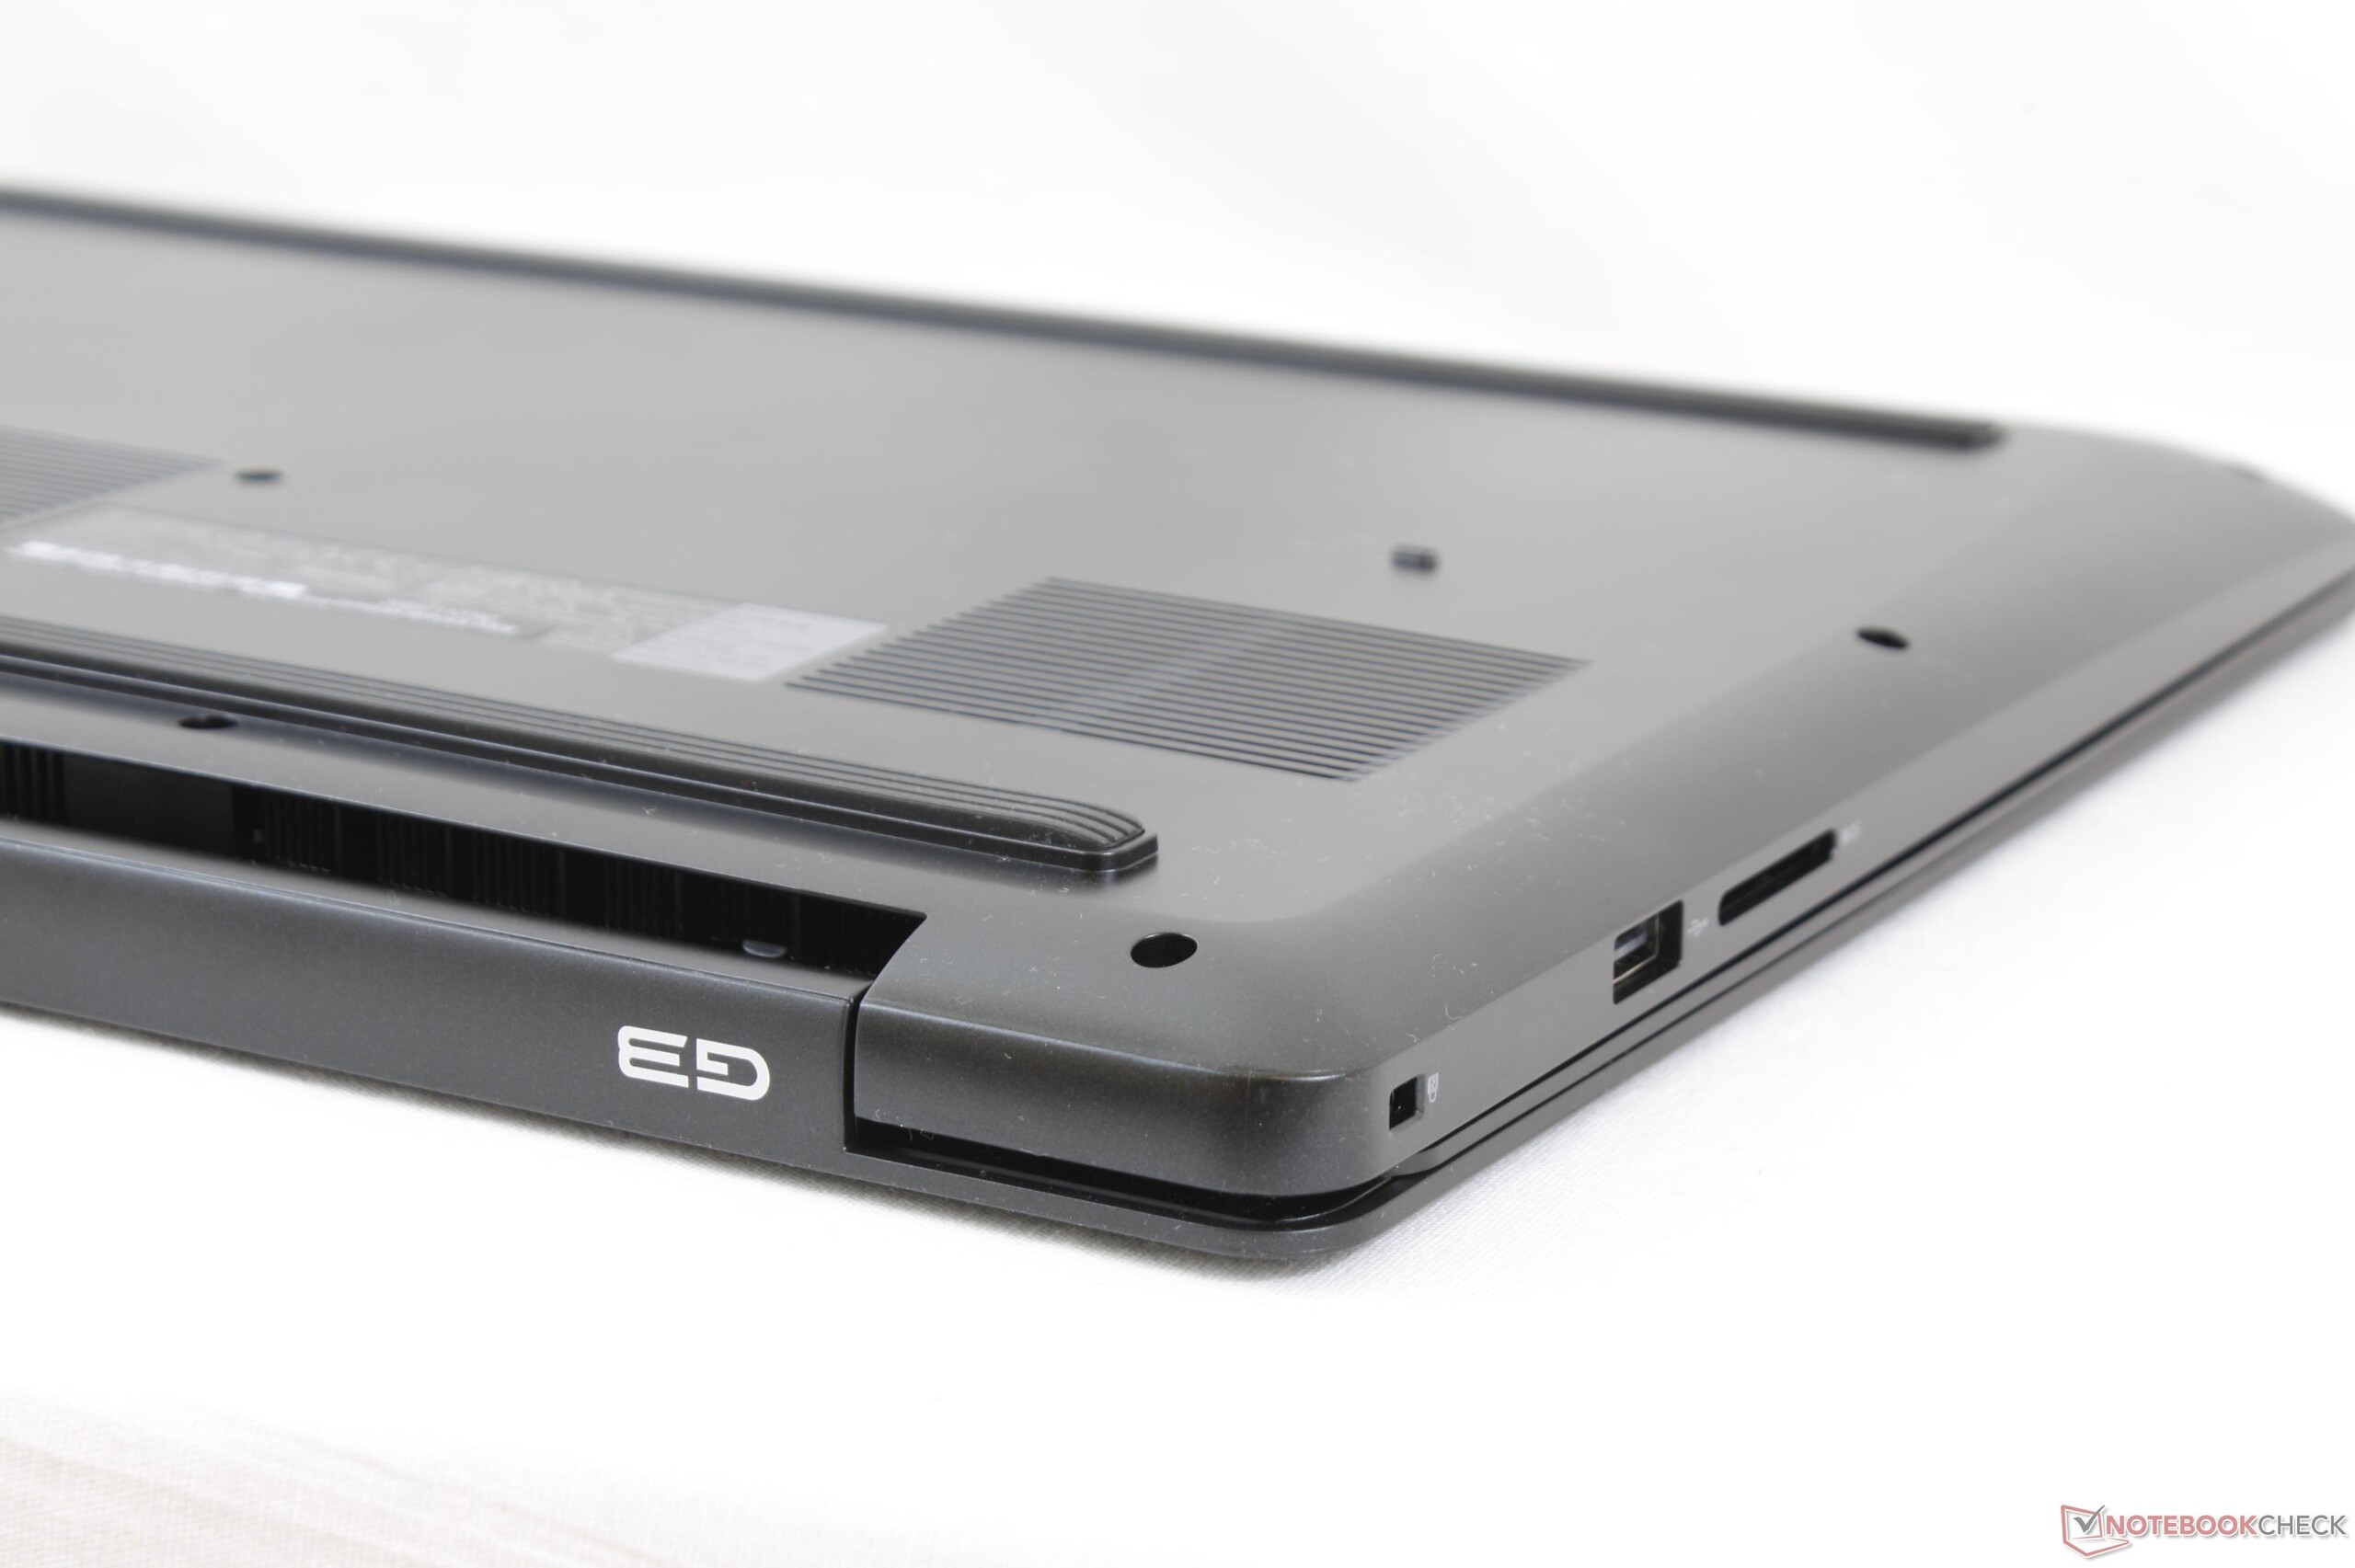
O Dell G3 deve ser um laptop de jogos acessível posicionado abaixo do G5, G7, e série Alienware. Isso certamente dá a impressão apropriada porque, indubitavelmente, parece muito mais barato e mais fraco do que o Inspiron 15 7577 do ano passado. Os pousa palmas de plástico do HP Pavilion, as teclas suaves do teclado, o trackpad macio, a facilidade de manutenção, o WLAN lento 1x1 e a tela escura, são todos indicativos de recortes. Até o USB Type-C é relegado a uma opção em vez de ser um recurso padrão. É difícil ignorar todas as medidas de redução de custos que o G3 15 implica.
Felizmente, o desempenho é o destaque do portátil. O sistema pode manter altas velocidades do Turbo Boost muito melhor do que o esperado e com temperaturas mais baixas durante os jogos. O novo design é relativamente leve e pequeno para o preço e estamos felizes em ver que a opção d o péssimo painel TN finalmente desapareceu. O ruído do ventilador poderia melhorar, porque o sistema é mais barulhento do que muitos de seus concorrentes com a mesma GPU.
É difícil recomendar o G3 15, mesmo que ele tenha um preço a partir de $900 USD. Os usuários estariam melhor investindo no antigo Inspiron 15 7577 com o Core i7-7700HQ, já que ele teria aproximadamente o mesmo desempenho que o nosso G3 com o i5-8300H. O Inspiron é maior e mais pesado, mas compensa suas falhas com a facilidade de manutenção, ventiladores mais silenciosos, porta Thunderbolt 3 e uma qualidade de construção significativamente melhor.
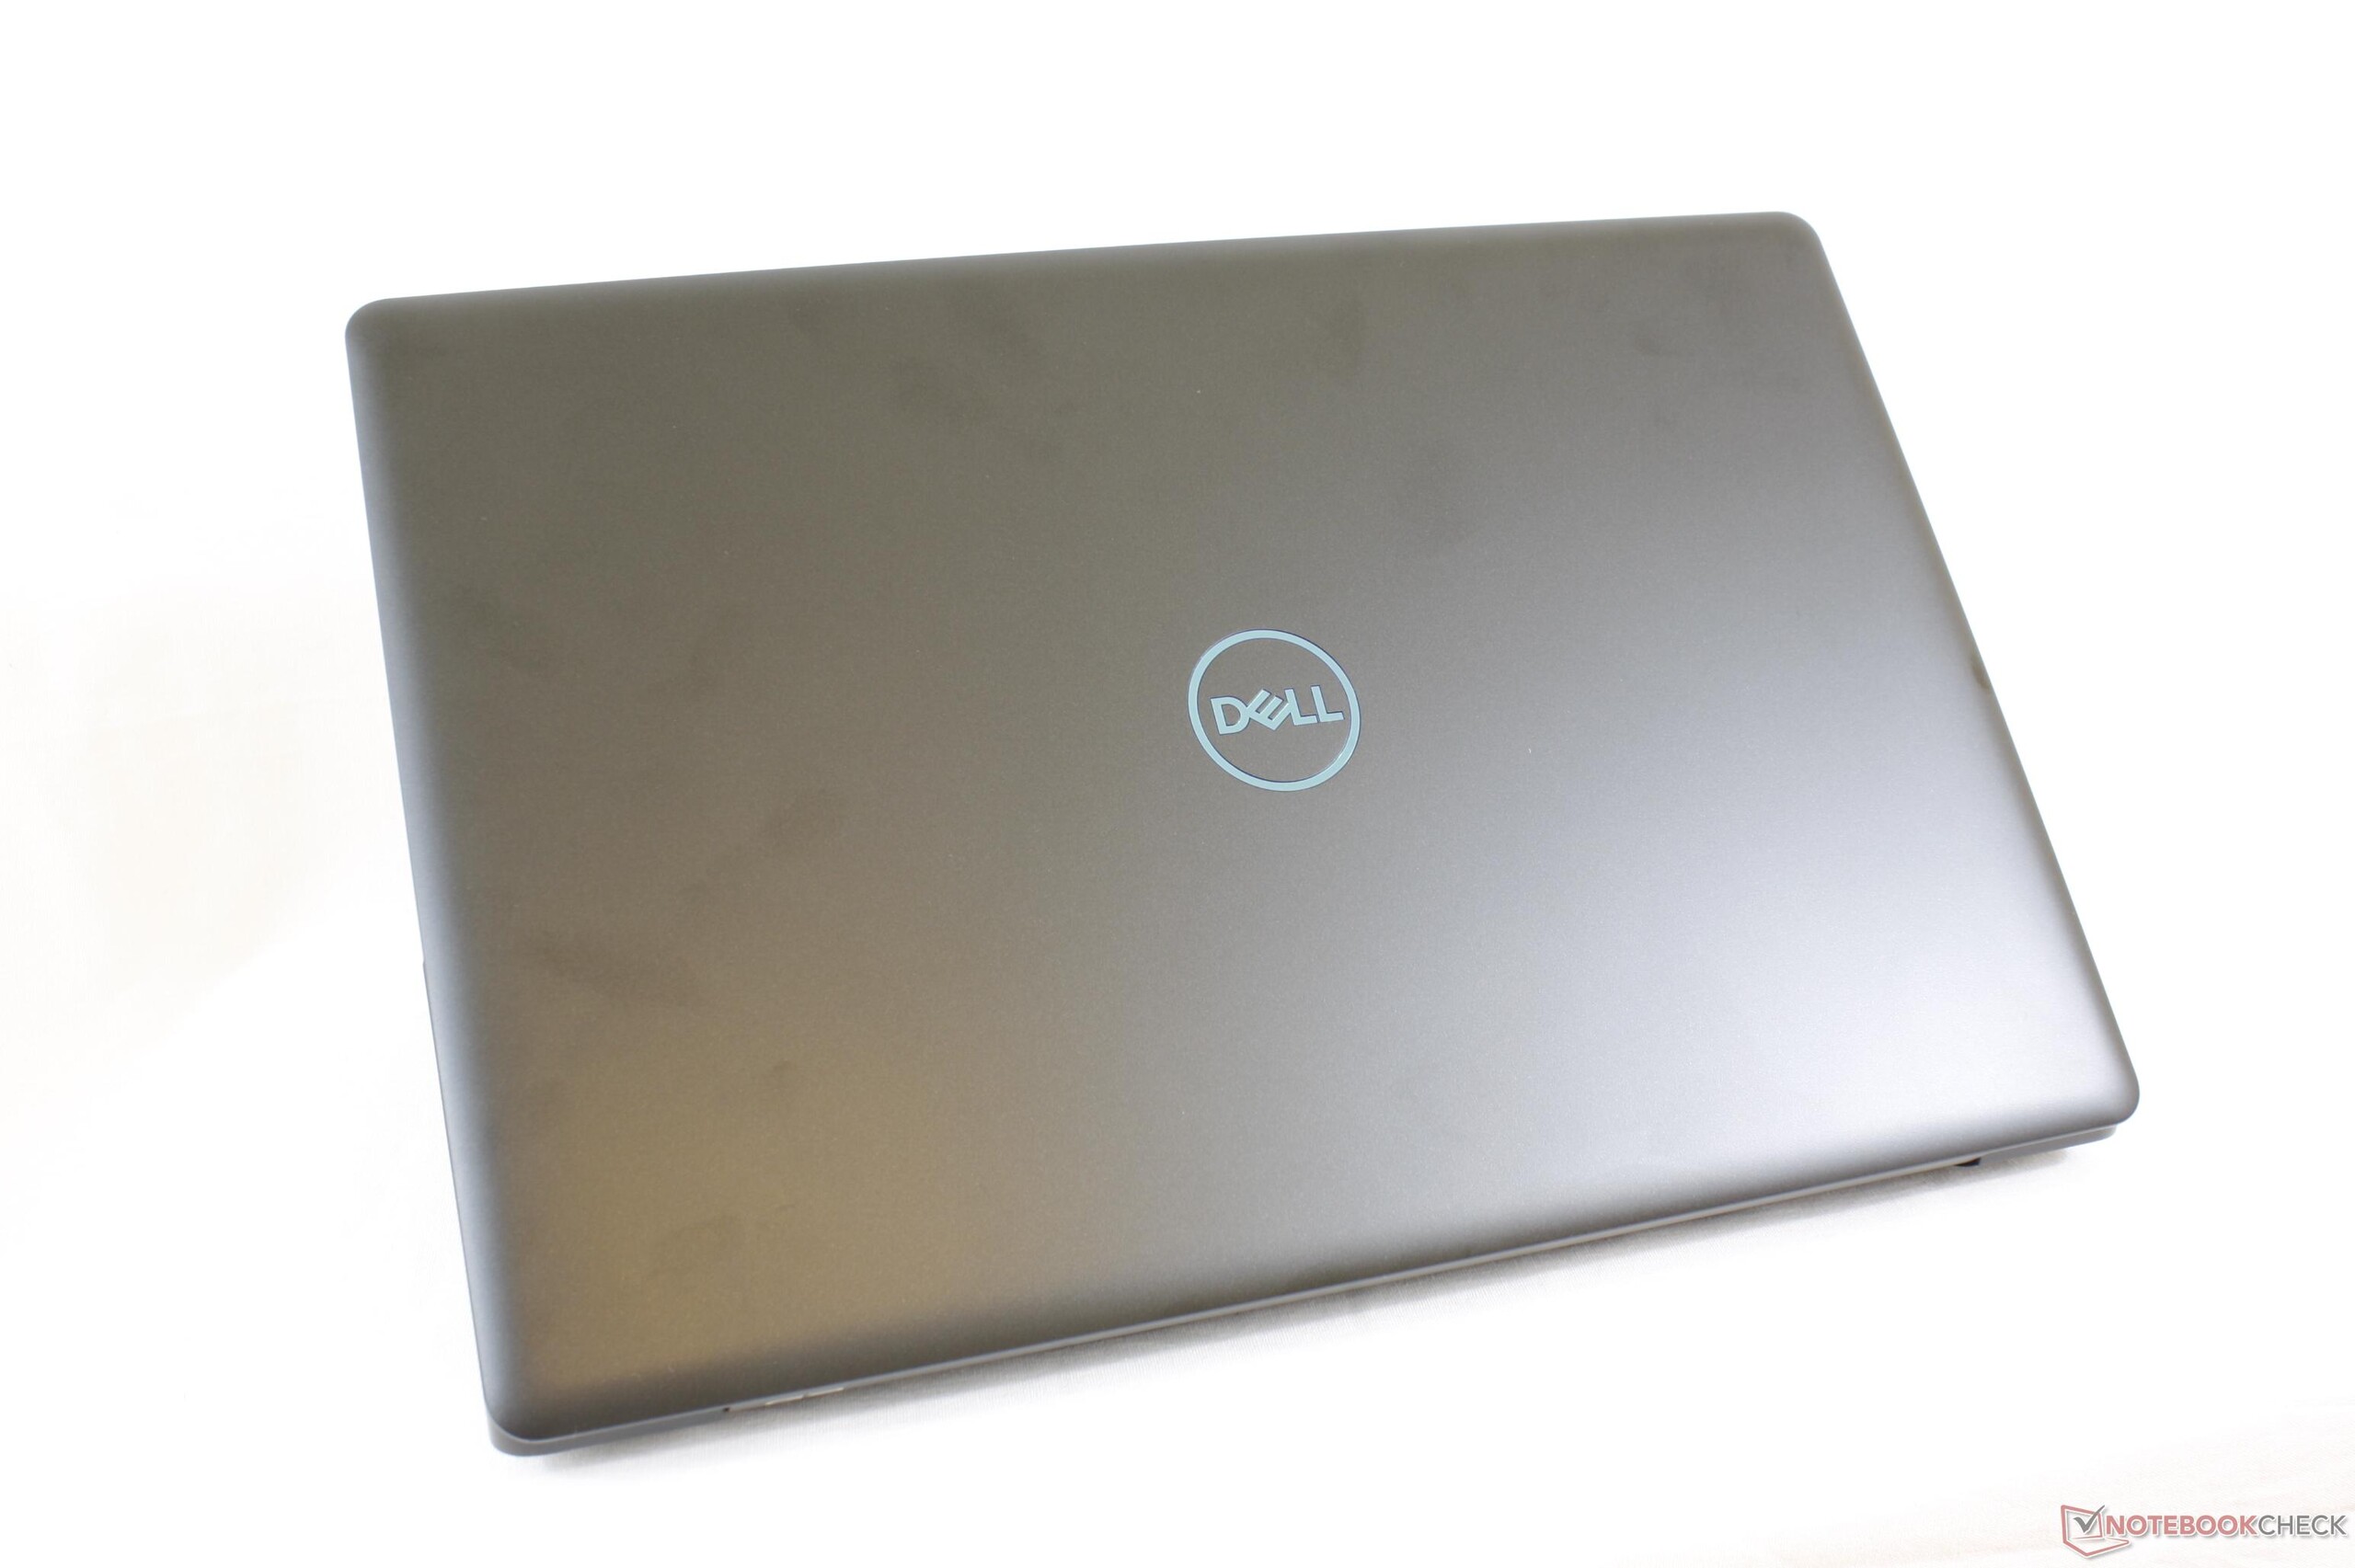
O G3 15 é o portátil de jogos mais barato da Dell e definitivamente não esconde isso. O Inspiron 15 7567 e 7577 do ano passado são melhores em quase todos os aspectos, especialmente agora que podem ser encontrados pelo mesmo preço.
Dell G3 15 3579
- 07/28/2018 v6 (old)
Allen Ngo
Price comparison
