Breve Análise do Portátil Acer Aspire Nitro 5: Um portátil de jogos com duração da bateria decente

| Networking | |
| iperf3 transmit AX12 | |
| Asus TUF FX705GM | |
| Lenovo Legion Y540-17IRH | |
| HP Pavilion Gaming 17-cd0085cl | |
| Acer Aspire Nitro 5 AN517-51-7887 | |
| Asus ROG Strix G GL731GU-RB74 | |
| MSI GL73 8SE-010US | |
| iperf3 receive AX12 | |
| Asus TUF FX705GM | |
| Lenovo Legion Y540-17IRH | |
| Acer Aspire Nitro 5 AN517-51-7887 | |
| HP Pavilion Gaming 17-cd0085cl | |
| MSI GL73 8SE-010US | |
| Asus ROG Strix G GL731GU-RB74 | |
| |||||||||||||||||||||||||
iluminação: 84 %
iluminação com acumulador: 407 cd/m²
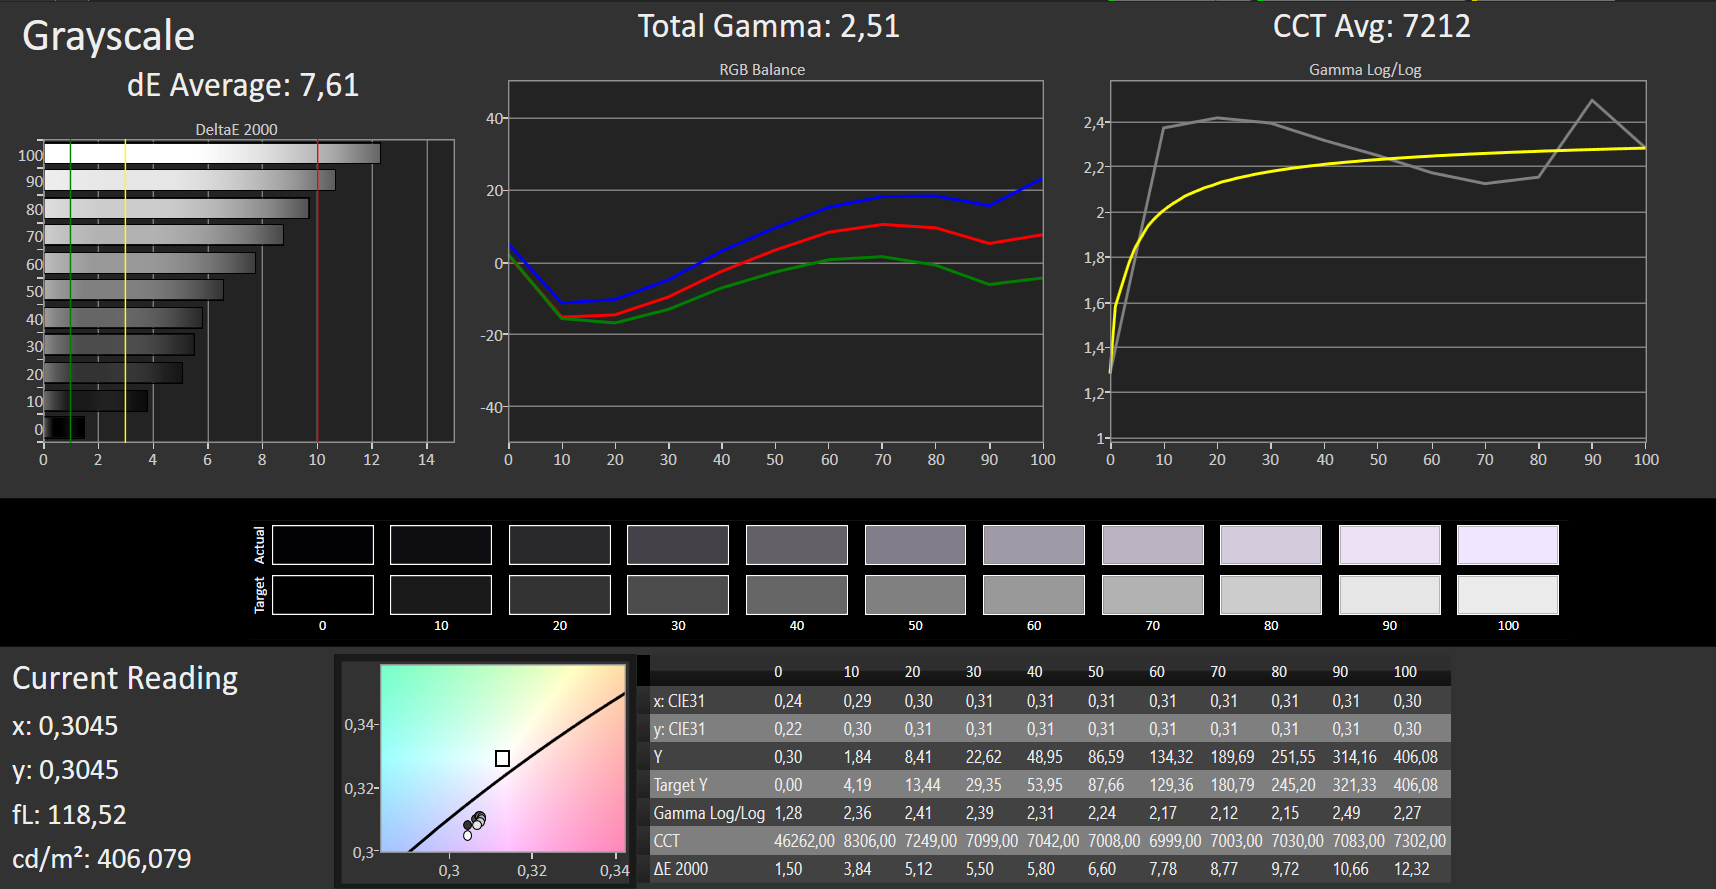
Contraste: 1357:1 (Preto: 0.3 cd/m²)
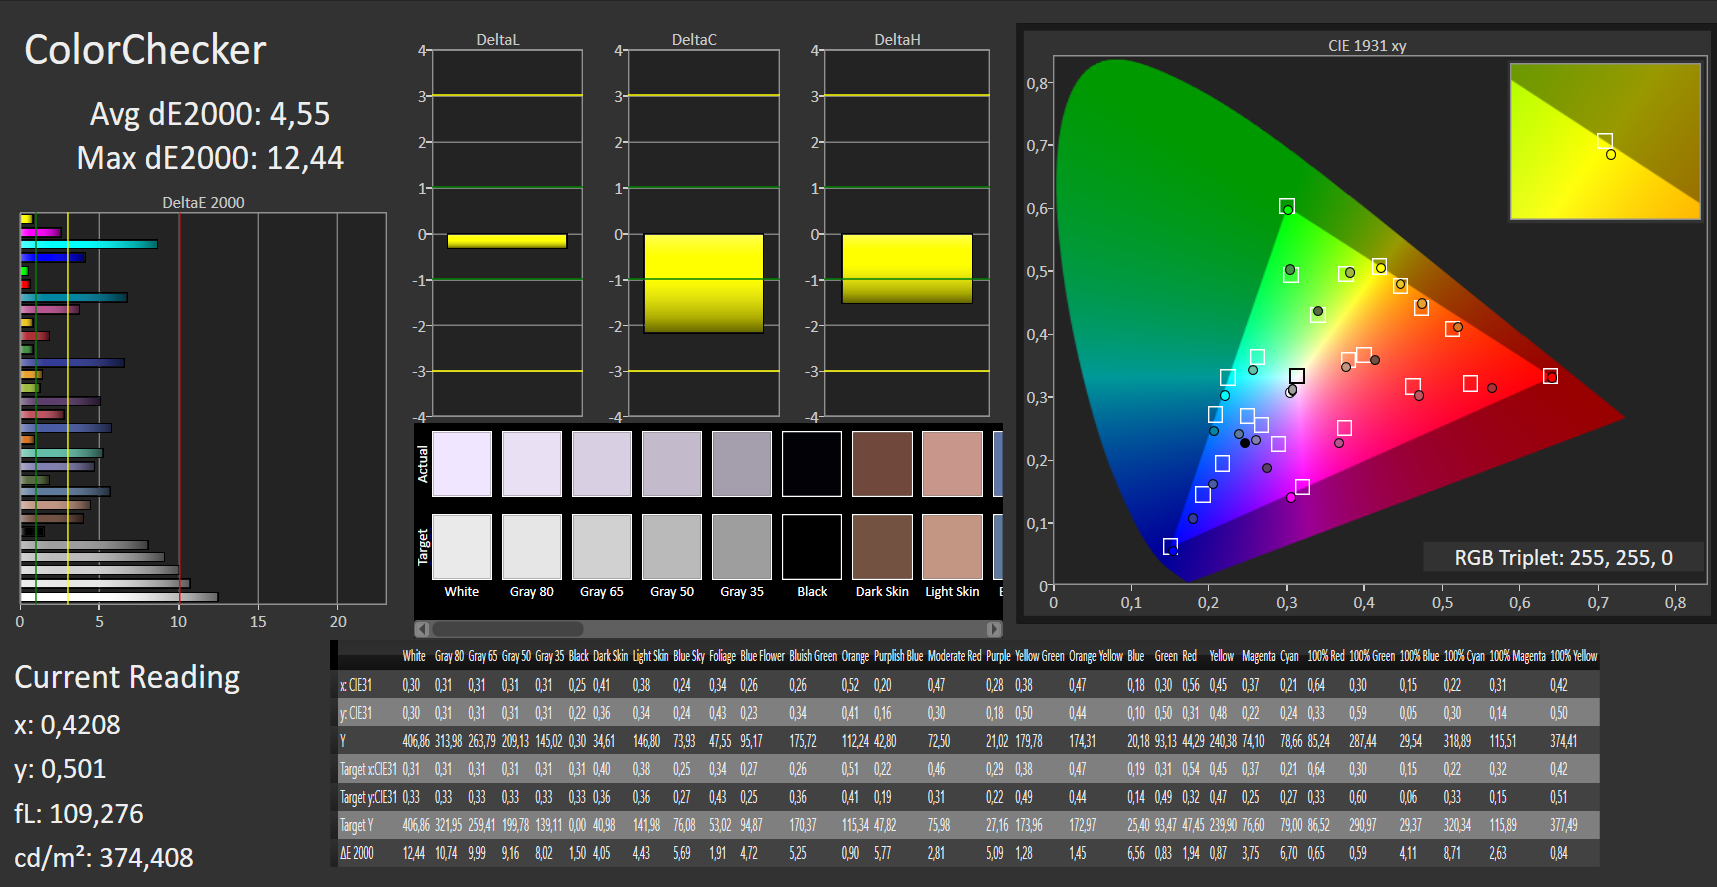
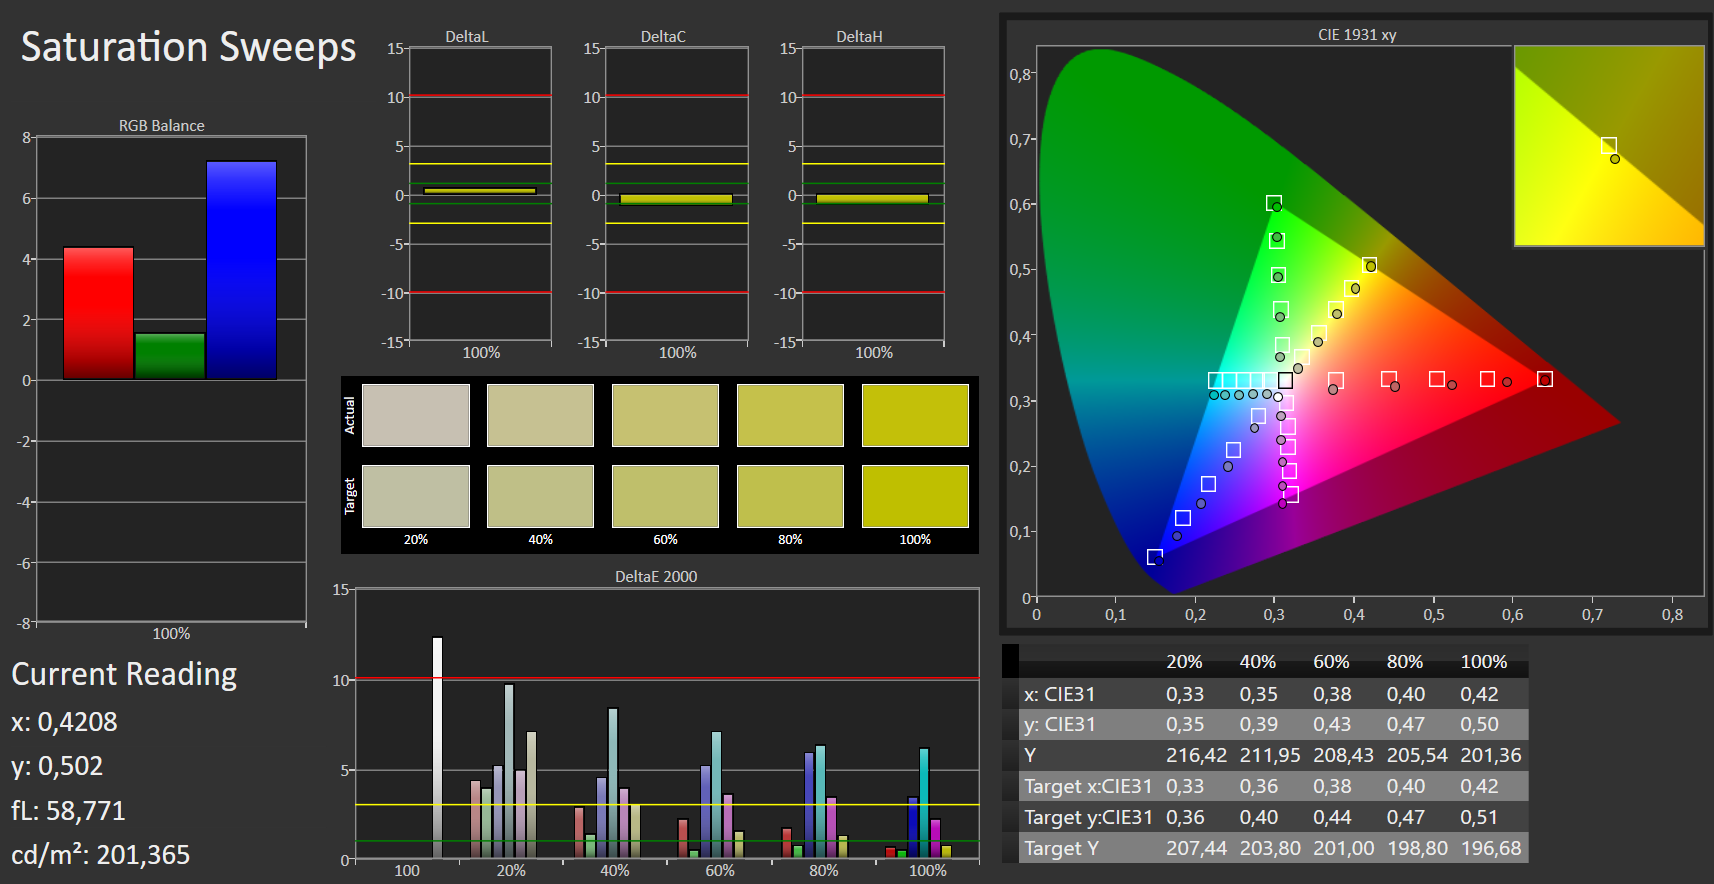
ΔE ColorChecker Calman: 4.55 | ∀{0.5-29.43 Ø4.73}
ΔE Greyscale Calman: 7.61 | ∀{0.09-98 Ø4.97}
92% sRGB (Argyll 1.6.3 3D)
59% AdobeRGB 1998 (Argyll 1.6.3 3D)
63.5% AdobeRGB 1998 (Argyll 3D)
92.5% sRGB (Argyll 3D)
62.7% Display P3 (Argyll 3D)
Gamma: 2.51
CCT: 7212 K
| Acer Aspire Nitro 5 AN517-51-7887 LP173WF5-SPB3, IPS, 1920x1080, 17.3" | Lenovo Legion Y540-17IRH AU Optronics B173HAN04.4 (AUO449D), IPS, 1920x1080, 17.3" | HP Pavilion Gaming 17-cd0085cl BOE0825, IPS, 1920x1080, 17.3" | Asus ROG Strix G GL731GU-RB74 AU Optronics B173HAN04.0, IPS, 1920x1080, 17.3" | MSI GL73 8SE-010US CMN1747, TN LED, 1920x1080, 17.3" | Asus TUF FX705GM AU Optronics B173HAN04.0 (AUO409D), IPS, 1920x1080, 17.3" | |
|---|---|---|---|---|---|---|
| Display | 9% | 0% | -1% | 29% | -1% | |
| Display P3 Coverage (%) | 62.7 | 69 10% | 63.3 1% | 61.9 -1% | 91.1 45% | 62.4 0% |
| sRGB Coverage (%) | 92.5 | 98.3 6% | 90.2 -2% | 89.4 -3% | 100 8% | 88.8 -4% |
| AdobeRGB 1998 Coverage (%) | 63.5 | 70.7 11% | 64.3 1% | 63.3 0% | 85.4 34% | 63.8 0% |
| Response Times | 51% | 20% | 70% | 67% | 71% | |
| Response Time Grey 50% / Grey 80% * (ms) | 37 ? | 18 ? 51% | 31.6 ? 15% | 6.4 ? 83% | 12.8 ? 65% | 7.4 ? 80% |
| Response Time Black / White * (ms) | 26 ? | 12.8 ? 51% | 19.6 ? 25% | 11.2 ? 57% | 8.2 ? 68% | 10 ? 62% |
| PWM Frequency (Hz) | 25770 ? | |||||
| Screen | 12% | 1% | 4% | -12% | 14% | |
| Brightness middle (cd/m²) | 407 | 286 -30% | 299.6 -26% | 294.3 -28% | 326.4 -20% | 234 -43% |
| Brightness (cd/m²) | 364 | 282 -23% | 285 -22% | 289 -21% | 317 -13% | 228 -37% |
| Brightness Distribution (%) | 84 | 87 4% | 86 2% | 89 6% | 90 7% | 85 1% |
| Black Level * (cd/m²) | 0.3 | 0.19 37% | 0.33 -10% | 0.3 -0% | 0.28 7% | 0.2 33% |
| Contrast (:1) | 1357 | 1505 11% | 908 -33% | 981 -28% | 1166 -14% | 1170 -14% |
| Colorchecker dE 2000 * | 4.55 | 3.57 22% | 3.68 19% | 3.95 13% | 7.83 -72% | 2.16 53% |
| Colorchecker dE 2000 max. * | 12.44 | 7.5 40% | 8.05 35% | 6.49 48% | 13.36 -7% | 3.39 73% |
| Greyscale dE 2000 * | 7.61 | 4.51 41% | 3.8 50% | 3.7 51% | 10.9 -43% | 2 74% |
| Gamma | 2.51 88% | 2.36 93% | 2.12 104% | 2.07 106% | 1.97 112% | 2.46 89% |
| CCT | 7212 90% | 7411 88% | 7240 90% | 7155 91% | 11056 59% | 6394 102% |
| Color Space (Percent of AdobeRGB 1998) (%) | 59 | 64 8% | 58.1 -2% | 57.7 -2% | 75.8 28% | 58 -2% |
| Color Space (Percent of sRGB) (%) | 92 | 98 7% | 89.8 -2% | 89 -3% | 100 9% | 89 -3% |
| Colorchecker dE 2000 calibrated * | 1.31 | 3.15 | 3.08 | 2.83 | 2.02 | |
| Média Total (Programa/Configurações) | 24% /
16% | 7% /
3% | 24% /
11% | 28% /
7% | 28% /
18% |
* ... menor é melhor
Exibir tempos de resposta
| ↔ Tempo de resposta preto para branco | ||
|---|---|---|
| 26 ms ... ascensão ↗ e queda ↘ combinadas | ↗ 16 ms ascensão | 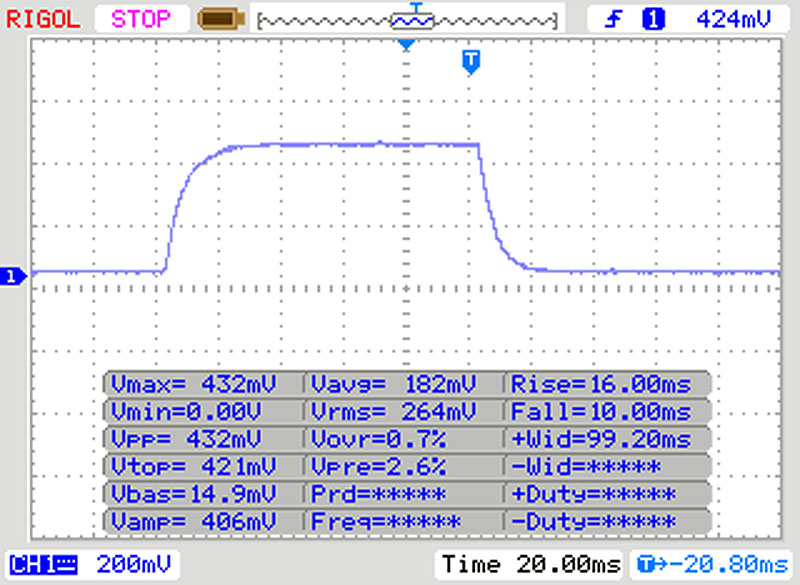 |
| ↘ 10 ms queda | ||
| A tela mostra taxas de resposta relativamente lentas em nossos testes e pode ser muito lenta para os jogadores. Em comparação, todos os dispositivos testados variam de 0.1 (mínimo) a 240 (máximo) ms. » 62 % de todos os dispositivos são melhores. Isso significa que o tempo de resposta medido é pior que a média de todos os dispositivos testados (19.9 ms). | ||
| ↔ Tempo de resposta 50% cinza a 80% cinza | ||
| 37 ms ... ascensão ↗ e queda ↘ combinadas | ↗ 19 ms ascensão | 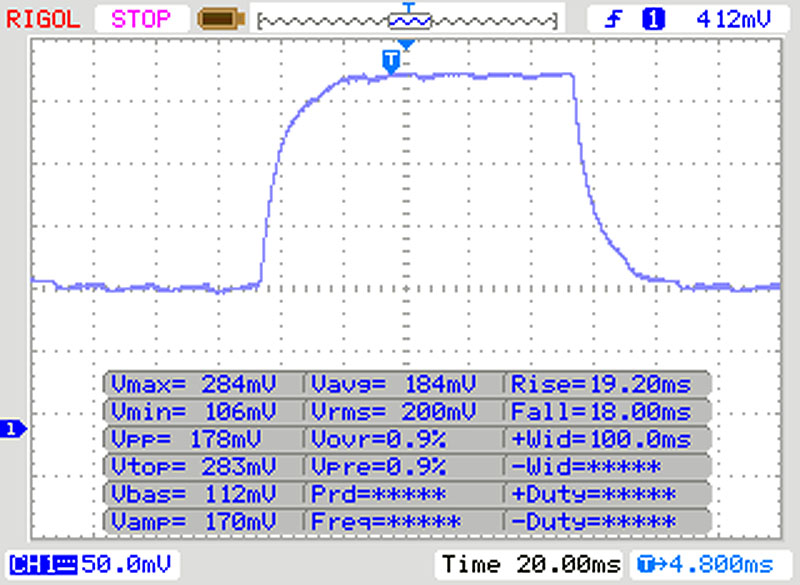 |
| ↘ 18 ms queda | ||
| A tela mostra taxas de resposta lentas em nossos testes e será insatisfatória para os jogadores. Em comparação, todos os dispositivos testados variam de 0.165 (mínimo) a 636 (máximo) ms. » 53 % de todos os dispositivos são melhores. Isso significa que o tempo de resposta medido é pior que a média de todos os dispositivos testados (31.1 ms). | ||
Cintilação da tela / PWM (modulação por largura de pulso)
| Tela tremeluzindo / PWM não detectado | 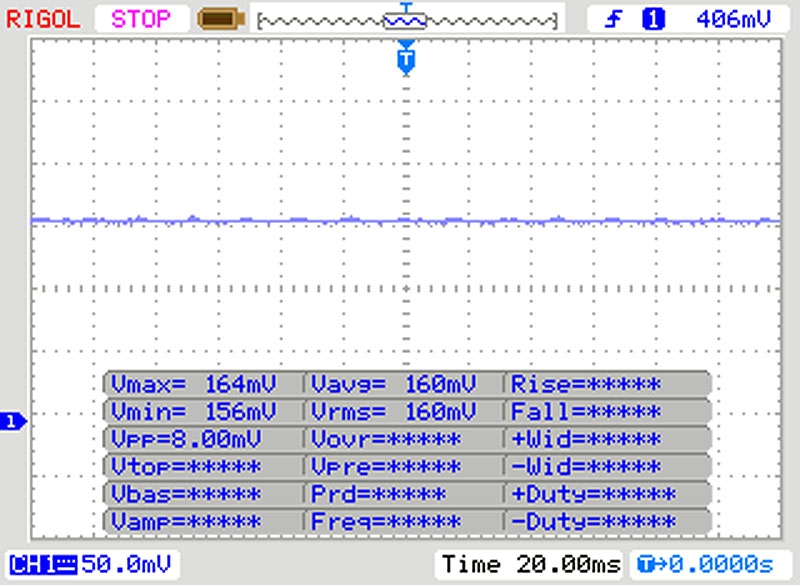 | ||
[pwm_comparison] Em comparação: 52 % de todos os dispositivos testados não usam PWM para escurecer a tela. Se PWM foi detectado, uma média de 7784 (mínimo: 5 - máximo: 343500) Hz foi medida. | |||
| Performance rating - Percent | |
| Acer Aspire Nitro 5 AN517-51-7887 | |
| Asus ROG Strix G GL731GU-RB74 -9! | |
| HP Pavilion Gaming 17-cd0085cl -9! | |
| Asus TUF FX705GM -7! | |
| Lenovo Legion Y540-17IRH -5! | |
| MSI GL73 8SE-010US -9! | |
| Cinebench R15 | |
| CPU Single 64Bit | |
| HP Pavilion Gaming 17-cd0085cl | |
| Asus ROG Strix G GL731GU-RB74 | |
| Acer Aspire Nitro 5 AN517-51-7887 | |
| Asus TUF FX705GM | |
| Lenovo Legion Y540-17IRH | |
| MSI GL73 8SE-010US | |
| CPU Multi 64Bit | |
| Asus ROG Strix G GL731GU-RB74 | |
| HP Pavilion Gaming 17-cd0085cl | |
| Asus TUF FX705GM | |
| MSI GL73 8SE-010US | |
| Acer Aspire Nitro 5 AN517-51-7887 | |
| Lenovo Legion Y540-17IRH | |
| Cinebench R11.5 | |
| CPU Single 64Bit | |
| Acer Aspire Nitro 5 AN517-51-7887 | |
| Asus TUF FX705GM | |
| CPU Multi 64Bit | |
| Asus TUF FX705GM | |
| Acer Aspire Nitro 5 AN517-51-7887 | |
| Blender - v2.79 BMW27 CPU | |
| Acer Aspire Nitro 5 AN517-51-7887 | |
| Geekbench 4.4 | |
| 64 Bit Single-Core Score | |
| Acer Aspire Nitro 5 AN517-51-7887 | |
| Lenovo Legion Y540-17IRH | |
| 64 Bit Multi-Core Score | |
| Acer Aspire Nitro 5 AN517-51-7887 | |
| Lenovo Legion Y540-17IRH | |
| 3DMark 11 - 1280x720 Performance Physics | |
| Asus ROG Strix G GL731GU-RB74 | |
| HP Pavilion Gaming 17-cd0085cl | |
| Asus TUF FX705GM | |
| Lenovo Legion Y540-17IRH | |
| Acer Aspire Nitro 5 AN517-51-7887 | |
| MSI GL73 8SE-010US | |
| Cinebench R20 | |
| CPU (Single Core) | |
| Acer Aspire Nitro 5 AN517-51-7887 | |
| Lenovo Legion Y540-17IRH | |
| CPU (Multi Core) | |
| Acer Aspire Nitro 5 AN517-51-7887 | |
| Lenovo Legion Y540-17IRH | |
| 7-Zip 18.03 | |
| 7z b 4 | |
| Acer Aspire Nitro 5 AN517-51-7887 | |
| 7z b 4 -mmt1 | |
| Acer Aspire Nitro 5 AN517-51-7887 | |
* ... menor é melhor
| PCMark 8 Home Score Accelerated v2 | 4782 pontos | |
| PCMark 8 Creative Score Accelerated v2 | 7475 pontos | |
| PCMark 8 Work Score Accelerated v2 | 5361 pontos | |
| PCMark 10 Score | 5519 pontos | |
Ajuda | ||
| Acer Aspire Nitro 5 AN517-51-7887 WDC PC SN520 SDAPNUW-512G | Lenovo Legion Y540-17IRH WDC PC SN520 SDAPNUW-512G | HP Pavilion Gaming 17-cd0085cl Samsung SSD PM981 MZVLB256HAHQ | Asus ROG Strix G GL731GU-RB74 Intel SSD 660p SSDPEKNW512G8 | MSI GL73 8SE-010US Kingston RBUSNS8154P3128GJ | Asus TUF FX705GM WDC PC SN520 SDAPNUW-256G | Média WDC PC SN520 SDAPNUW-512G | |
|---|---|---|---|---|---|---|---|
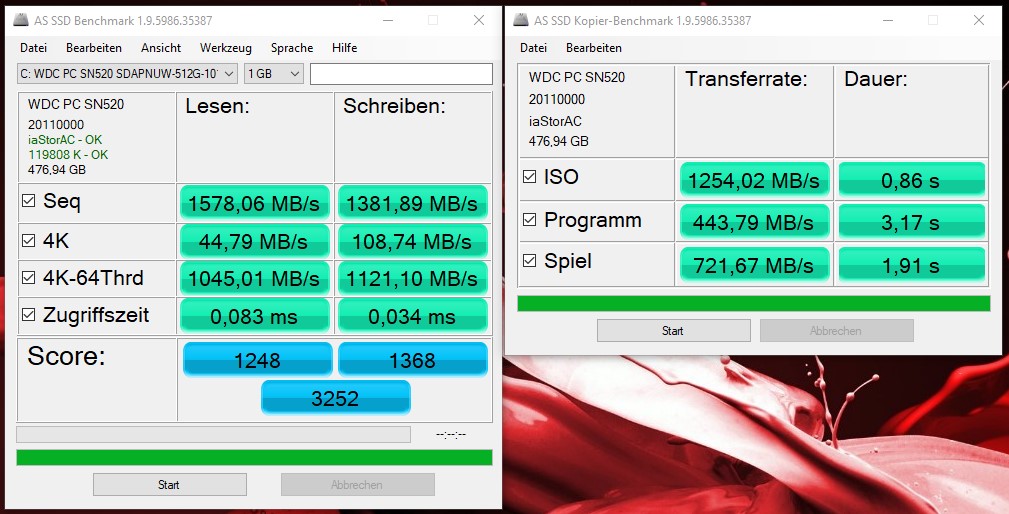
| AS SSD | 1% | -2% | -50% | -83% | -17% | -4% | |
| 4K Read (MB/s) | 44.79 | 38.9 -13% | 49.73 11% | 49.43 10% | 21.91 -51% | 38.49 -14% | 40.8 ? -9% |
| 4K Write (MB/s) | 108.7 | 111.9 3% | 108.2 0% | 104.3 -4% | 56.6 -48% | 101.9 -6% | 127.3 ? 17% |
| 4K-64 Read (MB/s) | 1045 | 1028 -2% | 731 -30% | 321.9 -69% | 354.3 -66% | 720 -31% | 957 ? -8% |
| 4K-64 Write (MB/s) | 1121 | 1276 14% | 1233 10% | 774 -31% | 285.7 -75% | 856 -24% | 1081 ? -4% |
| Access Time Read * (ms) | 0.083 | 0.073 12% | 0.073 12% | 0.055 34% | 0.237 -186% | 0.106 -28% | 0.07744 ? 7% |
| Access Time Write * (ms) | 0.034 | 0.034 -0% | 0.034 -0% | 0.138 -306% | 0.09 -165% | 0.036 -6% | 0.03671 ? -8% |
| Score Read (Points) | 1248 | 1216 -3% | 951 -24% | 503 -60% | 456 -63% | 913 -27% | 1134 ? -9% |
| Score Write (Points) | 1368 | 1520 11% | 1476 8% | 971 -29% | 385 -72% | 1082 -21% | 1331 ? -3% |
| Score Total (Points) | 3252 | 3355 3% | 2909 -11% | 1731 -47% | 1061 -67% | 2458 -24% | 3046 ? -6% |
| Seq Write (MB/s) | 1381 | 1324 -4% | 1345 -3% | 930 -33% | 427.6 -69% | 1236 -10% | 1227 ? -11% |
| Seq Read (MB/s) | 1578 | 1495 -5% | 1709 8% | 1319 -16% | 794 -50% | 1571 0% | 1363 ? -14% |
* ... menor é melhor

| 3DMark 11 - 1280x720 Performance GPU | |
| Média da turma Gaming (21841 - 80022, n=106, últimos 2 anos) | |
| Acer Aspire Nitro 5 AN517-51-7887 | |
| Asus ROG Strix G GL731GU-RB74 | |
| MSI GL73 8SE-010US | |
| Média NVIDIA GeForce GTX 1660 Ti Mobile (18610 - 22670, n=24) | |
| Lenovo Legion Y540-17IRH | |
| HP Pavilion Gaming 17-cd0085cl | |
| Asus TUF FX705GM | |
| 3DMark | |
| 1280x720 Cloud Gate Standard Graphics | |
| Média da turma Gaming (86886 - 223650, n=61, últimos 2 anos) | |
| Acer Aspire Nitro 5 AN517-51-7887 | |
| Asus ROG Strix G GL731GU-RB74 | |
| Média NVIDIA GeForce GTX 1660 Ti Mobile (59839 - 104780, n=18) | |
| HP Pavilion Gaming 17-cd0085cl | |
| Lenovo Legion Y540-17IRH | |
| MSI GL73 8SE-010US | |
| 1920x1080 Fire Strike Graphics | |
| Média da turma Gaming (12242 - 62849, n=118, últimos 2 anos) | |
| MSI GL73 8SE-010US | |
| Média NVIDIA GeForce GTX 1660 Ti Mobile (14186 - 16488, n=24) | |
| Acer Aspire Nitro 5 AN517-51-7887 | |
| Asus ROG Strix G GL731GU-RB74 | |
| Lenovo Legion Y540-17IRH | |
| HP Pavilion Gaming 17-cd0085cl | |
| Fire Strike Extreme Graphics | |
| Média da turma Gaming (14731 - 32381, n=5, últimos 2 anos) | |
| Asus ROG Strix G GL731GU-RB74 | |
| Média NVIDIA GeForce GTX 1660 Ti Mobile (6576 - 6752, n=5) | |
| Acer Aspire Nitro 5 AN517-51-7887 | |
| 3DMark 11 Performance | 16279 pontos | |
| 3DMark Ice Storm Standard Score | 103231 pontos | |
| 3DMark Cloud Gate Standard Score | 31347 pontos | |
| 3DMark Fire Strike Score | 12738 pontos | |
| 3DMark Fire Strike Extreme Score | 6346 pontos | |
Ajuda | ||
| The Witcher 3 | |
| 1920x1080 High Graphics & Postprocessing (Nvidia HairWorks Off) | |
| Média da turma Gaming (181 - 341, n=3, últimos 2 anos) | |
| Lenovo Legion Y540-17IRH | |
| Média NVIDIA GeForce GTX 1660 Ti Mobile (93 - 120.4, n=17) | |
| MSI GL73 8SE-010US | |
| Acer Aspire Nitro 5 AN517-51-7887 | |
| Asus ROG Strix G GL731GU-RB74 | |
| HP Pavilion Gaming 17-cd0085cl | |
| Asus TUF FX705GM | |
| 1920x1080 Ultra Graphics & Postprocessing (HBAO+) | |
| Média da turma Gaming (95 - 240, n=8, últimos 2 anos) | |
| Média NVIDIA GeForce GTX 1660 Ti Mobile (51.6 - 65.1, n=21) | |
| Acer Aspire Nitro 5 AN517-51-7887 | |
| MSI GL73 8SE-010US | |
| Lenovo Legion Y540-17IRH | |
| Asus ROG Strix G GL731GU-RB74 | |
| HP Pavilion Gaming 17-cd0085cl | |
| Asus TUF FX705GM | |
| X-Plane 11.11 - 1920x1080 high (fps_test=3) | |
| Média da turma Gaming (52.1 - 143.5, n=113, últimos 2 anos) | |
| Média NVIDIA GeForce GTX 1660 Ti Mobile (64 - 85, n=11) | |
| Acer Aspire Nitro 5 AN517-51-7887 | |
| Lenovo Legion Y540-17IRH | |
| Far Cry 5 | |
| 1920x1080 High Preset AA:T | |
| Média da turma Gaming (82 - 163, n=10, últimos 2 anos) | |
| Acer Aspire Nitro 5 AN517-51-7887 | |
| Média NVIDIA GeForce GTX 1660 Ti Mobile (84 - 90, n=4) | |
| Lenovo Legion Y540-17IRH | |
| 1920x1080 Ultra Preset AA:T | |
| Média da turma Gaming (70 - 151, n=10, últimos 2 anos) | |
| Acer Aspire Nitro 5 AN517-51-7887 | |
| Média NVIDIA GeForce GTX 1660 Ti Mobile (82 - 87, n=5) | |
| Lenovo Legion Y540-17IRH | |
| Far Cry New Dawn | |
| 1920x1080 Ultra Preset | |
| Média NVIDIA GeForce GTX 1660 Ti Mobile (73 - 81, n=7) | |
| Lenovo Legion Y540-17IRH | |
| Acer Aspire Nitro 5 AN517-51-7887 | |
| 1920x1080 High Preset | |
| Média NVIDIA GeForce GTX 1660 Ti Mobile (79 - 89, n=7) | |
| Lenovo Legion Y540-17IRH | |
| Acer Aspire Nitro 5 AN517-51-7887 | |
| Dota 2 Reborn | |
| 1920x1080 ultra (3/3) best looking | |
| Média da turma Gaming (84.8 - 248, n=110, últimos 2 anos) | |
| Média NVIDIA GeForce GTX 1660 Ti Mobile (94.6 - 125, n=11) | |
| Acer Aspire Nitro 5 AN517-51-7887 | |
| 1920x1080 high (2/3) | |
| Média da turma Gaming (82.8 - 275, n=109, últimos 2 anos) | |
| Média NVIDIA GeForce GTX 1660 Ti Mobile (103.3 - 130, n=11) | |
| Acer Aspire Nitro 5 AN517-51-7887 | |
| BioShock Infinite - 1920x1080 Ultra Preset, DX11 (DDOF) | |
| Asus ROG Strix G GL731GU-RB74 | |
| Lenovo Legion Y540-17IRH | |
| Acer Aspire Nitro 5 AN517-51-7887 | |
| Média NVIDIA GeForce GTX 1660 Ti Mobile (121.6 - 144.2, n=14) | |
| HP Pavilion Gaming 17-cd0085cl | |
| MSI GL73 8SE-010US | |
| Rise of the Tomb Raider - 1920x1080 Very High Preset AA:FX AF:16x | |
| Acer Aspire Nitro 5 AN517-51-7887 | |
| Média NVIDIA GeForce GTX 1660 Ti Mobile (74 - 87.4, n=3) | |
| baixo | média | alto | ultra | QHD | 4K | |
|---|---|---|---|---|---|---|
| BioShock Infinite (2013) | 309 | 270 | 247 | 138 | ||
| The Witcher 3 (2015) | 254 | 171 | 101 | 55.3 | 32.9 | |
| Dota 2 Reborn (2015) | 143 | 123.7 | 117.6 | 110.6 | ||
| Rise of the Tomb Raider (2016) | 156 | 164 | 100 | 81 | 38 | |
| Rocket League (2017) | 248 | 247 | 221 | |||
| X-Plane 11.11 (2018) | 92 | 85 | 73 | |||
| Far Cry 5 (2018) | 107 | 92 | 90 | 87 | 60 | 31 |
| Far Cry New Dawn (2019) | 105 | 87 | 83 | 74 | 60 | 32 |
Barulho
| Ocioso |
| 30.2 / 30.2 / 31 dB |
| HDD |
| 31.6 dB |
| Carga |
| 43.4 / 45.5 dB |
 | ||
30 dB silencioso 40 dB(A) audível 50 dB(A) ruidosamente alto |
||
min: | ||
| Acer Aspire Nitro 5 AN517-51-7887, Intel Core i7-9750H GeForce GTX 1660 Ti Mobile, i7-9750H, WDC PC SN520 SDAPNUW-512G | Lenovo Legion Y540-17IRH, Intel Core i5-9300H GeForce GTX 1660 Ti Mobile, i5-9300H, WDC PC SN520 SDAPNUW-512G | HP Pavilion Gaming 17-cd0085cl, Intel Core i7-9750H GeForce GTX 1660 Ti Max-Q, i7-9750H, Samsung SSD PM981 MZVLB256HAHQ | Asus ROG Strix G GL731GU-RB74, Intel Core i7-9750H GeForce GTX 1660 Ti Mobile, i7-9750H, Intel SSD 660p SSDPEKNW512G8 | MSI GL73 8SE-010US, Intel Core i7-8750H GeForce RTX 2060 Mobile, i7-8750H, Kingston RBUSNS8154P3128GJ | Asus TUF FX705GM, Intel Core i7-8750H GeForce GTX 1060 Mobile, i7-8750H, WDC PC SN520 SDAPNUW-256G | |
|---|---|---|---|---|---|---|
| Noise | -5% | 9% | -8% | -4% | -10% | |
| desligado / ambiente * (dB) | 30 | 30 -0% | 28.2 6% | 28.2 6% | 28.6 5% | 29 3% |
| Idle Minimum * (dB) | 30.2 | 30 1% | 30.1 -0% | 31.8 -5% | 33.8 -12% | 32 -6% |
| Idle Average * (dB) | 30.2 | 32 -6% | 30.1 -0% | 32 -6% | 34 -13% | 33 -9% |
| Idle Maximum * (dB) | 31 | 34 -10% | 30.1 3% | 40.6 -31% | 34.1 -10% | 44 -42% |
| Load Average * (dB) | 43.4 | 44 -1% | 34.2 21% | 48 -11% | 36.5 16% | 46 -6% |
| Witcher 3 ultra * (dB) | 48.5 | 50 -3% | 34.2 29% | 48 1% | 47.8 1% | 48 1% |
| Load Maximum * (dB) | 45.5 | 52 -14% | 43.8 4% | 51.5 -13% | 52.2 -15% | 50 -10% |
* ... menor é melhor
(-) A temperatura máxima no lado superior é 51.7 °C / 125 F, em comparação com a média de 40.4 °C / 105 F , variando de 21.2 a 68.8 °C para a classe Gaming.
(-) A parte inferior aquece até um máximo de 55.4 °C / 132 F, em comparação com a média de 43.2 °C / 110 F
(+) Em uso inativo, a temperatura média para o lado superior é 27.5 °C / 82 F, em comparação com a média do dispositivo de 33.9 °C / ### class_avg_f### F.
(-) Jogando The Witcher 3, a temperatura média para o lado superior é 39.7 °C / 103 F, em comparação com a média do dispositivo de 33.9 °C / ## #class_avg_f### F.
(+) Os apoios para as mãos e o touchpad são mais frios que a temperatura da pele, com um máximo de 31.4 °C / 88.5 F e, portanto, são frios ao toque.
(-) A temperatura média da área do apoio para as mãos de dispositivos semelhantes foi 28.8 °C / 83.8 F (-2.6 °C / -4.7 F).
| Acer Aspire Nitro 5 AN517-51-7887, Intel Core i7-9750H GeForce GTX 1660 Ti Mobile, i7-9750H, WDC PC SN520 SDAPNUW-512G | Lenovo Legion Y540-17IRH, Intel Core i5-9300H GeForce GTX 1660 Ti Mobile, i5-9300H, WDC PC SN520 SDAPNUW-512G | HP Pavilion Gaming 17-cd0085cl, Intel Core i7-9750H GeForce GTX 1660 Ti Max-Q, i7-9750H, Samsung SSD PM981 MZVLB256HAHQ | Asus ROG Strix G GL731GU-RB74, Intel Core i7-9750H GeForce GTX 1660 Ti Mobile, i7-9750H, Intel SSD 660p SSDPEKNW512G8 | MSI GL73 8SE-010US, Intel Core i7-8750H GeForce RTX 2060 Mobile, i7-8750H, Kingston RBUSNS8154P3128GJ | Asus TUF FX705GM, Intel Core i7-8750H GeForce GTX 1060 Mobile, i7-8750H, WDC PC SN520 SDAPNUW-256G | |
|---|---|---|---|---|---|---|
| Heat | -12% | -6% | 1% | 12% | -2% | |
| Maximum Upper Side * (°C) | 51.7 | 48 7% | 42.6 18% | 44.6 14% | 47 9% | 54 -4% |
| Maximum Bottom * (°C) | 55.4 | 56 -1% | 49 12% | 51.6 7% | 44.4 20% | 53 4% |
| Idle Upper Side * (°C) | 29.1 | 36 -24% | 34 -17% | 31.6 -9% | 24.6 15% | 30 -3% |
| Idle Bottom * (°C) | 29 | 38 -31% | 39.4 -36% | 31.4 -8% | 28 3% | 30 -3% |
* ... menor é melhor
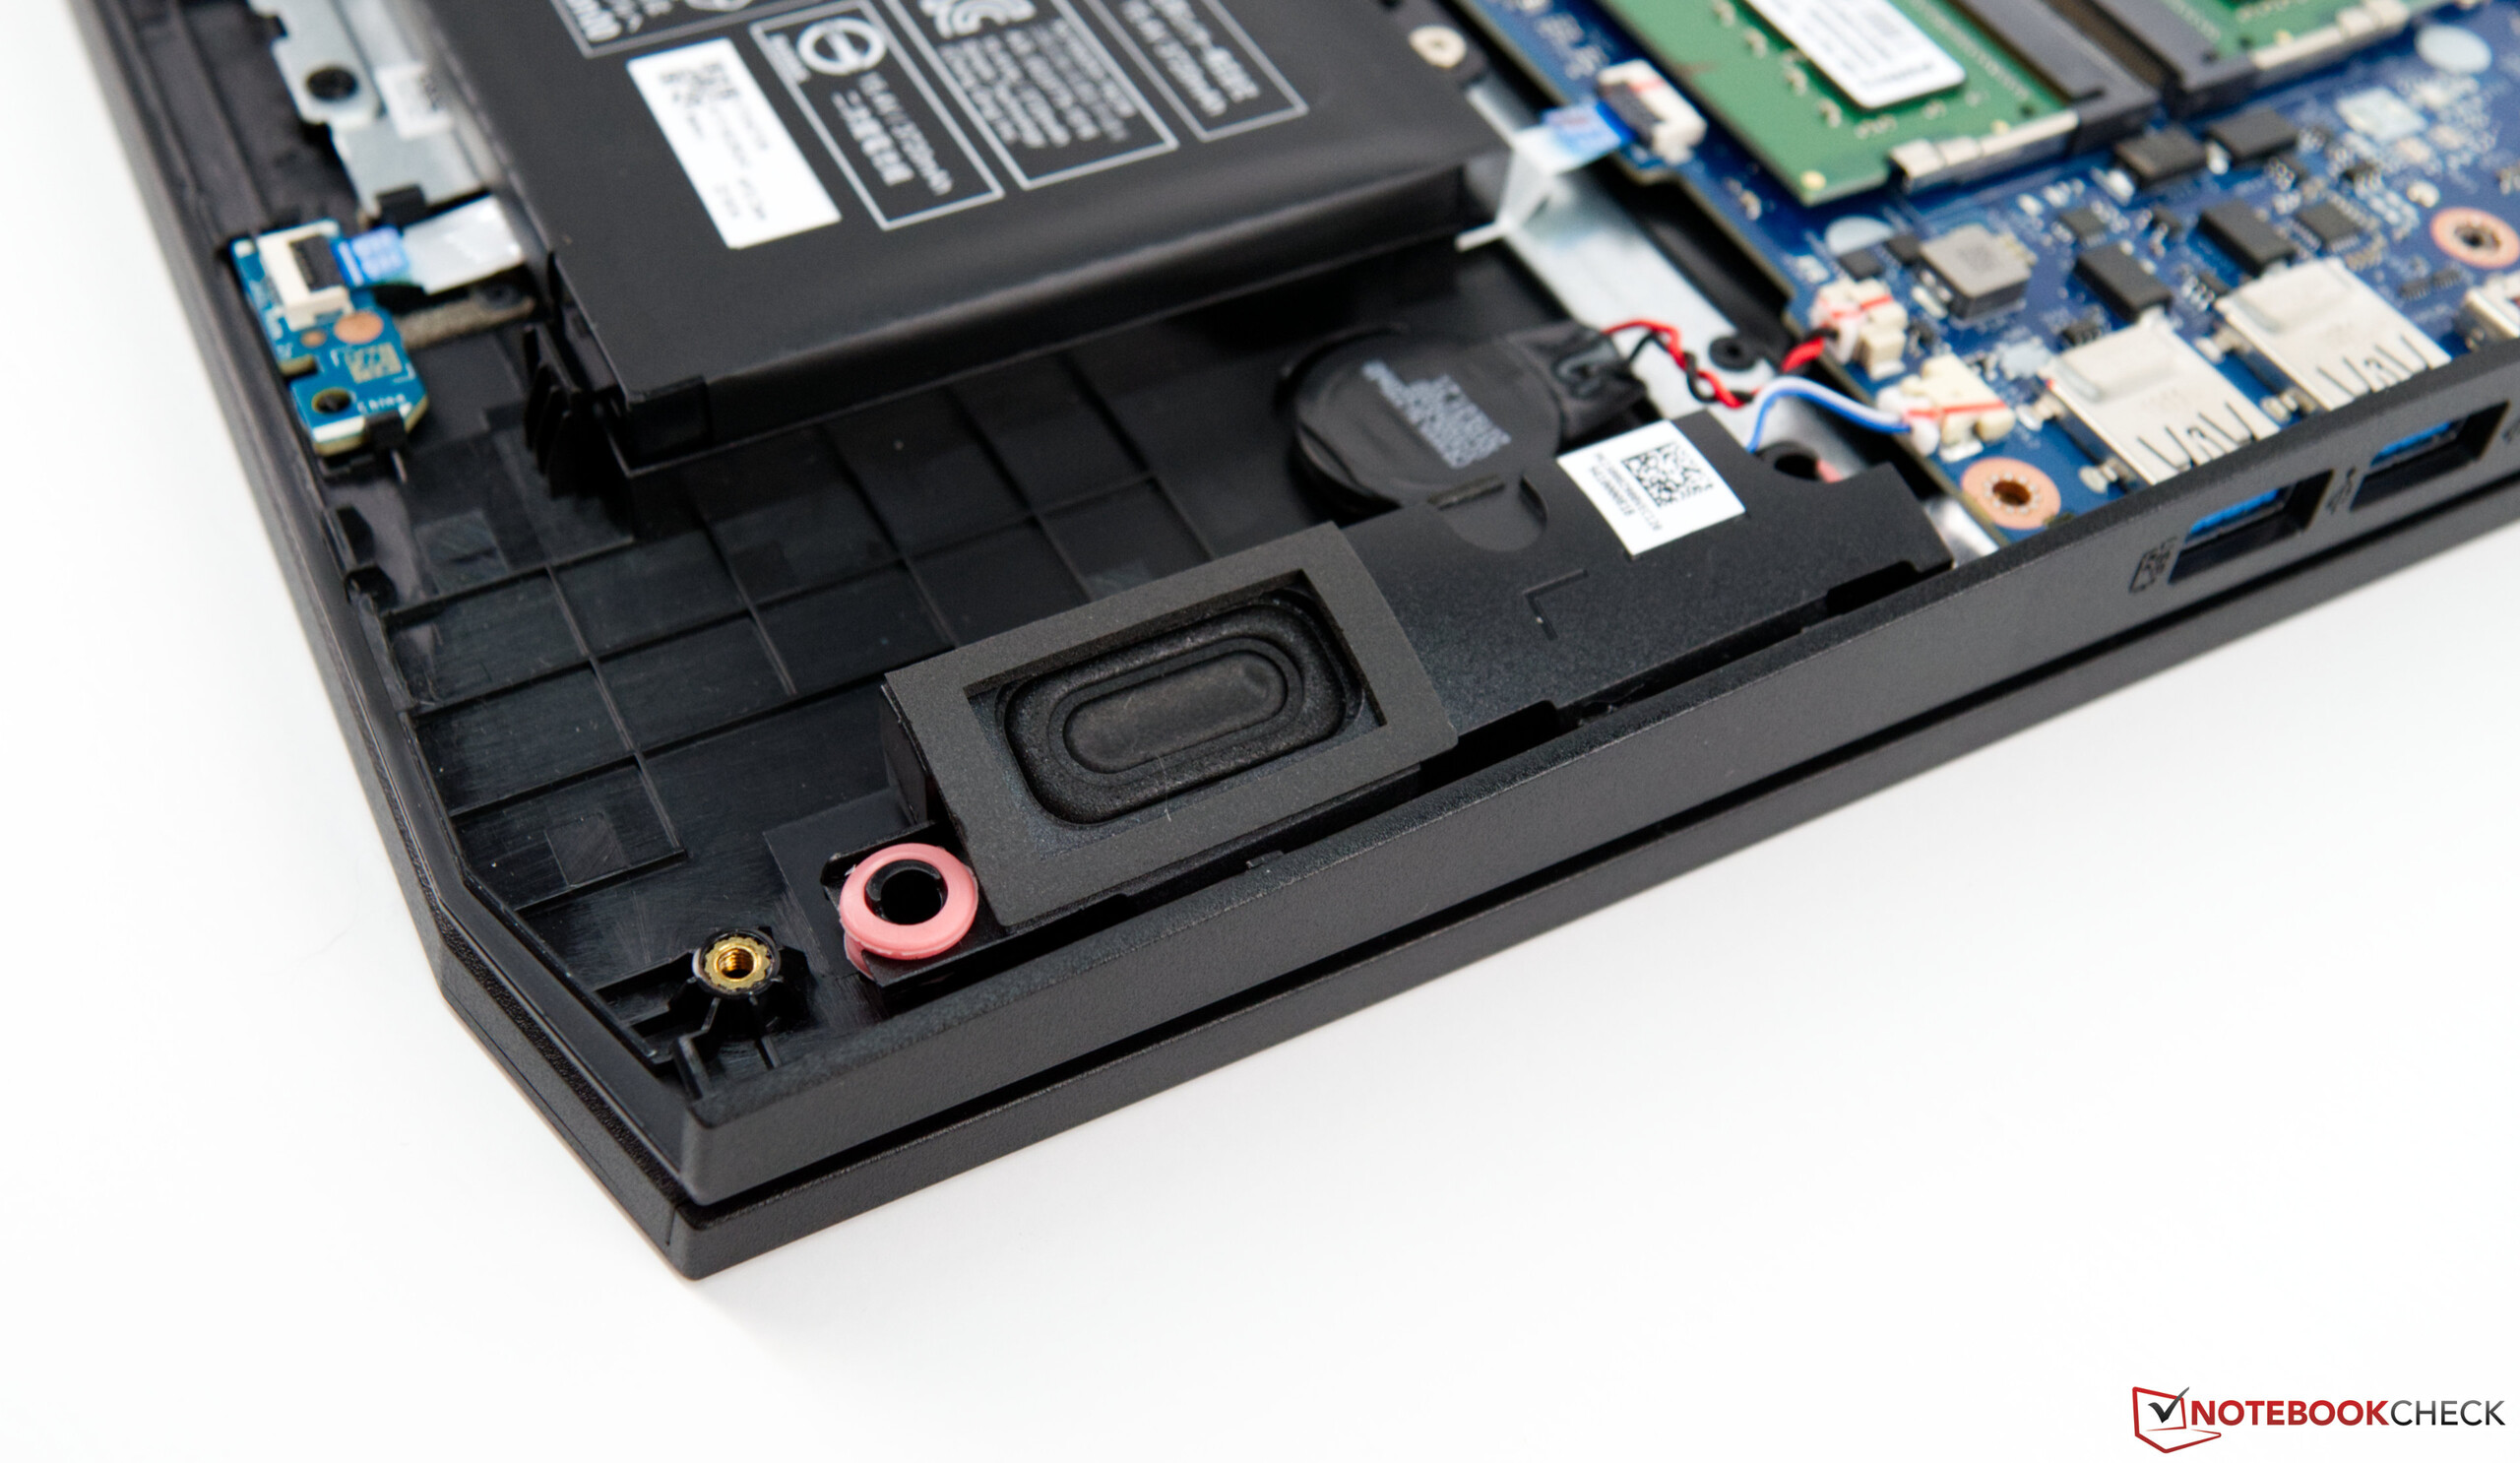
Acer Aspire Nitro 5 AN517-51-7887 análise de áudio
(-) | alto-falantes não muito altos (###valor### dB)
Graves 100 - 315Hz
(-) | quase nenhum baixo - em média 17.2% menor que a mediana
(±) | a linearidade dos graves é média (13.3% delta para a frequência anterior)
Médios 400 - 2.000 Hz
(+) | médios equilibrados - apenas 4.7% longe da mediana
(+) | médios são lineares (6.9% delta para frequência anterior)
Altos 2 - 16 kHz
(+) | agudos equilibrados - apenas 1.9% longe da mediana
(+) | os máximos são lineares (5.5% delta da frequência anterior)
Geral 100 - 16.000 Hz
(±) | a linearidade do som geral é média (19.5% diferença em relação à mediana)
Comparado com a mesma classe
» 67% de todos os dispositivos testados nesta classe foram melhores, 7% semelhantes, 26% piores
» O melhor teve um delta de 6%, a média foi 18%, o pior foi 132%
Comparado com todos os dispositivos testados
» 48% de todos os dispositivos testados foram melhores, 7% semelhantes, 44% piores
» O melhor teve um delta de 4%, a média foi 24%, o pior foi 134%
Lenovo Legion Y540-17IRH análise de áudio
(+) | os alto-falantes podem tocar relativamente alto (###valor### dB)
Graves 100 - 315Hz
(-) | quase nenhum baixo - em média 16.1% menor que a mediana
(±) | a linearidade dos graves é média (13% delta para a frequência anterior)
Médios 400 - 2.000 Hz
(±) | médios mais altos - em média 5% maior que a mediana
(+) | médios são lineares (3.6% delta para frequência anterior)
Altos 2 - 16 kHz
(+) | agudos equilibrados - apenas 3.5% longe da mediana
(+) | os máximos são lineares (5.9% delta da frequência anterior)
Geral 100 - 16.000 Hz
(±) | a linearidade do som geral é média (15.7% diferença em relação à mediana)
Comparado com a mesma classe
» 36% de todos os dispositivos testados nesta classe foram melhores, 7% semelhantes, 57% piores
» O melhor teve um delta de 6%, a média foi 18%, o pior foi 132%
Comparado com todos os dispositivos testados
» 24% de todos os dispositivos testados foram melhores, 5% semelhantes, 71% piores
» O melhor teve um delta de 4%, a média foi 24%, o pior foi 134%
| desligado | |
| Ocioso | |
| Carga |
|
Key:
min: | |
| Acer Aspire Nitro 5 AN517-51-7887 i7-9750H, GeForce GTX 1660 Ti Mobile, WDC PC SN520 SDAPNUW-512G, IPS, 1920x1080, 17.3" | Lenovo Legion Y540-17IRH i5-9300H, GeForce GTX 1660 Ti Mobile, WDC PC SN520 SDAPNUW-512G, IPS, 1920x1080, 17.3" | HP Pavilion Gaming 17-cd0085cl i7-9750H, GeForce GTX 1660 Ti Max-Q, Samsung SSD PM981 MZVLB256HAHQ, IPS, 1920x1080, 17.3" | Asus ROG Strix G GL731GU-RB74 i7-9750H, GeForce GTX 1660 Ti Mobile, Intel SSD 660p SSDPEKNW512G8, IPS, 1920x1080, 17.3" | MSI GL73 8SE-010US i7-8750H, GeForce RTX 2060 Mobile, Kingston RBUSNS8154P3128GJ, TN LED, 1920x1080, 17.3" | Asus TUF FX705GM i7-8750H, GeForce GTX 1060 Mobile, WDC PC SN520 SDAPNUW-256G, IPS, 1920x1080, 17.3" | Média NVIDIA GeForce GTX 1660 Ti Mobile | Média da turma Gaming | |
|---|---|---|---|---|---|---|---|---|
| Power Consumption | -116% | -7% | -115% | -48% | -79% | -91% | -106% | |
| Idle Minimum * (Watt) | 3.9 | 19 -387% | 5.4 -38% | 13.6 -249% | 8.8 -126% | 13 -233% | 12.4 ? -218% | 13.2 ? -238% |
| Idle Average * (Watt) | 8.9 | 22 -147% | 9.2 -3% | 26.2 -194% | 16.2 -82% | 17 -91% | 18 ? -102% | 18.9 ? -112% |
| Idle Maximum * (Watt) | 12.2 | 30 -146% | 13 -7% | 35 -187% | 18.3 -50% | 24 -97% | 25.3 ? -107% | 24.3 ? -99% |
| Load Average * (Watt) | 83 | 79 5% | 85.9 -3% | 113.6 -37% | 86.1 -4% | 106 -28% | 93.5 ? -13% | 108.3 ? -30% |
| Witcher 3 ultra * (Watt) | 130 | 134 -3% | 107.9 17% | 134.1 -3% | 146.7 -13% | 151 -16% | ||
| Load Maximum * (Watt) | 168 | 201 -20% | 182.2 -8% | 200.2 -19% | 186.4 -11% | 179 -7% | 191.9 ? -14% | 254 ? -51% |
* ... menor é melhor

| Acer Aspire Nitro 5 AN517-51-7887 i7-9750H, GeForce GTX 1660 Ti Mobile, 57 Wh | Lenovo Legion Y540-17IRH i5-9300H, GeForce GTX 1660 Ti Mobile, 57 Wh | HP Pavilion Gaming 17-cd0085cl i7-9750H, GeForce GTX 1660 Ti Max-Q, 52.5 Wh | Asus ROG Strix G GL731GU-RB74 i7-9750H, GeForce GTX 1660 Ti Mobile, 66 Wh | MSI GL73 8SE-010US i7-8750H, GeForce RTX 2060 Mobile, 41 Wh | Asus TUF FX705GM i7-8750H, GeForce GTX 1060 Mobile, 64 Wh | Média da turma Gaming | |
|---|---|---|---|---|---|---|---|
| Duração da bateria | -46% | -21% | -21% | -57% | -30% | -1% | |
| Reader / Idle (h) | 13.4 | 5.2 -61% | 11.6 -13% | 8.6 -36% | 6.5 -51% | 6.3 -53% | 8.71 ? -35% |
| H.264 (h) | 6.3 | 3.4 -46% | 4.3 -32% | 8.26 ? 31% | |||
| WiFi v1.3 (h) | 6.2 | 3.7 -40% | 5.7 -8% | 4.9 -21% | 2.8 -55% | 4.5 -27% | 7.04 ? 14% |
| Load (h) | 1.7 | 1.1 -35% | 1 -41% | 1.6 -6% | 0.6 -65% | 1.6 -6% | 1.47 ? -14% |
Pro
Contra
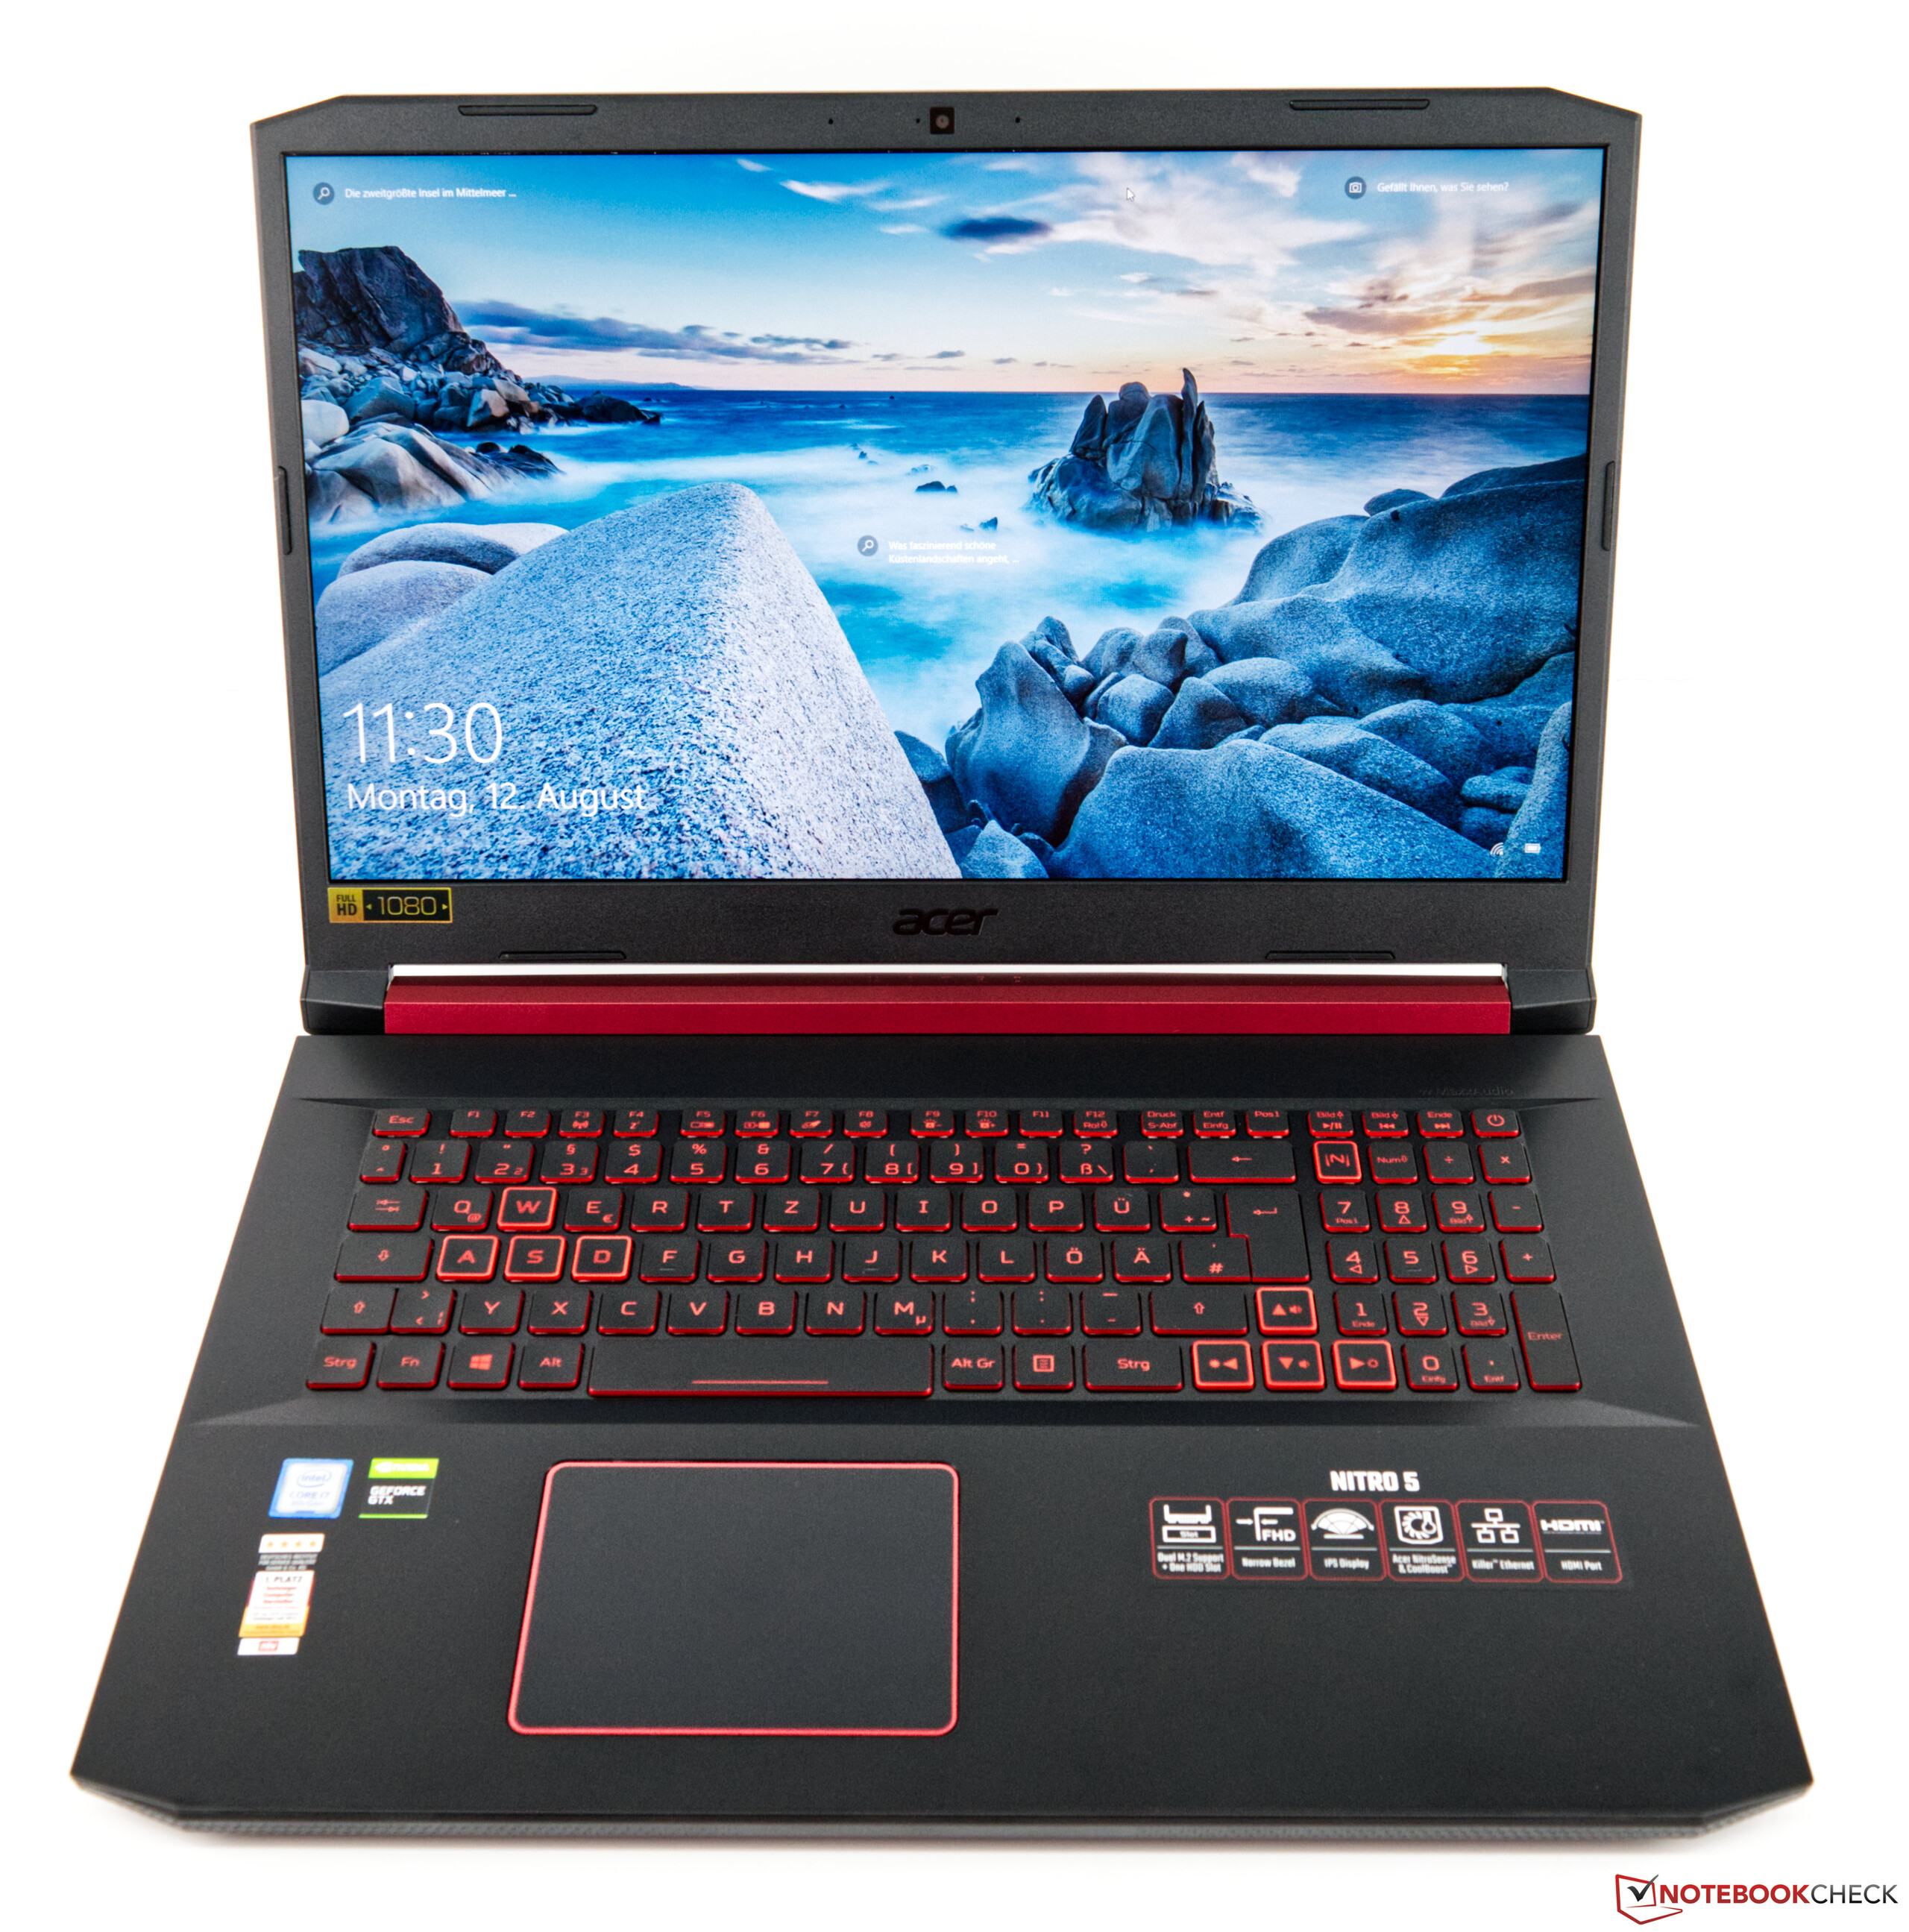
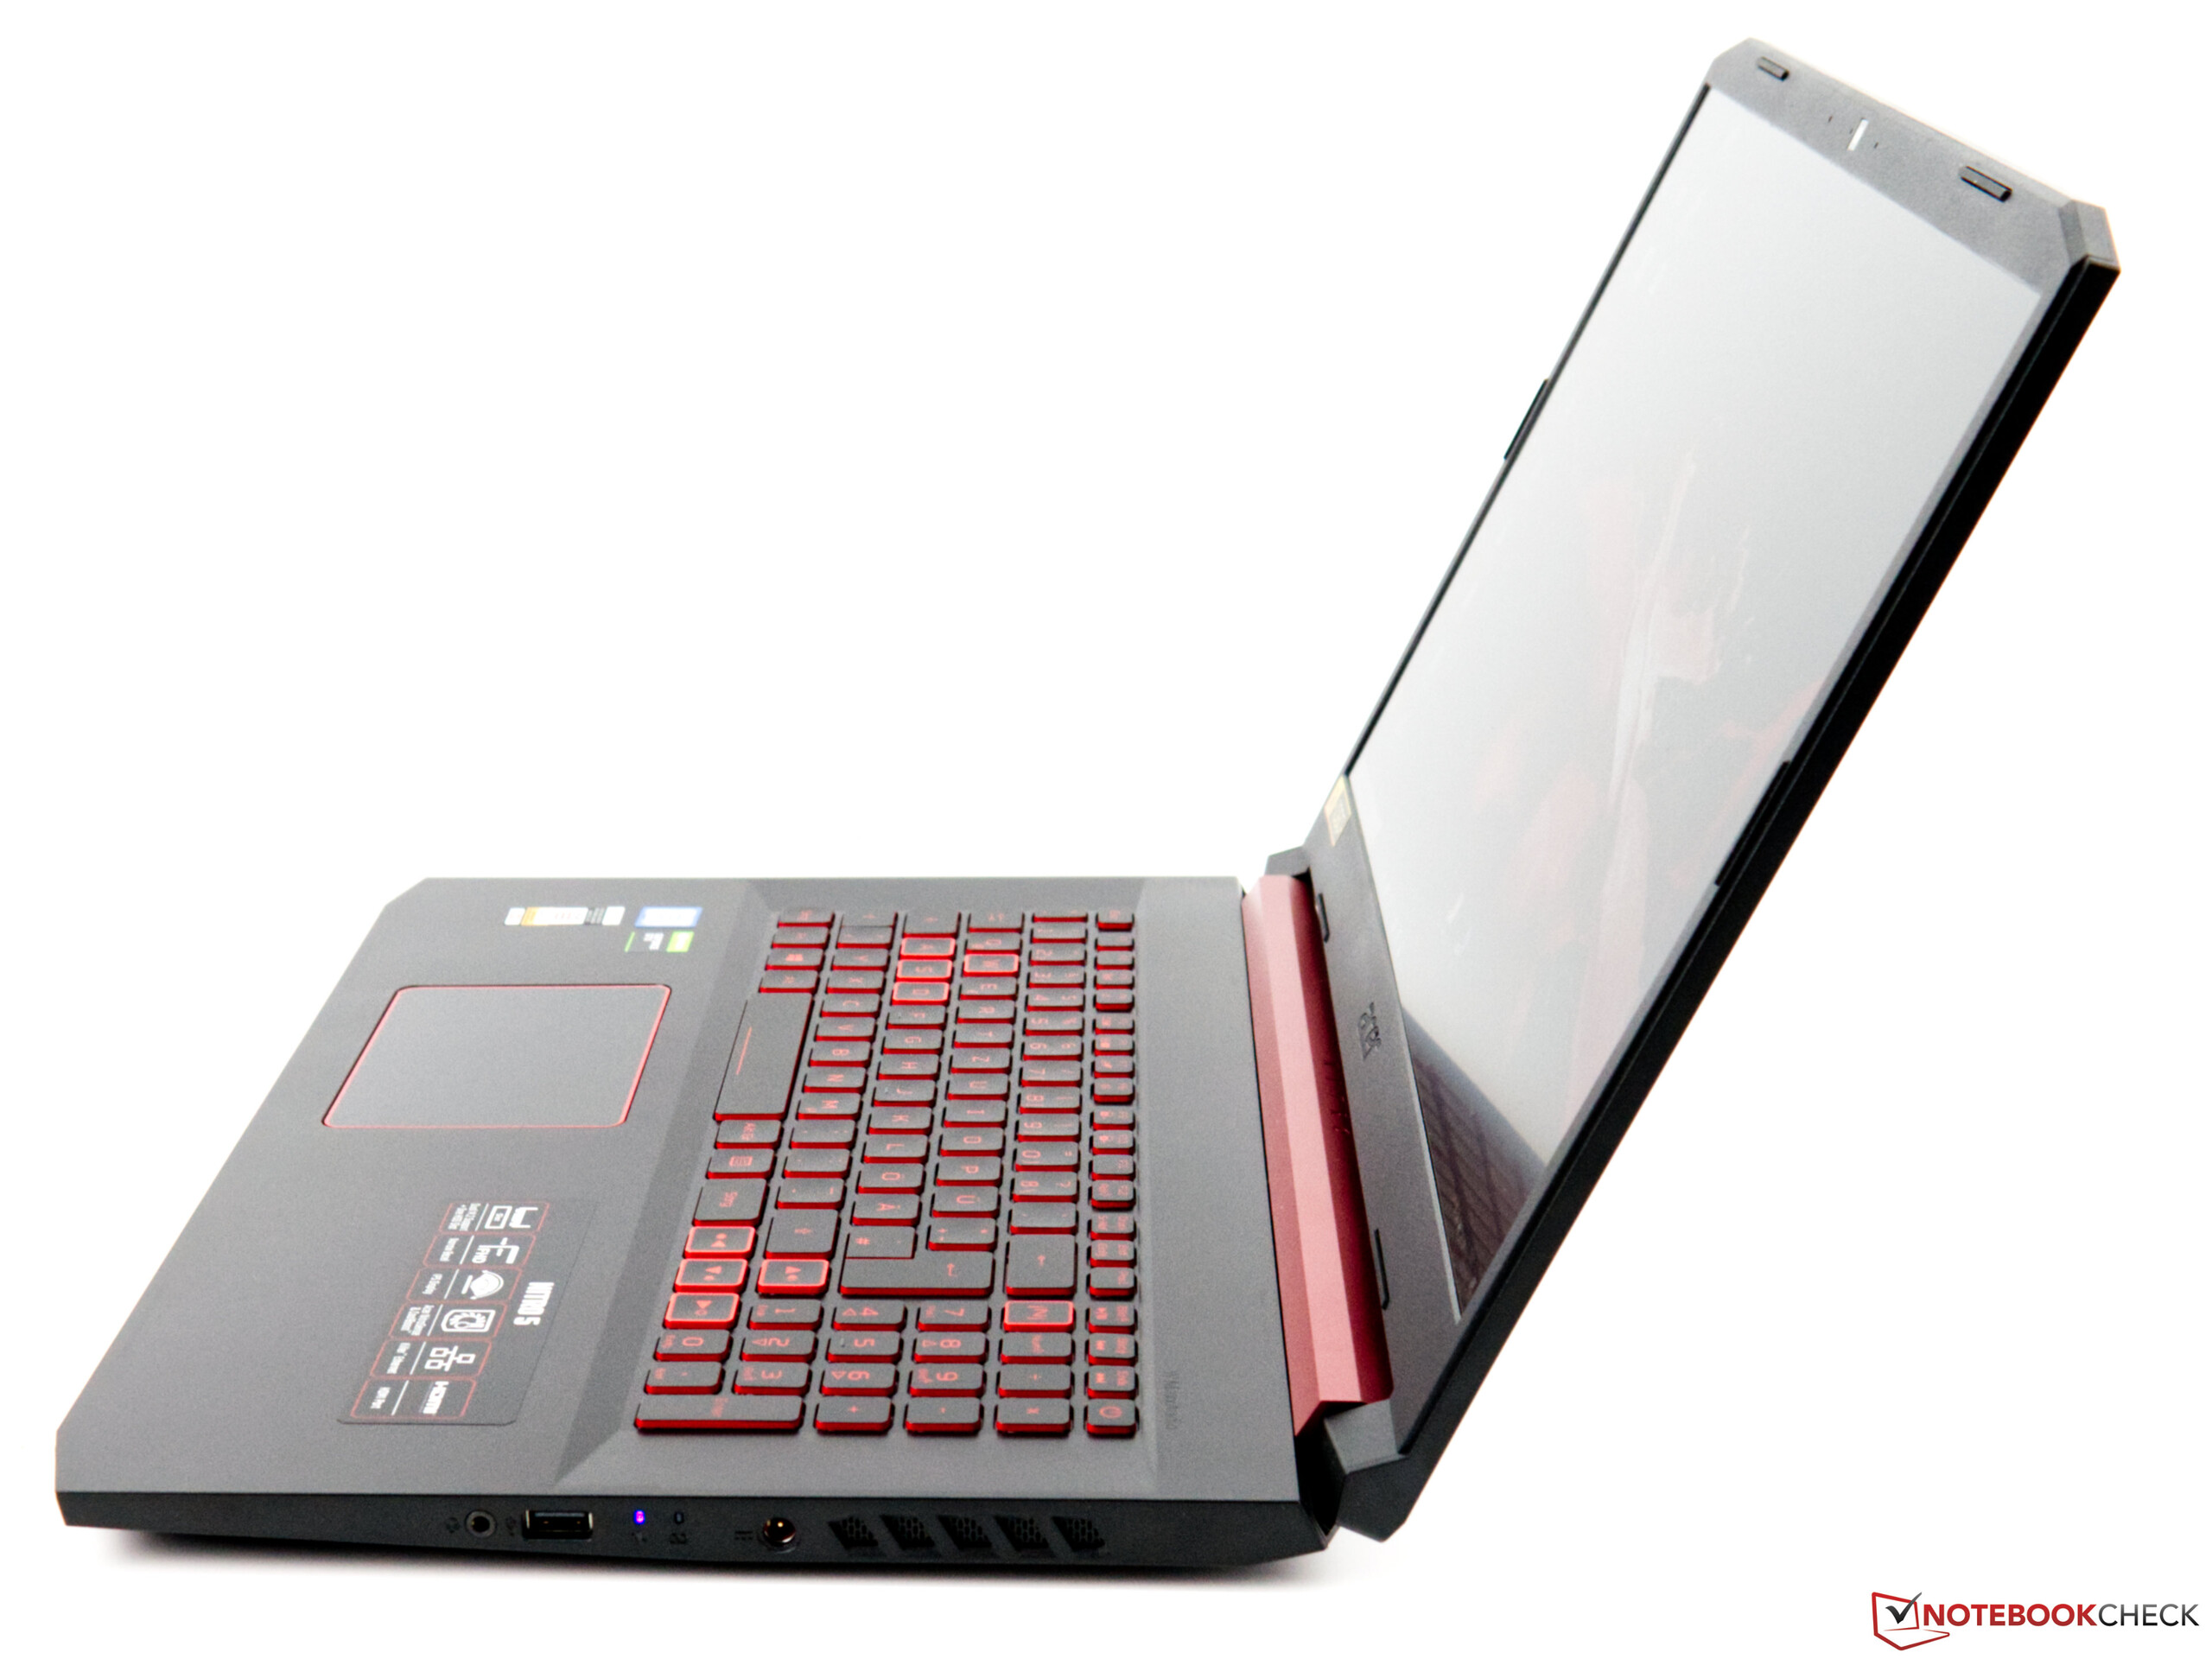
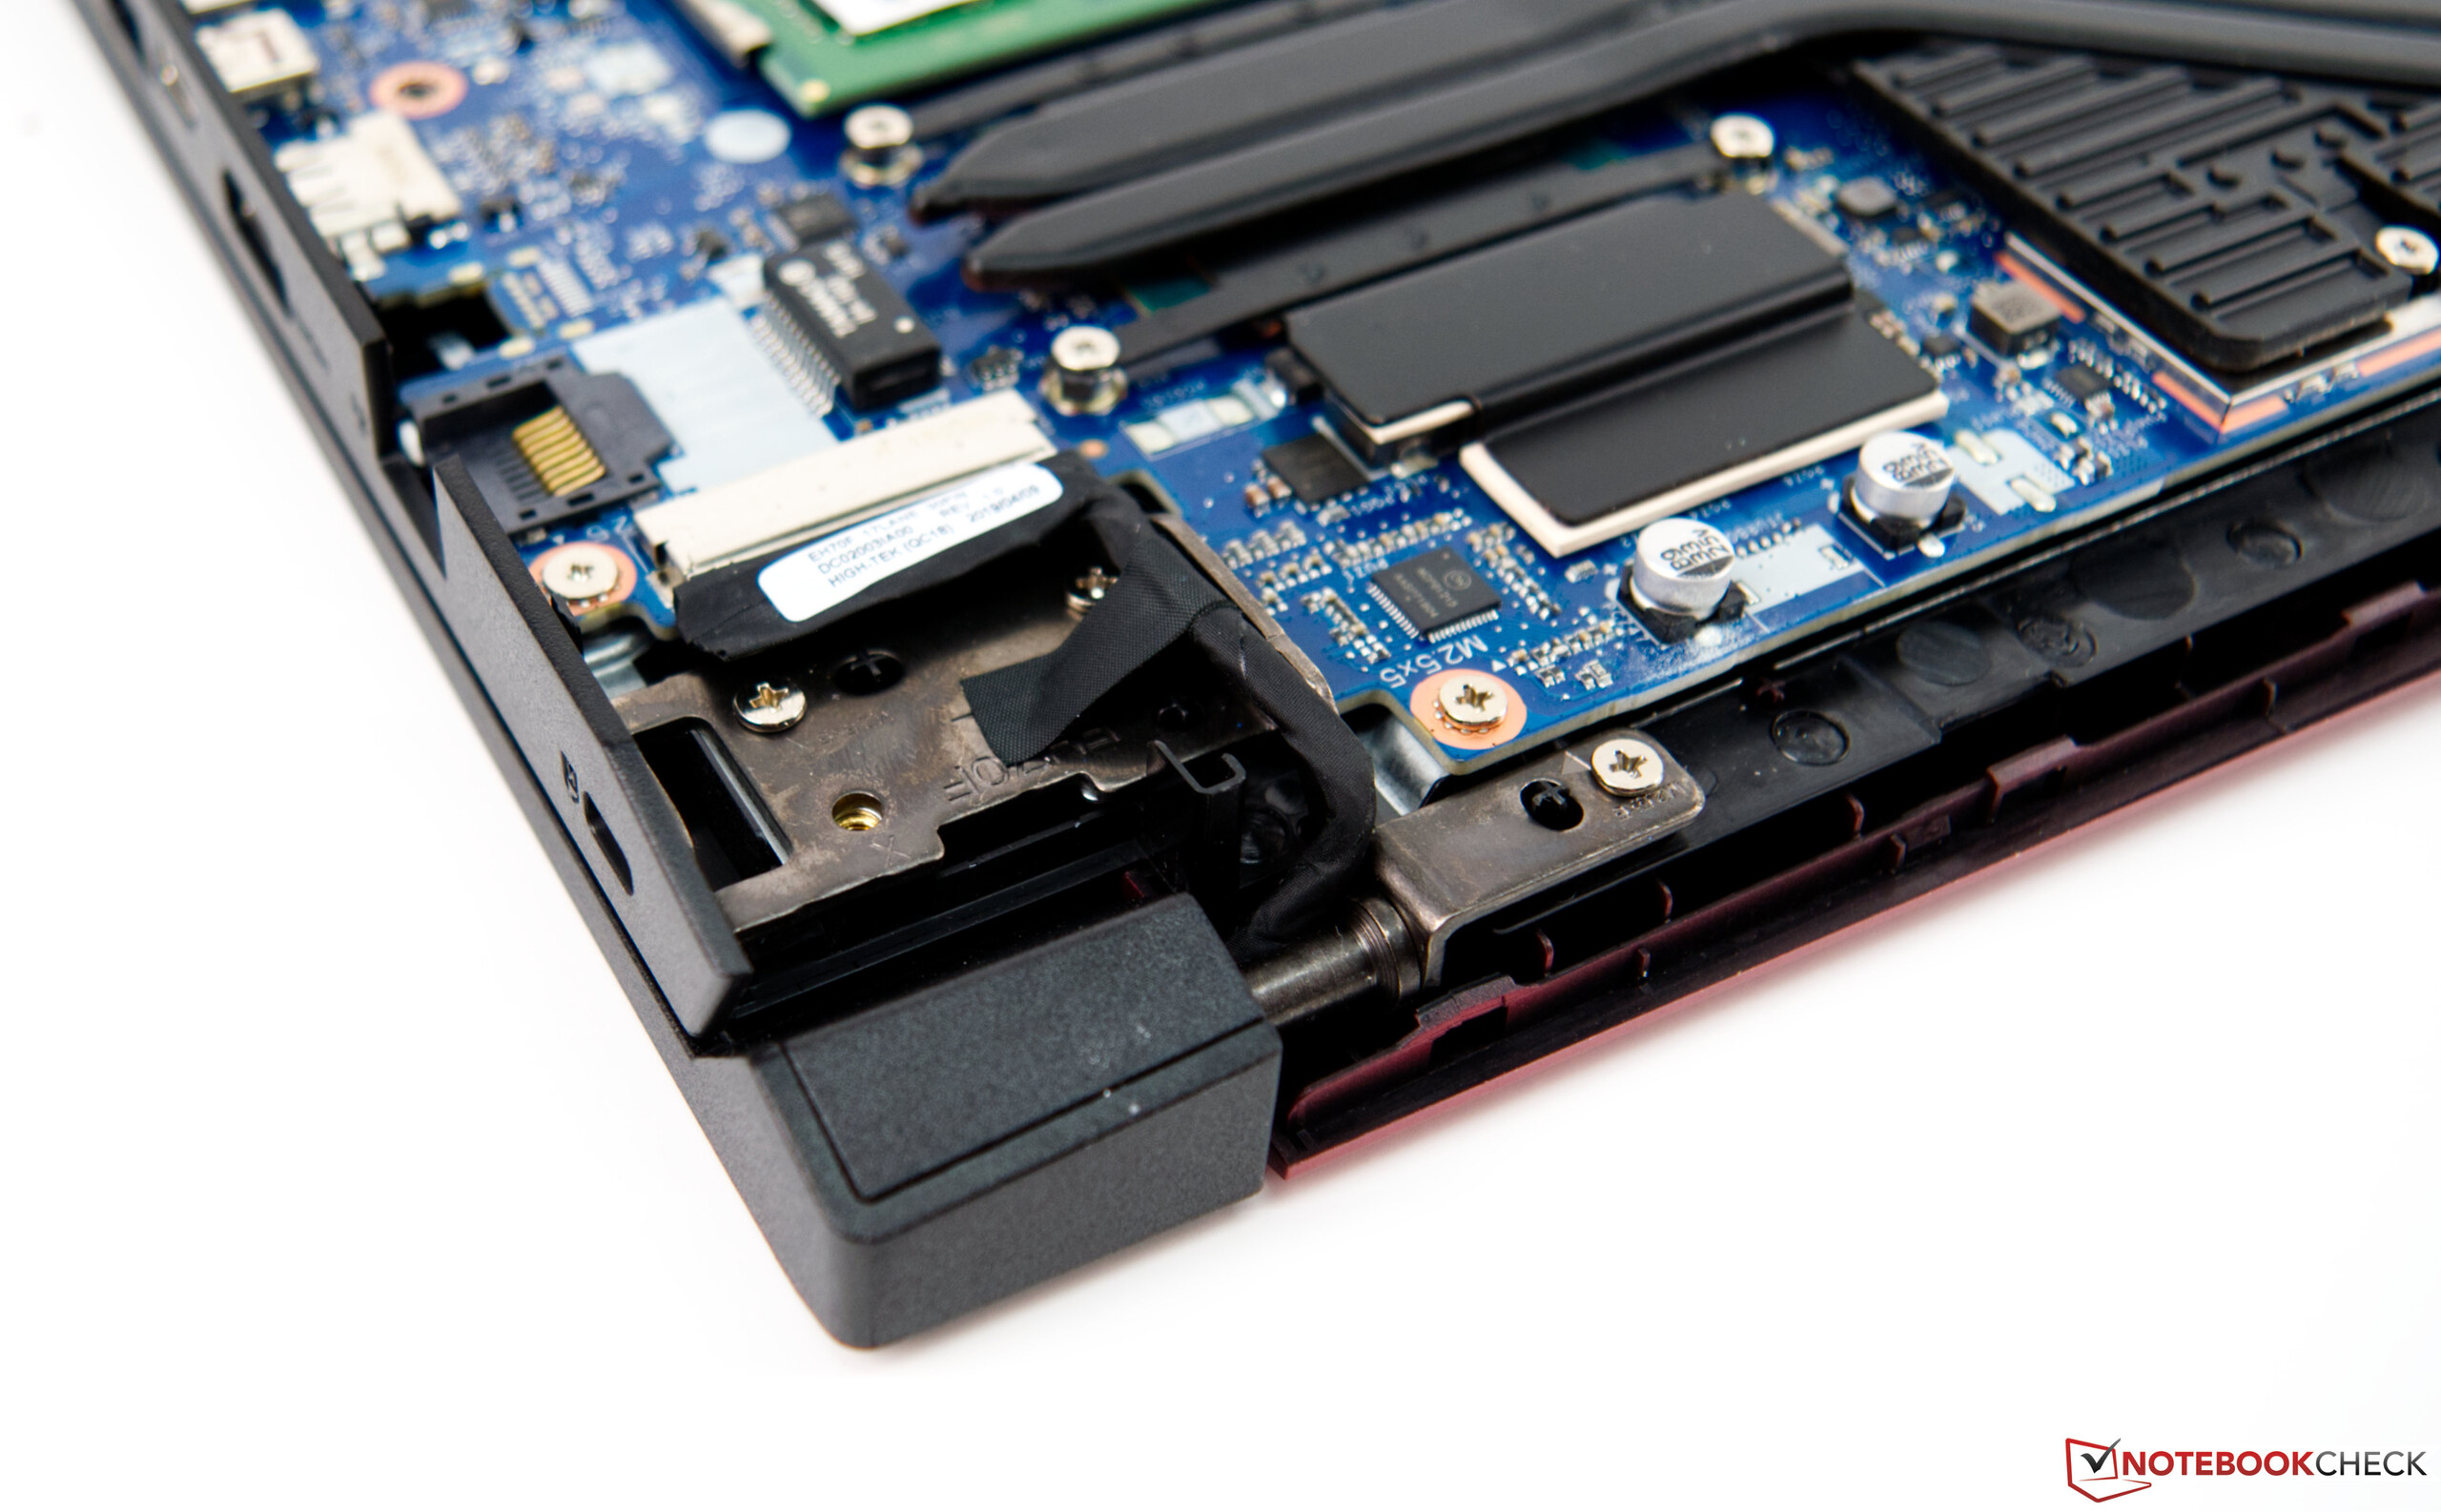
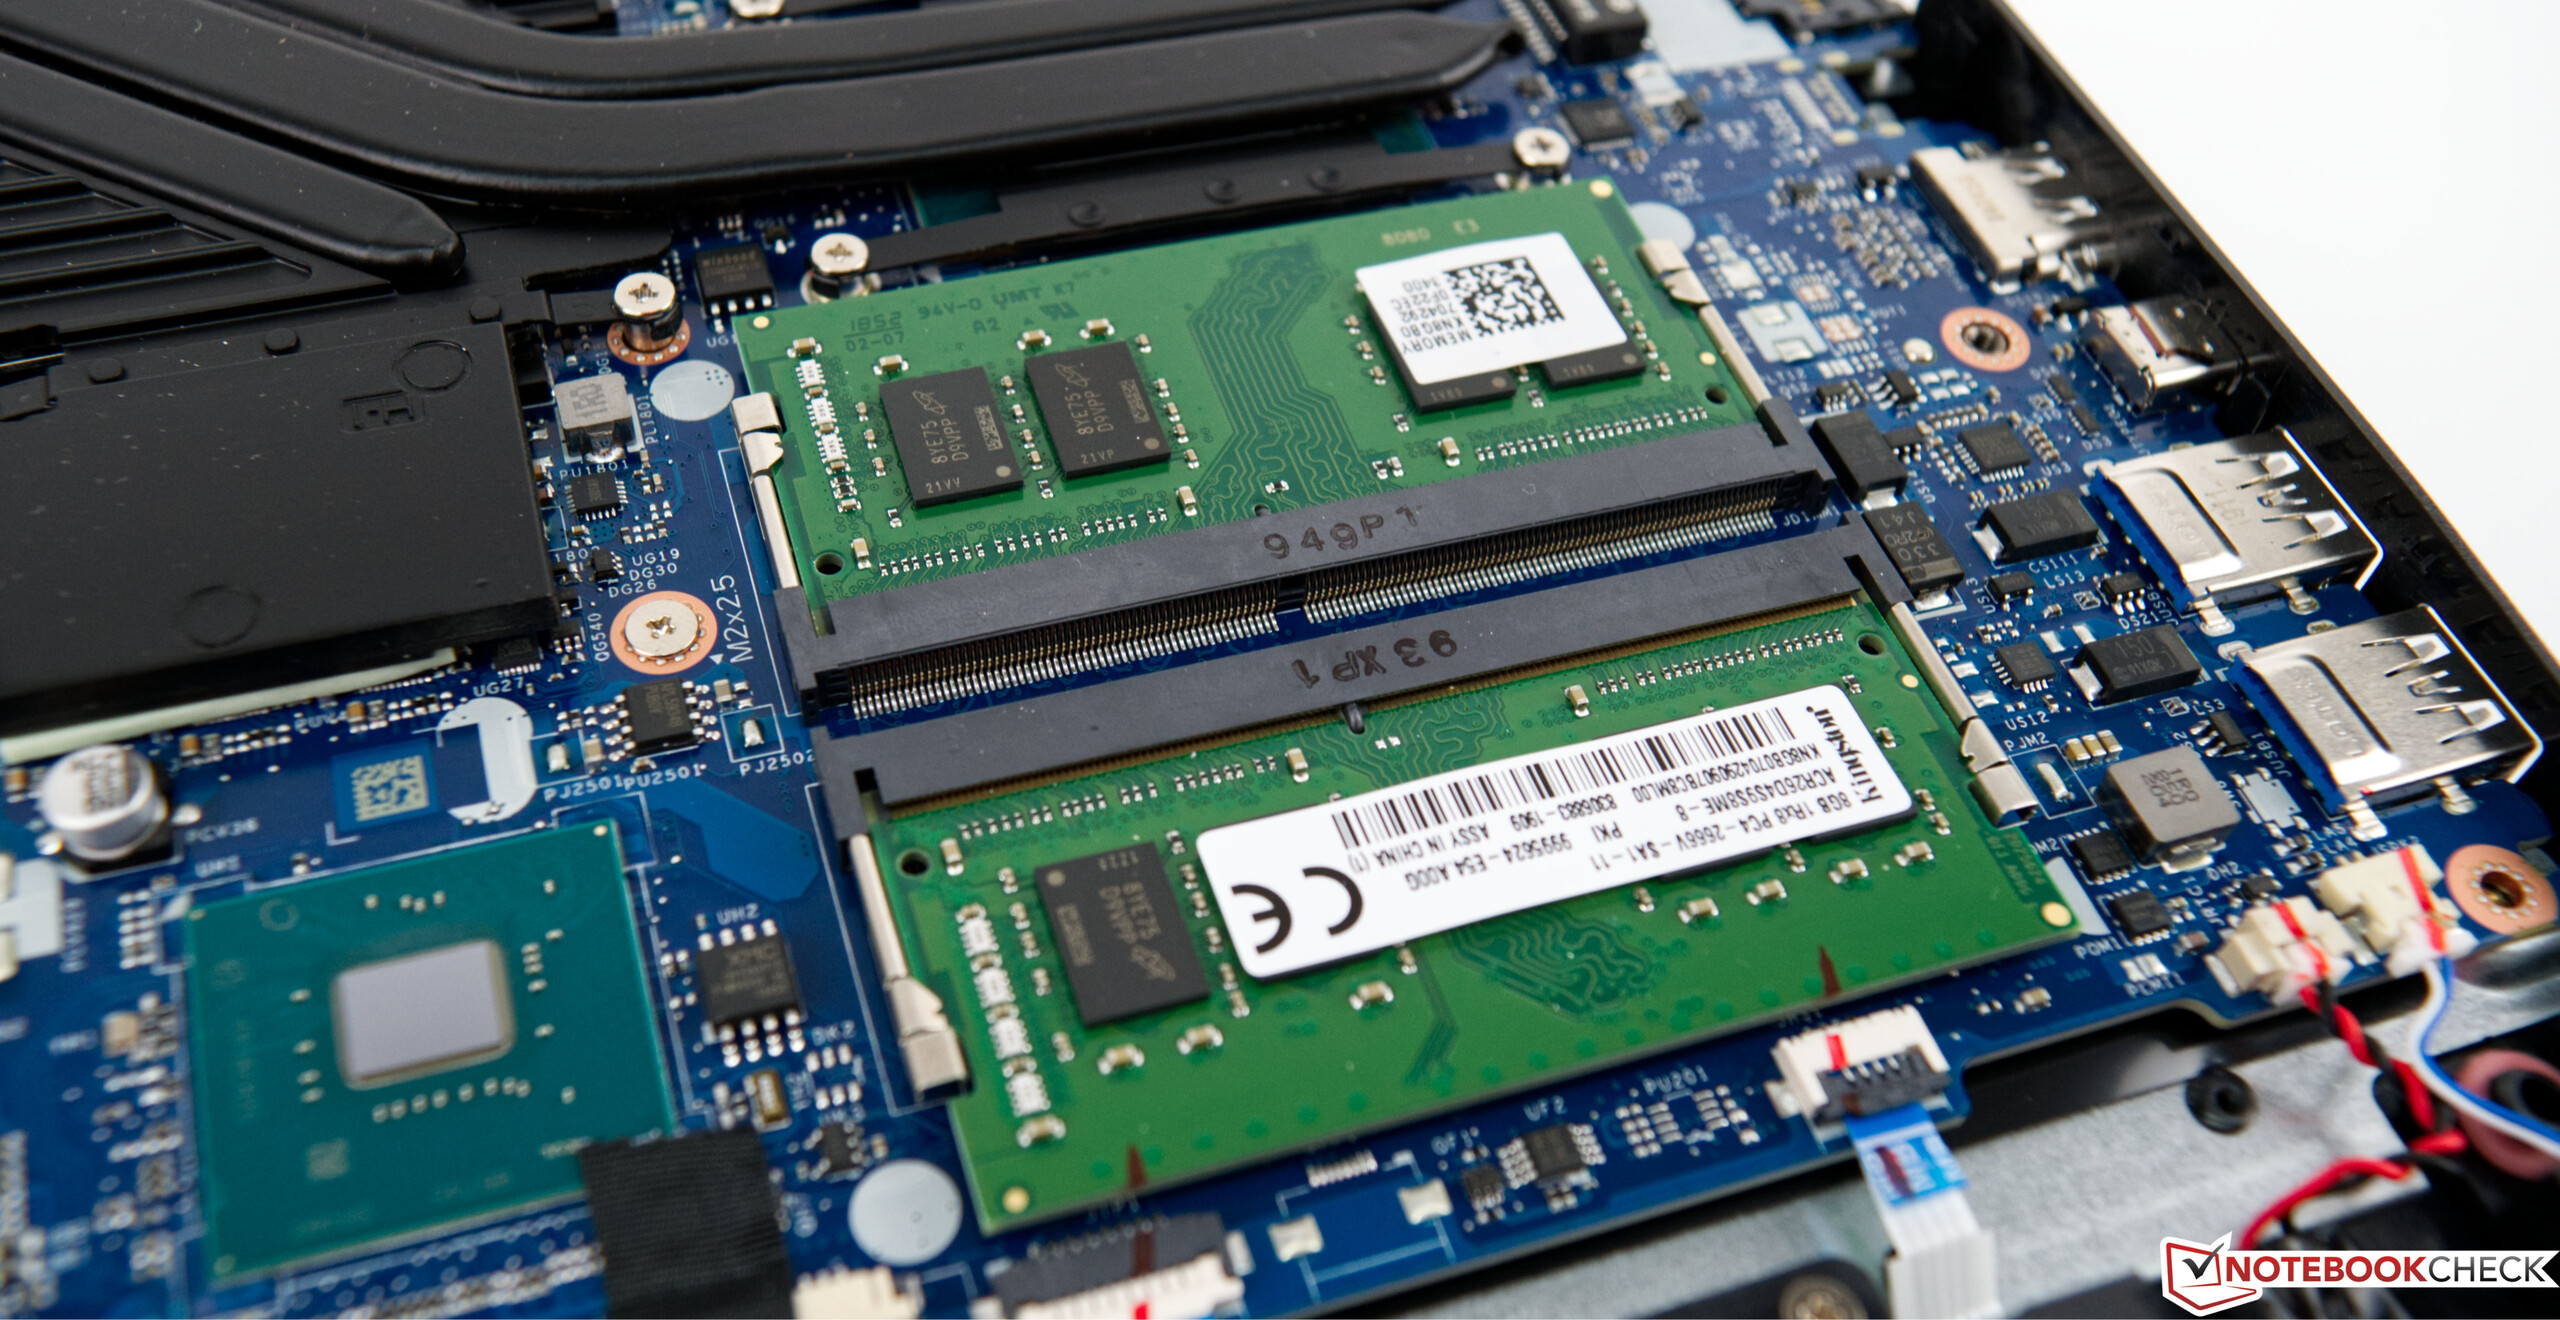
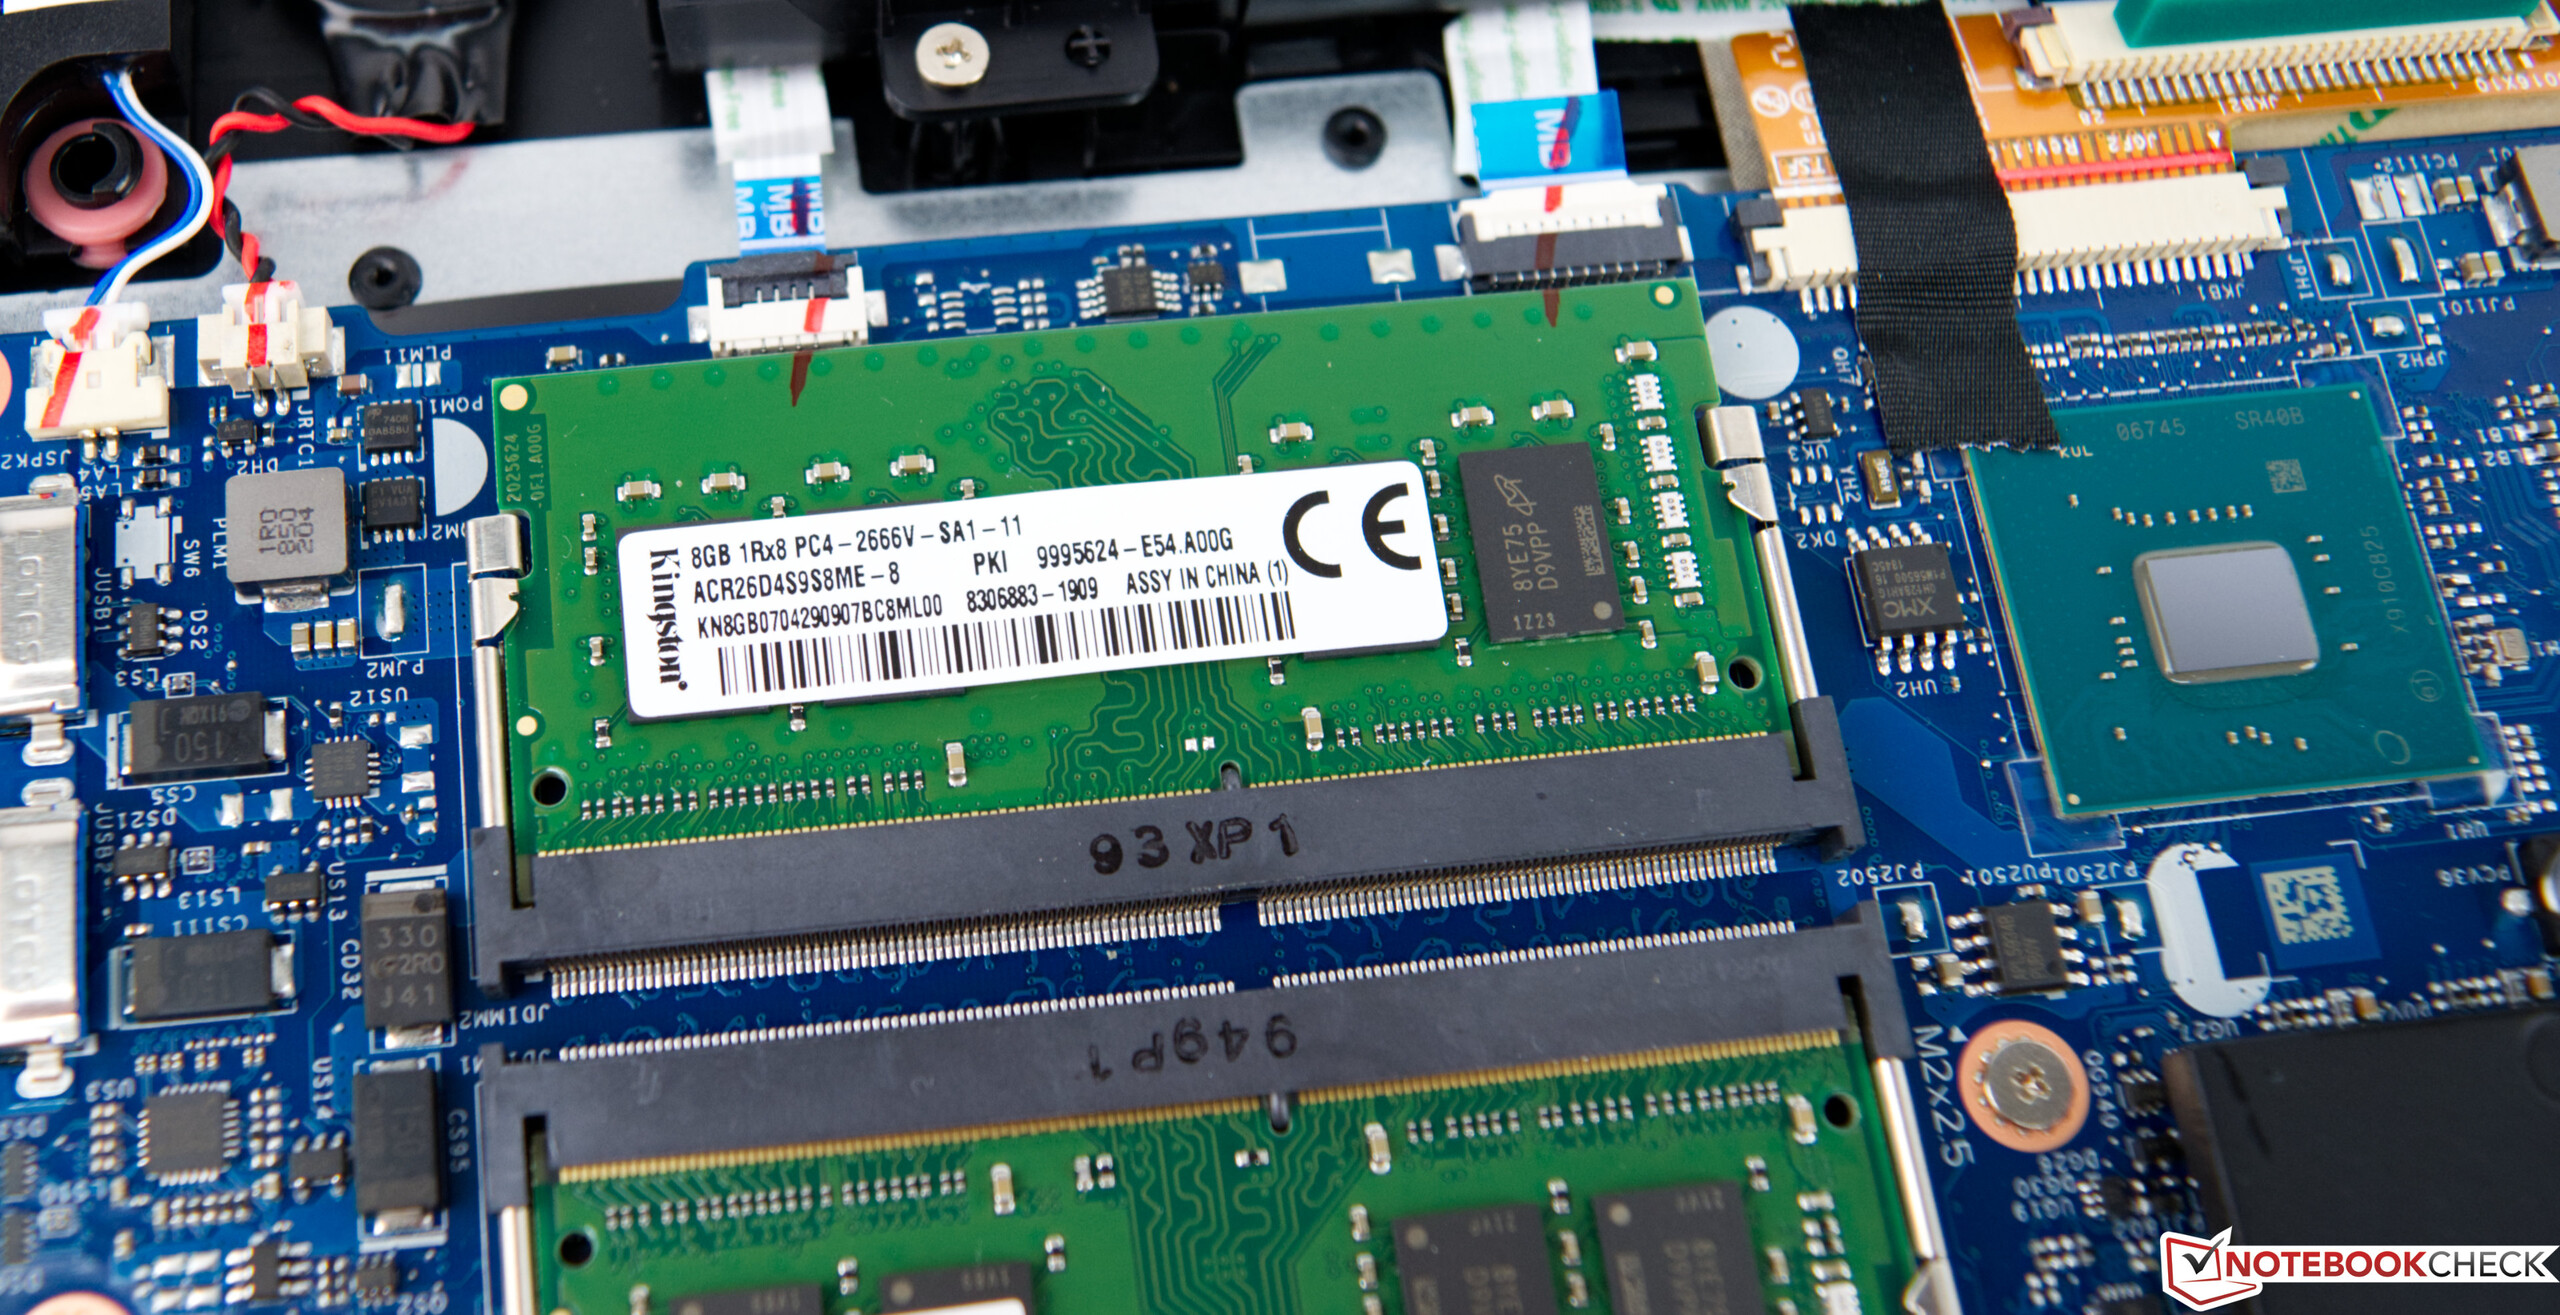
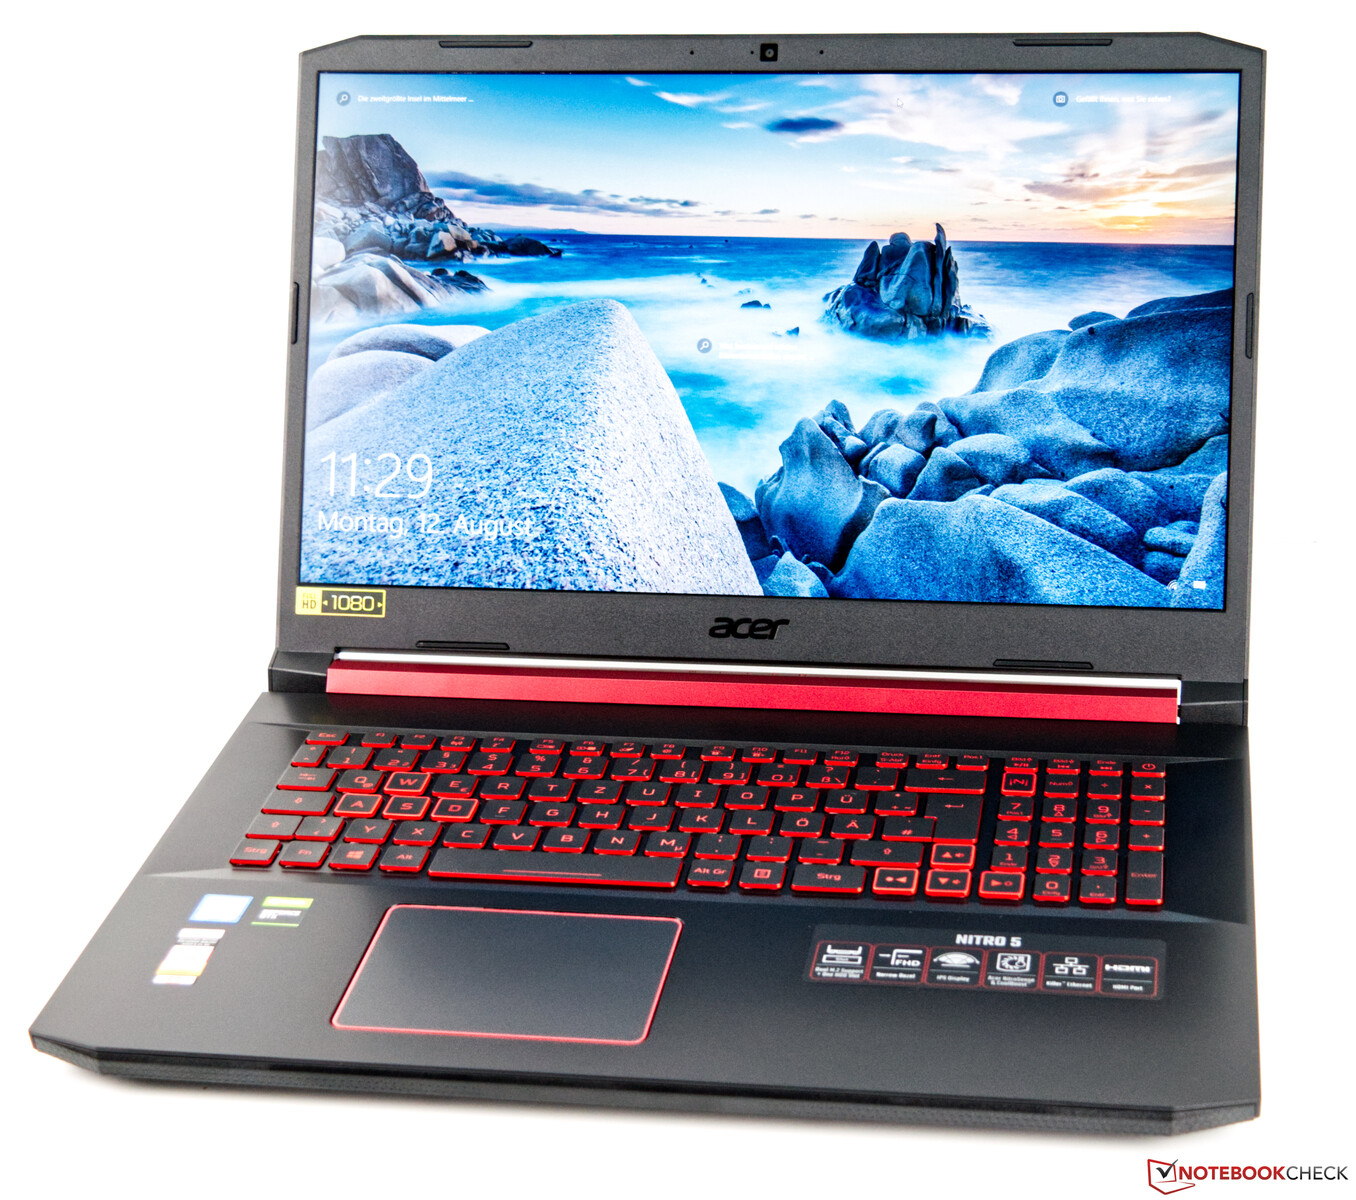
O Acer Aspire Nitro 5 AN517 é um portátil de jogos de 17,3 polegadas. Teoricamente, o Core i7-9750H e a GeForce GTX 1660 Ti devem criar um sistema potente, com 16 GB de RAM DDR4 de canal duplo e 1,5 TB de armazenamento combinado à disposição para garantir que o sistema funcione sem problemas. Infelizmente, a tela de 1080p não se adequa a um portátil para jogos, com seus tempos de resposta lentos e altos desvios DeltaE nos decepcionando durante nossos testes.
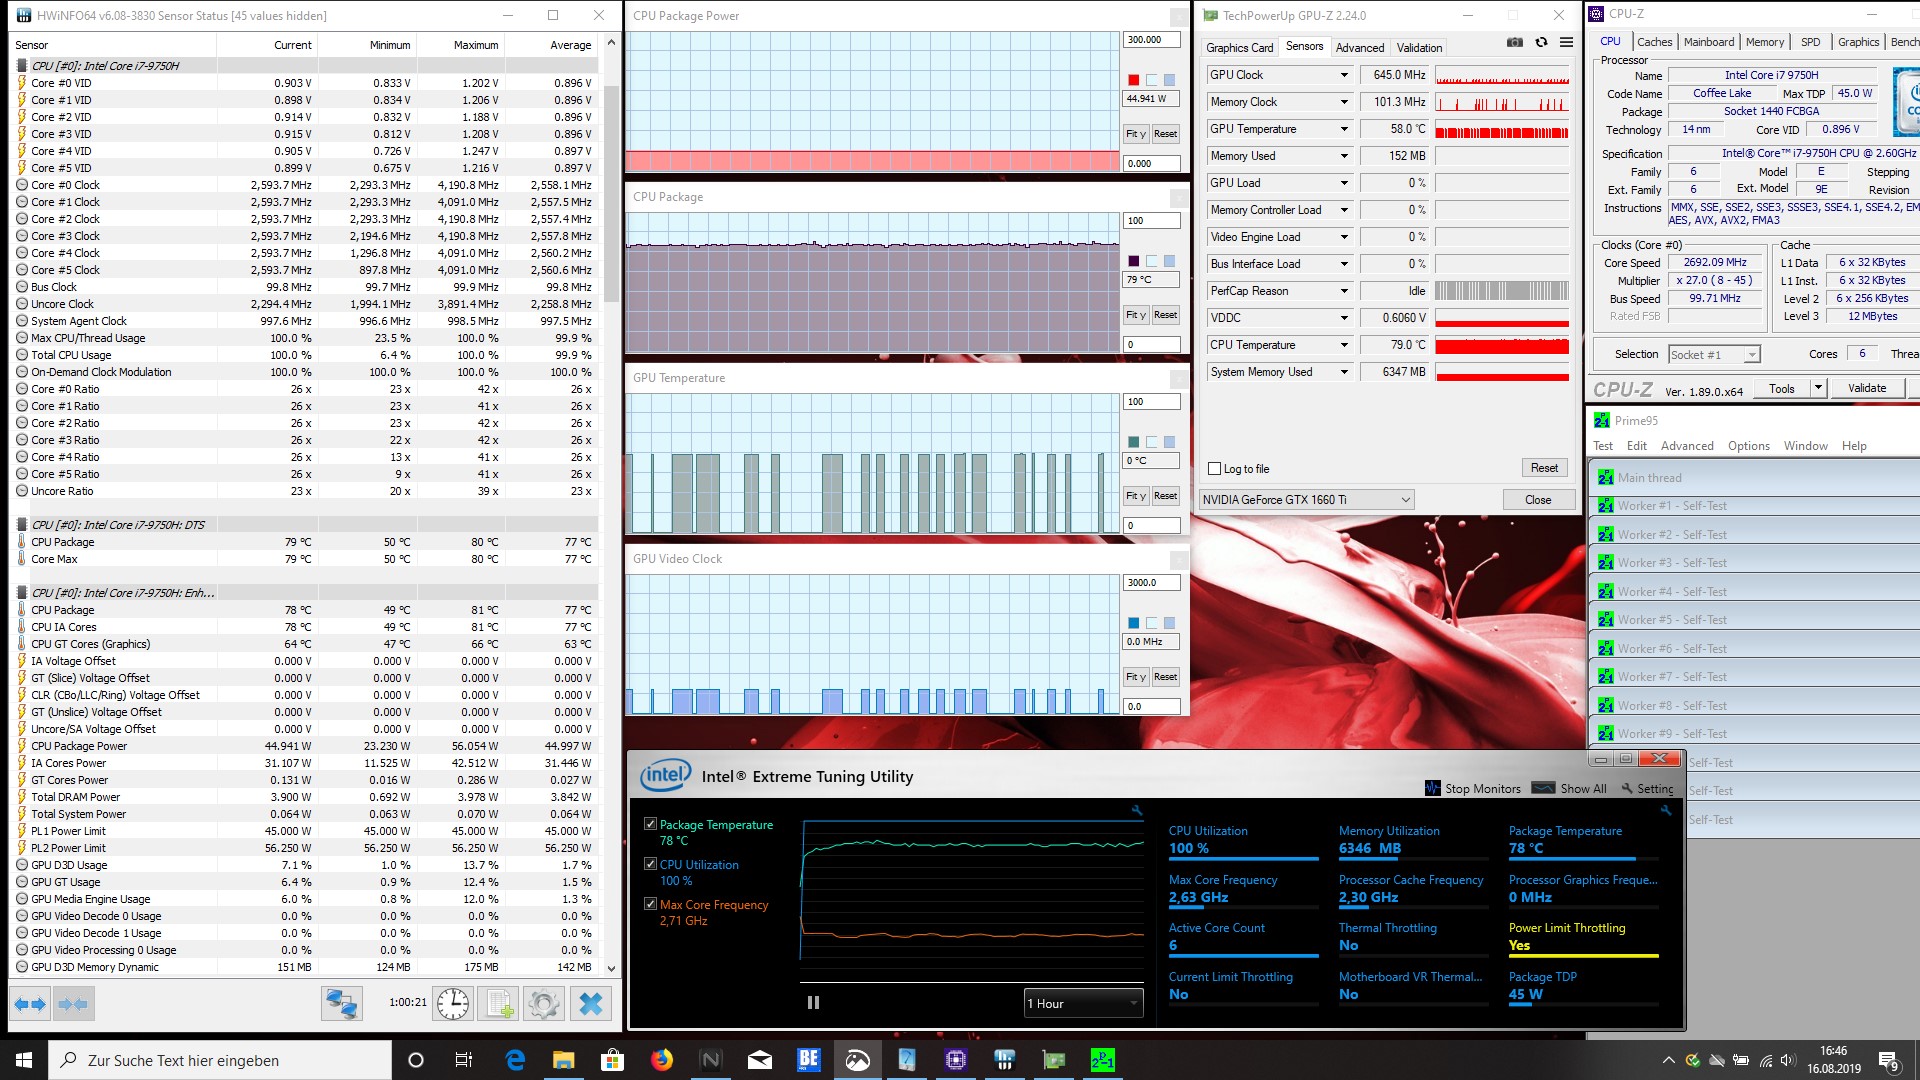
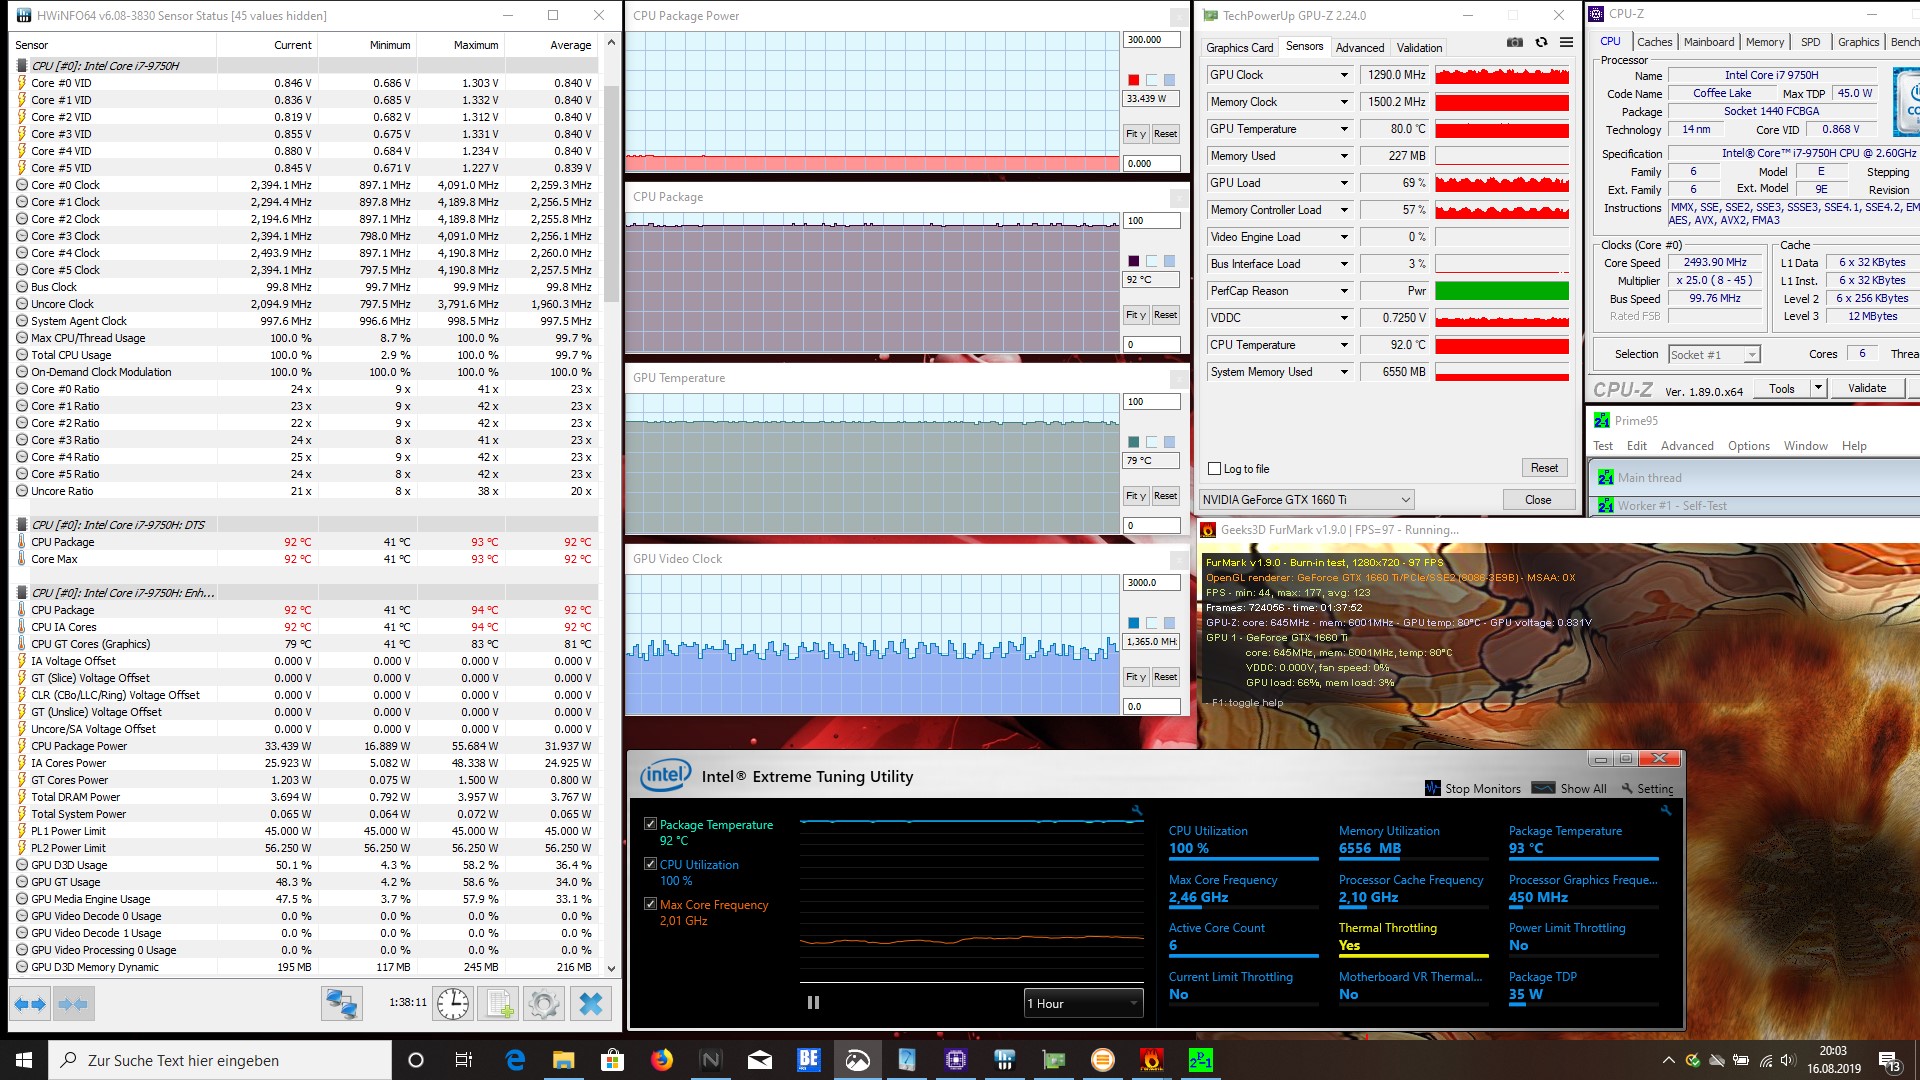
Como esperado, o Nitro 5 mostrou-se poderoso o suficiente para rodar todos os jogos triple-A modernos. No entanto, isso só se aplica a quando o dispositivo está conectado, com o sistema controlando fortemente a CPU e a GPU quando funciona com energia da bateria. Efetivamente, o Nitro 5 se torna um dispositivo de escritório com a bateria, embora isso também seja verdade para muitos portáteis modernos.
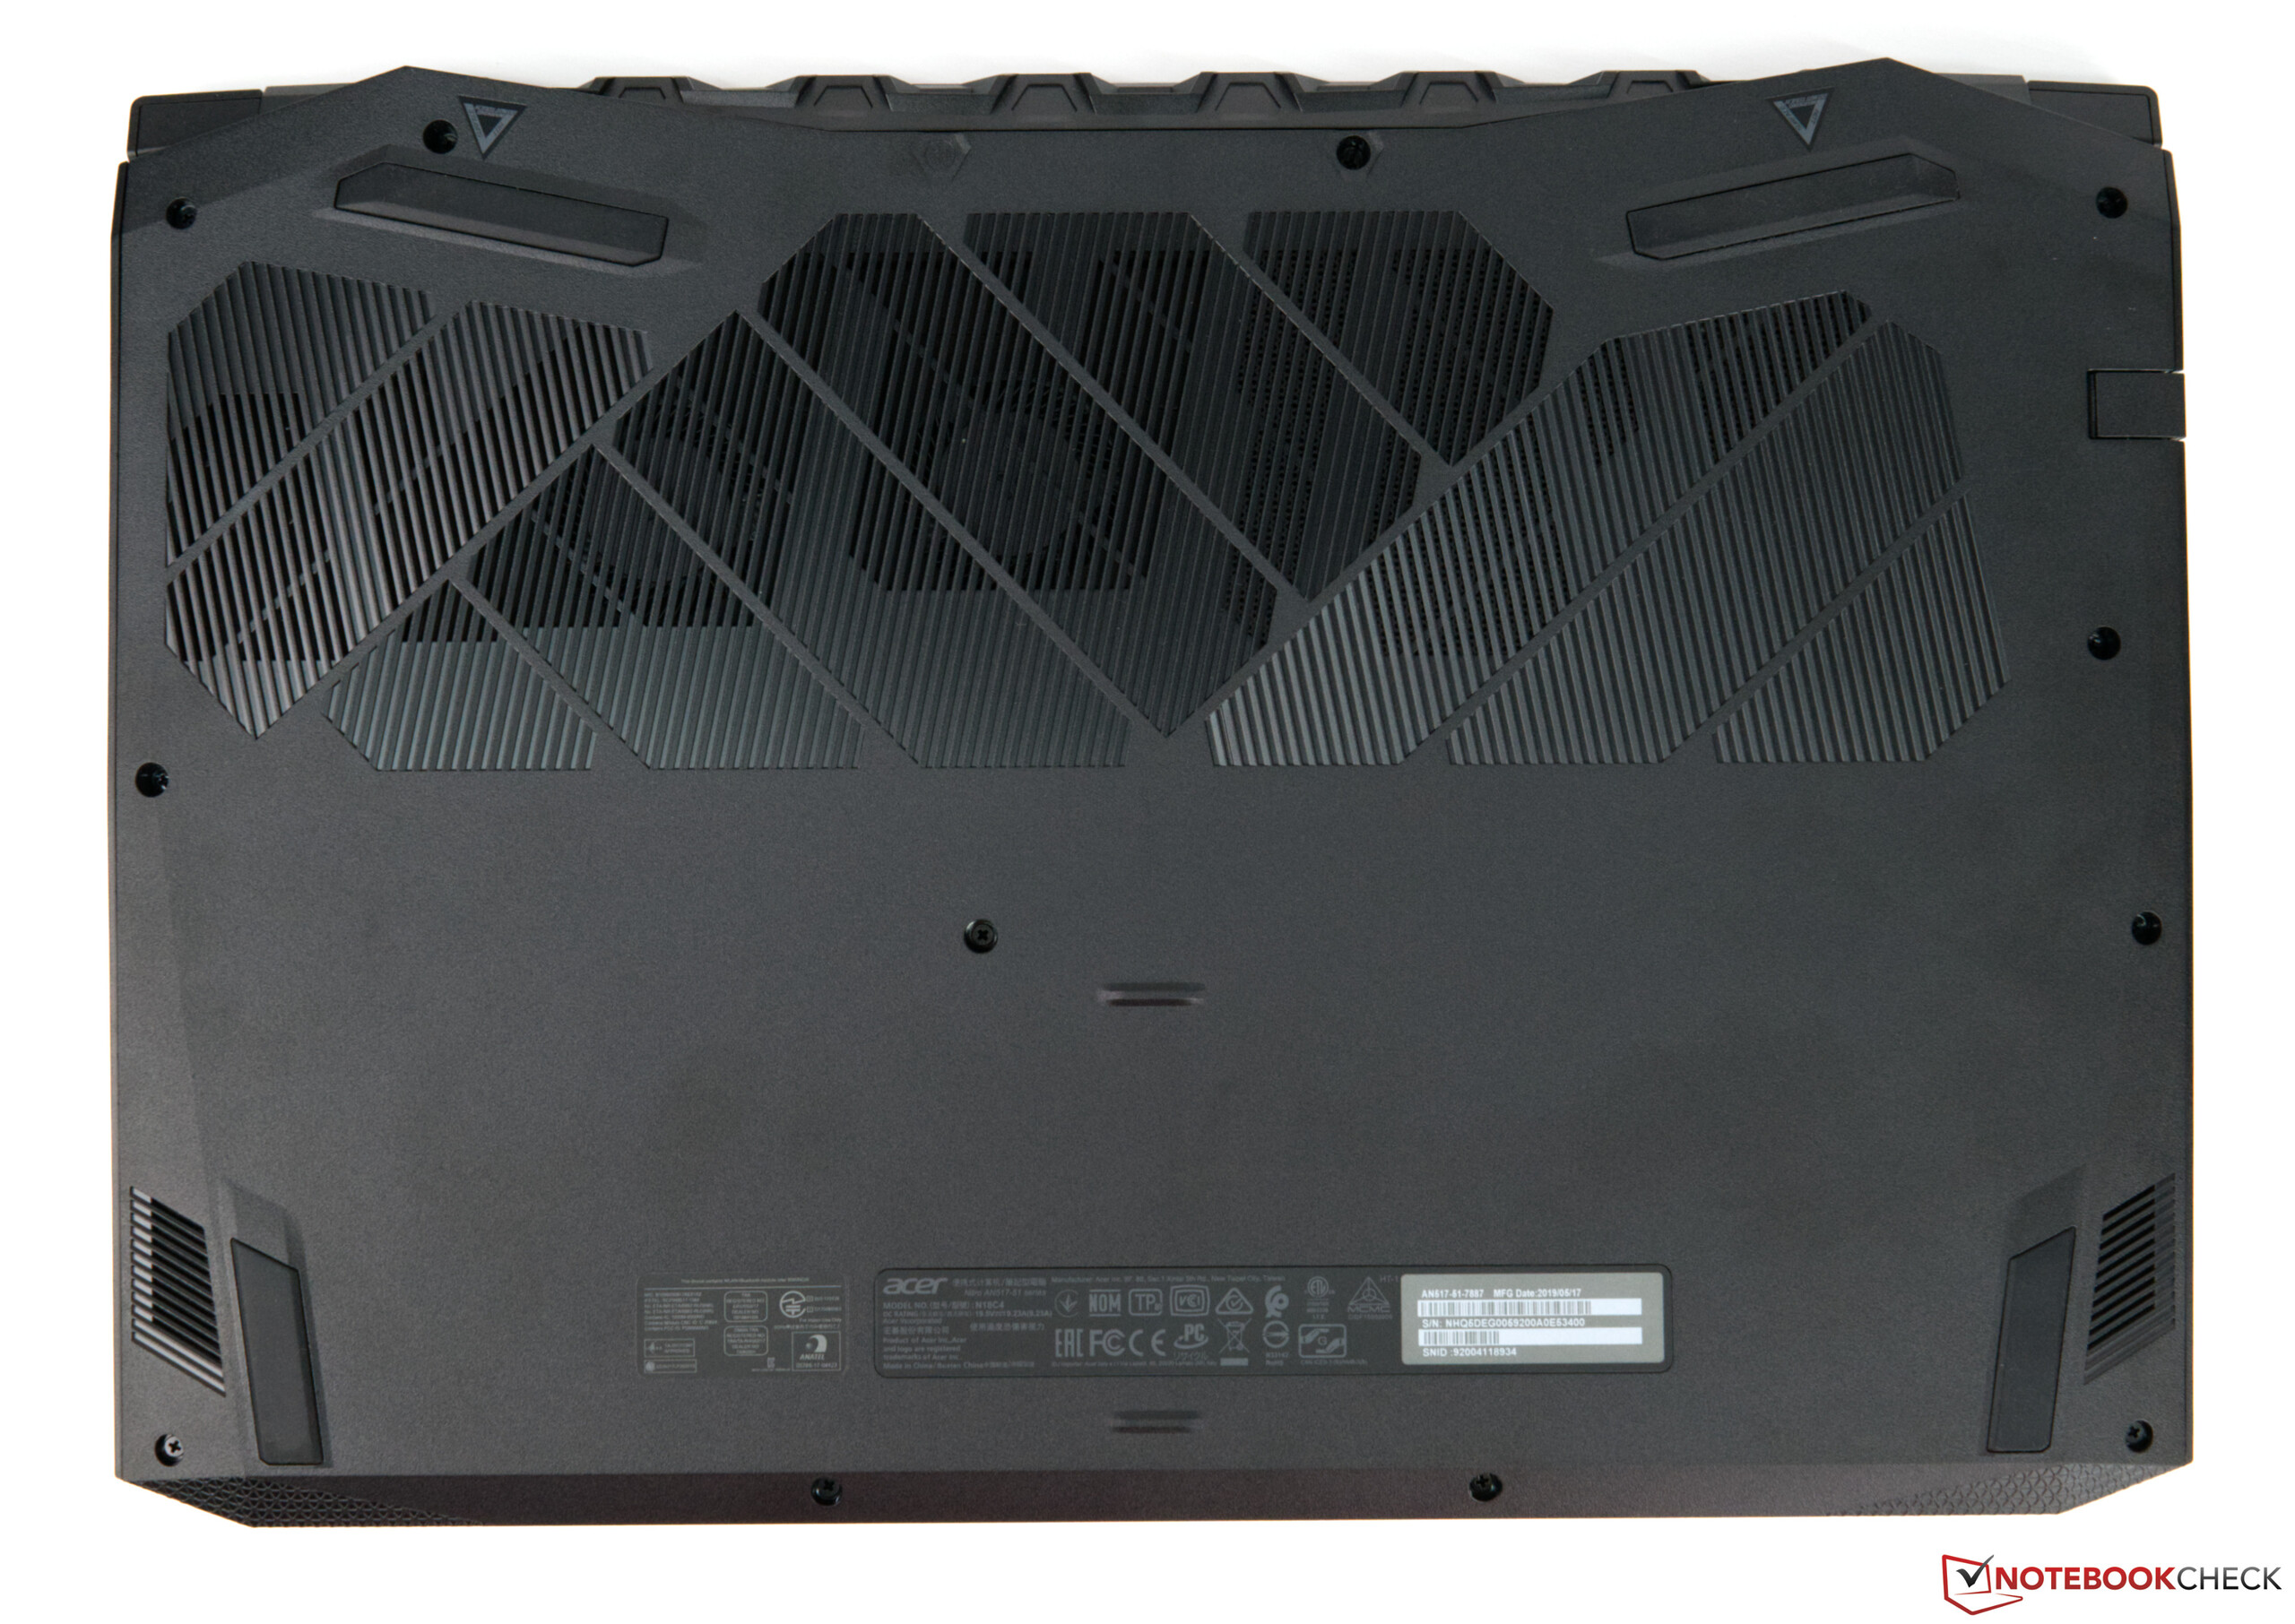
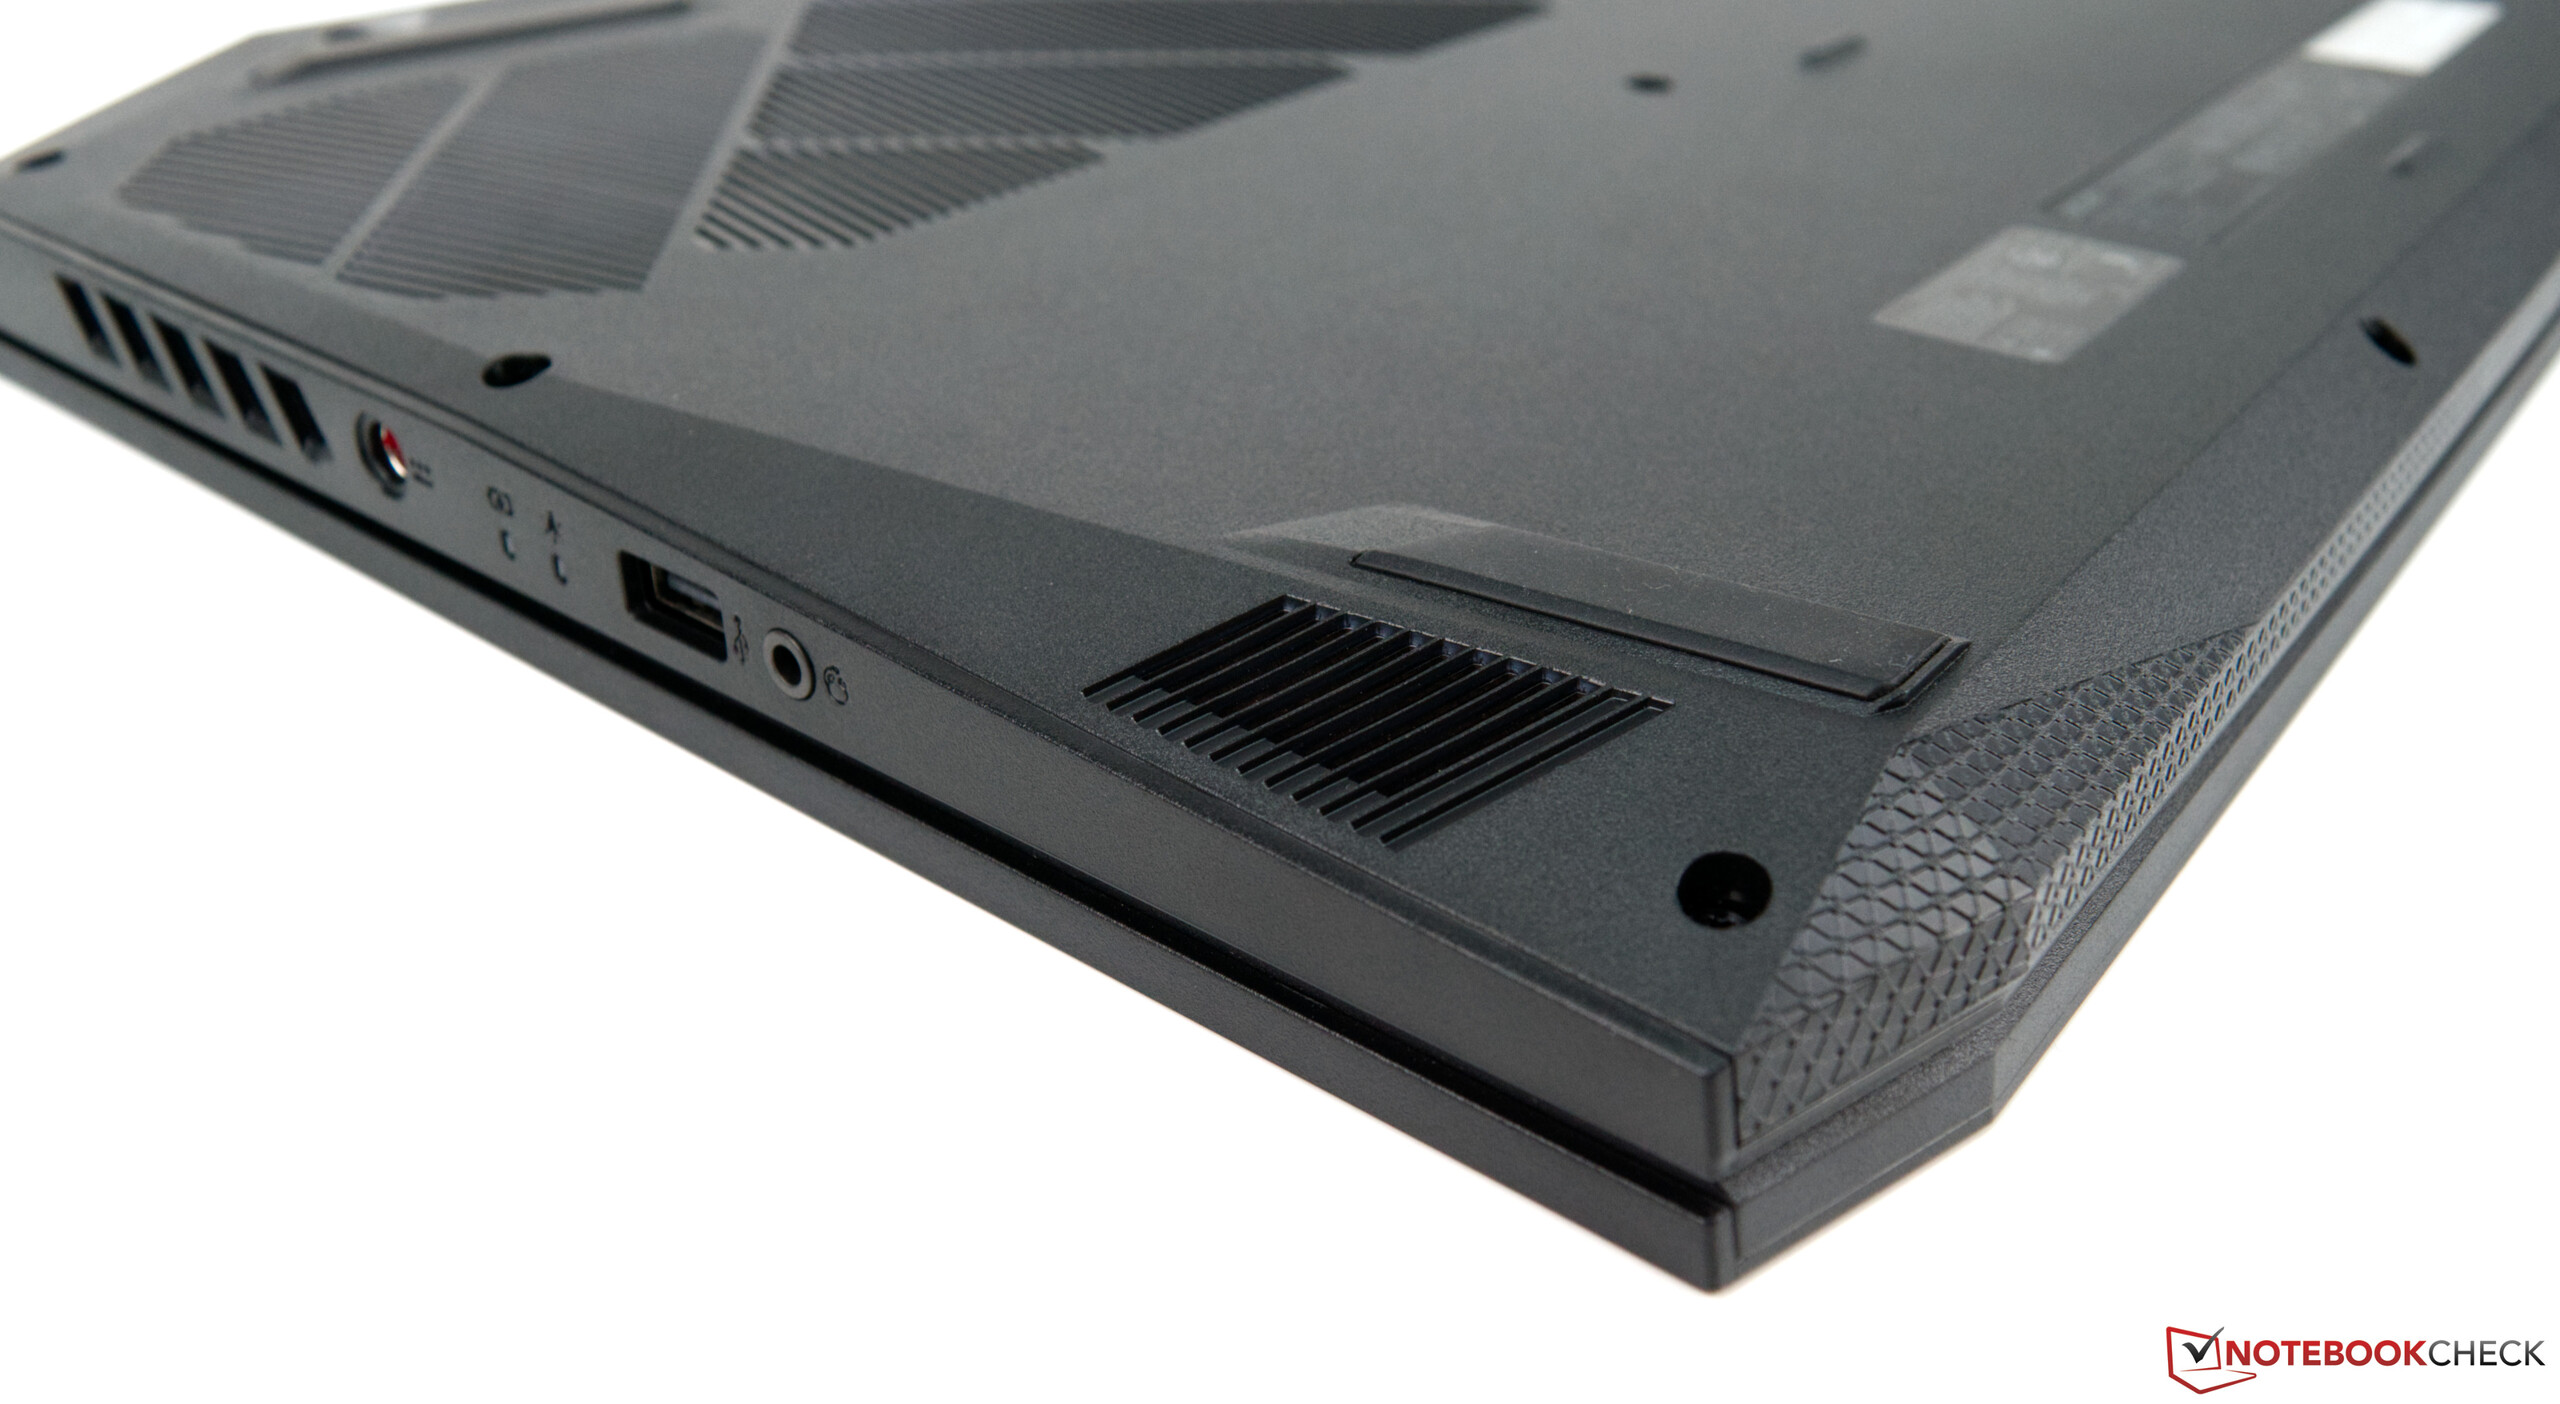
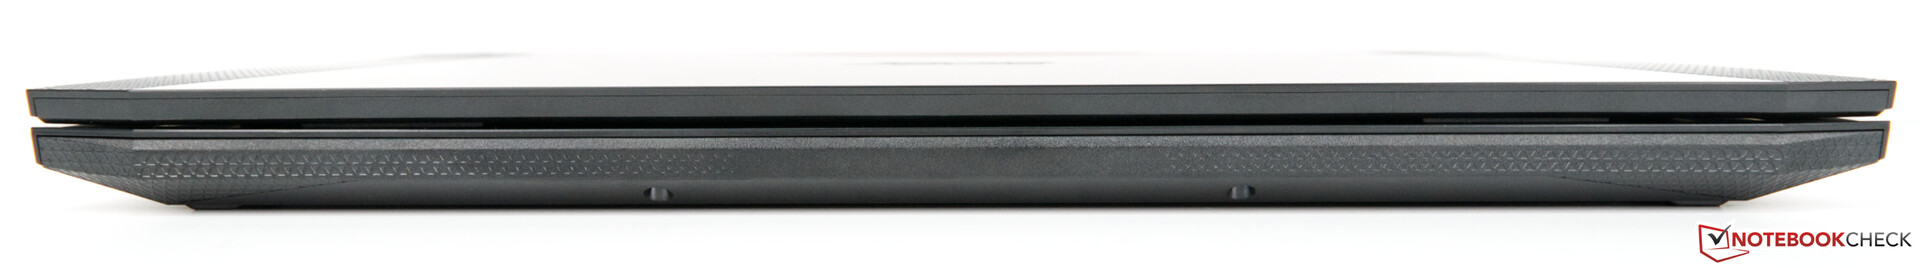
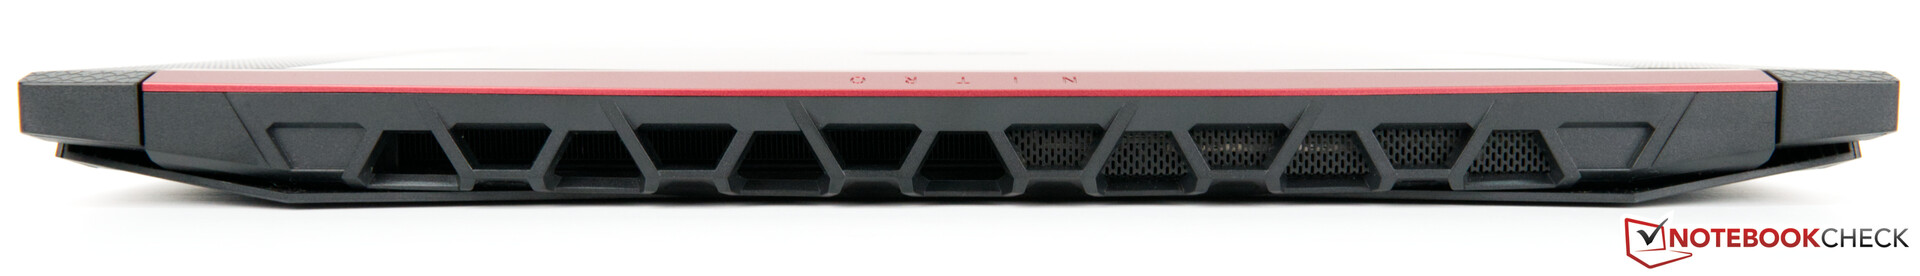
O design principalmente de plástico, apesar de robusto e bem construído, vai dividir a opinião, com o Nitro 5 parecendo e se sentindo mais barato do que seus concorrentes que são feitos totalmente em metal. Ainda assim, um design de plástico pode ser algo que valha a pena comprometer para um desempenho de jogos decente.
No entanto, o Nitro 5 destacou-se da multidão com o seu consumo de energia impressionantemente baixo, com um consumo mais como de um ultrabook em modo inativo do que um portátil de jogos. Da mesma forma, nossa unidade de análise obtém uma excelente duração da bateria de sua bateria de 57 Wh, com poucos dispositivos similares que se aproximam às durações alcançadas em nossos testes.
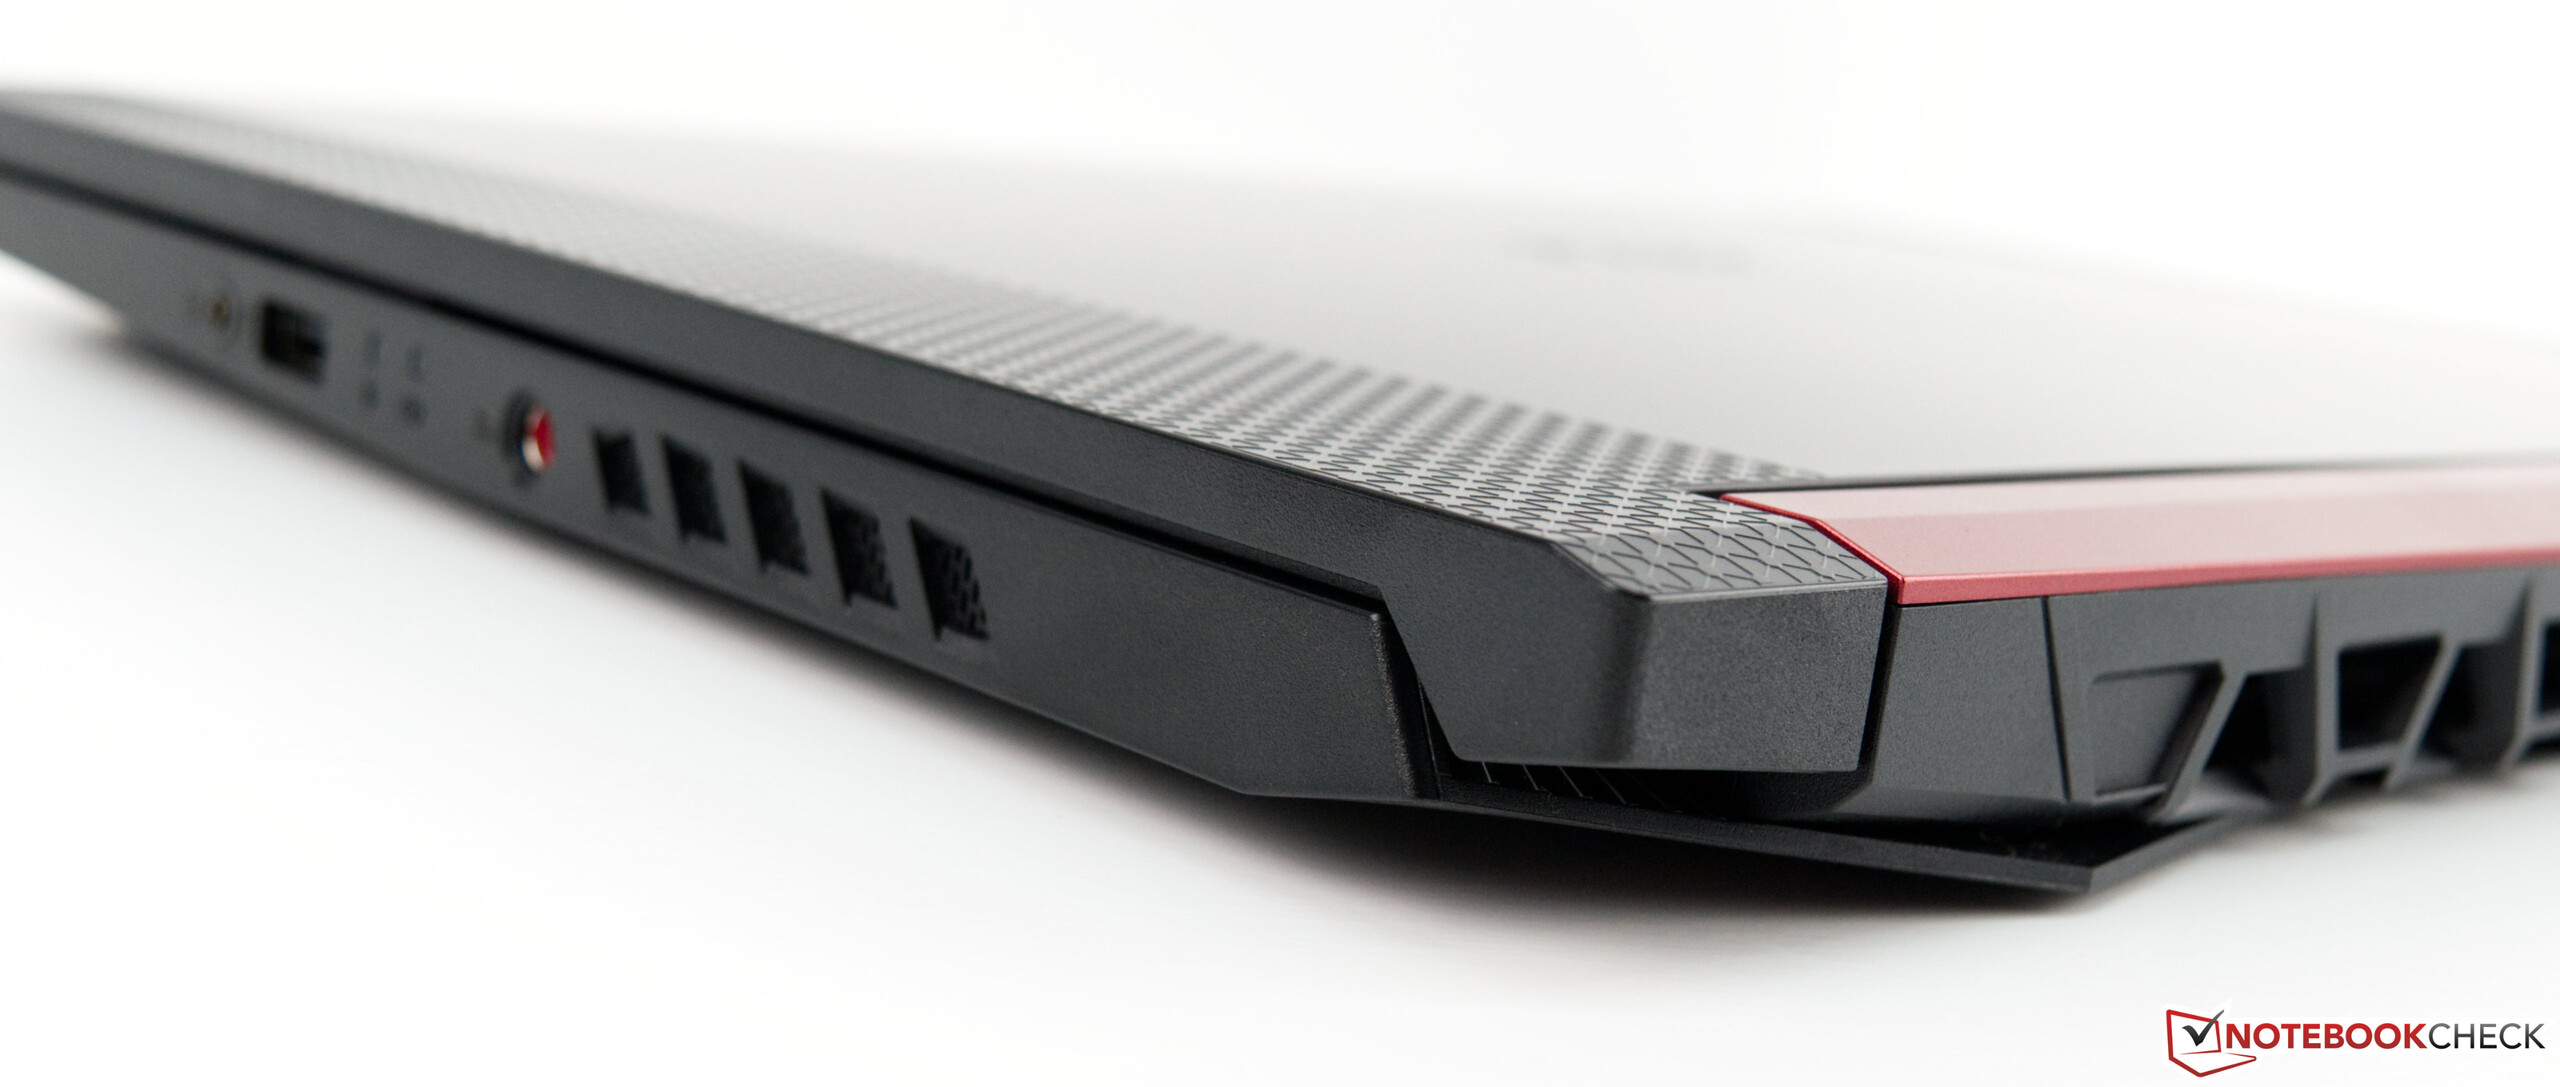
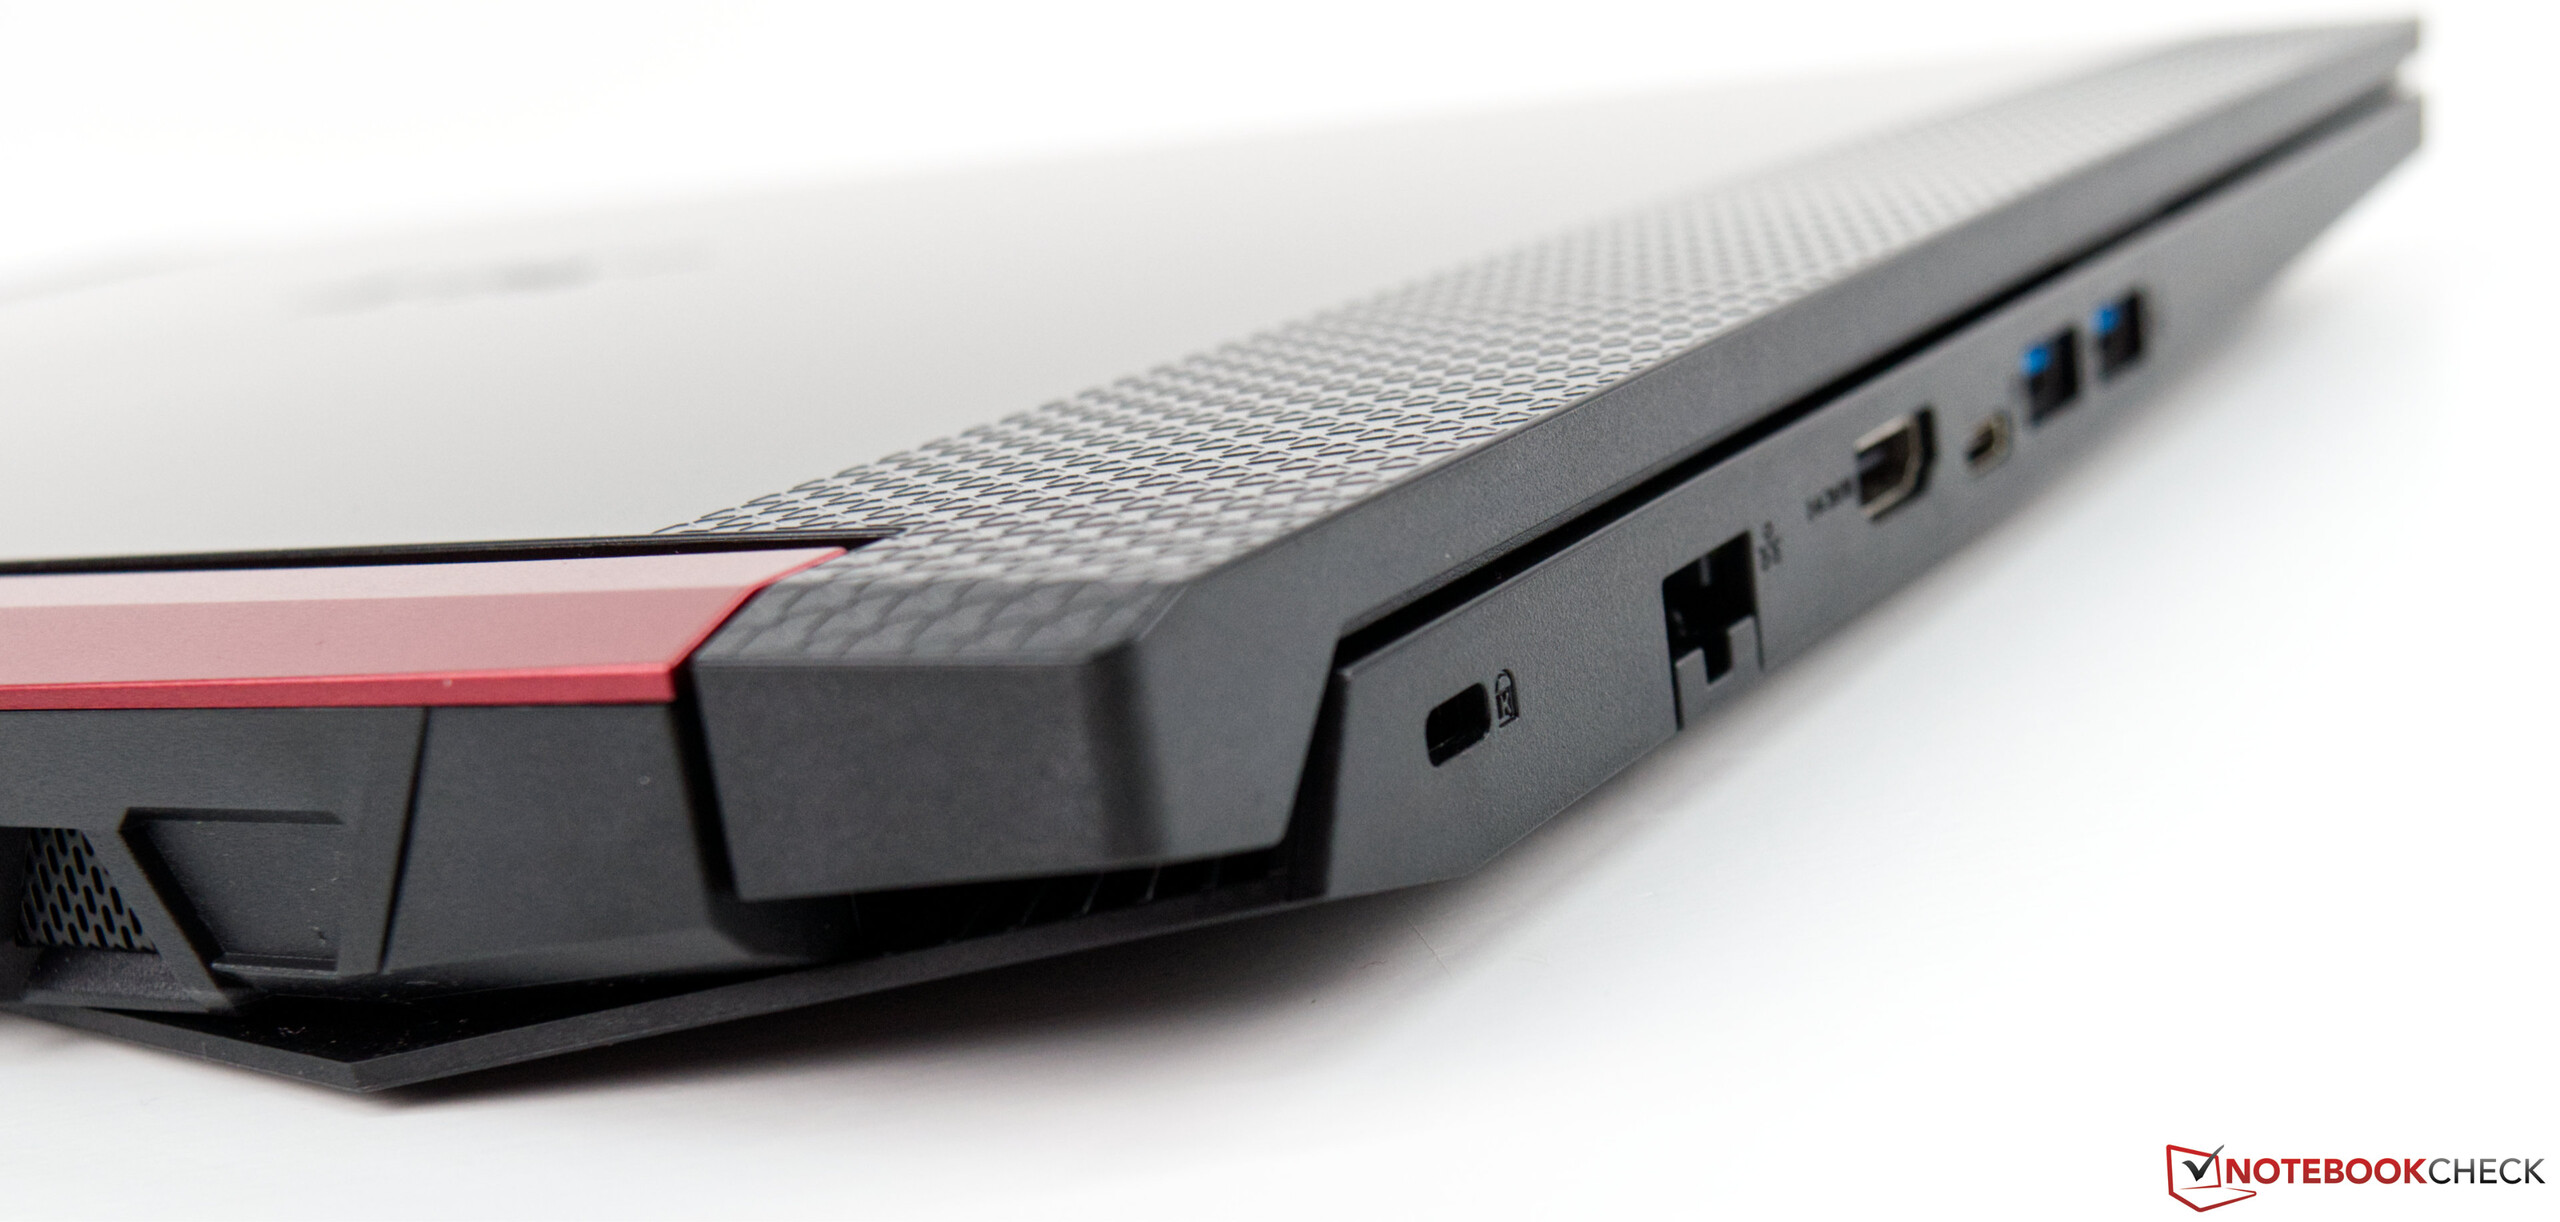
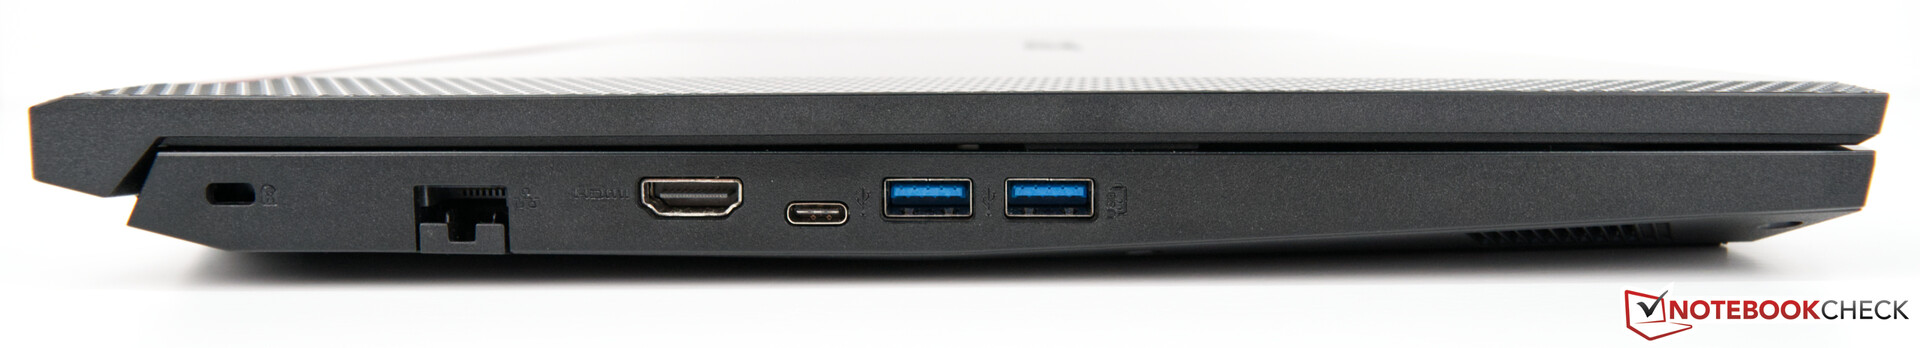
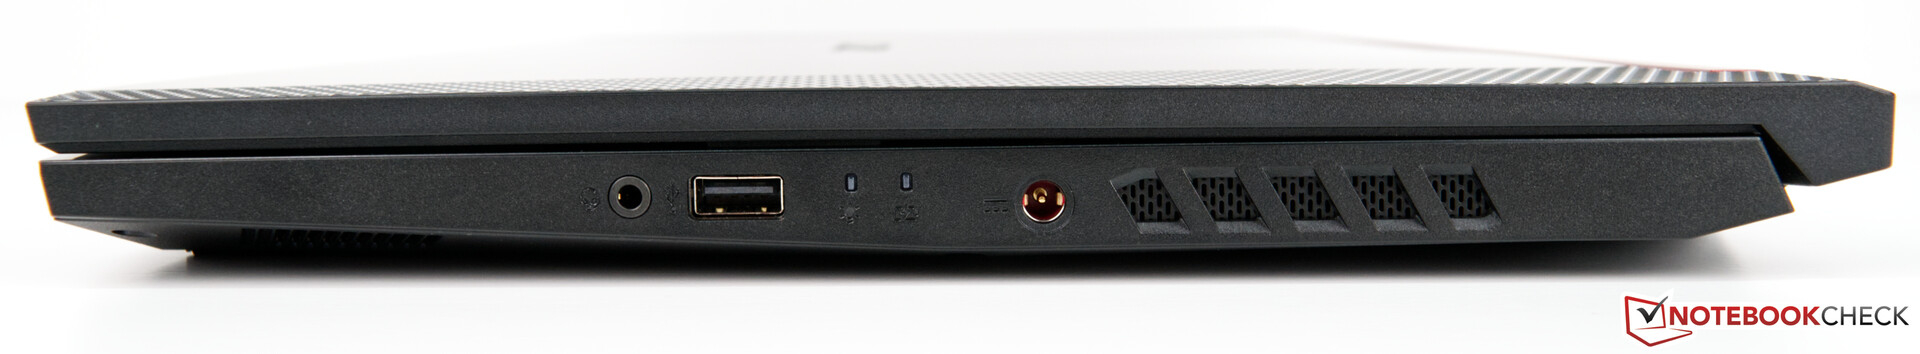
Infelizmente, o afogamento térmico também foi um problema durante os nossos testes, com o Nitro 5 restringindo sua CPU quando levamos ela e a GPU a seus limites em nossos testes de estresse. Tangencialmente, a Acer equipou o Nitro 5 com o mínimo de portas, o que é decepcionante. Um DisplayPort e um leitor de cartões SD teriam sido bem-vindos, especialmente considerando a quantidade de espaço livre entre as portas que estão presentes. Pior ainda, a porta Type-C também não suporta o DisplayPort, extinguindo as possibilidades de conectar o Nitro 5 a um monitor externo através daquela saída de vídeo.
O Acer Aspire Nitro 5 AN517 é um portátil de jogos econômico que acerta muito, particularmente sua duração de bateria acima da média e um consumo de energia comparativamente baixo. Seus ventiladores excessivos e agudos, longos tempos de reação da tela e design de plástico podem causar que as pessoas procurem outra coisa.
No geral, a Acer criou um portátil de jogos de 17,3 polegadas competente e acessível com hardware atual. Embora seja impossível atualizar a CPU ou GPU, o Core i7-9750H e a GTX 1660 Ti serão poderosas o suficiente por pelo menos alguns anos de jogos triple-A.
The Acer Aspire Nitro 5 AN517 is a sturdy 17.3-inch inch gaming laptop. Theoretically, the Core i7-9750H and GeForce GTX 1660 Ti should make for a powerful system, with the 16 GB of dual-channel DDR4 RAM and 1.5 TB of combined storage being on hand to ensure that the system runs smoothly. Unfortunately, the 1080p display does not befit a gaming laptop, with its slow response times and high DeltaE deviations disappointing us during our tests.
As expected, the Nitro 5 proved powerful enough for running all modern triple-A games. However, this only applies to when the device is plugged in, with the system throttling its CPU and GPU heavily when running on battery power. Effectively, the Nitro 5 becomes an office device on battery, although this is also true of many modern gaming laptops.
The mainly plastic design, despite being sturdy and well-built, will divide opinion, with the Nitro 5 looking and feeling cheaper than its all-metal competitors. Still, a plastic design may be something worth compromising over for decent gaming performance.
However, the Nitro 5 stood out from the crowd with its impressively low power consumption, with it sipping power more like an ultrabook at idle than a gaming laptop. Correspondingly, our review unit gets excellent battery life from its 57 Wh battery, with few comparable devices coming close to the runtimes that it achieved in our tests.
Unfortunately, thermal throttling proved an issue during our tests too, with the Nitro 5 restricting its CPU when we pushed it and the GPU to their limits in our stress tests. Tangentially, Acer has equipped the Nitro 5 with the bare minimum of ports, which is disappointing. A DisplayPort and an SD card reader would have been welcome additions, especially considering the amount of free space between the ports that are present. Worse still, the Type-C port does not support DisplayPort either, extinguishing the possibilities of connecting the Nitro 5 to an external monitor via that video output.
The Acer Aspire Nitro 5 AN517 is a solid budget gaming laptop that gets a lot right, particularly its above-average battery life and comparatively low power consumption. Its excessive and high-pitched fans, slow display reaction times and plastic design may have people looking elsewhere though.
Overall, Acer has created a competent and affordable 17.3-inch gaming laptop with current hardware. While it is impossible to upgrade the CPU or GPU, the Core i7-9750H and GTX 1660 Ti will be powerful enough for at least a few years of triple-A gaming.
Acer Aspire Nitro 5 AN517-51-7887
- 08/21/2019 v6 (old)
Sebastian Bade
Price comparison
