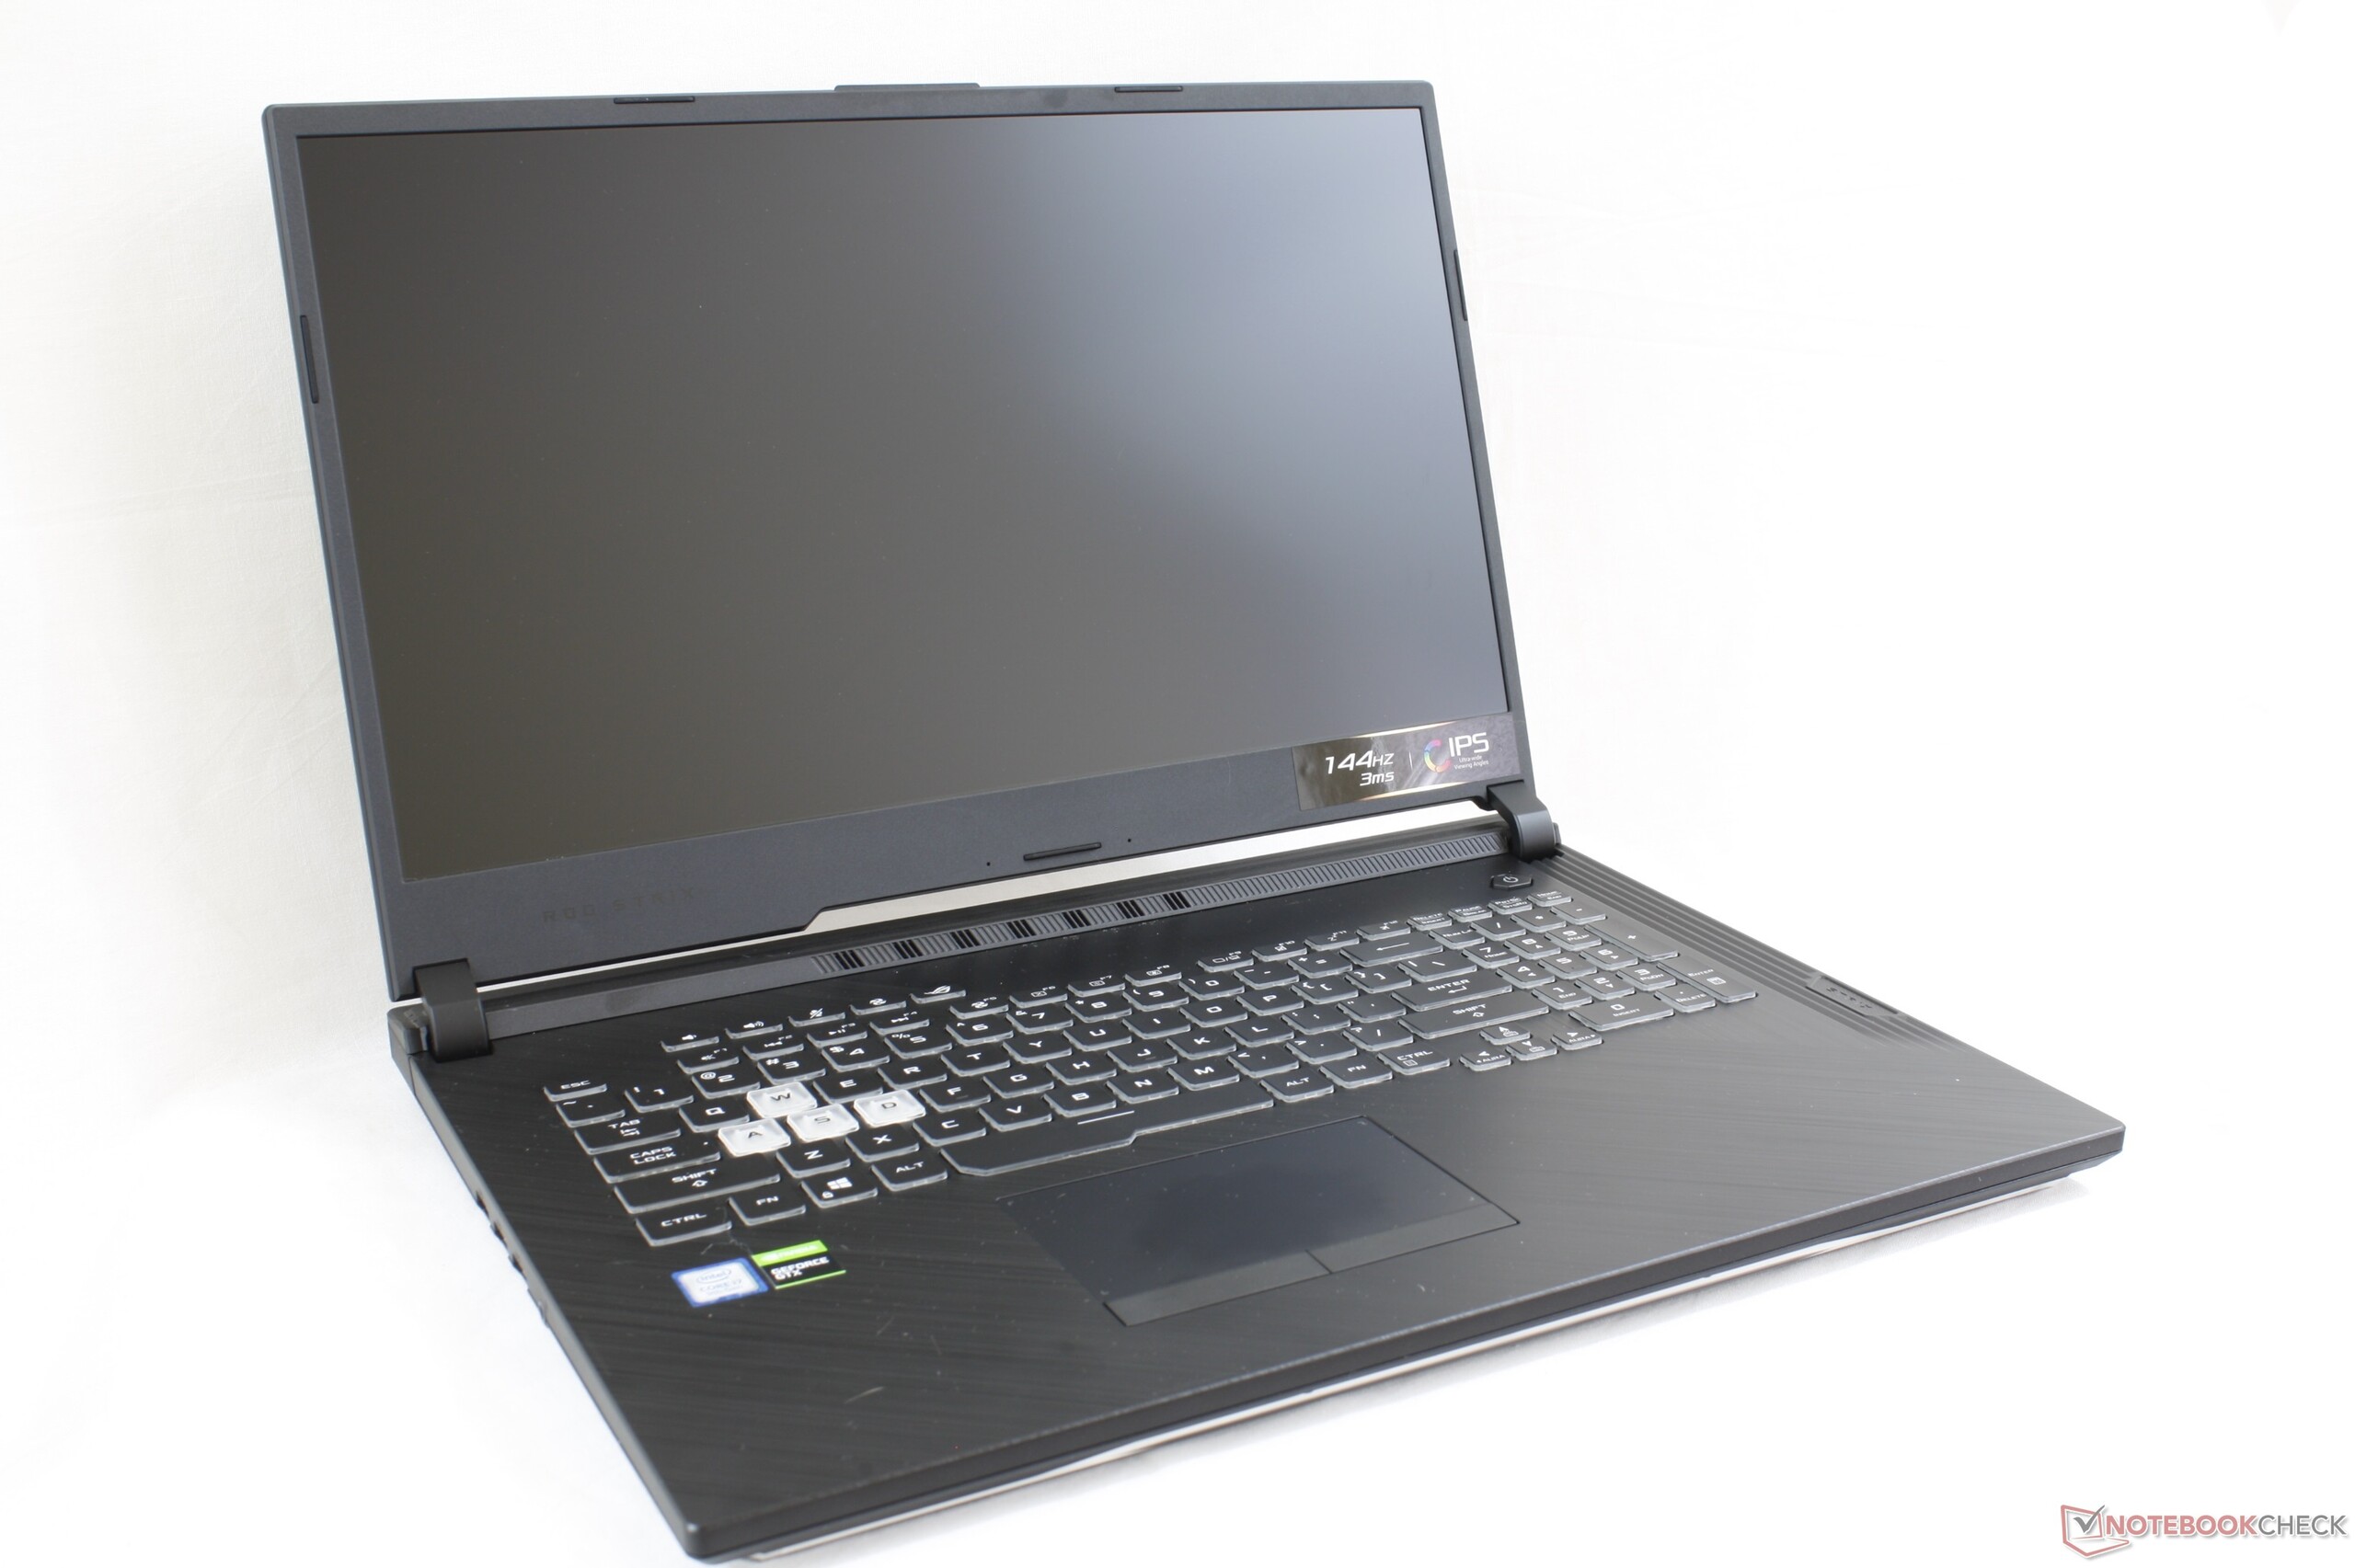
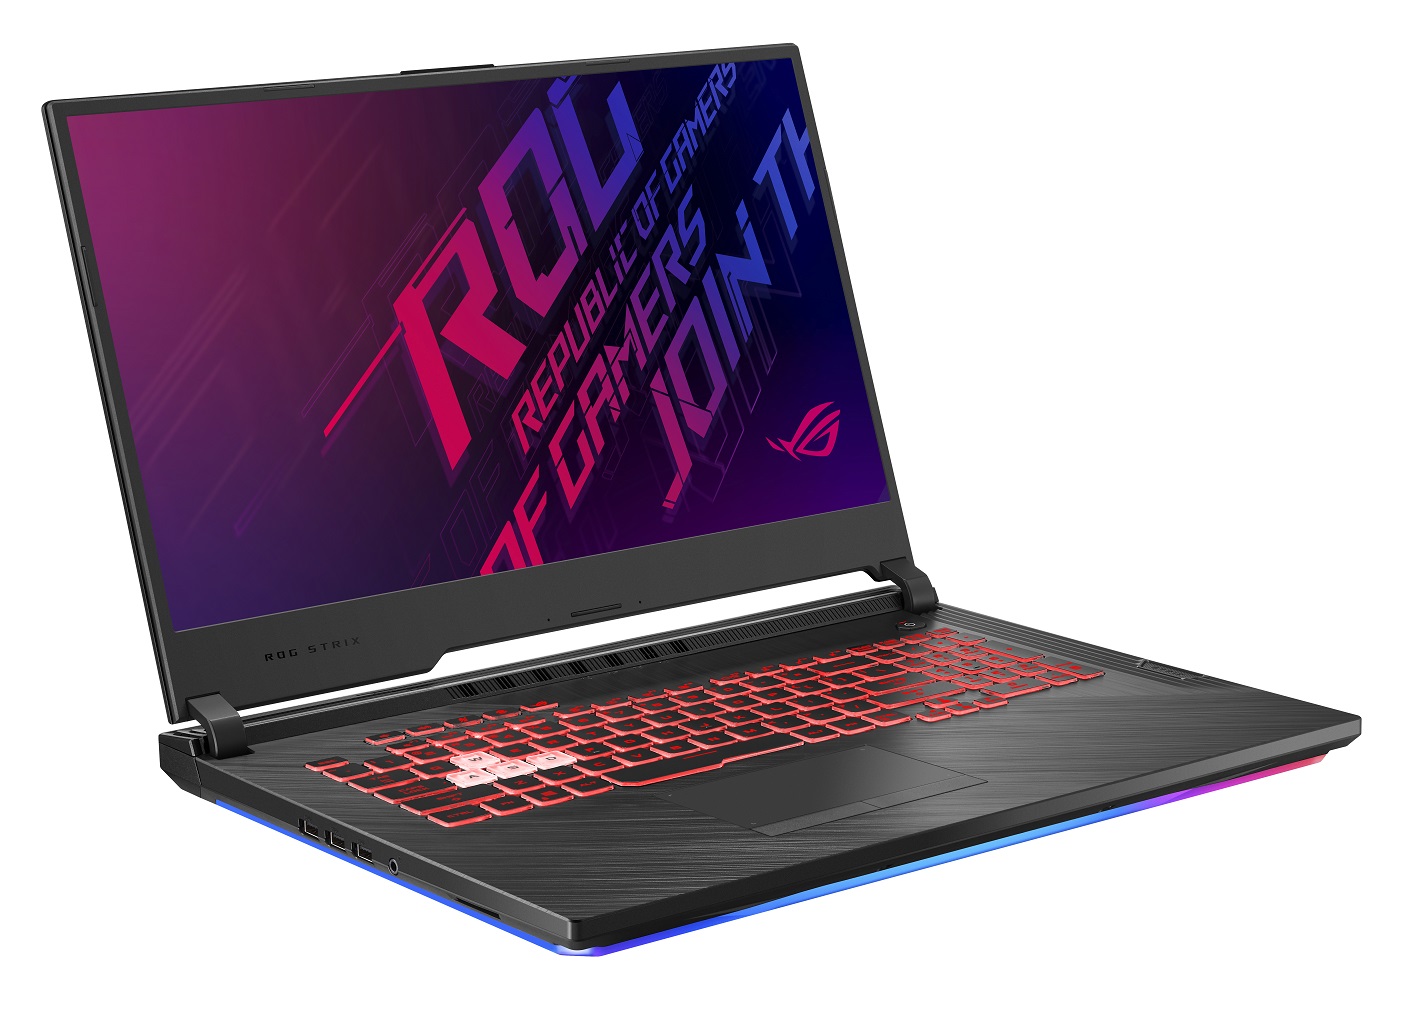
Um show de luzes LED: Breve Análise do Portátil Asus ROG Strix G GL731GU
| Networking | |
| iperf3 transmit AX12 | |
| MSI GF75 Thin 9SC | |
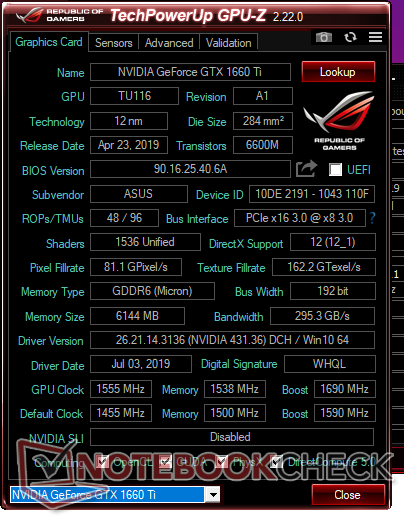
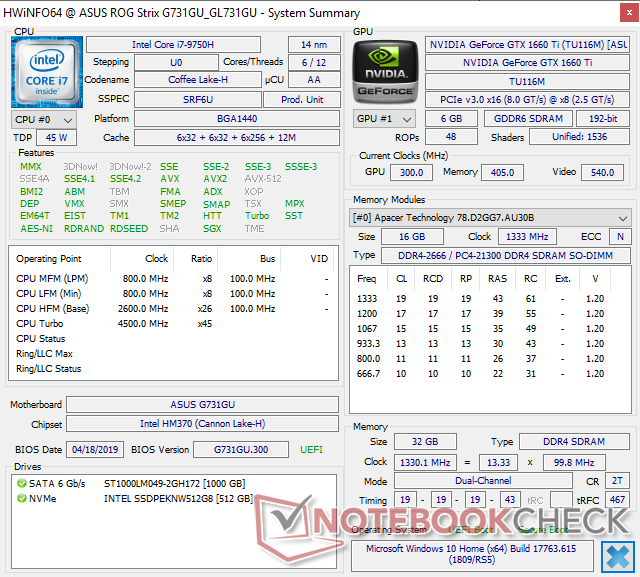
| Asus ROG Strix G GL731GU-RB74 | |
| Lenovo Legion Y740-17ICH | |
| Asus TUF FX705DT-AU068T | |
| iperf3 receive AX12 | |
| MSI GF75 Thin 9SC | |
| Lenovo Legion Y740-17ICH | |
| Asus ROG Strix G GL731GU-RB74 | |
| Asus TUF FX705DT-AU068T | |
| |||||||||||||||||||||||||
iluminação: 89 %
iluminação com acumulador: 294.3 cd/m²
Contraste: 981:1 (Preto: 0.3 cd/m²)
ΔE ColorChecker Calman: 3.95 | ∀{0.5-29.43 Ø4.72}
calibrated: 3.08
ΔE Greyscale Calman: 3.7 | ∀{0.09-98 Ø4.97}
89% sRGB (Argyll 1.6.3 3D)
57.7% AdobeRGB 1998 (Argyll 1.6.3 3D)
63.3% AdobeRGB 1998 (Argyll 3D)
89.4% sRGB (Argyll 3D)
61.9% Display P3 (Argyll 3D)
Gamma: 2.07
CCT: 7155 K
| Asus ROG Strix G GL731GU-RB74 AU Optronics B173HAN04.0, IPS, 17.3", 1920x1080 | Asus TUF FX705DT-AU068T AU Optronics B173HAN04.2, IPS, 17.3", 1920x1080 | MSI GF75 Thin 9SC AU Optronics B173HAN04.2, IPS, 17.3", 1920x1080 | Lenovo Legion Y740-17ICH AU Optronics B173HAN03.2, IPS, 17.3", 1920x1080 | Asus ROG Strix Scar II GL704GW B173HAN04.0 (AUO409D), AHVA, 17.3", 1920x1080 | Razer Blade Pro 17 RTX 2080 Max-Q AU Optronics B173HAN04.0, IPS, 17.3", 1920x1080 | |
|---|---|---|---|---|---|---|
| Display | 1% | 1% | 2% | 0% | -1% | |
| Display P3 Coverage (%) | 61.9 | 62.3 1% | 62.5 1% | 64 3% | 62.9 2% | 60.6 -2% |
| sRGB Coverage (%) | 89.4 | 89.1 0% | 90 1% | 90.4 1% | 87.1 -3% | 89 0% |
| AdobeRGB 1998 Coverage (%) | 63.3 | 63.7 1% | 64 1% | 64.8 2% | 63.7 1% | 62.1 -2% |
| Response Times | -355% | -301% | -79% | -88% | 4% | |
| Response Time Grey 50% / Grey 80% * (ms) | 6.4 ? | 41 ? -541% | 34 ? -431% | 15.6 ? -144% | 17.6 ? -175% | 6.8 ? -6% |
| Response Time Black / White * (ms) | 11.2 ? | 30 ? -168% | 30.4 ? -171% | 12.8 ? -14% | 11.2 ? -0% | 9.6 ? 14% |
| PWM Frequency (Hz) | ||||||
| Screen | 5% | 7% | -15% | 12% | 8% | |
| Brightness middle (cd/m²) | 294.3 | 316 7% | 344.7 17% | 299.1 2% | 295 0% | 299.3 2% |
| Brightness (cd/m²) | 289 | 294 2% | 332 15% | 273 -6% | 291 1% | 294 2% |
| Brightness Distribution (%) | 89 | 84 -6% | 91 2% | 81 -9% | 96 8% | 94 6% |
| Black Level * (cd/m²) | 0.3 | 0.32 -7% | 0.3 -0% | 0.27 10% | 0.24 20% | 0.29 3% |
| Contrast (:1) | 981 | 988 1% | 1149 17% | 1108 13% | 1229 25% | 1032 5% |
| Colorchecker dE 2000 * | 3.95 | 3.39 14% | 3.08 22% | 5.07 -28% | 3.2 19% | 2.55 35% |
| Colorchecker dE 2000 max. * | 6.49 | 5.56 14% | 6.32 3% | 10.55 -63% | 6.64 -2% | 4.73 27% |
| Colorchecker dE 2000 calibrated * | 3.08 | 2.14 31% | 2.94 5% | 3.31 -7% | 2.52 18% | 2.9 6% |
| Greyscale dE 2000 * | 3.7 | 3.17 14% | 3.8 -3% | 6.8 -84% | 2.16 42% | 3.5 5% |
| Gamma | 2.07 106% | 2.39 92% | 2.17 101% | 2.46 89% | 2.46 89% | 2.28 96% |
| CCT | 7155 91% | 7098 92% | 7284 89% | 7805 83% | 6872 95% | 7101 92% |
| Color Space (Percent of AdobeRGB 1998) (%) | 57.7 | 51 -12% | 58 1% | 58.5 1% | 57 -1% | 57 -1% |
| Color Space (Percent of sRGB) (%) | 89 | 89 0% | 89.6 1% | 89.9 1% | 87 -2% | 88.7 0% |
| Média Total (Programa/Configurações) | -116% /
-41% | -98% /
-32% | -31% /
-20% | -25% /
-3% | 4% /
6% |
* ... menor é melhor
Exibir tempos de resposta
| ↔ Tempo de resposta preto para branco | ||
|---|---|---|
| 11.2 ms ... ascensão ↗ e queda ↘ combinadas | ↗ 6 ms ascensão | 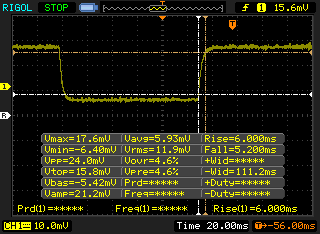 |
| ↘ 5.2 ms queda | ||
| A tela mostra boas taxas de resposta em nossos testes, mas pode ser muito lenta para jogadores competitivos. Em comparação, todos os dispositivos testados variam de 0.1 (mínimo) a 240 (máximo) ms. » 30 % de todos os dispositivos são melhores. Isso significa que o tempo de resposta medido é melhor que a média de todos os dispositivos testados (19.8 ms). | ||
| ↔ Tempo de resposta 50% cinza a 80% cinza | ||
| 6.4 ms ... ascensão ↗ e queda ↘ combinadas | ↗ 3.4 ms ascensão | 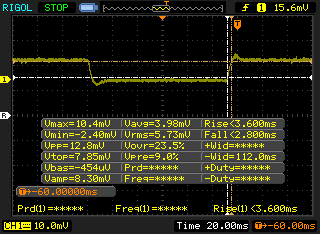 |
| ↘ 3 ms queda | ||
| A tela mostra taxas de resposta muito rápidas em nossos testes e deve ser muito adequada para jogos em ritmo acelerado. Em comparação, todos os dispositivos testados variam de 0.165 (mínimo) a 636 (máximo) ms. » 19 % de todos os dispositivos são melhores. Isso significa que o tempo de resposta medido é melhor que a média de todos os dispositivos testados (31 ms). | ||
Cintilação da tela / PWM (modulação por largura de pulso)
| Tela tremeluzindo / PWM não detectado | 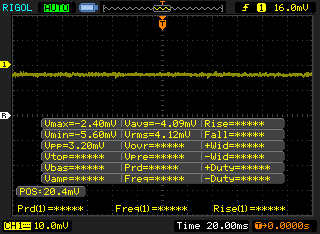 | ||
[pwm_comparison] Em comparação: 52 % de todos os dispositivos testados não usam PWM para escurecer a tela. Se PWM foi detectado, uma média de 7772 (mínimo: 5 - máximo: 343500) Hz foi medida. | |||
| PCMark 8 | |
| Home Score Accelerated v2 | |
| Asus ROG Strix G GL731GU-RB74 | |
| Lenovo Legion Y740-17ICH | |
| Asus ROG Strix Scar II GL704GW | |
| Asus TUF FX705DT-AU068T | |
| Média Intel Core i7-9750H, NVIDIA GeForce GTX 1660 Ti Mobile (4074 - 5217, n=11) | |
| Razer Blade Pro 17 RTX 2080 Max-Q | |
| MSI GF75 Thin 9SC | |
| Work Score Accelerated v2 | |
| Lenovo Legion Y740-17ICH | |
| Asus ROG Strix G GL731GU-RB74 | |
| Razer Blade Pro 17 RTX 2080 Max-Q | |
| Asus ROG Strix Scar II GL704GW | |
| Média Intel Core i7-9750H, NVIDIA GeForce GTX 1660 Ti Mobile (5041 - 5913, n=12) | |
| MSI GF75 Thin 9SC | |
| Asus TUF FX705DT-AU068T | |
| PCMark 8 Home Score Accelerated v2 | 5217 pontos | |
| PCMark 8 Work Score Accelerated v2 | 5744 pontos | |
| PCMark 10 Score | 5811 pontos | |
Ajuda | ||
| Asus ROG Strix G GL731GU-RB74 Intel SSD 660p SSDPEKNW512G8 | Asus TUF FX705DT-AU068T WDC PC SN520 SDAPNUW-256G | Lenovo Legion Y740-17ICH Samsung SSD PM981 MZVLB256HAHQ | Asus ROG Strix Scar II GL704GW Intel SSD 660p SSDPEKNW512G8 | Razer Blade Pro 17 RTX 2080 Max-Q Samsung SSD PM981 MZVLB512HAJQ | |
|---|---|---|---|---|---|
| AS SSD | -9% | 29% | -2% | 68% | |
| Seq Read (MB/s) | 1319 | 1546 17% | 1153 -13% | 1315 0% | 1831 39% |
| Seq Write (MB/s) | 930 | 1182 27% | 1328 43% | 927 0% | 1744 88% |
| 4K Read (MB/s) | 49.43 | 36.54 -26% | 35.05 -29% | 52.4 6% | 45.16 -9% |
| 4K Write (MB/s) | 104.3 | 109.2 5% | 96 -8% | 122.8 18% | 107.1 3% |
| 4K-64 Read (MB/s) | 321.9 | 612 90% | 727 126% | 326.5 1% | 1240 285% |
| 4K-64 Write (MB/s) | 774 | 436.6 -44% | 1212 57% | 727 -6% | 1695 119% |
| Access Time Read * (ms) | 0.055 | 0.113 -105% | 0.063 -15% | 0.11 -100% | 0.064 -16% |
| Access Time Write * (ms) | 0.138 | 0.034 75% | 0.04 71% | 0.045 67% | 0.037 73% |
| Score Read (Points) | 503 | 803 60% | 878 75% | 510 1% | 1468 192% |
| Score Write (Points) | 971 | 664 -32% | 1441 48% | 942 -3% | 1977 104% |
| Score Total (Points) | 1731 | 1869 8% | 2784 61% | 1715 -1% | 4197 142% |
| Copy ISO MB/s (MB/s) | 1707 | 698 -59% | 1487 -13% | 2086 22% | |
| Copy Program MB/s (MB/s) | 852 | 114.1 -87% | 608 -29% | 425.5 -50% | |
| Copy Game MB/s (MB/s) | 930 | 379.6 -59% | 1162 25% | 555 -40% |
* ... menor é melhor

| 3DMark 11 Performance | 17966 pontos | |
| 3DMark Cloud Gate Standard Score | 36088 pontos | |
| 3DMark Fire Strike Score | 12907 pontos | |
| 3DMark Fire Strike Extreme Score | 6573 pontos | |
| 3DMark Time Spy Score | 5651 pontos | |
Ajuda | ||
| Shadow of the Tomb Raider - 1920x1080 Highest Preset AA:T | |
| MSI GE75 9SG | |
| Asus ROG Strix Scar II GL704GW | |
| Alienware m15 P79F | |
| Asus G752VS | |
| Asus ROG Strix G GL731GU-RB74 | |
| Média NVIDIA GeForce GTX 1660 Ti Mobile (62 - 73, n=8) | |
| MSI GL73 8SE-010US | |
| Asus ROG Zephyrus G15 GA502DU | |
| Asus TUF FX705GM | |
| MSI GF75 Thin 9SC | |
| Asus TUF FX705GE-EW096T | |
| Asus GL753VD | |
| baixo | média | alto | ultra | |
|---|---|---|---|---|
| BioShock Infinite (2013) | 320.1 | 256.8 | 263.3 | 140.8 |
| The Witcher 3 (2015) | 261.5 | 180.7 | 99.5 | 53.7 |
| Shadow of the Tomb Raider (2018) | 135 | 90 | 79 | 70 |
| Asus ROG Strix G GL731GU-RB74 GeForce GTX 1660 Ti Mobile, i7-9750H, Intel SSD 660p SSDPEKNW512G8 | Asus TUF FX705DT-AU068T GeForce GTX 1650 Mobile, R5 3550H, WDC PC SN520 SDAPNUW-256G | Asus ROG Strix Scar II GL704GW GeForce RTX 2070 Mobile, i7-8750H, Intel SSD 660p SSDPEKNW512G8 | Razer Blade Pro 17 RTX 2080 Max-Q GeForce RTX 2080 Max-Q, i7-9750H, Samsung SSD PM981 MZVLB512HAJQ | MSI GF75 Thin 9SC GeForce GTX 1650 Mobile, i7-9750H, Crucial P1 SSD CT1000P1SSD8 | Asus GL704GM-DH74 GeForce GTX 1060 Mobile, i7-8750H, WDC PC SN520 SDAPNUW-256G | |
|---|---|---|---|---|---|---|
| Noise | 9% | 1% | 7% | 8% | -3% | |
| desligado / ambiente * (dB) | 28.2 | 30.8 -9% | 29 -3% | 28.2 -0% | 28.2 -0% | 28.2 -0% |
| Idle Minimum * (dB) | 31.8 | 30.8 3% | 29 9% | 28.2 11% | 33.6 -6% | 30 6% |
| Idle Average * (dB) | 32 | 30.8 4% | 32 -0% | 28.2 12% | 33.6 -5% | 31.8 1% |
| Idle Maximum * (dB) | 40.6 | 32.2 21% | 40 1% | 30.8 24% | 33.8 17% | 34.6 15% |
| Load Average * (dB) | 48 | 38.6 20% | 46 4% | 42 12% | 37.2 22% | 56 -17% |
| Witcher 3 ultra * (dB) | 48 | 51 -6% | 51 -6% | 40.6 15% | 54.2 -13% | |
| Load Maximum * (dB) | 51.5 | 44.8 13% | 52 -1% | 53 -3% | 44.4 14% | 56.7 -10% |
* ... menor é melhor
Barulho
| Ocioso |
| 31.8 / 32 / 40.6 dB |
| Carga |
| 48 / 51.5 dB |
 | ||
30 dB silencioso 40 dB(A) audível 50 dB(A) ruidosamente alto |
||
min: | ||
(±) A temperatura máxima no lado superior é 44.6 °C / 112 F, em comparação com a média de 40.4 °C / 105 F , variando de 21.2 a 68.8 °C para a classe Gaming.
(-) A parte inferior aquece até um máximo de 51.6 °C / 125 F, em comparação com a média de 43.2 °C / 110 F
(+) Em uso inativo, a temperatura média para o lado superior é 27 °C / 81 F, em comparação com a média do dispositivo de 33.9 °C / ### class_avg_f### F.
(+) Jogando The Witcher 3, a temperatura média para o lado superior é 30.2 °C / 86 F, em comparação com a média do dispositivo de 33.9 °C / ## #class_avg_f### F.
(+) Os apoios para as mãos e o touchpad são mais frios que a temperatura da pele, com um máximo de 27 °C / 80.6 F e, portanto, são frios ao toque.
(±) A temperatura média da área do apoio para as mãos de dispositivos semelhantes foi 28.8 °C / 83.8 F (+1.8 °C / 3.2 F).
Asus ROG Strix G GL731GU-RB74 análise de áudio
(±) | o volume do alto-falante é médio, mas bom (###valor### dB)
Analysis not possible as minimum curve is missing or too high
Apple MacBook 12 (Early 2016) 1.1 GHz análise de áudio
(+) | os alto-falantes podem tocar relativamente alto (###valor### dB)
Graves 100 - 315Hz
(±) | graves reduzidos - em média 11.3% menor que a mediana
(±) | a linearidade dos graves é média (14.2% delta para a frequência anterior)
Médios 400 - 2.000 Hz
(+) | médios equilibrados - apenas 2.4% longe da mediana
(+) | médios são lineares (5.5% delta para frequência anterior)
Altos 2 - 16 kHz
(+) | agudos equilibrados - apenas 2% longe da mediana
(+) | os máximos são lineares (4.5% delta da frequência anterior)
Geral 100 - 16.000 Hz
(+) | o som geral é linear (10.2% diferença em relação à mediana)
Comparado com a mesma classe
» 7% de todos os dispositivos testados nesta classe foram melhores, 2% semelhantes, 91% piores
» O melhor teve um delta de 5%, a média foi 18%, o pior foi 53%
Comparado com todos os dispositivos testados
» 5% de todos os dispositivos testados foram melhores, 1% semelhantes, 94% piores
» O melhor teve um delta de 4%, a média foi 24%, o pior foi 134%
| desligado | |
| Ocioso | |
| Carga |
|
Key:
min: | |
| Asus ROG Strix G GL731GU-RB74 i7-9750H, GeForce GTX 1660 Ti Mobile, Intel SSD 660p SSDPEKNW512G8, IPS, 1920x1080, 17.3" | Asus TUF FX705DT-AU068T R5 3550H, GeForce GTX 1650 Mobile, WDC PC SN520 SDAPNUW-256G, IPS, 1920x1080, 17.3" | Asus ROG Strix Scar II GL704GW i7-8750H, GeForce RTX 2070 Mobile, Intel SSD 660p SSDPEKNW512G8, AHVA, 1920x1080, 17.3" | Razer Blade Pro 17 RTX 2080 Max-Q i7-9750H, GeForce RTX 2080 Max-Q, Samsung SSD PM981 MZVLB512HAJQ, IPS, 1920x1080, 17.3" | MSI GF75 Thin 9SC i7-9750H, GeForce GTX 1650 Mobile, Crucial P1 SSD CT1000P1SSD8, IPS, 1920x1080, 17.3" | MSI GF72VR 7RF i7-7700HQ, GeForce GTX 1060 Mobile, Samsung PM961 MZVLW256HEHP, TN LED, 1920x1080, 17.3" | |
|---|---|---|---|---|---|---|
| Power Consumption | 61% | -9% | 0% | 31% | 15% | |
| Idle Minimum * (Watt) | 13.6 | 3.9 71% | 19 -40% | 16.2 -19% | 6.1 55% | 15.7 -15% |
| Idle Average * (Watt) | 26.2 | 9.6 63% | 22 16% | 20.4 22% | 11.2 57% | 21.4 18% |
| Idle Maximum * (Watt) | 35 | 12.2 65% | 29 17% | 26.1 25% | 24.5 30% | 21.9 37% |
| Load Average * (Watt) | 113.6 | 59 48% | 102 10% | 96.5 15% | 94.7 17% | 83.9 26% |
| Witcher 3 ultra * (Watt) | 134.1 | 190 -42% | 182.9 -36% | 105.8 21% | 130.2 3% | |
| Load Maximum * (Watt) | 200.2 | 80 60% | 231 -15% | 214.3 -7% | 192.2 4% | 159.6 20% |
* ... menor é melhor
| Asus ROG Strix G GL731GU-RB74 i7-9750H, GeForce GTX 1660 Ti Mobile, 66 Wh | Asus TUF FX705DT-AU068T R5 3550H, GeForce GTX 1650 Mobile, 64 Wh | Lenovo Legion Y740-17ICH i7-8750H, GeForce RTX 2080 Max-Q, 76 Wh | Asus ROG Strix Scar II GL704GW i7-8750H, GeForce RTX 2070 Mobile, 66 Wh | Razer Blade Pro 17 RTX 2080 Max-Q i7-9750H, GeForce RTX 2080 Max-Q, 70 Wh | MSI GF75 Thin 9SC i7-9750H, GeForce GTX 1650 Mobile, 51 Wh | |
|---|---|---|---|---|---|---|
| Duração da bateria | 49% | -35% | -26% | -20% | -4% | |
| Reader / Idle (h) | 8.6 | 13.6 58% | 6.2 -28% | 4.9 -43% | ||
| WiFi v1.3 (h) | 4.9 | 7.8 59% | 3.2 -35% | 3.9 -20% | 4.7 -4% | 4.7 -4% |
| Load (h) | 1.6 | 2.1 31% | 1.1 -31% | 1.4 -13% | ||
| Witcher 3 ultra (h) | 0.9 |
Pro
Contra

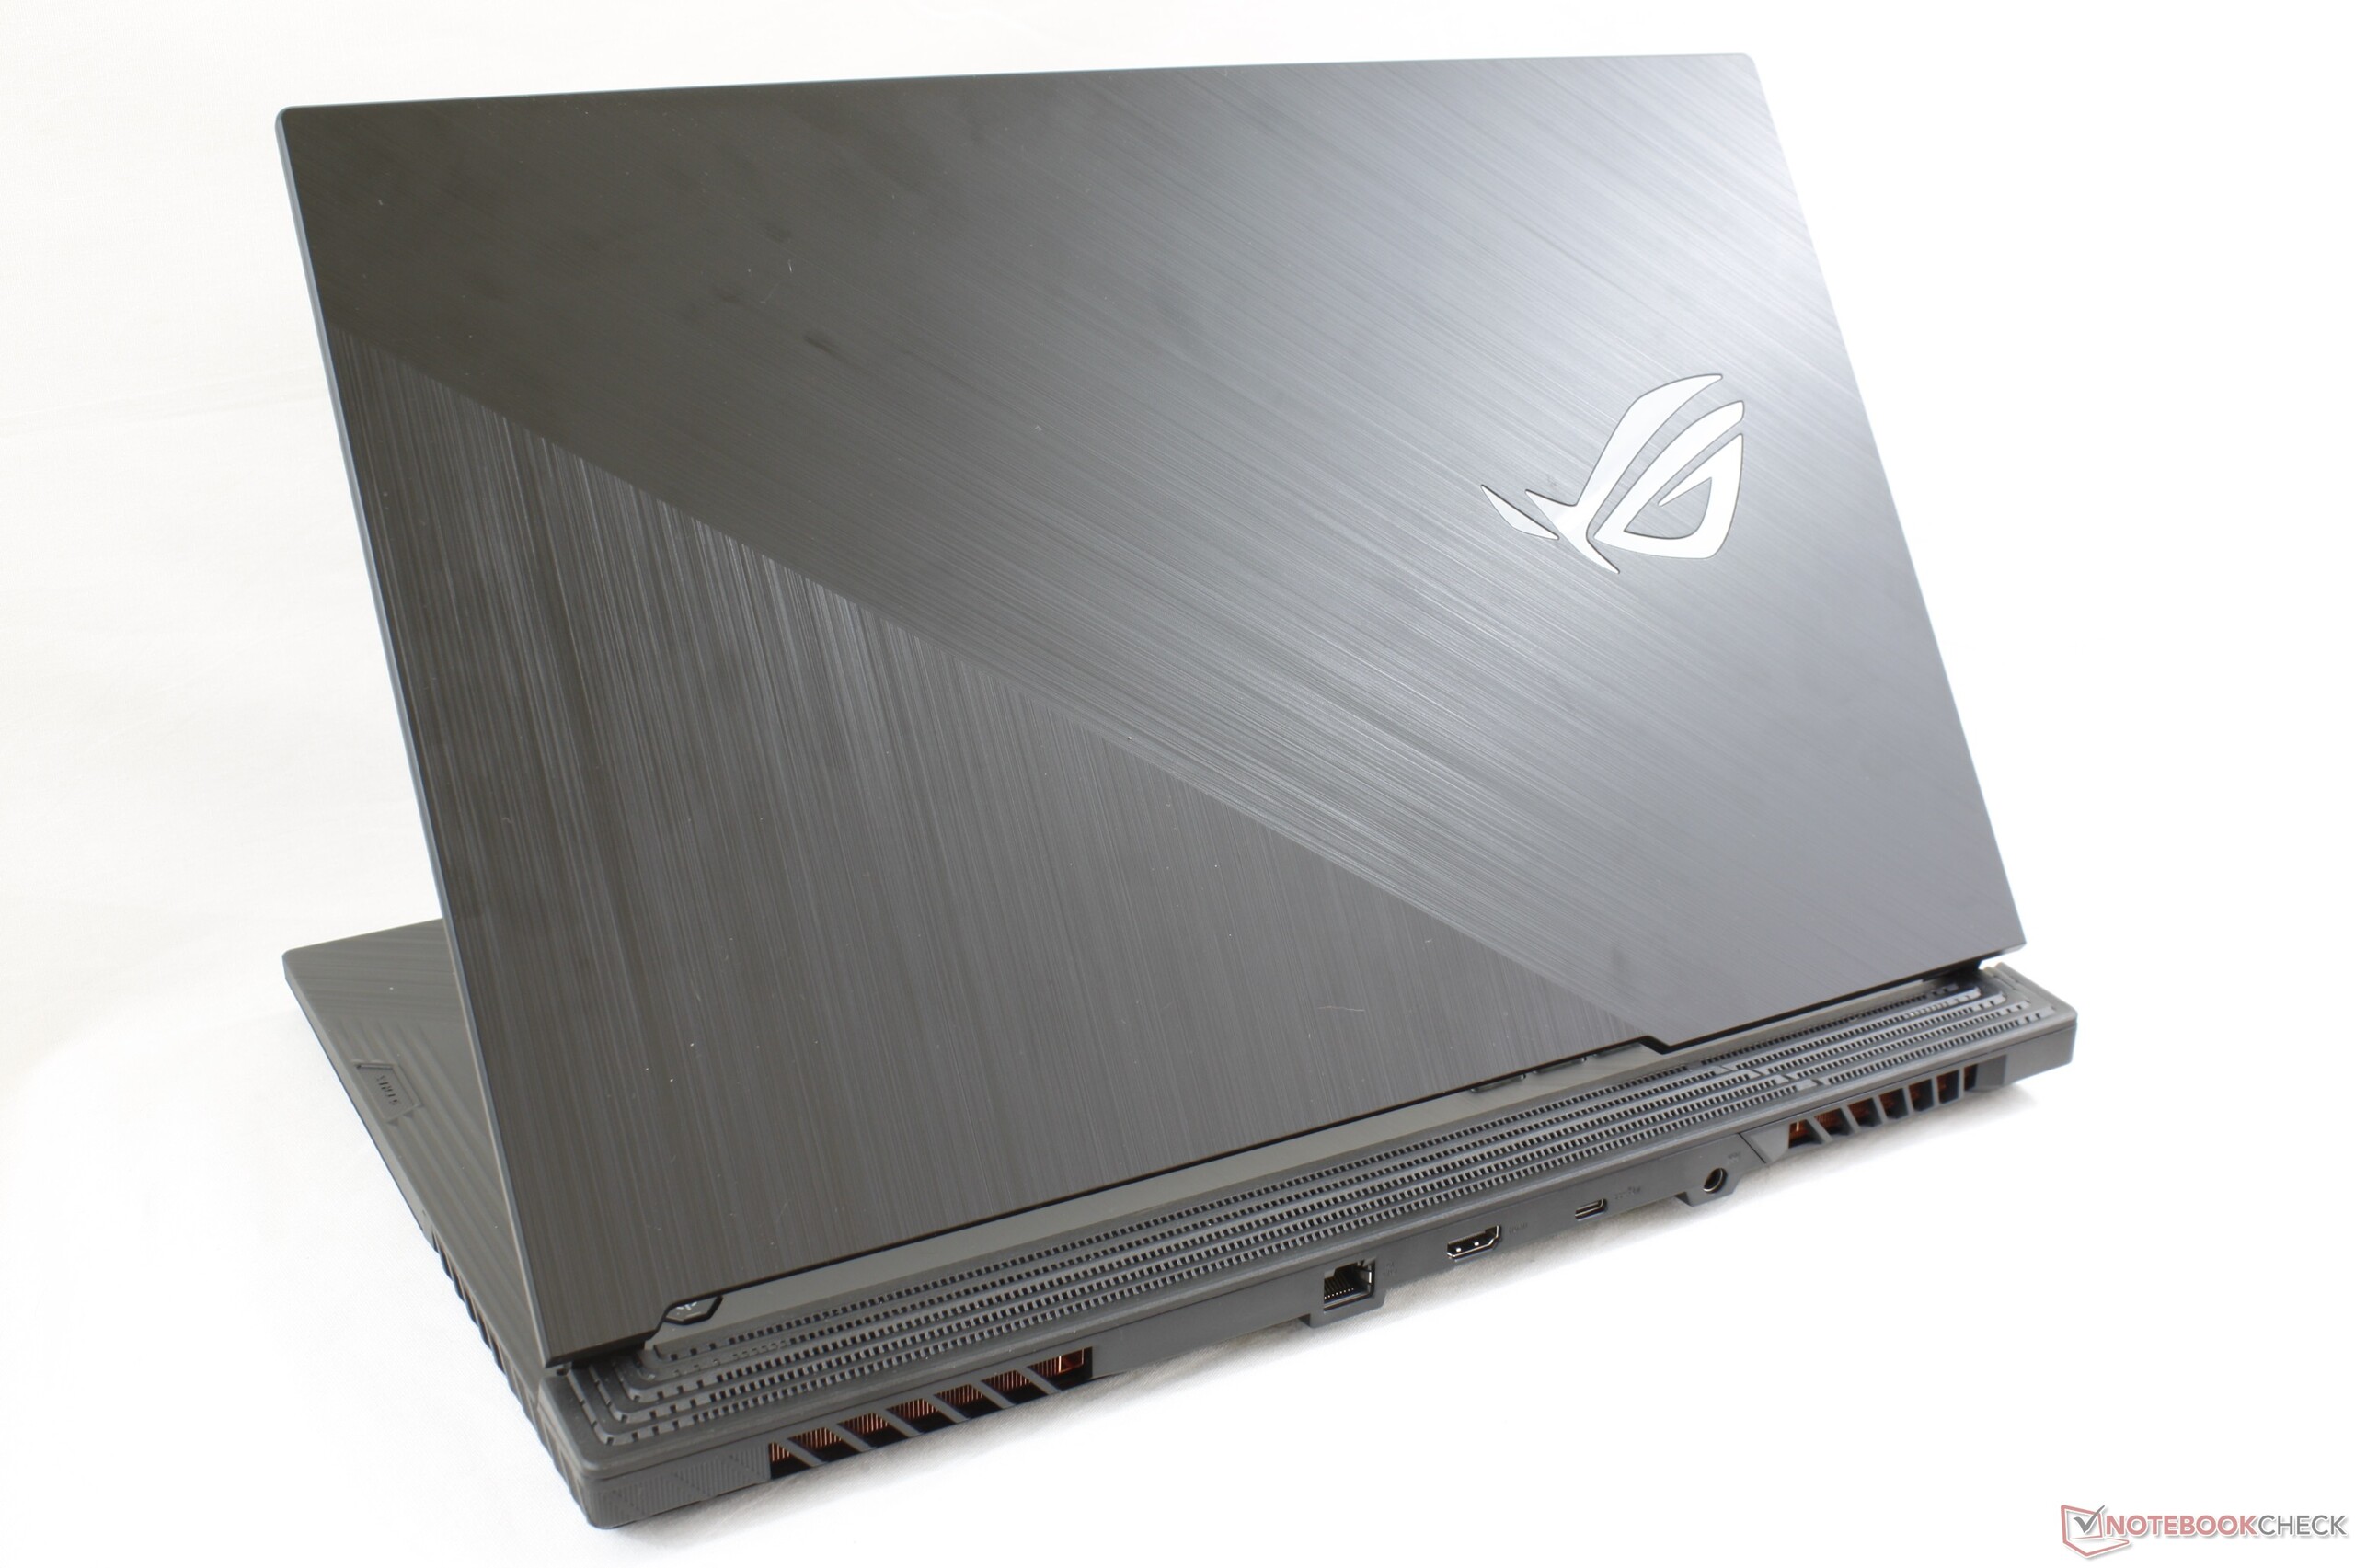
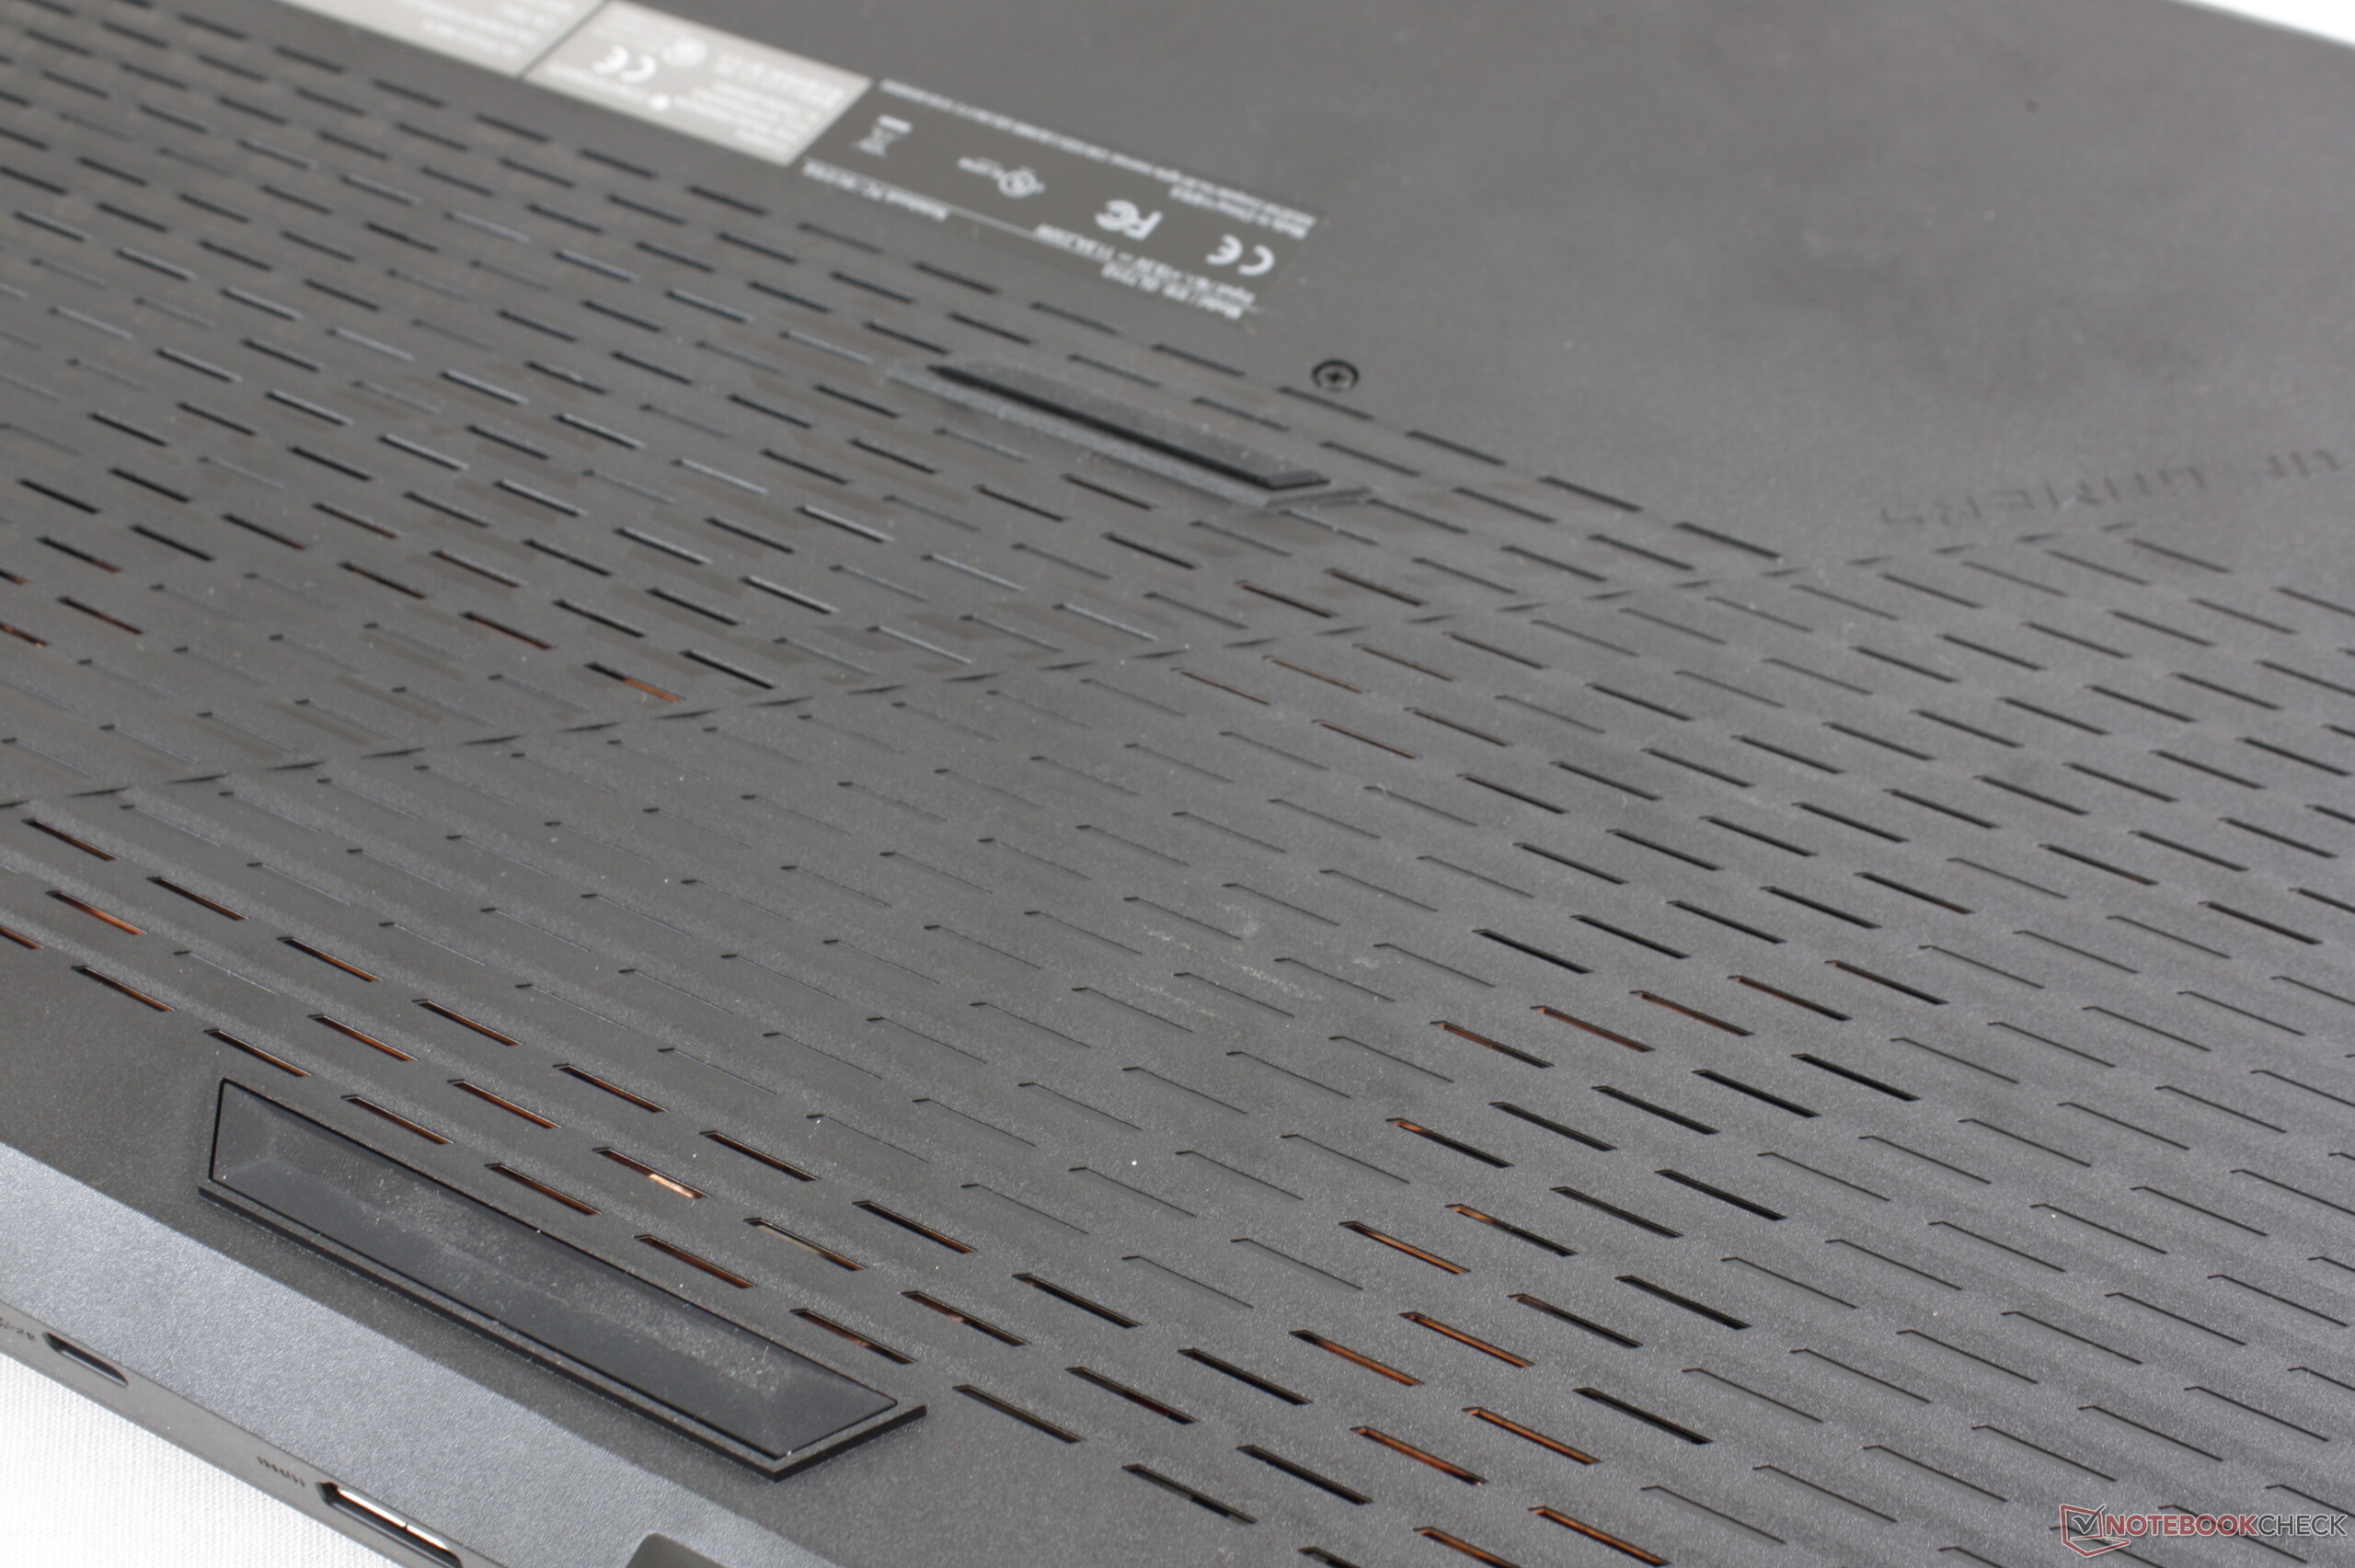
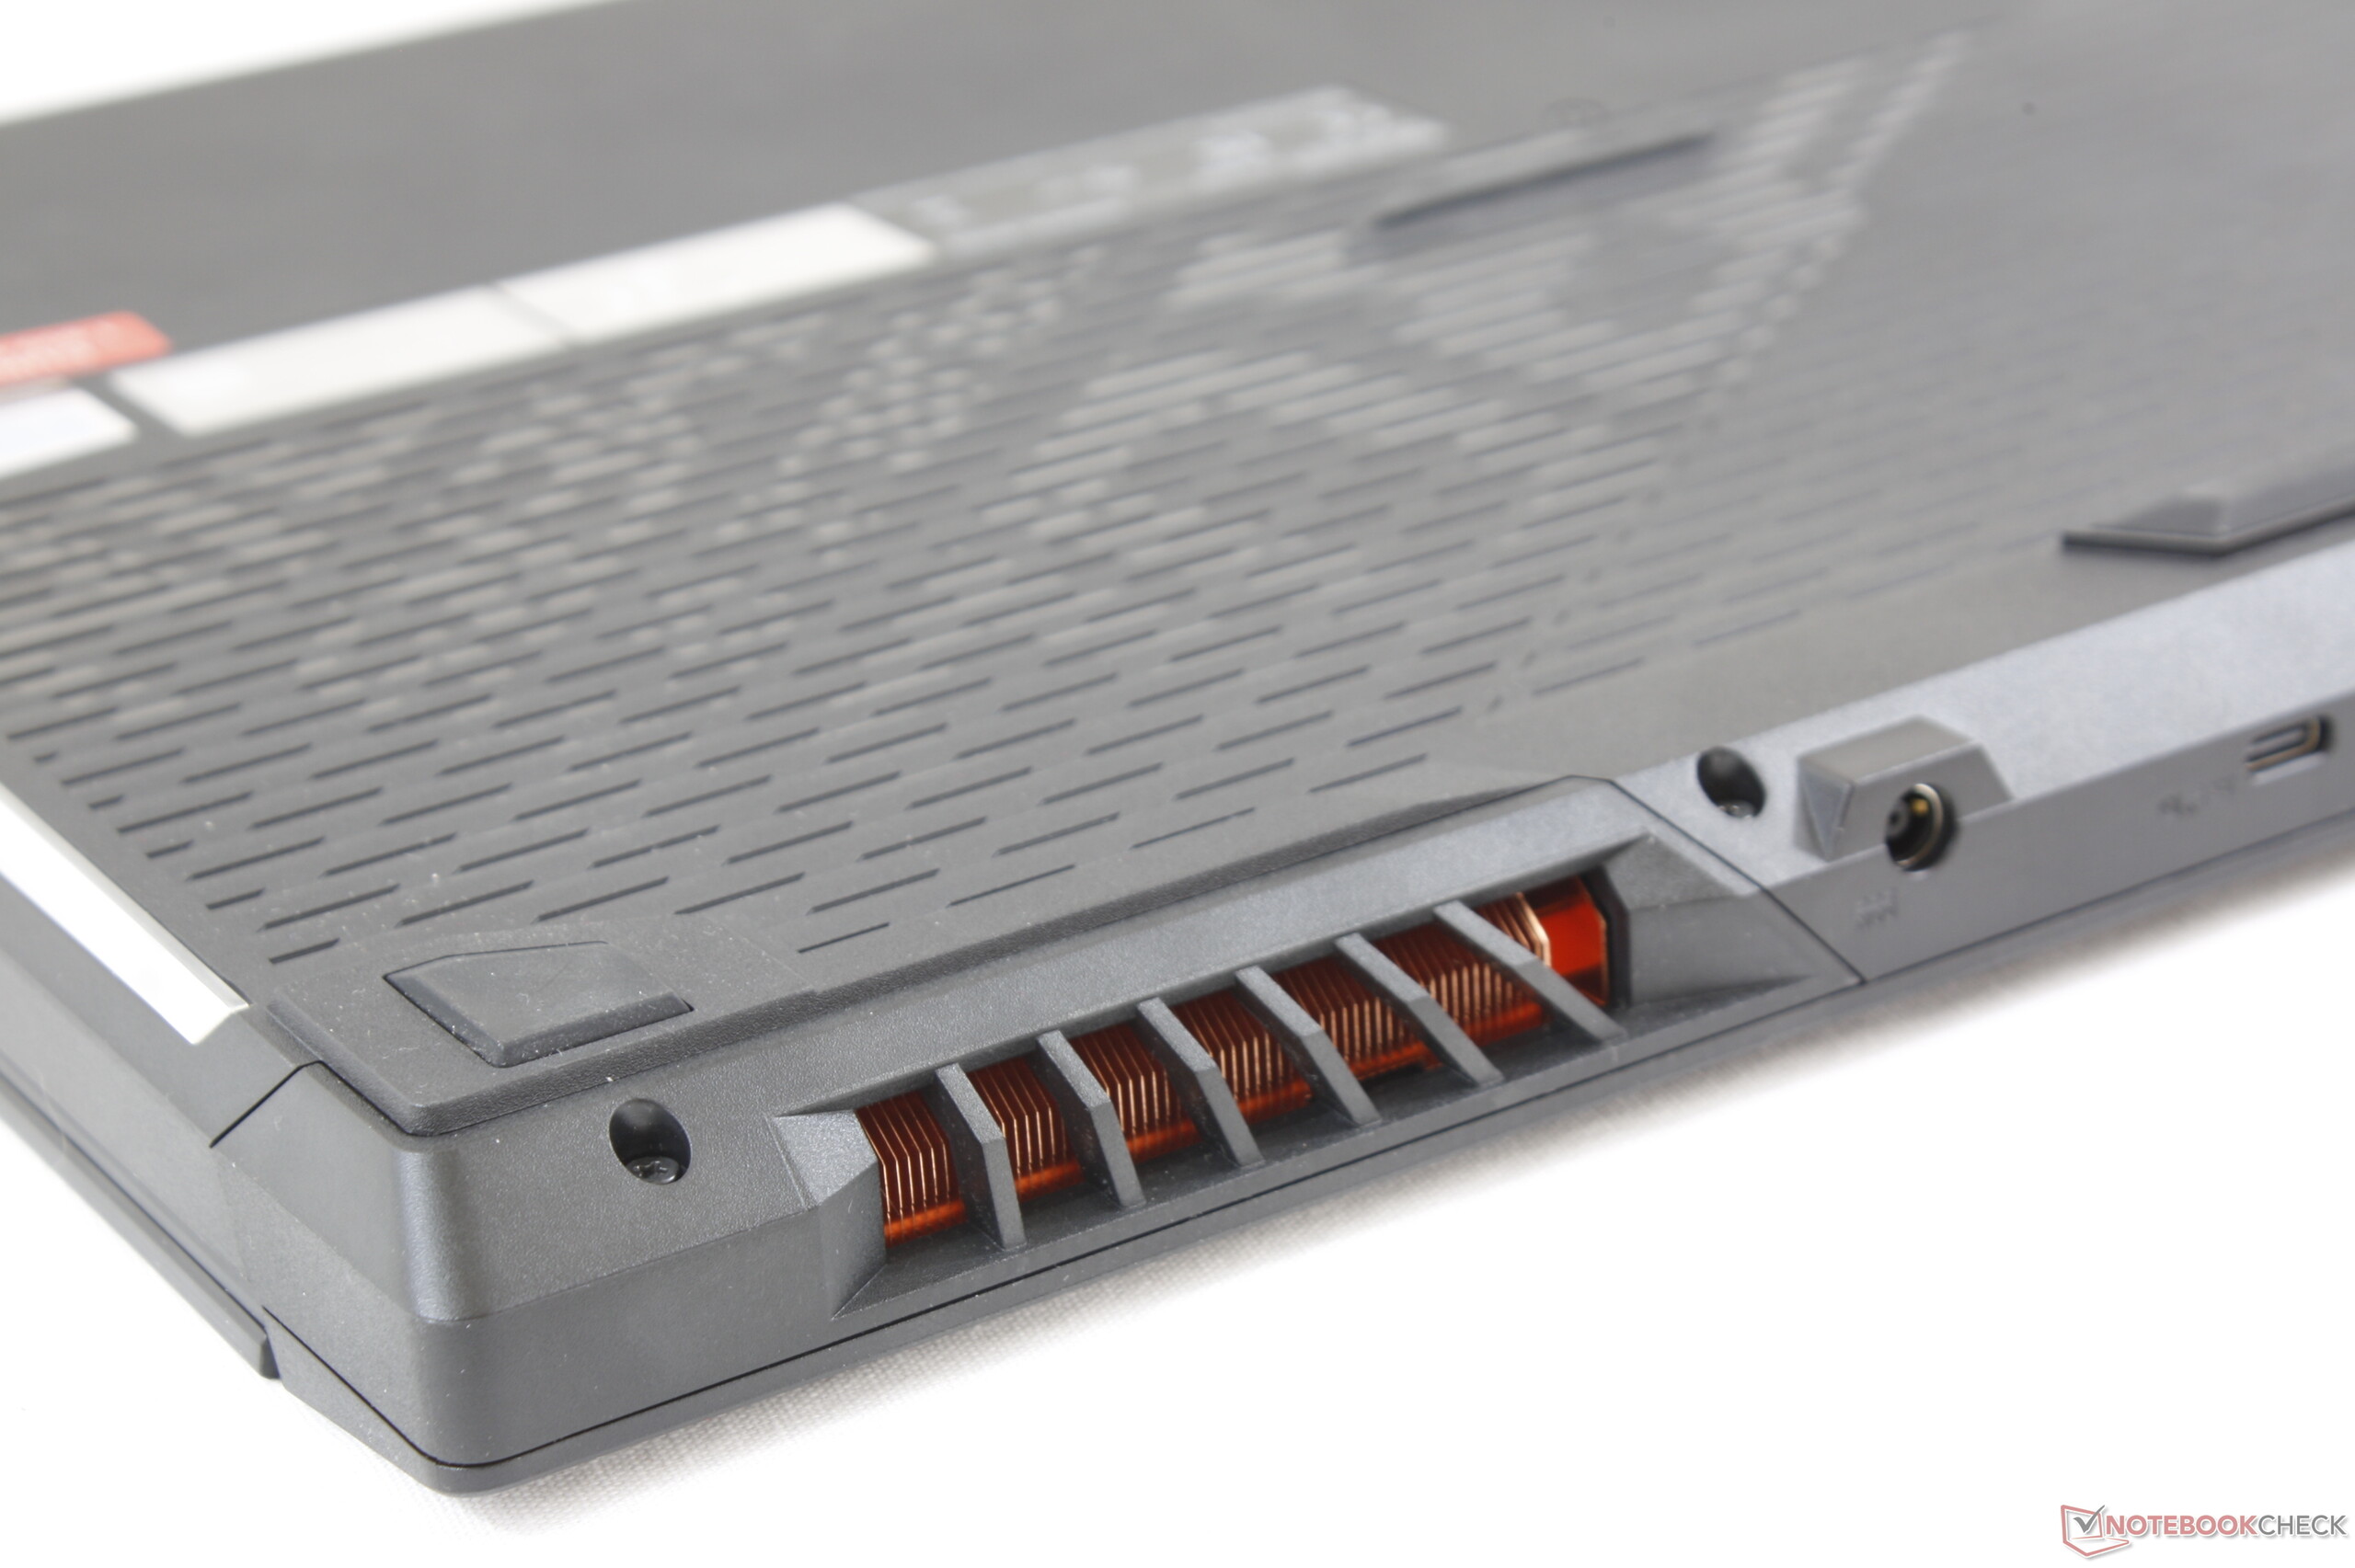
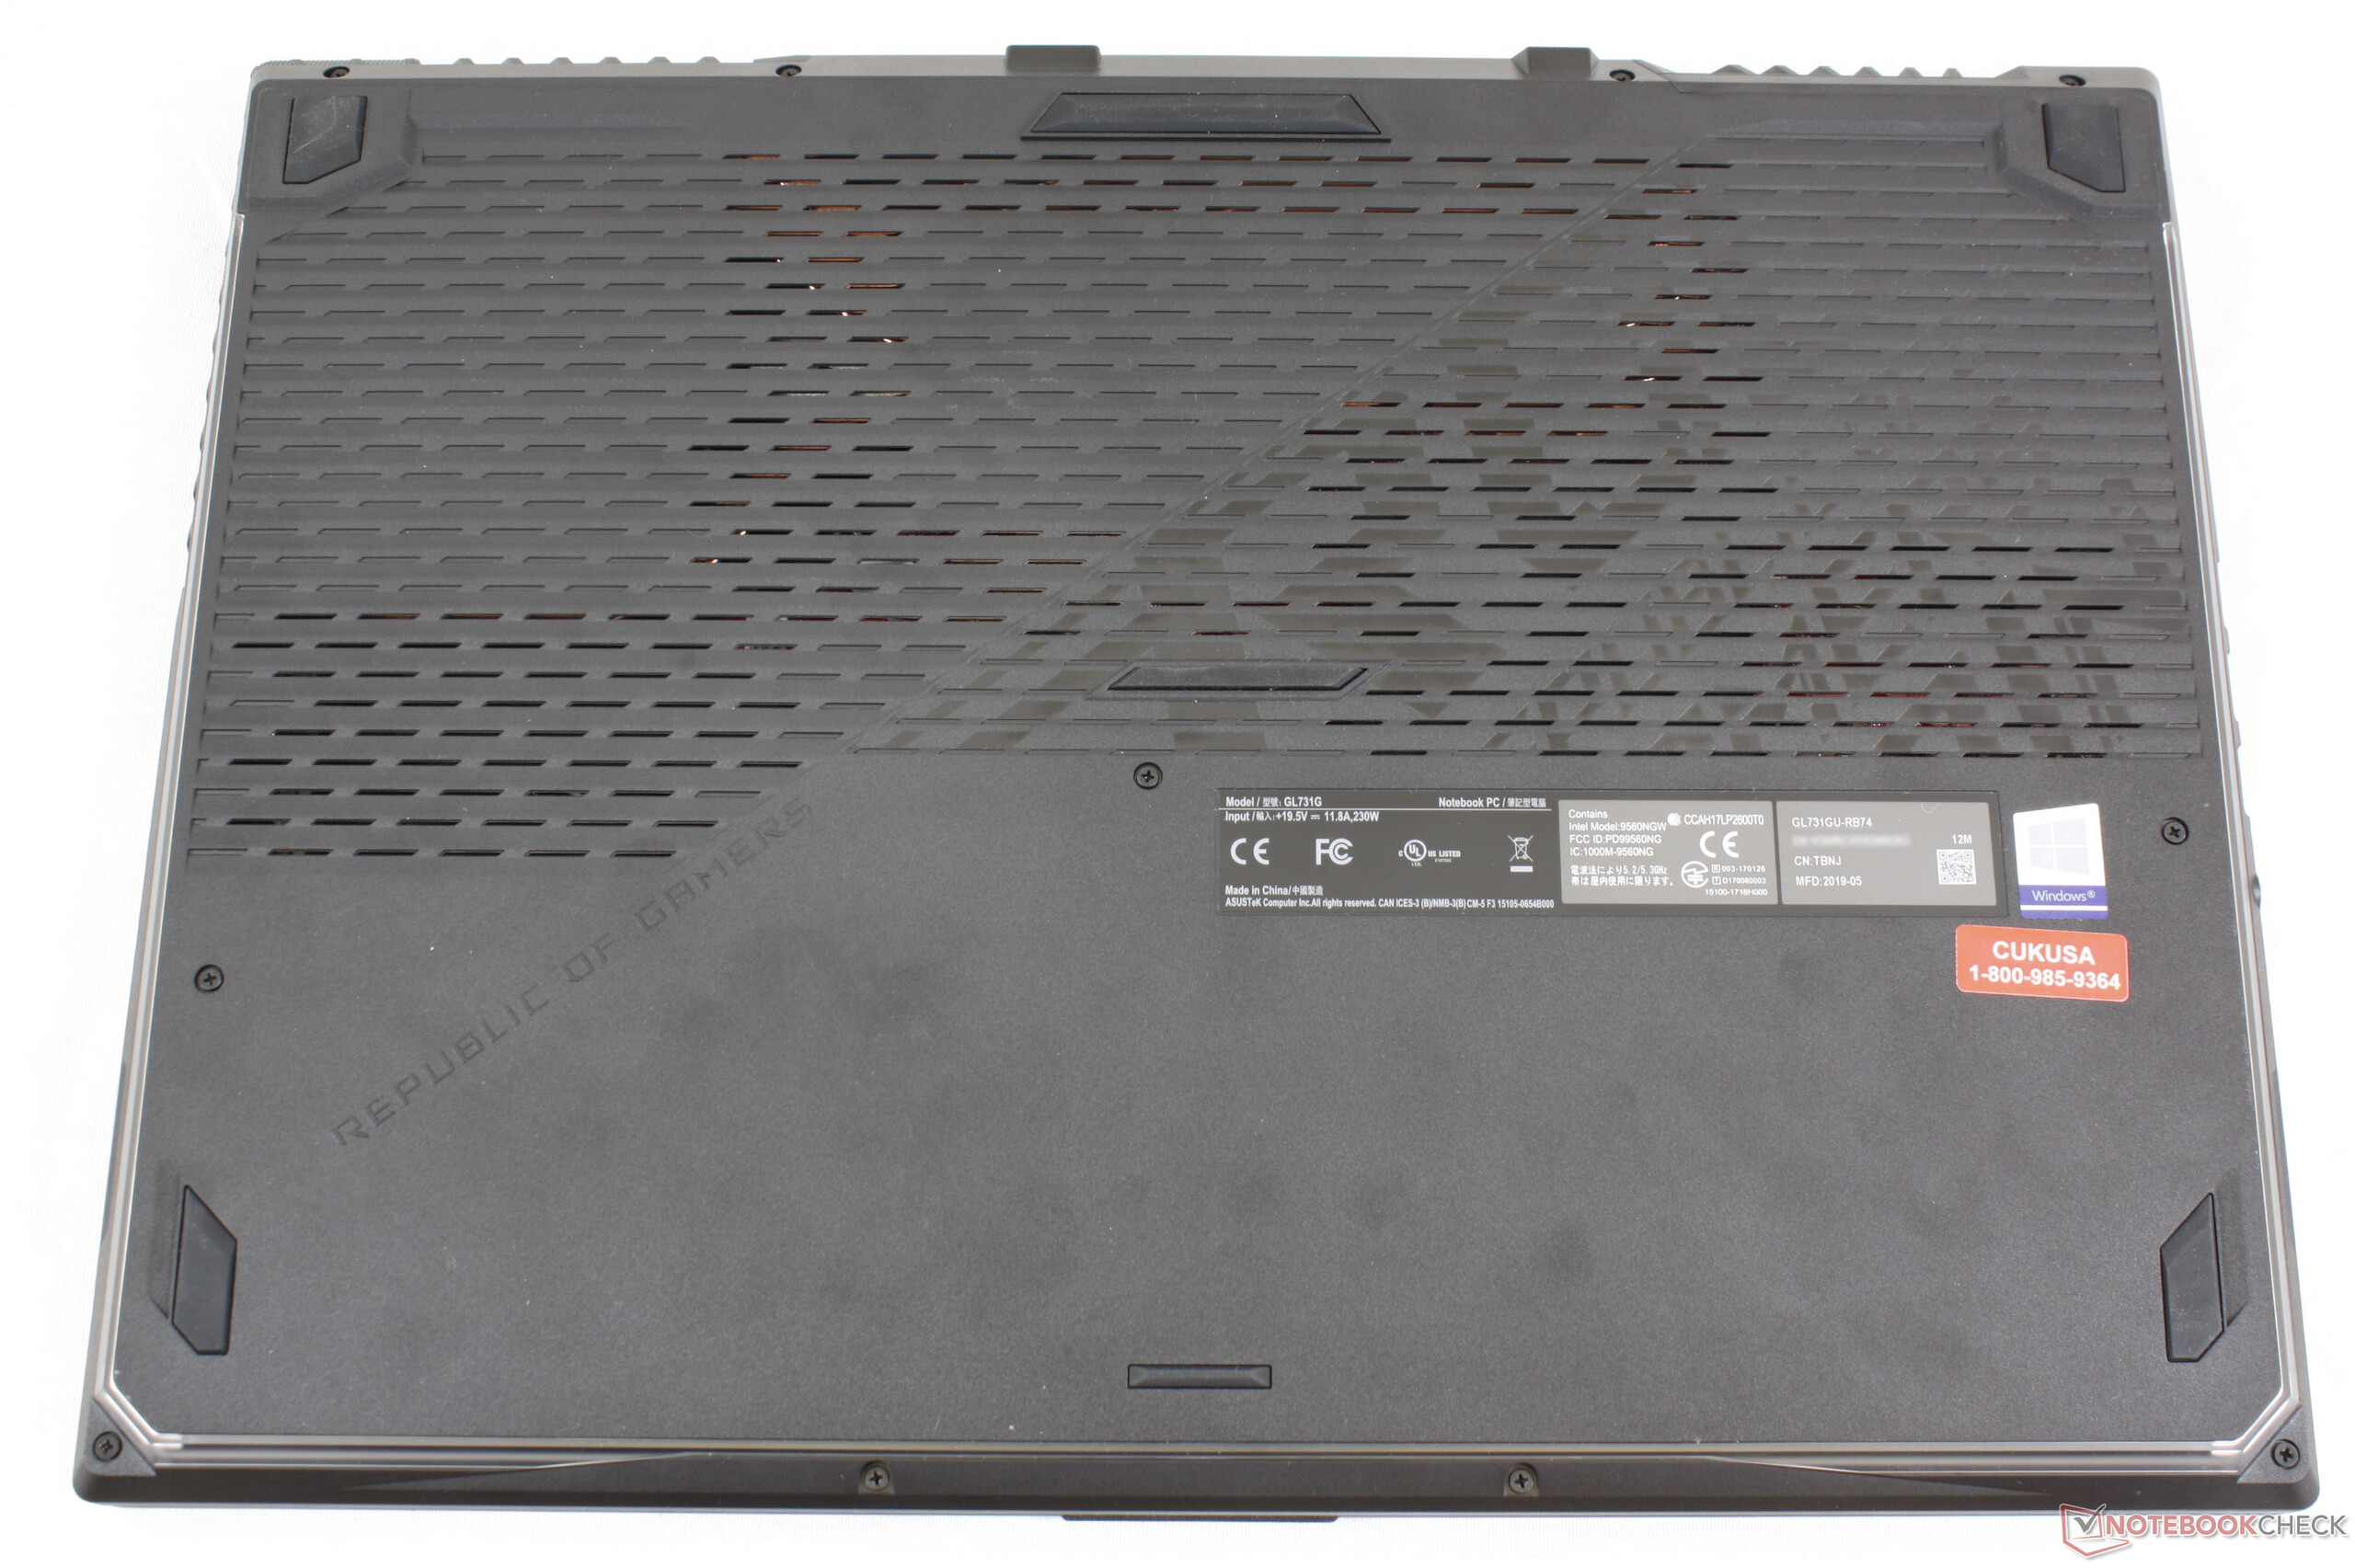
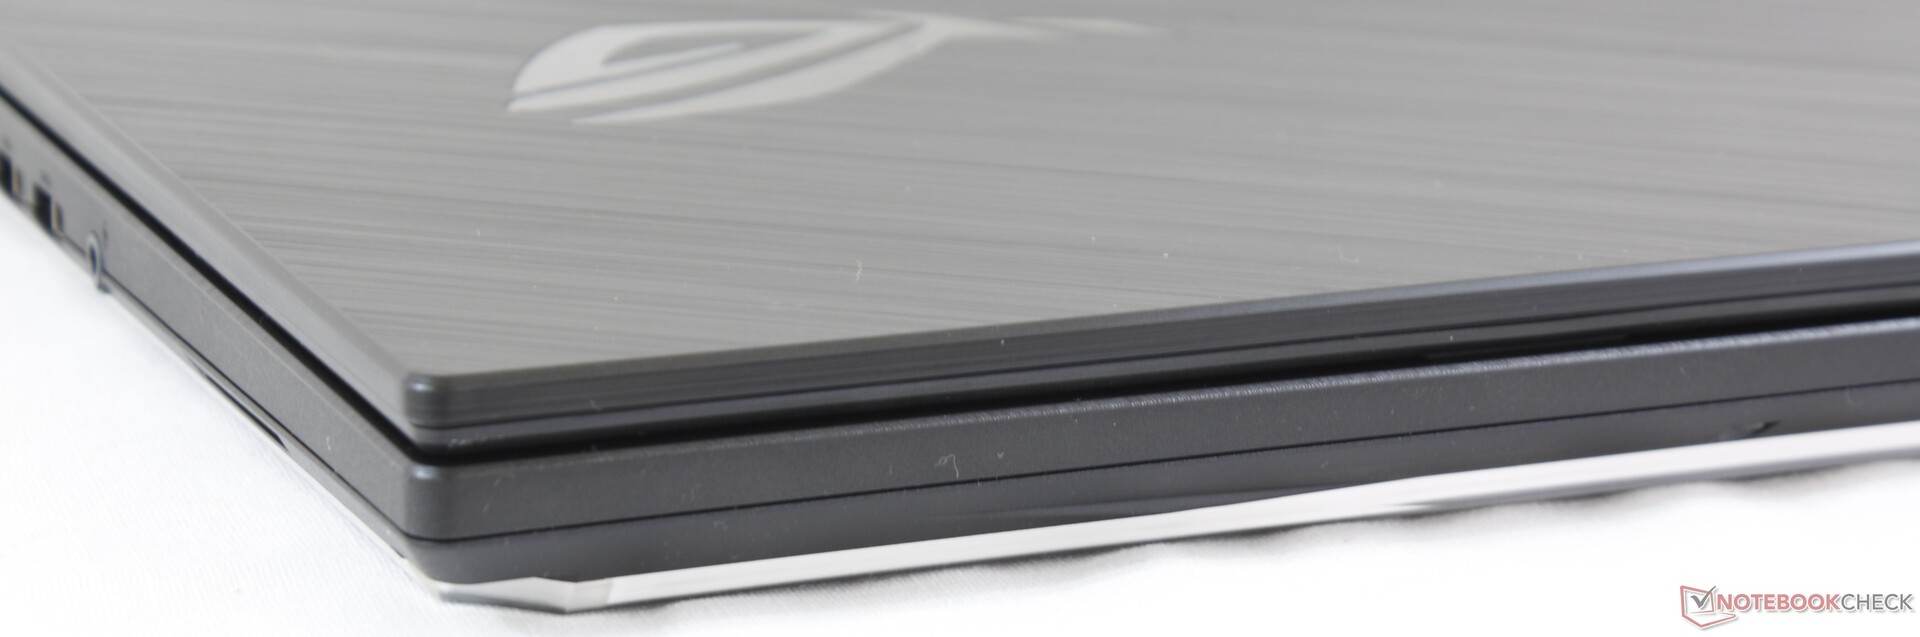
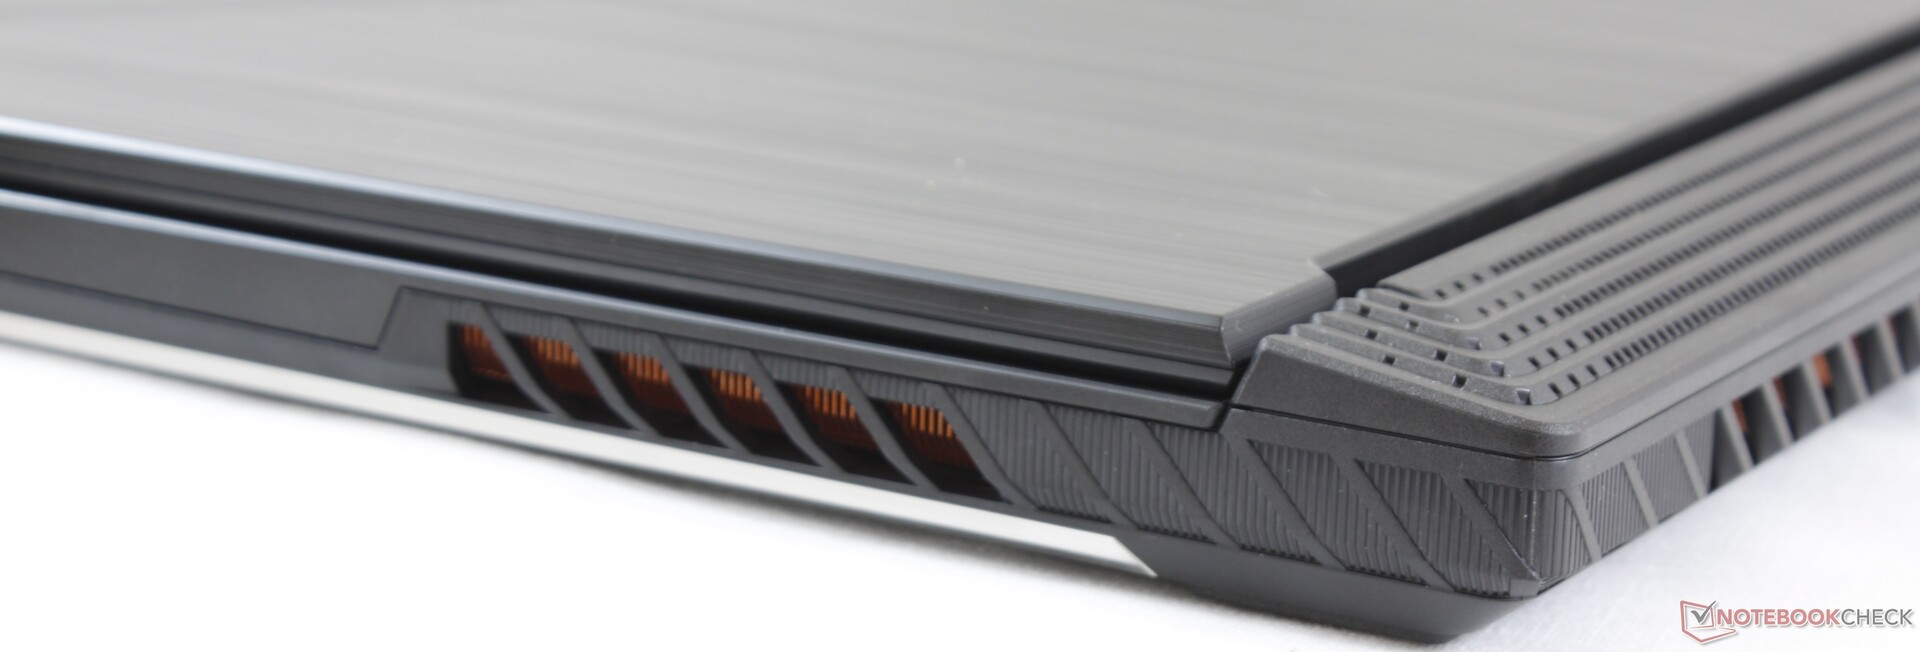
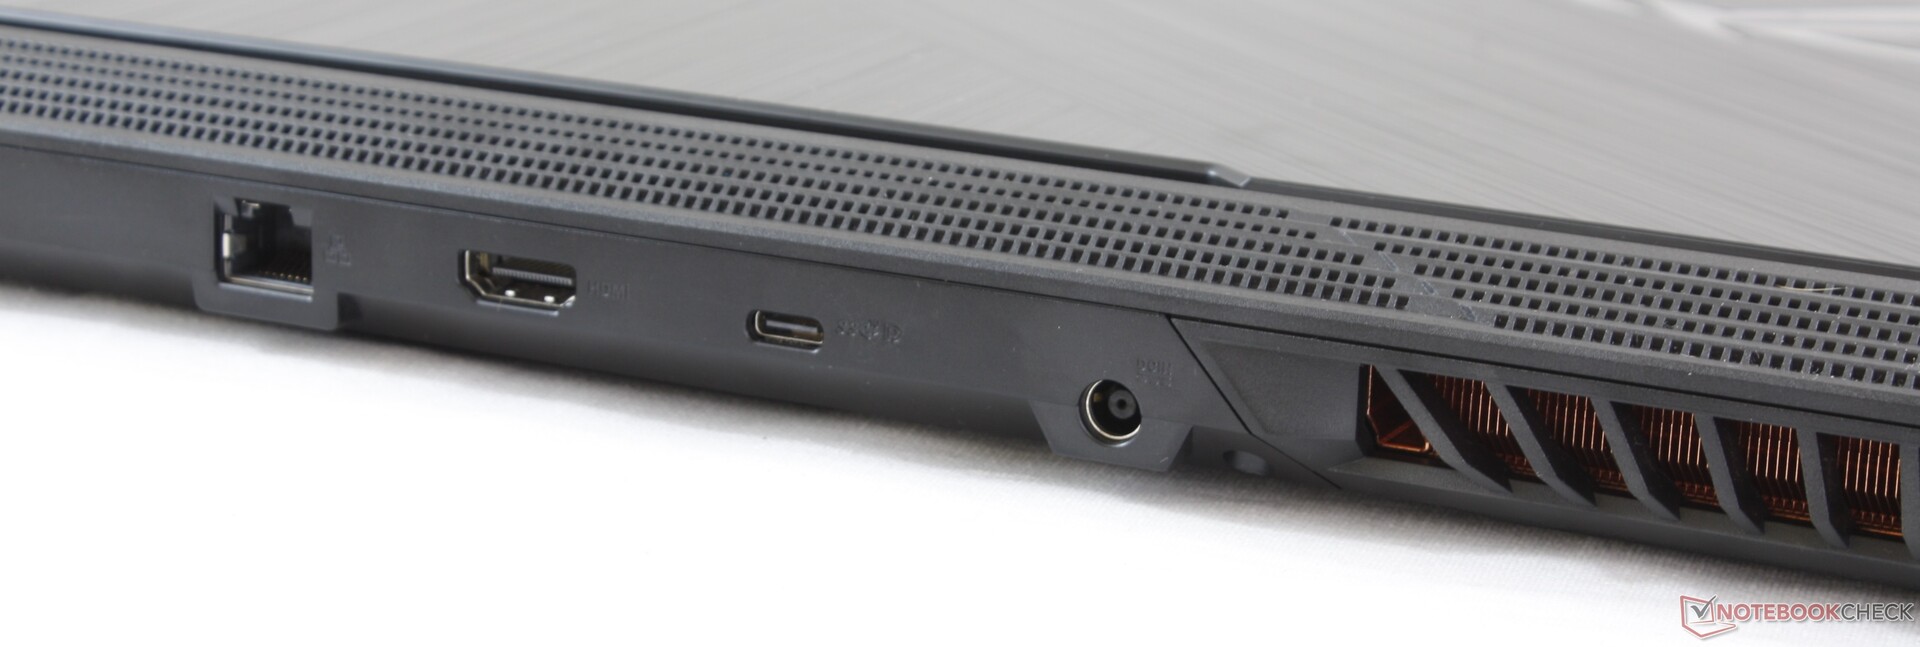
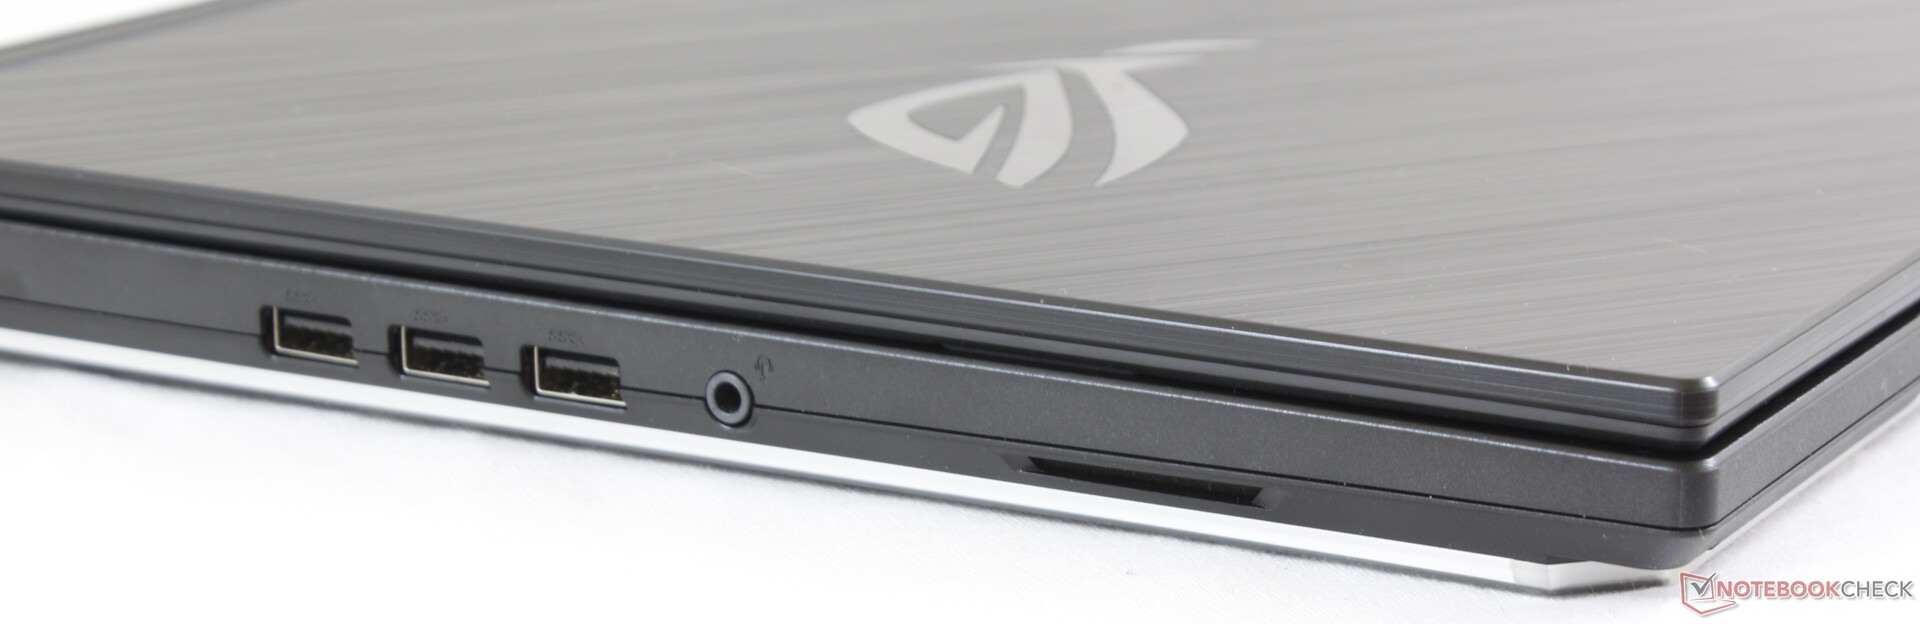
Mesmo que haja muito o que gostar no Asus GL731GU, não podemos deixar de pensar em algumas decisões do design. Em primeiro lugar, a barra de luz LED tem o custo inesperado de manutenção, porque o painel inferior é agora muito mais hostil ao usuário para ser removido. Se tudo o que você deseja fazer é expandir o armazenamento ou a RAM, esteja preparado para desconectar e reconectar alguns cabos de fita muito frágeis ao longo do caminho. Em segundo lugar, não há razão para que as teclas direcionais tenham que ser tão pequenas e apertadas em um chassi de formato tão grande, especialmente quando a última geração do Strix II tinha teclas de seta maiores. Em terceiro lugar, a falta de opções de cores separadas para a barra de LED e a luz de fundo do teclado é um enorme erro na personalização do sistema. Entendemos o raciocínio para o bloqueio de opções de iluminação RGB por tecla apenas para modelos mais sofisticados, mas isso é particularmente notório para um portátil de US $ 1.500. E, por fim, o posicionamento incomum das portas pode não ser do agrado de todos, já que não há nenhum na borda direita - uma raridade para um portátil de jogos de 17,3 polegadas.
Além das desvantagens desconcertantes acima, o Strix G GL731 captura com sucesso o desempenho, a tela e o design de sua série Strix III G731 mais cara. Os usuários que desejam a aparência e os recursos de jogos de um G731 topo de linha, mas não estão dispostos a pagar pela sofisticada iluminação RGB por tecla ou chassi de alumínio, encontrarão no GL731 um prospecto atraente. A faixa de preço de US $ 1.500 para nossa configuração é quase padrão para um portátil de 17,3 polegadas com gráficos GTX 1660 Ti.
Alguns aborrecimentos prejudicam o dispositivo com excelente desempenho. Se você conseguir passar por alto o formato relativamente grande, o peso, as pequenas teclas de seta e a capacidade de manutenção hostil ao usuário, o GL731GU será um dos portáteis de jogos de gama média de melhor aparência para sua categoria de tamanho. As temperaturas do núcleo e a qualidade do áudio em particular são melhores que o esperado.
Asus ROG Strix G GL731GU-RB74
- 07/19/2019 v6 (old)
Allen Ngo
Price comparison
