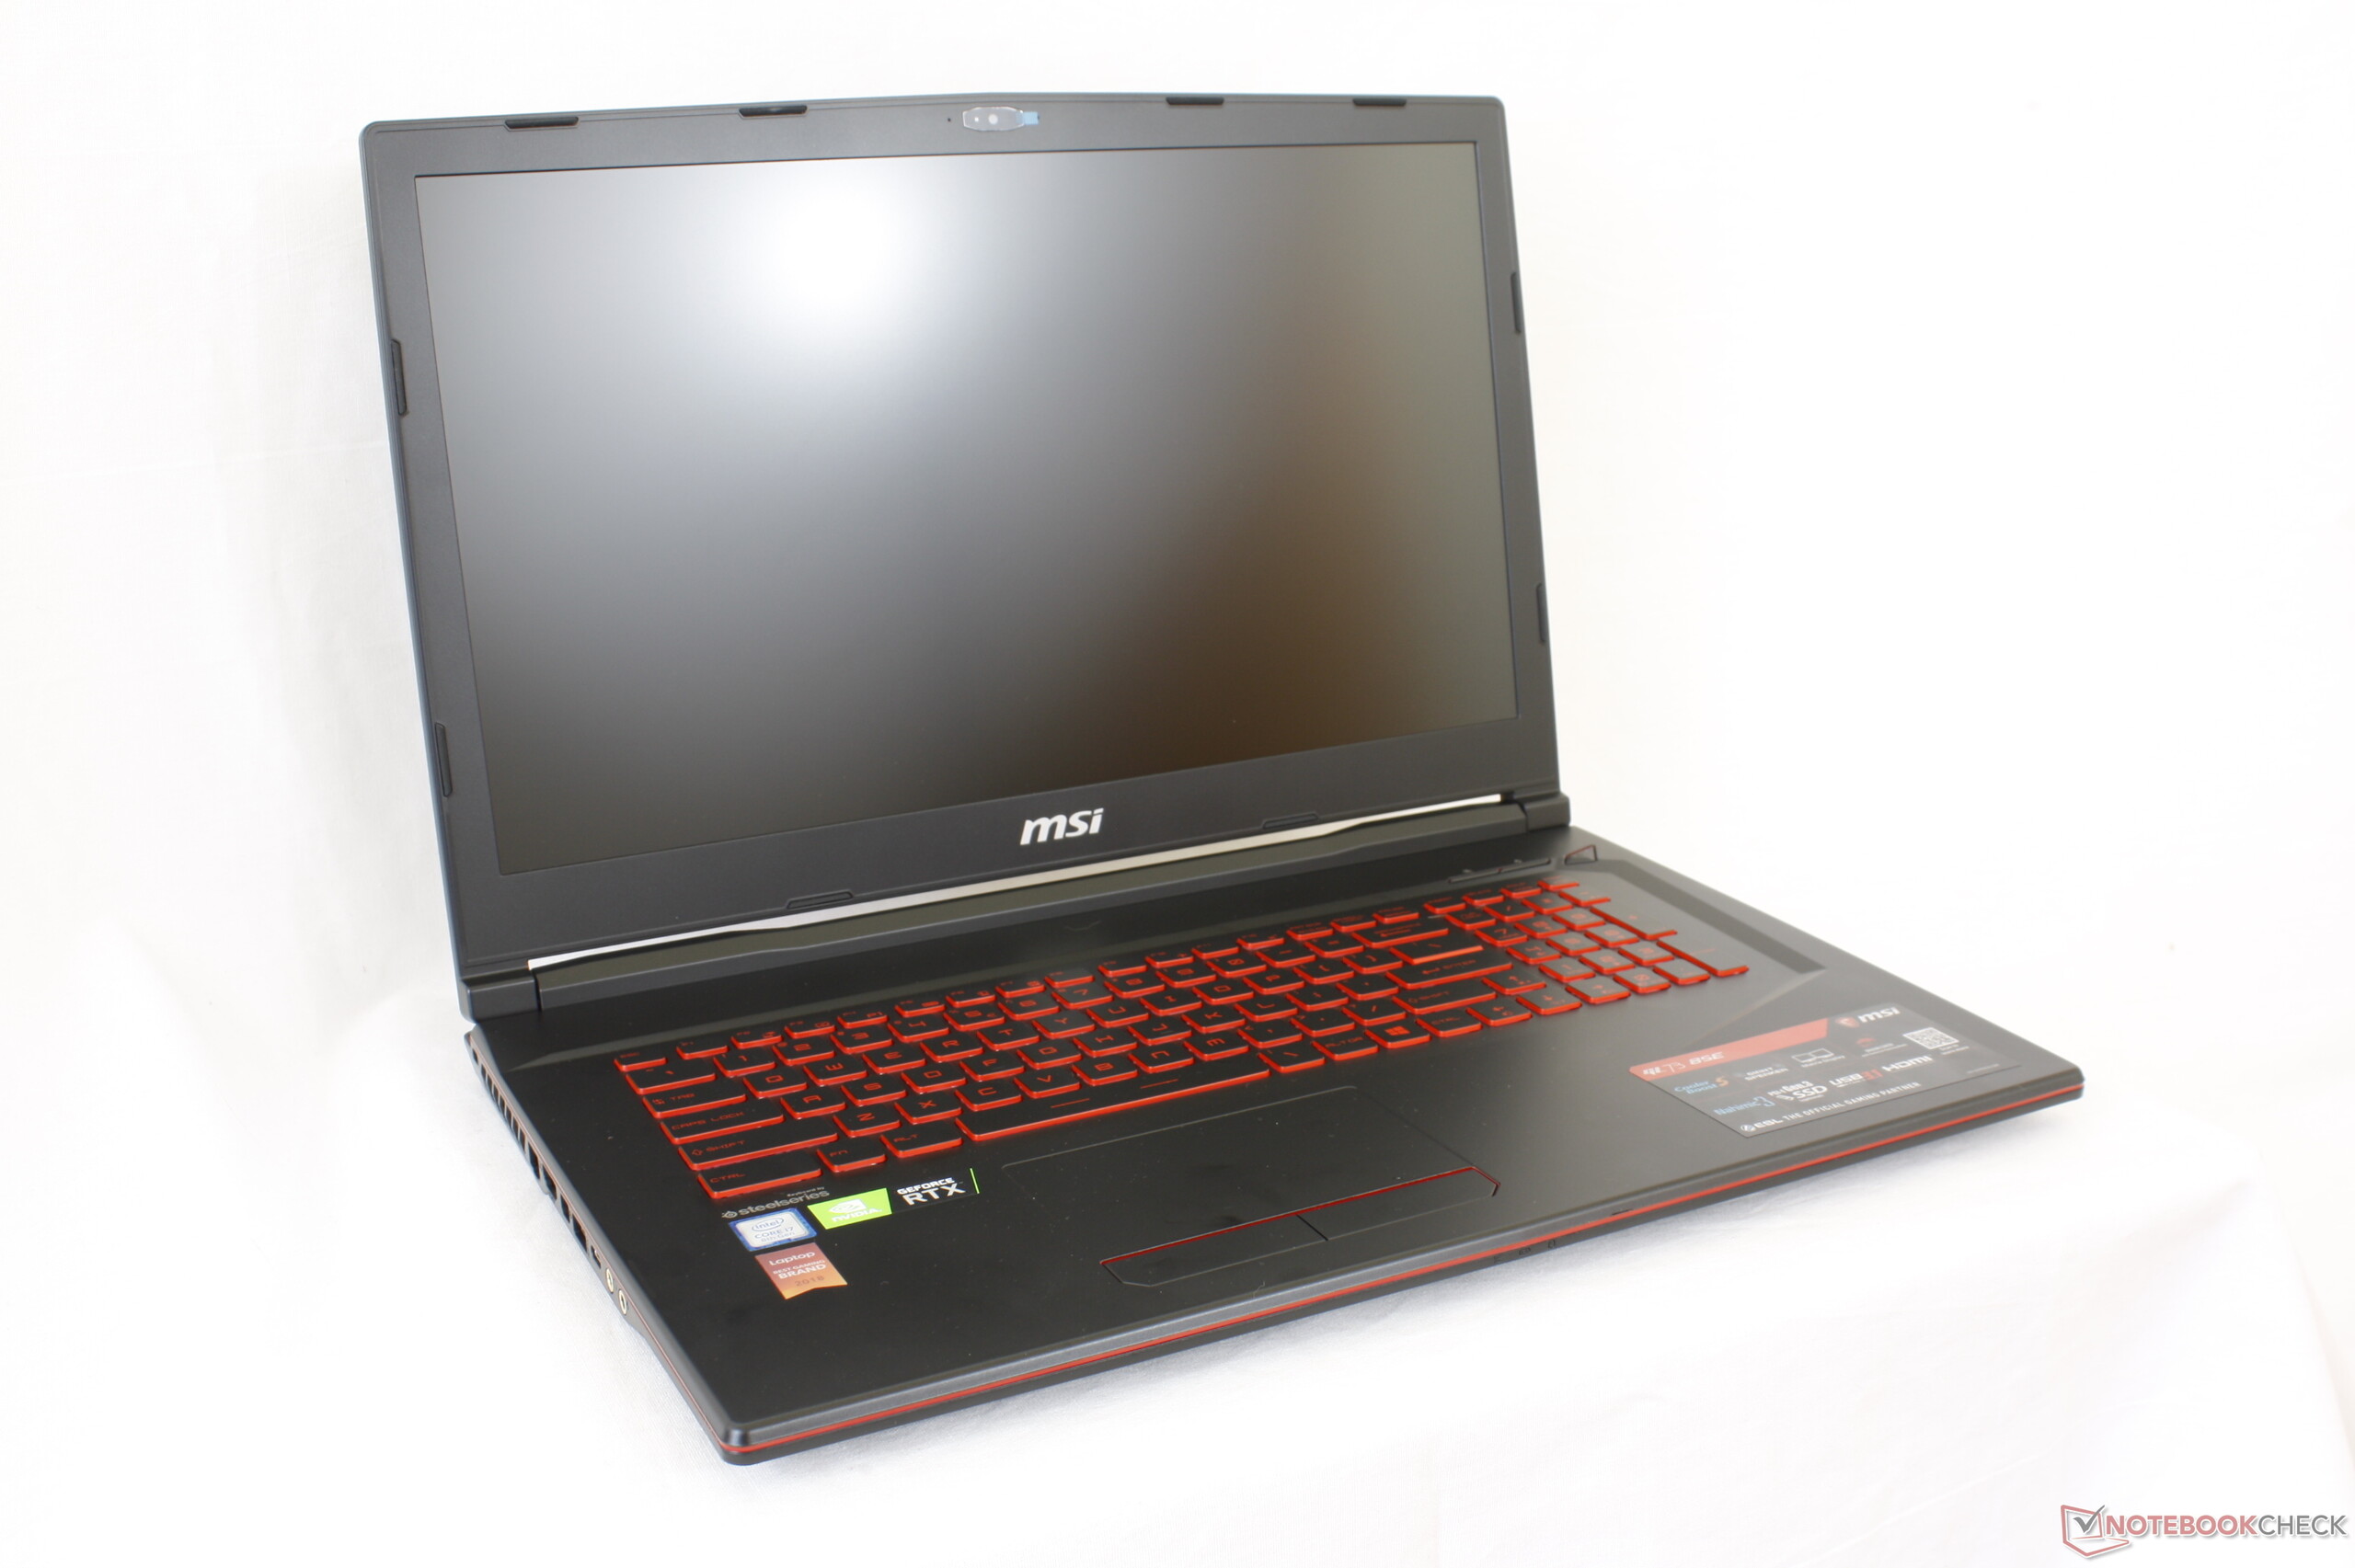
Breve Análise do Portátil MSI GL73 8SE (i7-8750H, RTX 2060)
| SD Card Reader | |
| average JPG Copy Test (av. of 3 runs) | |
| Gigabyte Sabre 17-W8 (Toshiba Exceria Pro SDXC 64 GB UHS-II) | |
| MSI GL73 8SE-010US (Toshiba Exceria Pro SDXC 64 GB UHS-II) | |
| MSI GE73 8RF-008 Raider RGB (Toshiba Exceria Pro SDXC 64 GB UHS-II) | |
| Dell G3 17 3779 (Toshiba Exceria Pro SDXC 64 GB UHS-II) | |
| MSI GL72 7RDX-602 (Toshiba Exceria Pro SDXC 64 GB UHS-II) | |
| maximum AS SSD Seq Read Test (1GB) | |
| Gigabyte Sabre 17-W8 (Toshiba Exceria Pro SDXC 64 GB UHS-II) | |
| MSI GE73 8RF-008 Raider RGB (Toshiba Exceria Pro SDXC 64 GB UHS-II) | |
| MSI GL73 8SE-010US (Toshiba Exceria Pro SDXC 64 GB UHS-II) | |
| MSI GL72 7RDX-602 (Toshiba Exceria Pro SDXC 64 GB UHS-II) | |
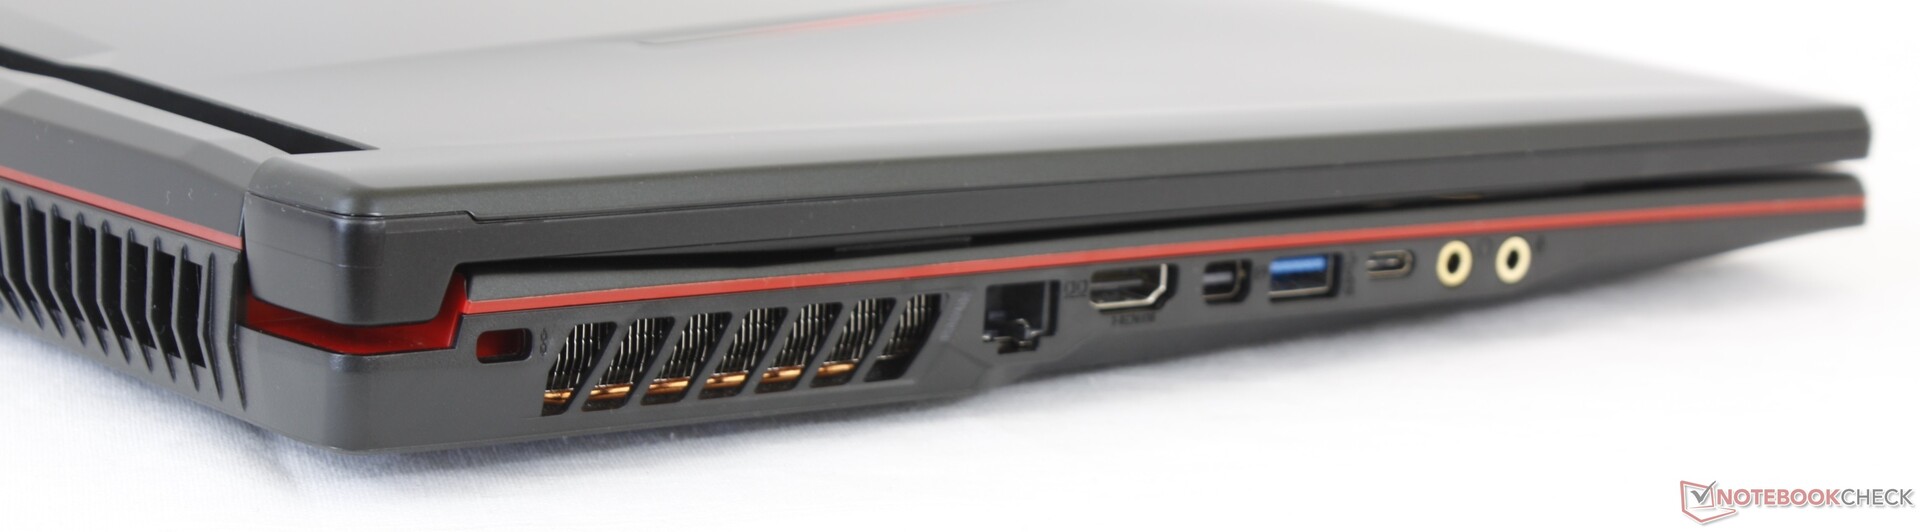
| Networking | |
| iperf3 transmit AX12 | |
| MSI GE73 8RF-008 Raider RGB | |
| MSI GL73 8SE-010US | |
| Lenovo Legion Y730-17ICH, i7-8750H | |
| MSI GL72 7RDX-602 | |
| Dell G3 17 3779 | |
| MSI GL73 8RD-418US | |
| iperf3 receive AX12 | |
| MSI GE73 8RF-008 Raider RGB | |
| MSI GL73 8SE-010US | |
| Lenovo Legion Y730-17ICH, i7-8750H | |
| MSI GL73 8RD-418US | |
| MSI GL72 7RDX-602 | |
| Dell G3 17 3779 | |
| |||||||||||||||||||||||||
iluminação: 90 %
iluminação com acumulador: 326.4 cd/m²
Contraste: 1166:1 (Preto: 0.28 cd/m²)
ΔE ColorChecker Calman: 7.83 | ∀{0.5-29.43 Ø4.73}
calibrated: 2.83
ΔE Greyscale Calman: 10.9 | ∀{0.09-98 Ø4.97}
100% sRGB (Argyll 1.6.3 3D)
75.8% AdobeRGB 1998 (Argyll 1.6.3 3D)
85.4% AdobeRGB 1998 (Argyll 3D)
100% sRGB (Argyll 3D)
91.1% Display P3 (Argyll 3D)
Gamma: 1.97
CCT: 11056 K
| MSI GL73 8SE-010US CMN1747, TN LED, 17.3", 1920x1080 | Lenovo Legion Y730-17ICH, i7-8750H LP173WF4-SPF6, IPS, 17.3", 1920x1080 | MSI GL72 7RDX-602 Chi Mei CMN1735 N173HGE-E11, TN LED, 17.3", 1920x1080 | MSI GE73 8RF-008 Raider RGB Chi Mei N173HHE-G32 (CMN1747), TN WLED, 17.3", 1920x1080 | Asus TUF FX705GM AU Optronics B173HAN04.0 (AUO409D), IPS, 17.3", 1920x1080 | Dell G3 17 3779 AUO, B173HAN01.3, IPS, 17.3", 1920x1080 | MSI GL73 8RD-418US Chi Mei N173HHE-G32, TN LED, 17.3", 1920x1080 | |
|---|---|---|---|---|---|---|---|
| Display | -23% | -19% | 0% | -23% | -21% | -0% | |
| Display P3 Coverage (%) | 91.1 | 66.4 -27% | 65.2 -28% | 90.8 0% | 62.4 -32% | 63.9 -30% | 91.1 0% |
| sRGB Coverage (%) | 100 | 84.9 -15% | 94.3 -6% | 99.9 0% | 88.8 -11% | 89.8 -10% | 99.9 0% |
| AdobeRGB 1998 Coverage (%) | 85.4 | 62.1 -27% | 65.6 -23% | 85.8 0% | 63.8 -25% | 64.9 -24% | 84.8 -1% |
| Response Times | -190% | -172% | -93% | 10% | -207% | -68% | |
| Response Time Grey 50% / Grey 80% * (ms) | 12.8 ? | 36.8 ? -187% | 29 ? -127% | 28 ? -119% | 7.4 ? 42% | 38 ? -197% | 29.6 ? -131% |
| Response Time Black / White * (ms) | 8.2 ? | 24 ? -193% | 26 ? -217% | 13.6 ? -66% | 10 ? -22% | 26 ? -217% | 8.6 ? -5% |
| PWM Frequency (Hz) | 25770 ? | 961 | 25000 ? | 25510 ? | |||
| Screen | -8% | -18% | 16% | 17% | 6% | -4% | |
| Brightness middle (cd/m²) | 326.4 | 328.7 1% | 299 -8% | 273 -16% | 234 -28% | 323 -1% | 290.5 -11% |
| Brightness (cd/m²) | 317 | 318 0% | 274 -14% | 273 -14% | 228 -28% | 306 -3% | 284 -10% |
| Brightness Distribution (%) | 90 | 91 1% | 80 -11% | 90 0% | 85 -6% | 89 -1% | 81 -10% |
| Black Level * (cd/m²) | 0.28 | 0.51 -82% | 0.25 11% | 0.26 7% | 0.2 29% | 0.31 -11% | 0.27 4% |
| Contrast (:1) | 1166 | 645 -45% | 1196 3% | 1050 -10% | 1170 0% | 1042 -11% | 1076 -8% |
| Colorchecker dE 2000 * | 7.83 | 4.91 37% | 12.92 -65% | 3.52 55% | 2.16 72% | 4.96 37% | 8.55 -9% |
| Colorchecker dE 2000 max. * | 13.36 | 10.15 24% | 19.91 -49% | 6.34 53% | 3.39 75% | 8.25 38% | 13.44 -1% |
| Colorchecker dE 2000 calibrated * | 2.83 | 4.27 -51% | 2.09 26% | 2.02 29% | 2.74 3% | ||
| Greyscale dE 2000 * | 10.9 | 3.9 64% | 13.16 -21% | 3.11 71% | 2 82% | 5.65 48% | 11.1 -2% |
| Gamma | 1.97 112% | 2.13 103% | 2.36 93% | 2.43 91% | 2.46 89% | 2.24 98% | 1.85 119% |
| CCT | 11056 59% | 6911 94% | 15046 43% | 6999 93% | 6394 102% | 7441 87% | 10912 60% |
| Color Space (Percent of AdobeRGB 1998) (%) | 75.8 | 55.6 -27% | 60 -21% | 76 0% | 58 -23% | 58 -23% | 75.4 -1% |
| Color Space (Percent of sRGB) (%) | 100 | 84.7 -15% | 94 -6% | 100 0% | 89 -11% | 90 -10% | 99.9 0% |
| Média Total (Programa/Configurações) | -74% /
-34% | -70% /
-39% | -26% /
-1% | 1% /
9% | -74% /
-28% | -24% /
-11% |
* ... menor é melhor
Exibir tempos de resposta
| ↔ Tempo de resposta preto para branco | ||
|---|---|---|
| 8.2 ms ... ascensão ↗ e queda ↘ combinadas | ↗ 6 ms ascensão | 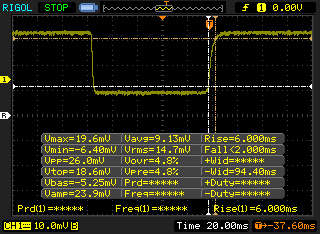 |
| ↘ 2.2 ms queda | ||
| A tela mostra taxas de resposta rápidas em nossos testes e deve ser adequada para jogos. Em comparação, todos os dispositivos testados variam de 0.1 (mínimo) a 240 (máximo) ms. » 23 % de todos os dispositivos são melhores. Isso significa que o tempo de resposta medido é melhor que a média de todos os dispositivos testados (19.9 ms). | ||
| ↔ Tempo de resposta 50% cinza a 80% cinza | ||
| 12.8 ms ... ascensão ↗ e queda ↘ combinadas | ↗ 6.8 ms ascensão | 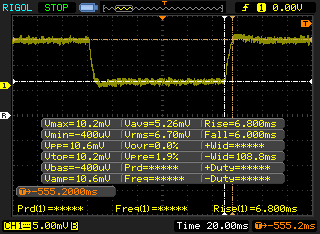 |
| ↘ 6 ms queda | ||
| A tela mostra boas taxas de resposta em nossos testes, mas pode ser muito lenta para jogadores competitivos. Em comparação, todos os dispositivos testados variam de 0.165 (mínimo) a 636 (máximo) ms. » 26 % de todos os dispositivos são melhores. Isso significa que o tempo de resposta medido é melhor que a média de todos os dispositivos testados (31.1 ms). | ||
Cintilação da tela / PWM (modulação por largura de pulso)
| Tela tremeluzindo/PWM detectado | 25770 Hz | ≤ 15 % configuração de brilho | 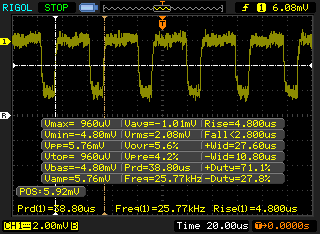 |
A luz de fundo da tela pisca em 25770 Hz (pior caso, por exemplo, utilizando PWM) Cintilação detectada em uma configuração de brilho de 15 % e abaixo. Não deve haver cintilação ou PWM acima desta configuração de brilho. A frequência de 25770 Hz é bastante alta, então a maioria dos usuários sensíveis ao PWM não deve notar nenhuma oscilação. [pwm_comparison] Em comparação: 52 % de todos os dispositivos testados não usam PWM para escurecer a tela. Se PWM foi detectado, uma média de 7784 (mínimo: 5 - máximo: 343500) Hz foi medida. | |||
| PCMark 8 | |
| Home Score Accelerated v2 | |
| Asus TUF FX705GM | |
| MSI GE73 8RF-008 Raider RGB | |
| Média Intel Core i7-8750H, NVIDIA GeForce RTX 2060 Mobile (3876 - 5077, n=3) | |
| MSI GL73 8RD-418US | |
| Dell G3 17 3779 | |
| MSI GL73 8SE-010US | |
| MSI GL72 7RDX-602 | |
| Work Score Accelerated v2 | |
| Asus TUF FX705GM | |
| Média Intel Core i7-8750H, NVIDIA GeForce RTX 2060 Mobile (5291 - 5899, n=3) | |
| MSI GL73 8RD-418US | |
| MSI GL73 8SE-010US | |
| MSI GE73 8RF-008 Raider RGB | |
| Dell G3 17 3779 | |
| MSI GL72 7RDX-602 | |
| PCMark 8 Home Score Accelerated v2 | 3876 pontos | |
| PCMark 8 Work Score Accelerated v2 | 5359 pontos | |
| PCMark 10 Score | 5118 pontos | |
Ajuda | ||
| MSI GL73 8SE-010US Kingston RBUSNS8154P3128GJ | Lenovo Legion Y730-17ICH, i7-8750H Toshiba KBG30ZMT128G | MSI GE73 8RF-008 Raider RGB Toshiba HG6 THNSNJ256G8NY | Asus TUF FX705GM WDC PC SN520 SDAPNUW-256G | Dell G3 17 3779 SK hynix SC311 SATA | |
|---|---|---|---|---|---|
| AS SSD | -68% | -24% | 116% | -34% | |
| Seq Read (MB/s) | 794 | 979 23% | 511 -36% | 1571 98% | 511 -36% |
| Seq Write (MB/s) | 427.6 | 125.4 -71% | 425.7 0% | 1236 189% | 254.4 -41% |
| 4K Read (MB/s) | 21.91 | 19.73 -10% | 14.07 -36% | 38.49 76% | 24.22 11% |
| 4K Write (MB/s) | 56.6 | 38.73 -32% | 38.34 -32% | 101.9 80% | 58.5 3% |
| 4K-64 Read (MB/s) | 354.3 | 168.6 -52% | 351.4 -1% | 720 103% | 160.7 -55% |
| 4K-64 Write (MB/s) | 285.7 | 31.38 -89% | 172.7 -40% | 856 200% | 114.8 -60% |
| Access Time Read * (ms) | 0.237 | 0.519 -119% | 0.235 1% | 0.106 55% | 0.136 43% |
| Access Time Write * (ms) | 0.09 | 0.324 -260% | 0.097 -8% | 0.036 60% | 0.069 23% |
| Score Read (Points) | 456 | 286 -37% | 417 -9% | 913 100% | 236 -48% |
| Score Write (Points) | 385 | 86 -78% | 254 -34% | 1082 181% | 199 -48% |
| Score Total (Points) | 1061 | 479 -55% | 881 -17% | 2458 132% | 552 -48% |
| Copy ISO MB/s (MB/s) | 811 | 272.7 -66% | 412.5 -49% | 154.9 -81% | |
| Copy Program MB/s (MB/s) | 278 | 182.9 -34% | 192.9 -31% | 99.8 -64% | |
| Copy Game MB/s (MB/s) | 556 | 134.6 -76% | 295.5 -47% | 124.2 -78% |
* ... menor é melhor

| 3DMark 11 Performance | 15612 pontos | |
| 3DMark Cloud Gate Standard Score | 29408 pontos | |
| 3DMark Fire Strike Score | 13774 pontos | |
| 3DMark Time Spy Score | 5679 pontos | |
Ajuda | ||
| baixo | média | alto | ultra | |
|---|---|---|---|---|
| BioShock Infinite (2013) | 230.2 | 198.8 | 201.5 | 127.9 |
| The Witcher 3 (2015) | 188.7 | 157.5 | 104.3 | 55.1 |
| Shadow of the Tomb Raider (2018) | 93 | 75 | 70 | 65 |
| MSI GL73 8SE-010US GeForce RTX 2060 Mobile, i7-8750H, Kingston RBUSNS8154P3128GJ | Lenovo Legion Y730-17ICH, i7-8750H GeForce GTX 1050 Ti Mobile, i7-8750H, Toshiba KBG30ZMT128G | Gigabyte Sabre 17-W8 GeForce GTX 1060 Mobile, i7-8750H, Toshiba NVMe THNSN5256GPU7 | Asus TUF FX705GM GeForce GTX 1060 Mobile, i7-8750H, WDC PC SN520 SDAPNUW-256G | MSI GL73 8RD-418US GeForce GTX 1050 Ti Mobile, i7-8750H, Kingston RBUSNS8154P3128GJ | MSI GE73 8RF-008 Raider RGB GeForce GTX 1070 Mobile, i7-8750H, Toshiba HG6 THNSNJ256G8NY | |
|---|---|---|---|---|---|---|
| Noise | 11% | -0% | -6% | 11% | -2% | |
| desligado / ambiente * (dB) | 28.6 | 28 2% | 30.5 -7% | 29 -1% | 28.5 -0% | 30 -5% |
| Idle Minimum * (dB) | 33.8 | 28 17% | 32.1 5% | 32 5% | 29.2 14% | 32 5% |
| Idle Average * (dB) | 34 | 28 18% | 32.1 6% | 33 3% | 29.3 14% | 33 3% |
| Idle Maximum * (dB) | 34.1 | 31.3 8% | 32.3 5% | 44 -29% | 29.3 14% | 34 -0% |
| Load Average * (dB) | 36.5 | 33.4 8% | 42.9 -18% | 46 -26% | 32.7 10% | 41 -12% |
| Witcher 3 ultra * (dB) | 47.8 | 42.8 10% | 48 -0% | 42.7 11% | 50 -5% | |
| Load Maximum * (dB) | 52.2 | 46.2 11% | 48.8 7% | 50 4% | 45.2 13% | 54 -3% |
* ... menor é melhor
Barulho
| Ocioso |
| 33.8 / 34 / 34.1 dB |
| Carga |
| 36.5 / 52.2 dB |
 | ||
30 dB silencioso 40 dB(A) audível 50 dB(A) ruidosamente alto |
||
min: | ||
(-) A temperatura máxima no lado superior é 47 °C / 117 F, em comparação com a média de 40.4 °C / 105 F , variando de 21.2 a 68.8 °C para a classe Gaming.
(±) A parte inferior aquece até um máximo de 44.4 °C / 112 F, em comparação com a média de 43.2 °C / 110 F
(+) Em uso inativo, a temperatura média para o lado superior é 22.3 °C / 72 F, em comparação com a média do dispositivo de 33.9 °C / ### class_avg_f### F.
(+) Jogando The Witcher 3, a temperatura média para o lado superior é 29.9 °C / 86 F, em comparação com a média do dispositivo de 33.9 °C / ## #class_avg_f### F.
(+) Os apoios para as mãos e o touchpad são mais frios que a temperatura da pele, com um máximo de 22 °C / 71.6 F e, portanto, são frios ao toque.
(+) A temperatura média da área do apoio para as mãos de dispositivos semelhantes foi 28.8 °C / 83.8 F (+6.8 °C / 12.2 F).
MSI GL73 8SE-010US análise de áudio
(+) | os alto-falantes podem tocar relativamente alto (###valor### dB)
Graves 100 - 315Hz
(-) | quase nenhum baixo - em média 23.1% menor que a mediana
(+) | o baixo é linear (4% delta para a frequência anterior)
Médios 400 - 2.000 Hz
(+) | médios equilibrados - apenas 3.2% longe da mediana
(±) | a linearidade dos médios é média (9.2% delta para frequência anterior)
Altos 2 - 16 kHz
(+) | agudos equilibrados - apenas 2.6% longe da mediana
(±) | a linearidade dos máximos é média (7.1% delta para frequência anterior)
Geral 100 - 16.000 Hz
(±) | a linearidade do som geral é média (18.6% diferença em relação à mediana)
Comparado com a mesma classe
» 60% de todos os dispositivos testados nesta classe foram melhores, 9% semelhantes, 31% piores
» O melhor teve um delta de 6%, a média foi 18%, o pior foi 132%
Comparado com todos os dispositivos testados
» 42% de todos os dispositivos testados foram melhores, 8% semelhantes, 50% piores
» O melhor teve um delta de 4%, a média foi 24%, o pior foi 134%
Apple MacBook 12 (Early 2016) 1.1 GHz análise de áudio
(+) | os alto-falantes podem tocar relativamente alto (###valor### dB)
Graves 100 - 315Hz
(±) | graves reduzidos - em média 11.3% menor que a mediana
(±) | a linearidade dos graves é média (14.2% delta para a frequência anterior)
Médios 400 - 2.000 Hz
(+) | médios equilibrados - apenas 2.4% longe da mediana
(+) | médios são lineares (5.5% delta para frequência anterior)
Altos 2 - 16 kHz
(+) | agudos equilibrados - apenas 2% longe da mediana
(+) | os máximos são lineares (4.5% delta da frequência anterior)
Geral 100 - 16.000 Hz
(+) | o som geral é linear (10.2% diferença em relação à mediana)
Comparado com a mesma classe
» 7% de todos os dispositivos testados nesta classe foram melhores, 2% semelhantes, 91% piores
» O melhor teve um delta de 5%, a média foi 18%, o pior foi 53%
Comparado com todos os dispositivos testados
» 5% de todos os dispositivos testados foram melhores, 1% semelhantes, 94% piores
» O melhor teve um delta de 4%, a média foi 24%, o pior foi 134%
| desligado | |
| Ocioso | |
| Carga |
|
Key:
min: | |
| MSI GL73 8SE-010US i7-8750H, GeForce RTX 2060 Mobile, Kingston RBUSNS8154P3128GJ, TN LED, 1920x1080, 17.3" | MSI GE73 8RF-008 Raider RGB i7-8750H, GeForce GTX 1070 Mobile, Toshiba HG6 THNSNJ256G8NY, TN WLED, 1920x1080, 17.3" | MSI GL73 8RD-418US i7-8750H, GeForce GTX 1050 Ti Mobile, Kingston RBUSNS8154P3128GJ, TN LED, 1920x1080, 17.3" | MSI GL72 7RDX-602 i7-7700HQ, GeForce GTX 1050 Mobile, HGST Travelstar 7K1000 HTS721010A9E630, TN LED, 1920x1080, 17.3" | MSI GS73 Stealth 8RF-011 i7-8750H, GeForce GTX 1070 Max-Q, Samsung PM961 MZVLW256HEHP, TN, 1920x1080, 17.3" | MSI GF62VR 7RF-877 i7-7700HQ, GeForce GTX 1060 Mobile, Intel SSD 600p SSDPEKKW256G7, TN LED, 1920x1080, 15.6" | |
|---|---|---|---|---|---|---|
| Power Consumption | -34% | -7% | 4% | -3% | -11% | |
| Idle Minimum * (Watt) | 8.8 | 15 -70% | 11.8 -34% | 9.6 -9% | 8 9% | 16.2 -84% |
| Idle Average * (Watt) | 16.2 | 20 -23% | 18.7 -15% | 15 7% | 14 14% | 18.2 -12% |
| Idle Maximum * (Watt) | 18.3 | 26 -42% | 19.8 -8% | 16.5 10% | 22 -20% | 18.9 -3% |
| Load Average * (Watt) | 86.1 | 97 -13% | 100.8 -17% | 104 -21% | 92 -7% | 82.7 4% |
| Witcher 3 ultra * (Watt) | 146.7 | 186 -27% | 124.4 15% | 154 -5% | 125.7 14% | |
| Load Maximum * (Watt) | 186.4 | 239 -28% | 151.6 19% | 129 31% | 207 -11% | 162.3 13% |
* ... menor é melhor
| MSI GL73 8SE-010US i7-8750H, GeForce RTX 2060 Mobile, 41 Wh | Lenovo Legion Y730-17ICH, i7-8750H i7-8750H, GeForce GTX 1050 Ti Mobile, 76 Wh | MSI GL72 7RDX-602 i7-7700HQ, GeForce GTX 1050 Mobile, 43.2 Wh | MSI GE73 8RF-008 Raider RGB i7-8750H, GeForce GTX 1070 Mobile, 51 Wh | Asus TUF FX705GM i7-8750H, GeForce GTX 1060 Mobile, 64 Wh | Dell G3 17 3779 i5-8300H, GeForce GTX 1050 Mobile, 56 Wh | MSI GL73 8RD-418US i7-8750H, GeForce GTX 1050 Ti Mobile, 41 Wh | |
|---|---|---|---|---|---|---|---|
| Duração da bateria | 97% | 8% | -4% | 75% | 148% | -7% | |
| Reader / Idle (h) | 6.5 | 13.2 103% | 5.5 -15% | 5.1 -22% | 6.3 -3% | 12.2 88% | |
| WiFi v1.3 (h) | 2.8 | 6.7 139% | 3.4 21% | 3.1 11% | 4.5 61% | 5.8 107% | 2.6 -7% |
| Load (h) | 0.6 | 0.9 50% | 0.7 17% | 0.6 0% | 1.6 167% | 2.1 250% |
Pro
Contra

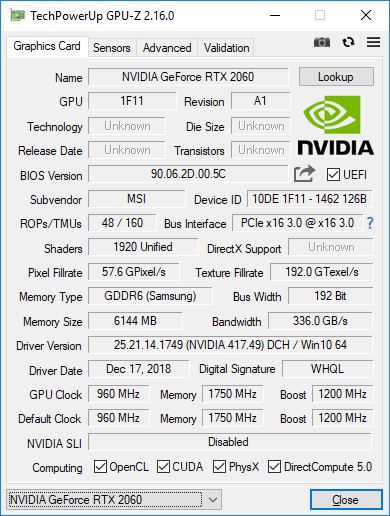
Quando verificamos o RTX 2070 Max-Q no Blade 15, vimos que seu desempenho 1080p foi apenas 15 por cento superior ao GTX 1070 Max-Q. Por isso esperávamos o mesmo do RTX 2060 em relação ao GTX 1060. Estamos entusiasmados ao descobrir que o RTX 2060 é, na verdade, cerca de 35% mais rápido ou mais do que o GTX 1060 para um maior ganho de desempenho ger-a-ger. Ainda cai um pouco quando comparado ao GTX 1070 e, portanto, os proprietários do GTX 1070 não estão perdendo — pelo menos até que o DLSS e ray tracing se tornem mais comuns. Na verdade, o RTX 2060 tem mais em comum com uma GTX 1070 Max-Q do que a GTX 1070, mesmo com consumo de energia.
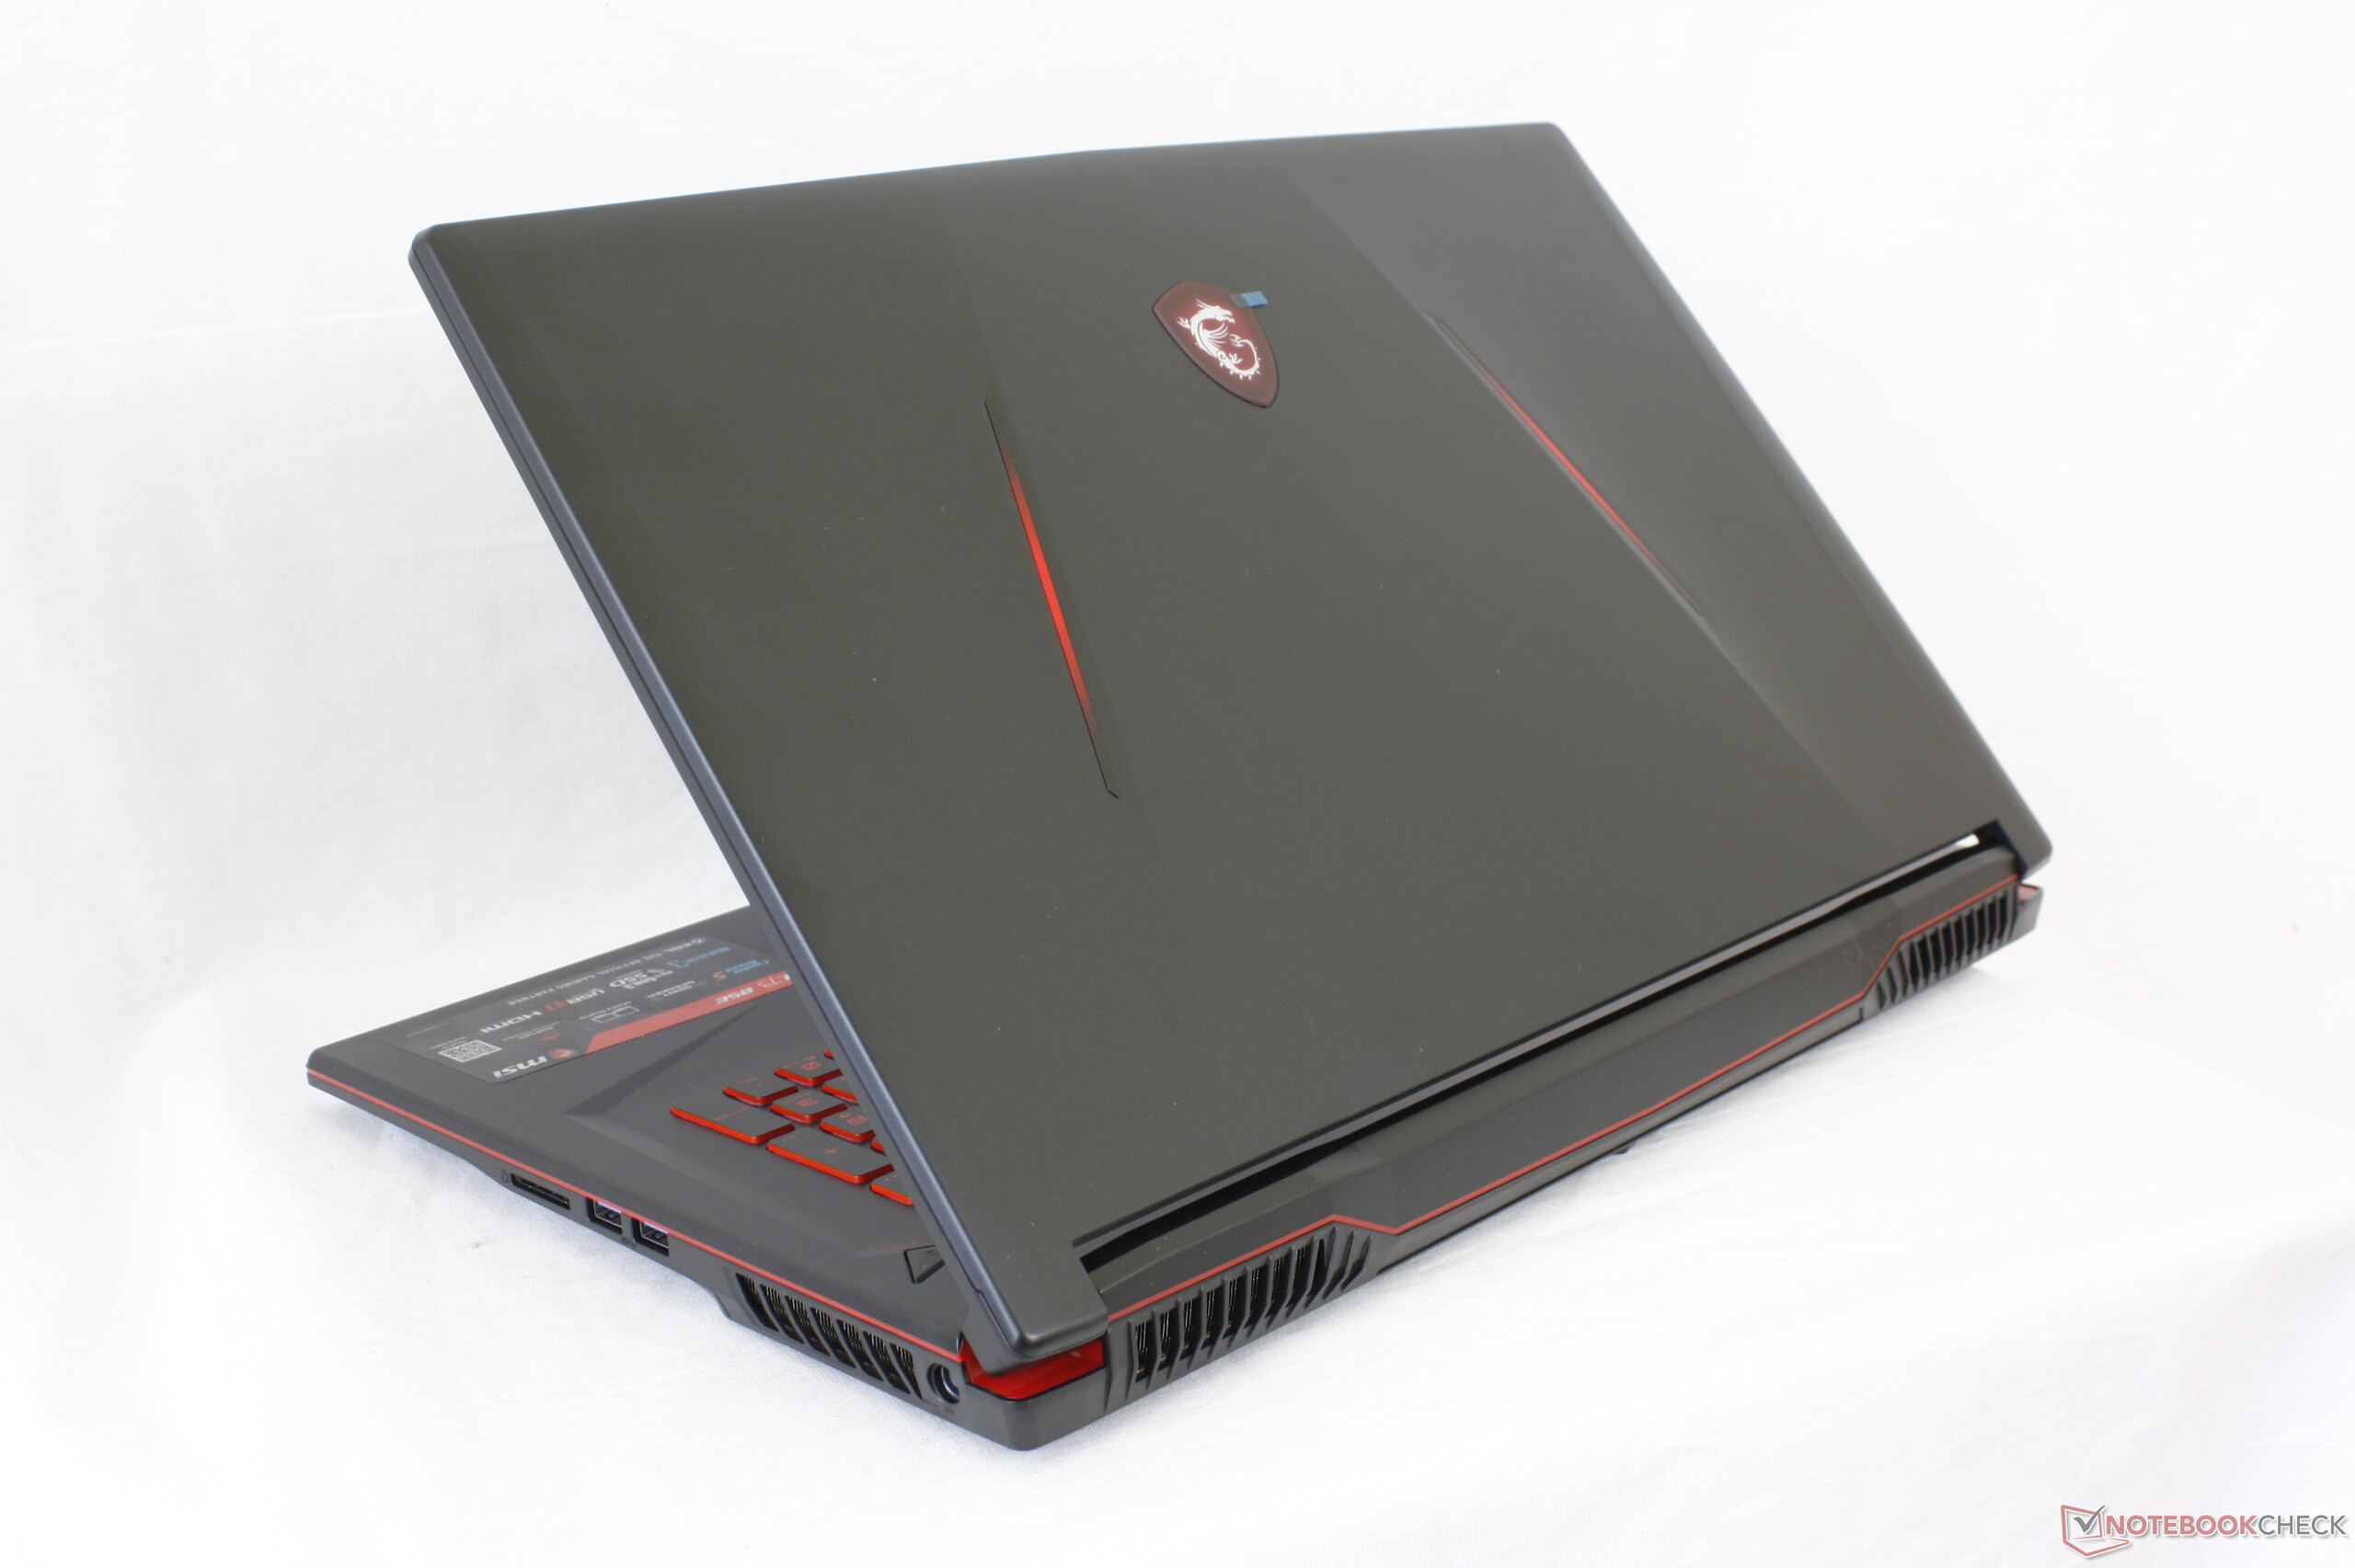
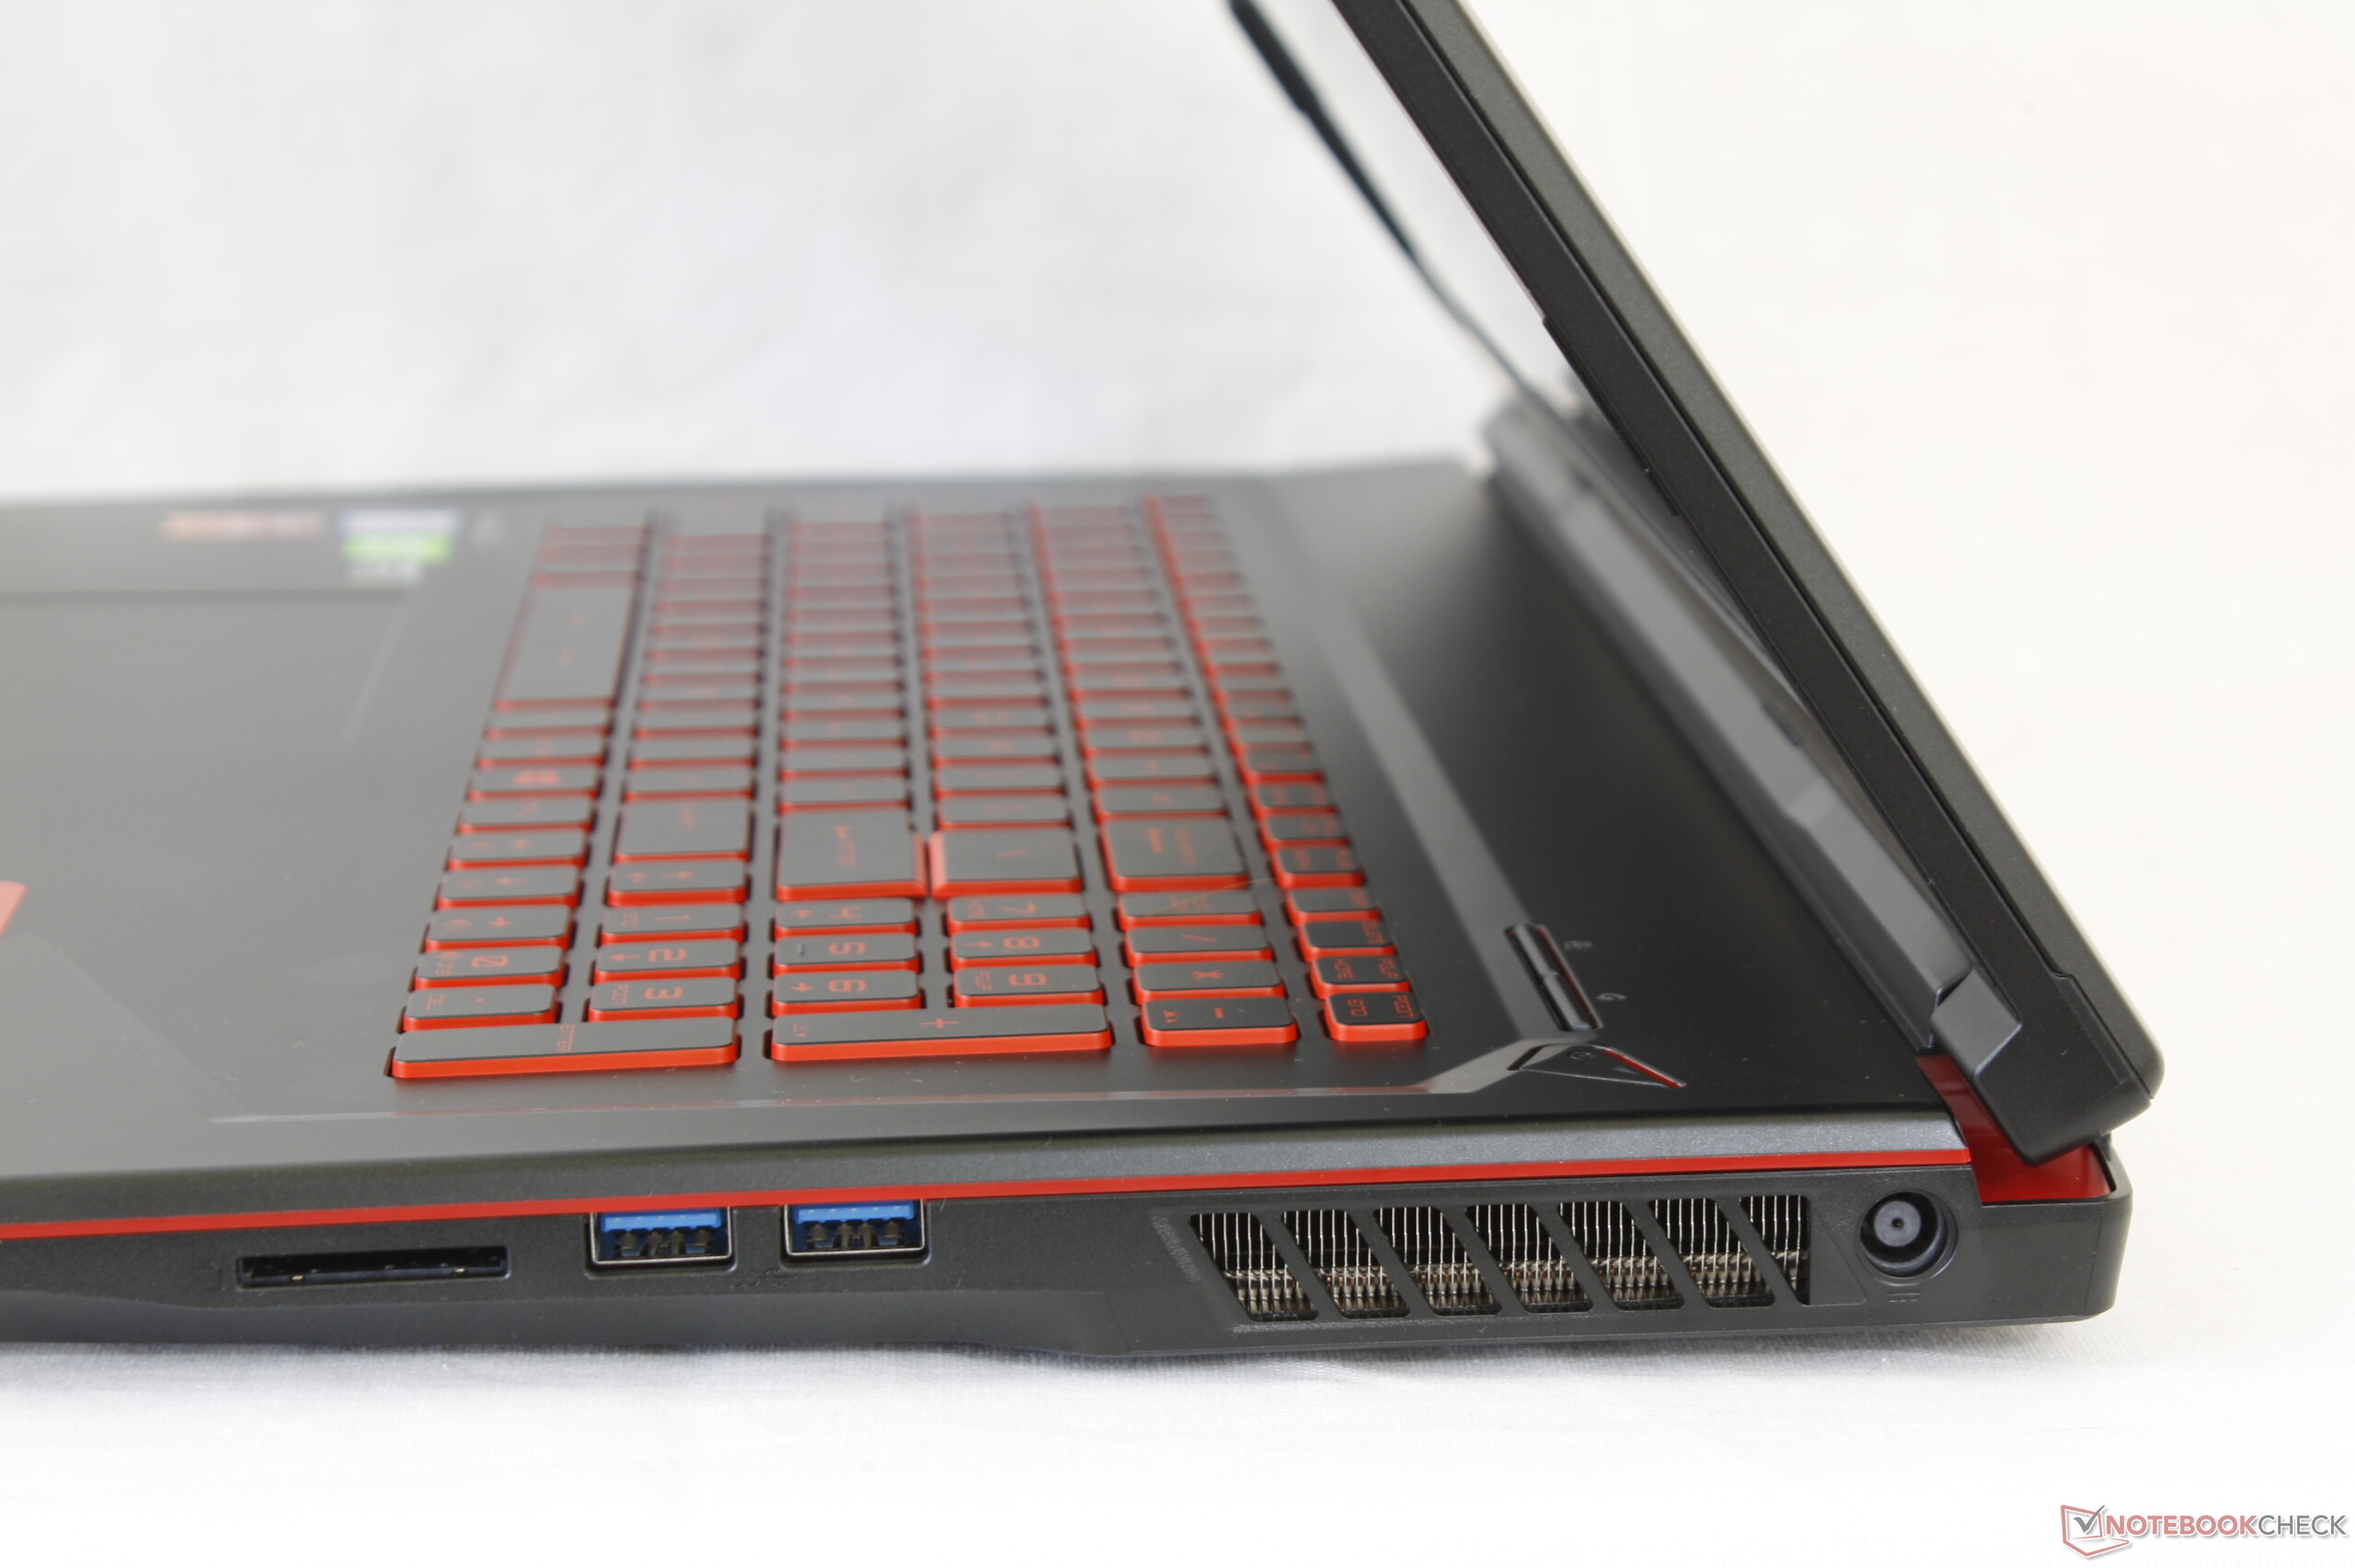
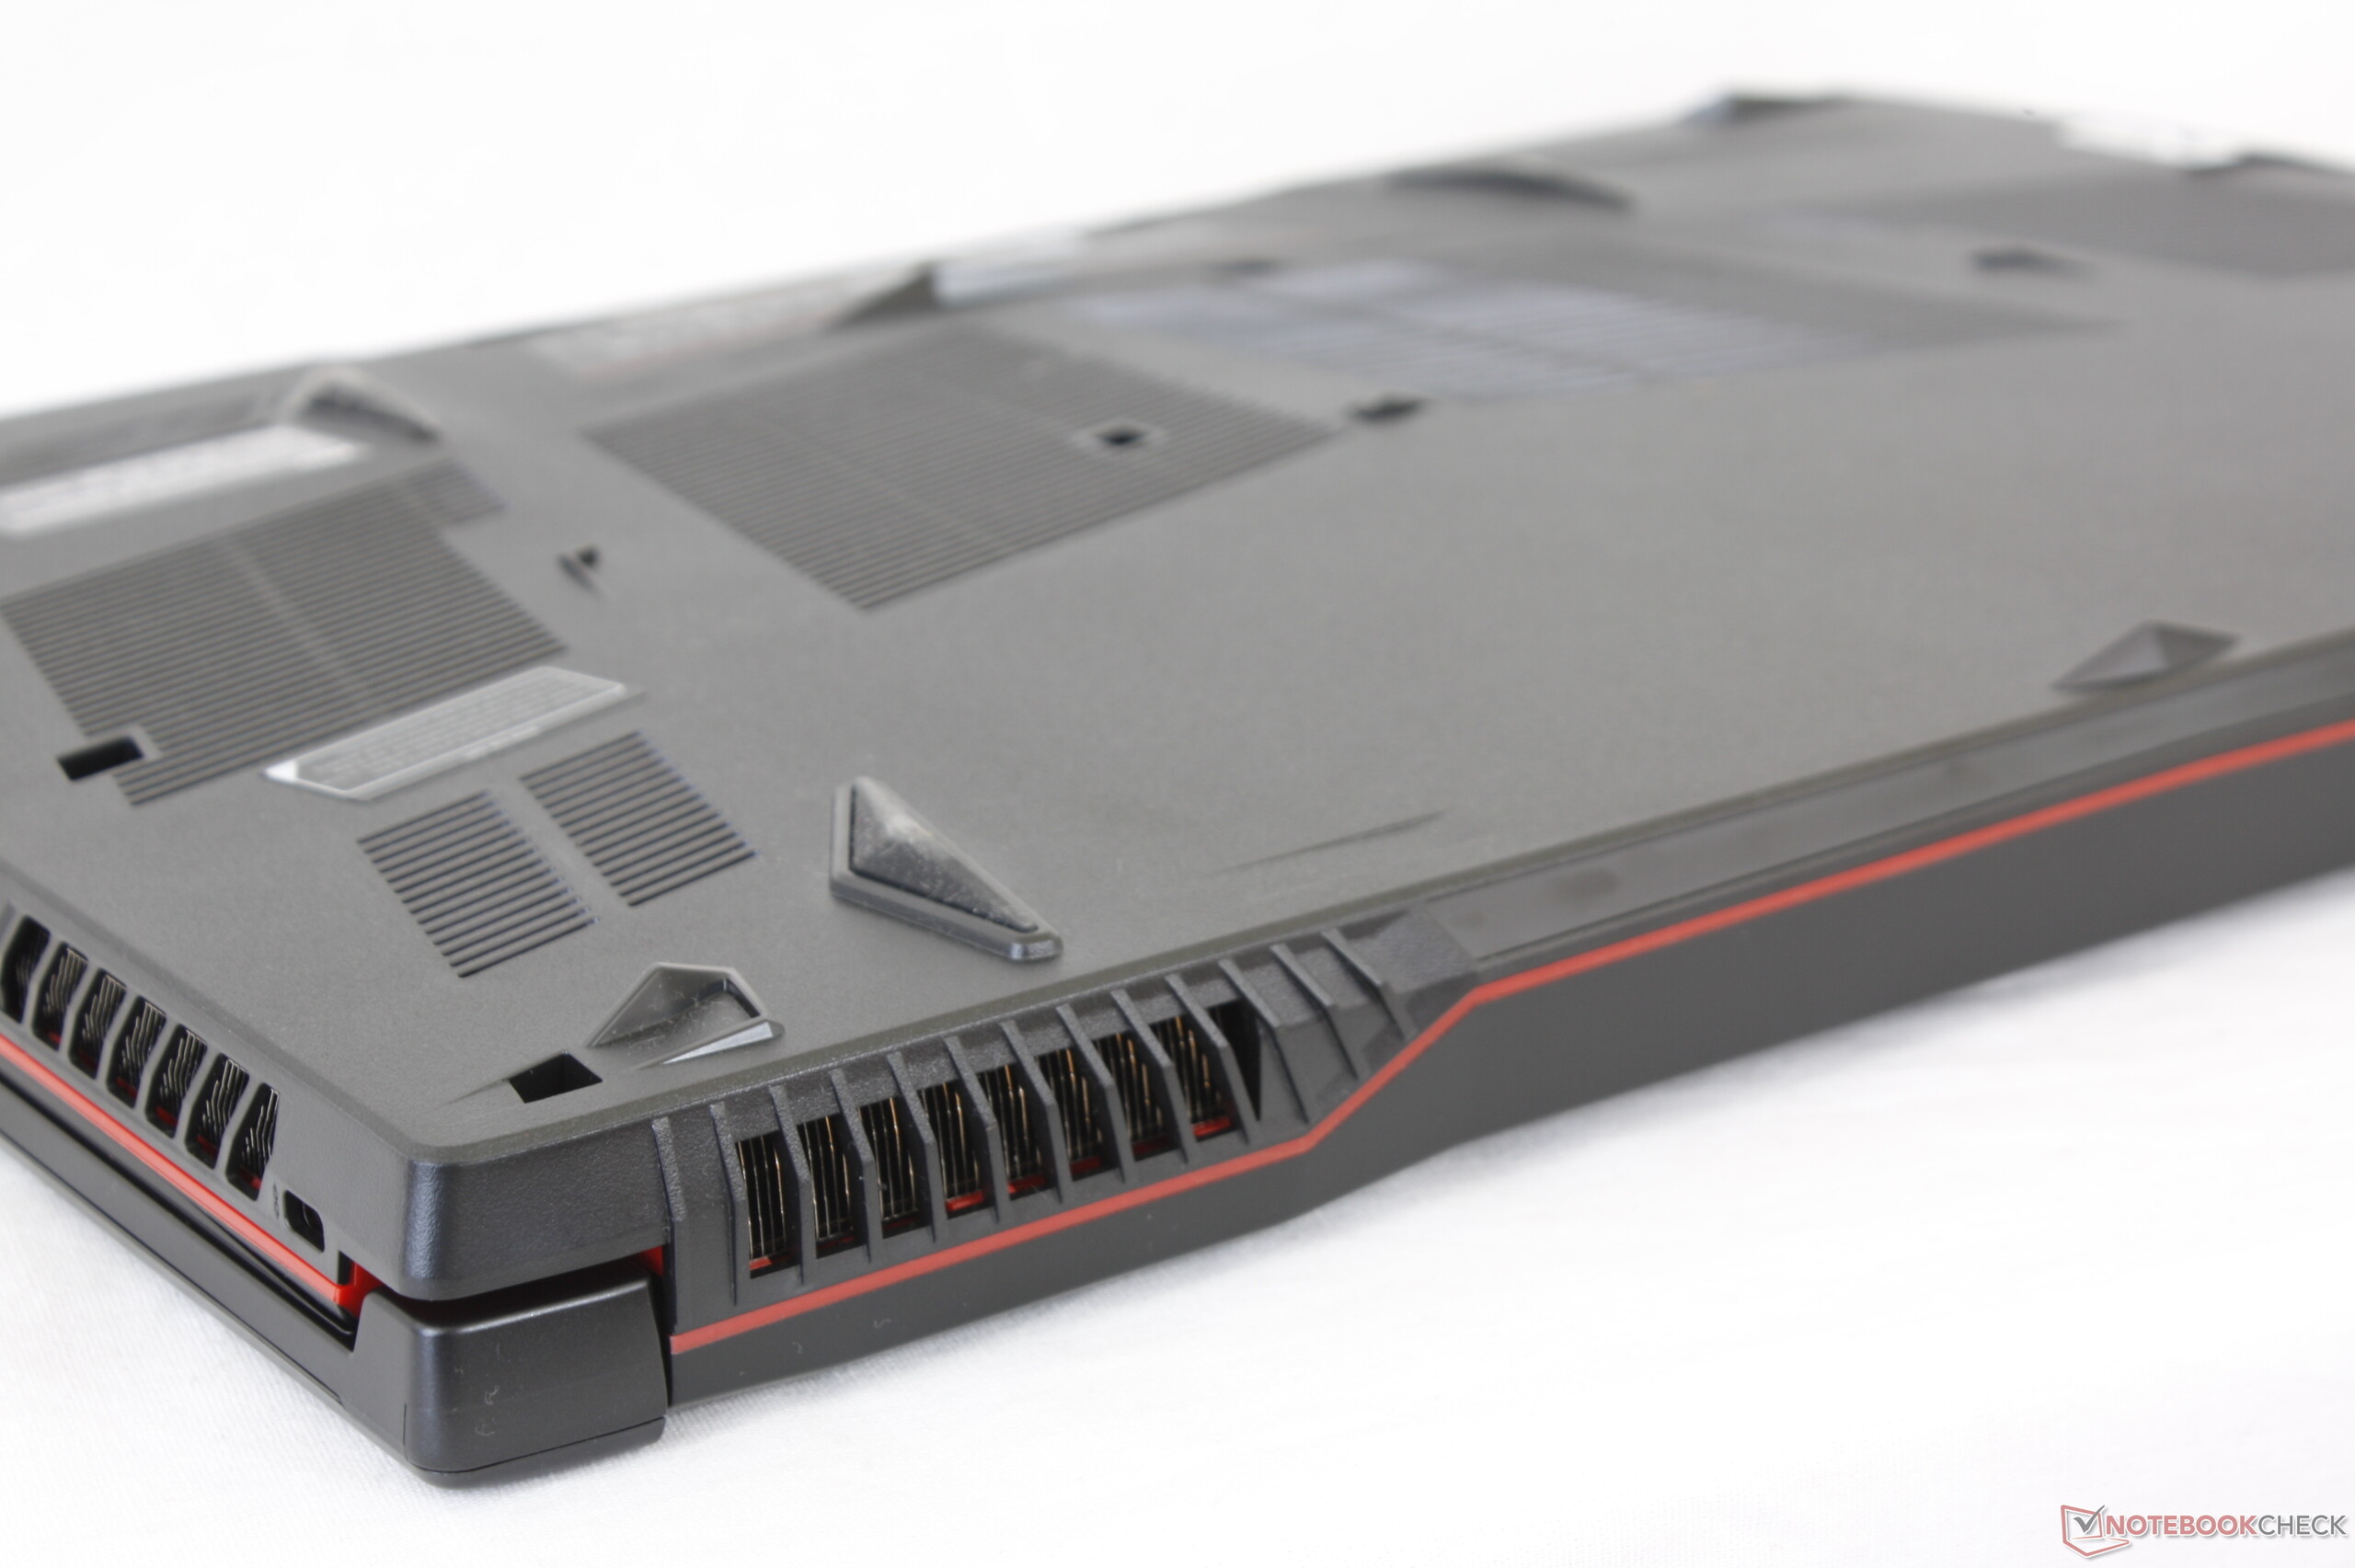
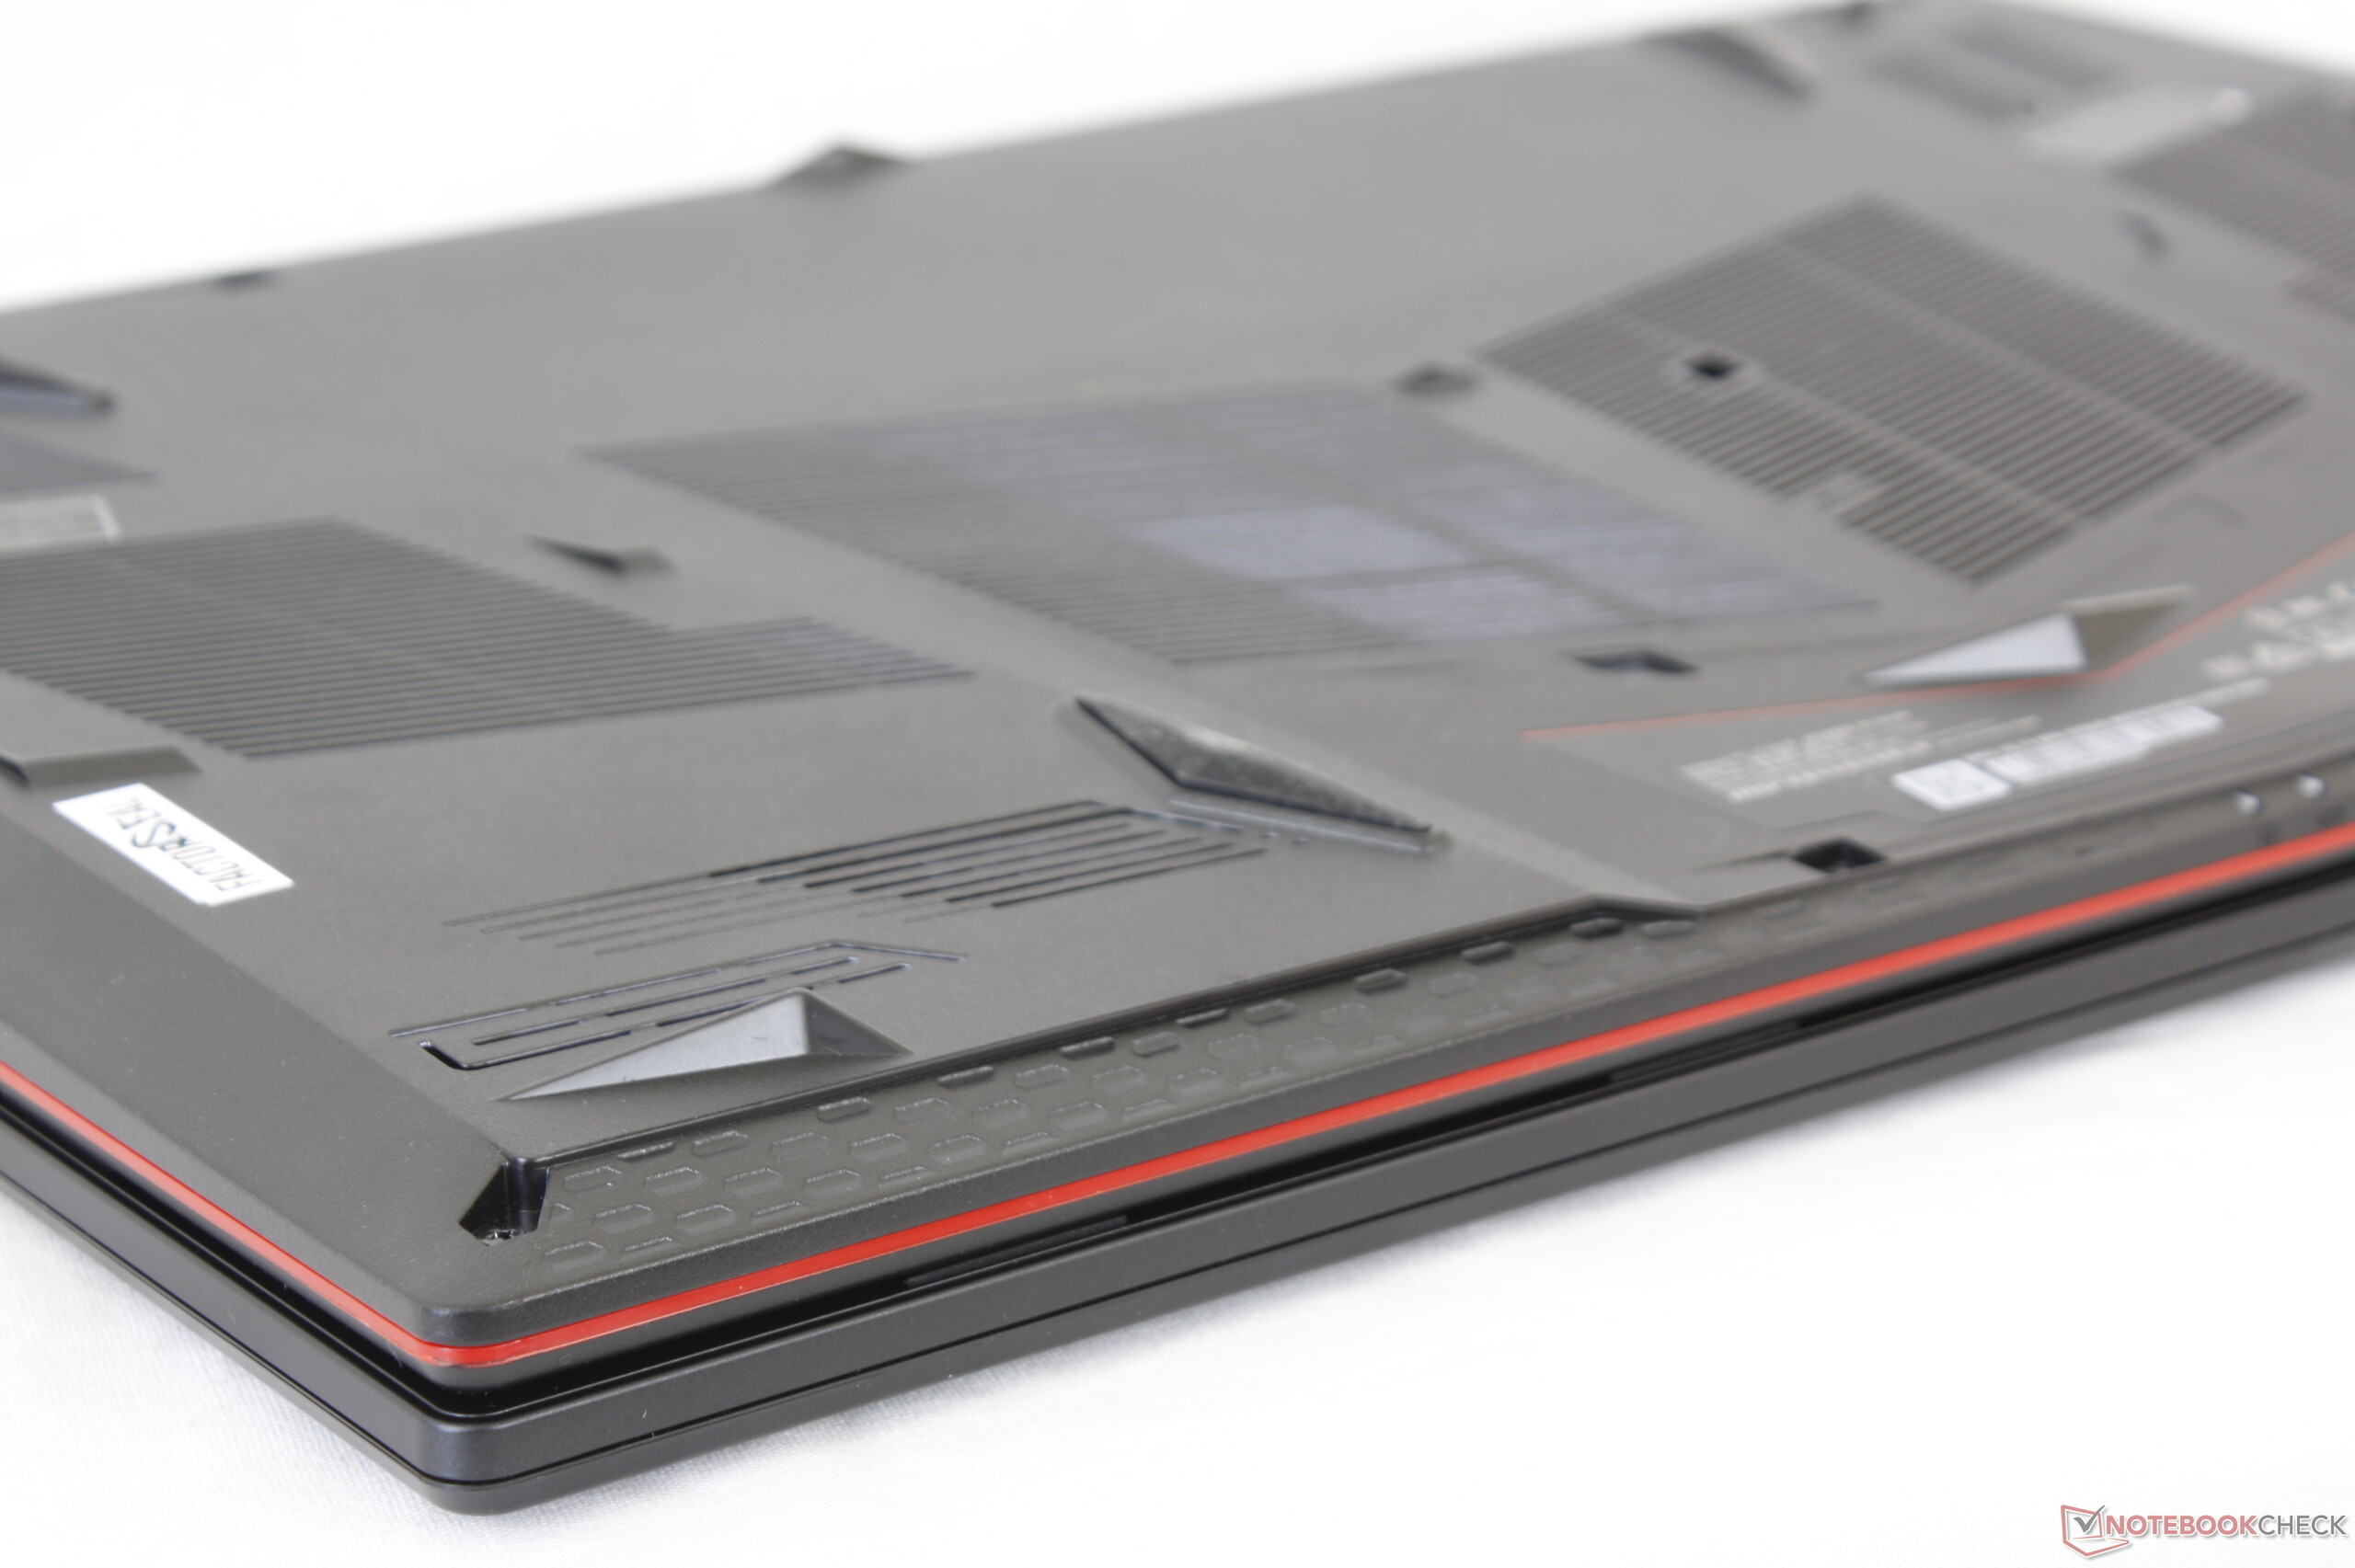
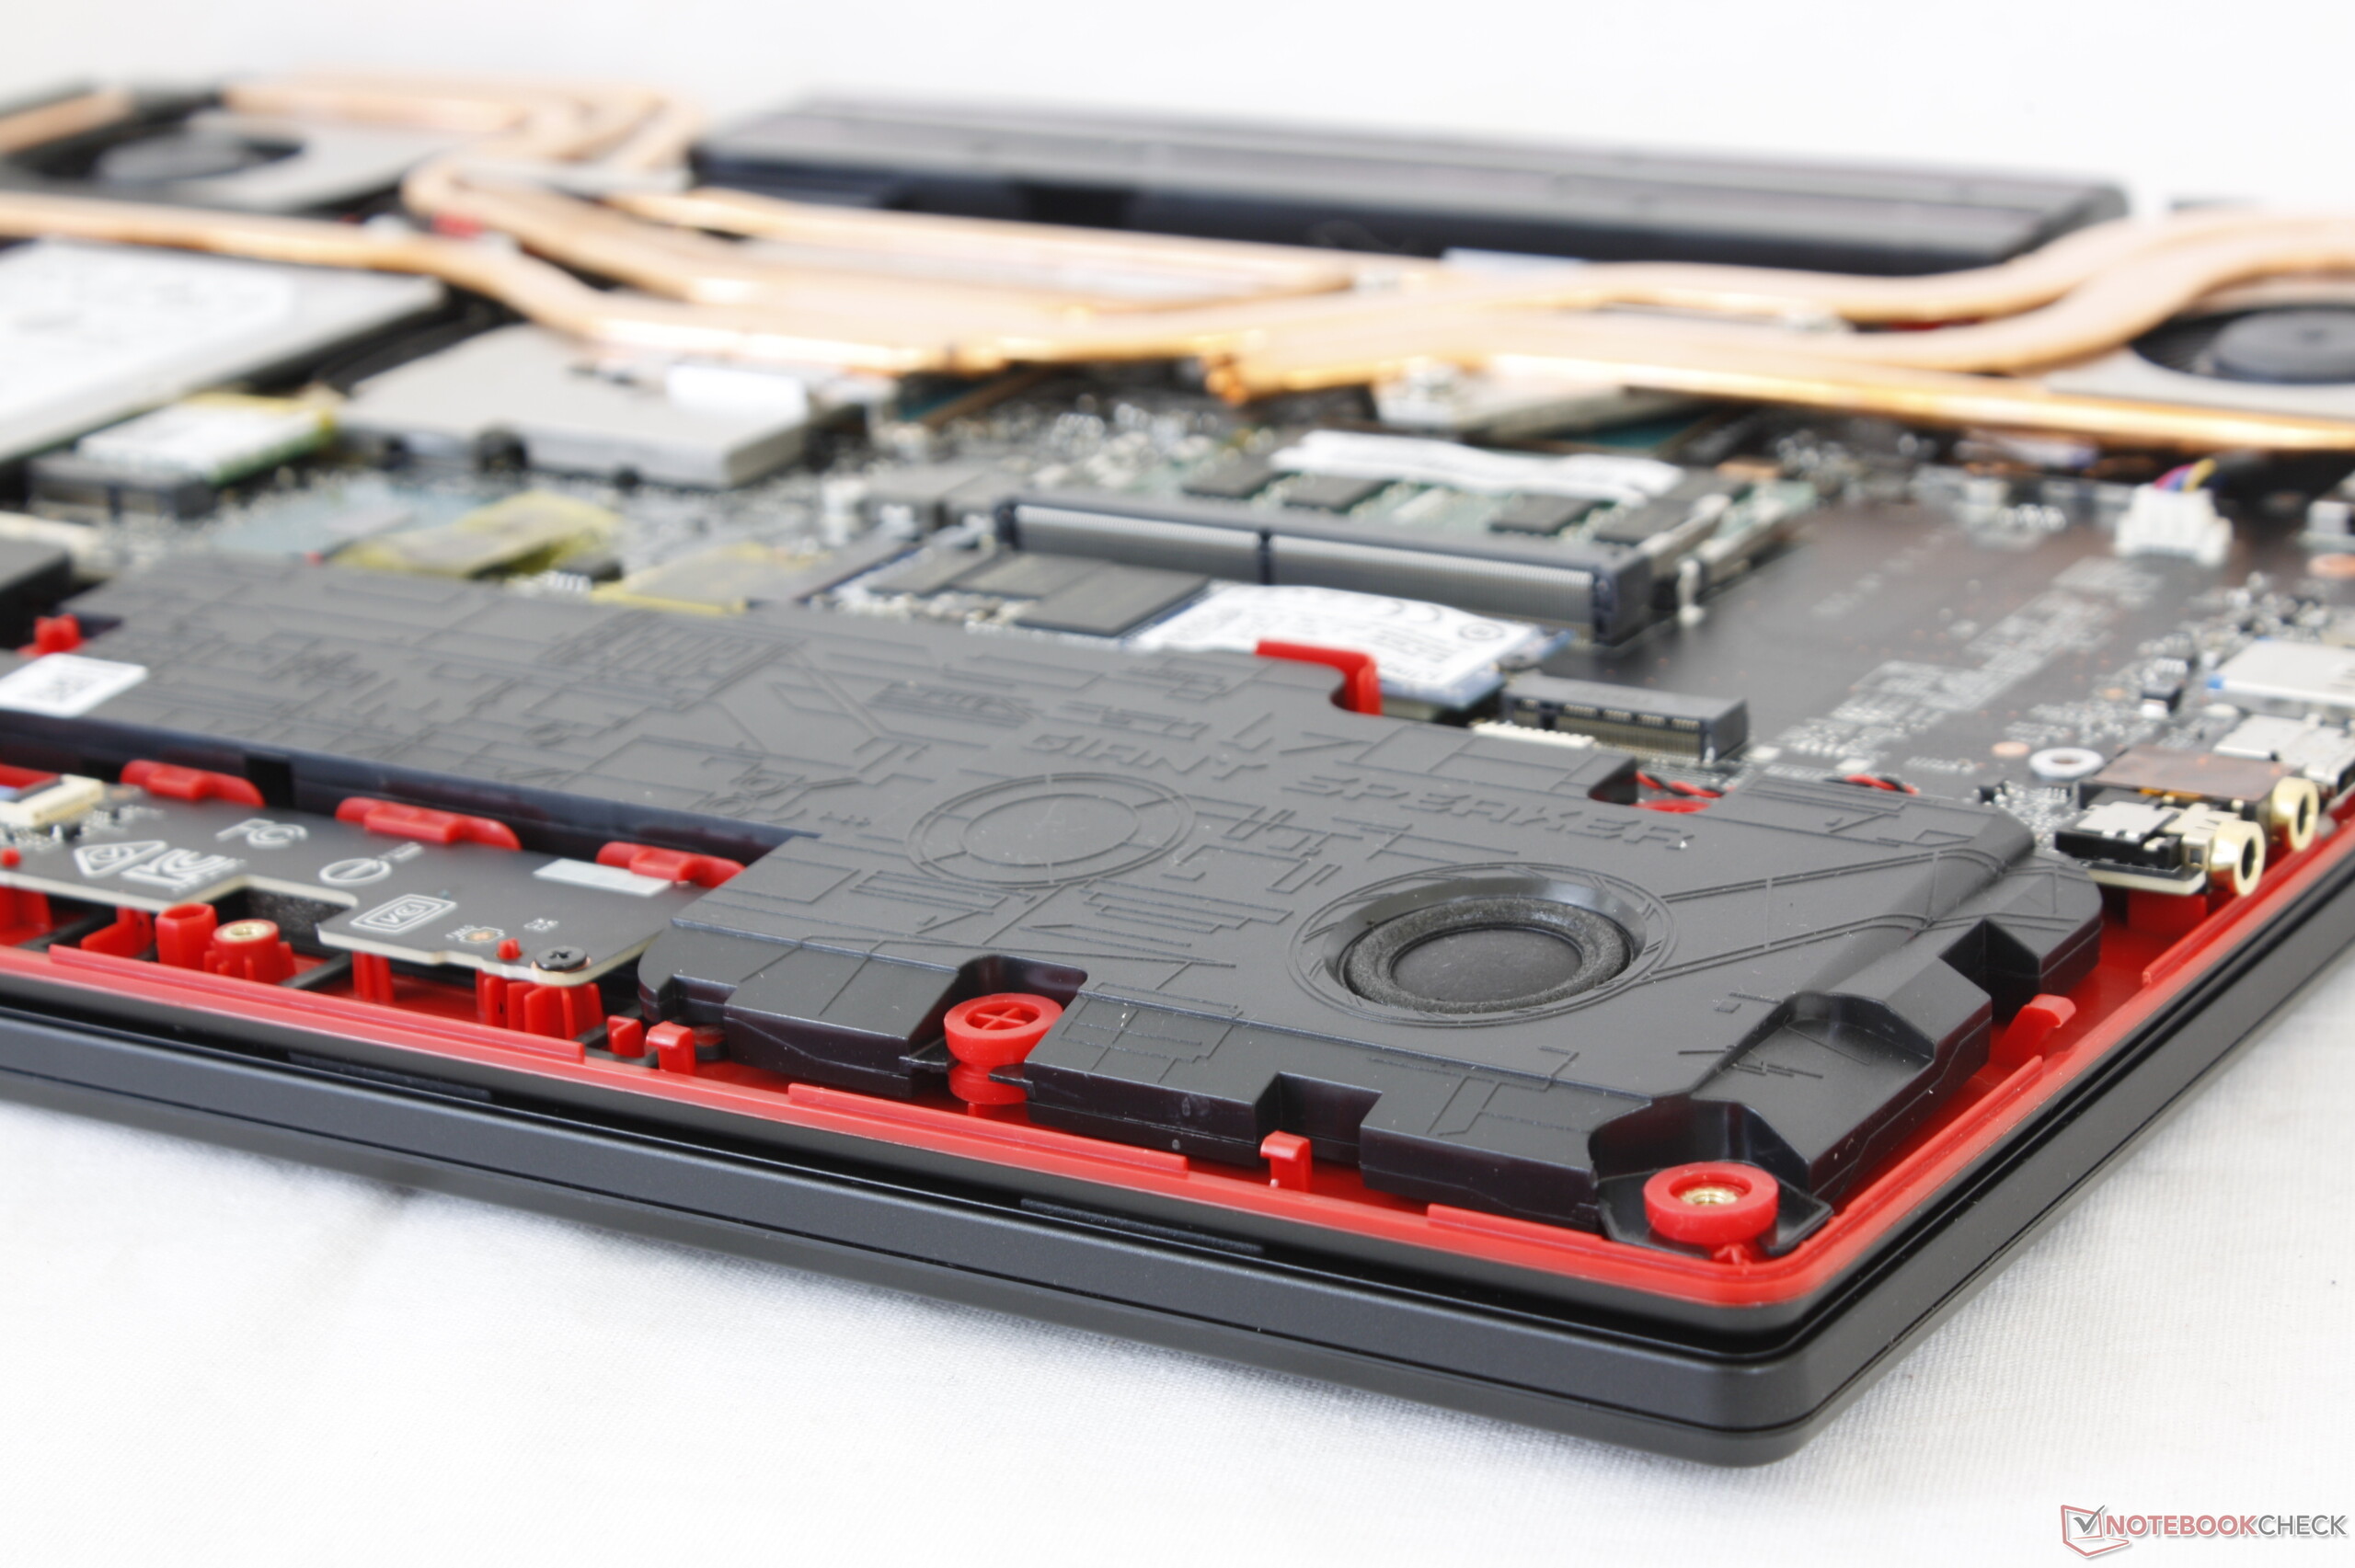
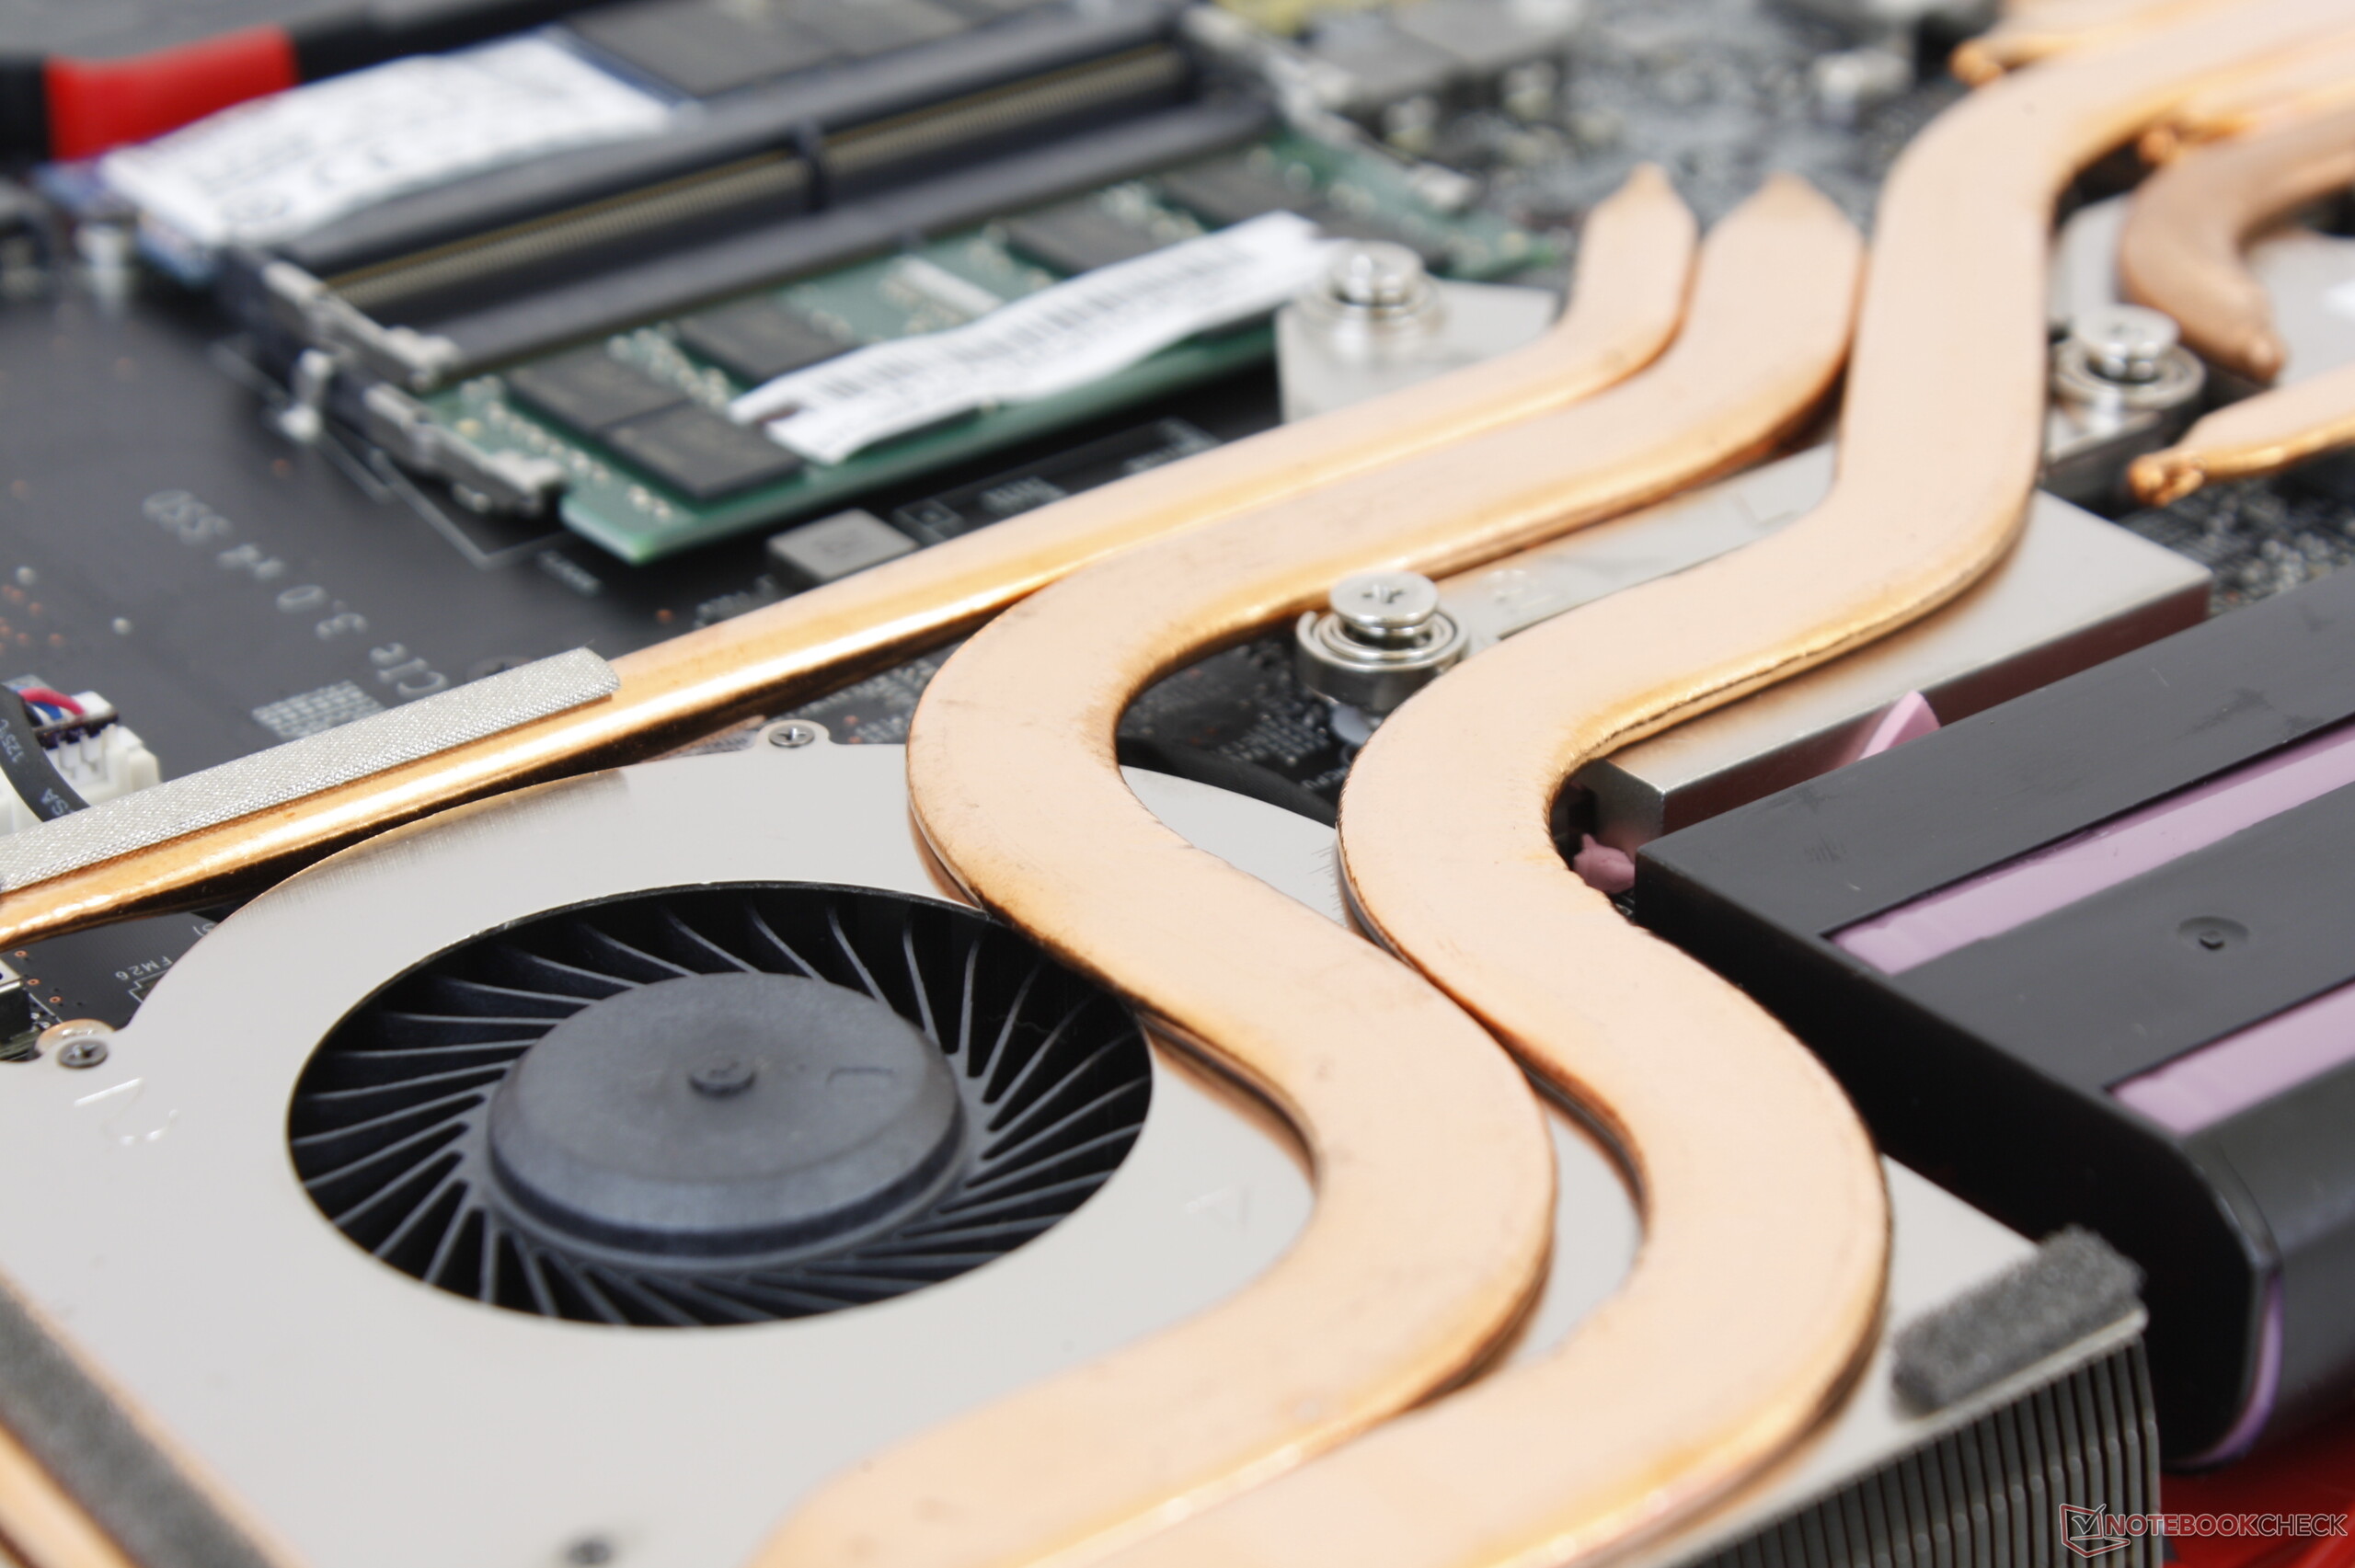
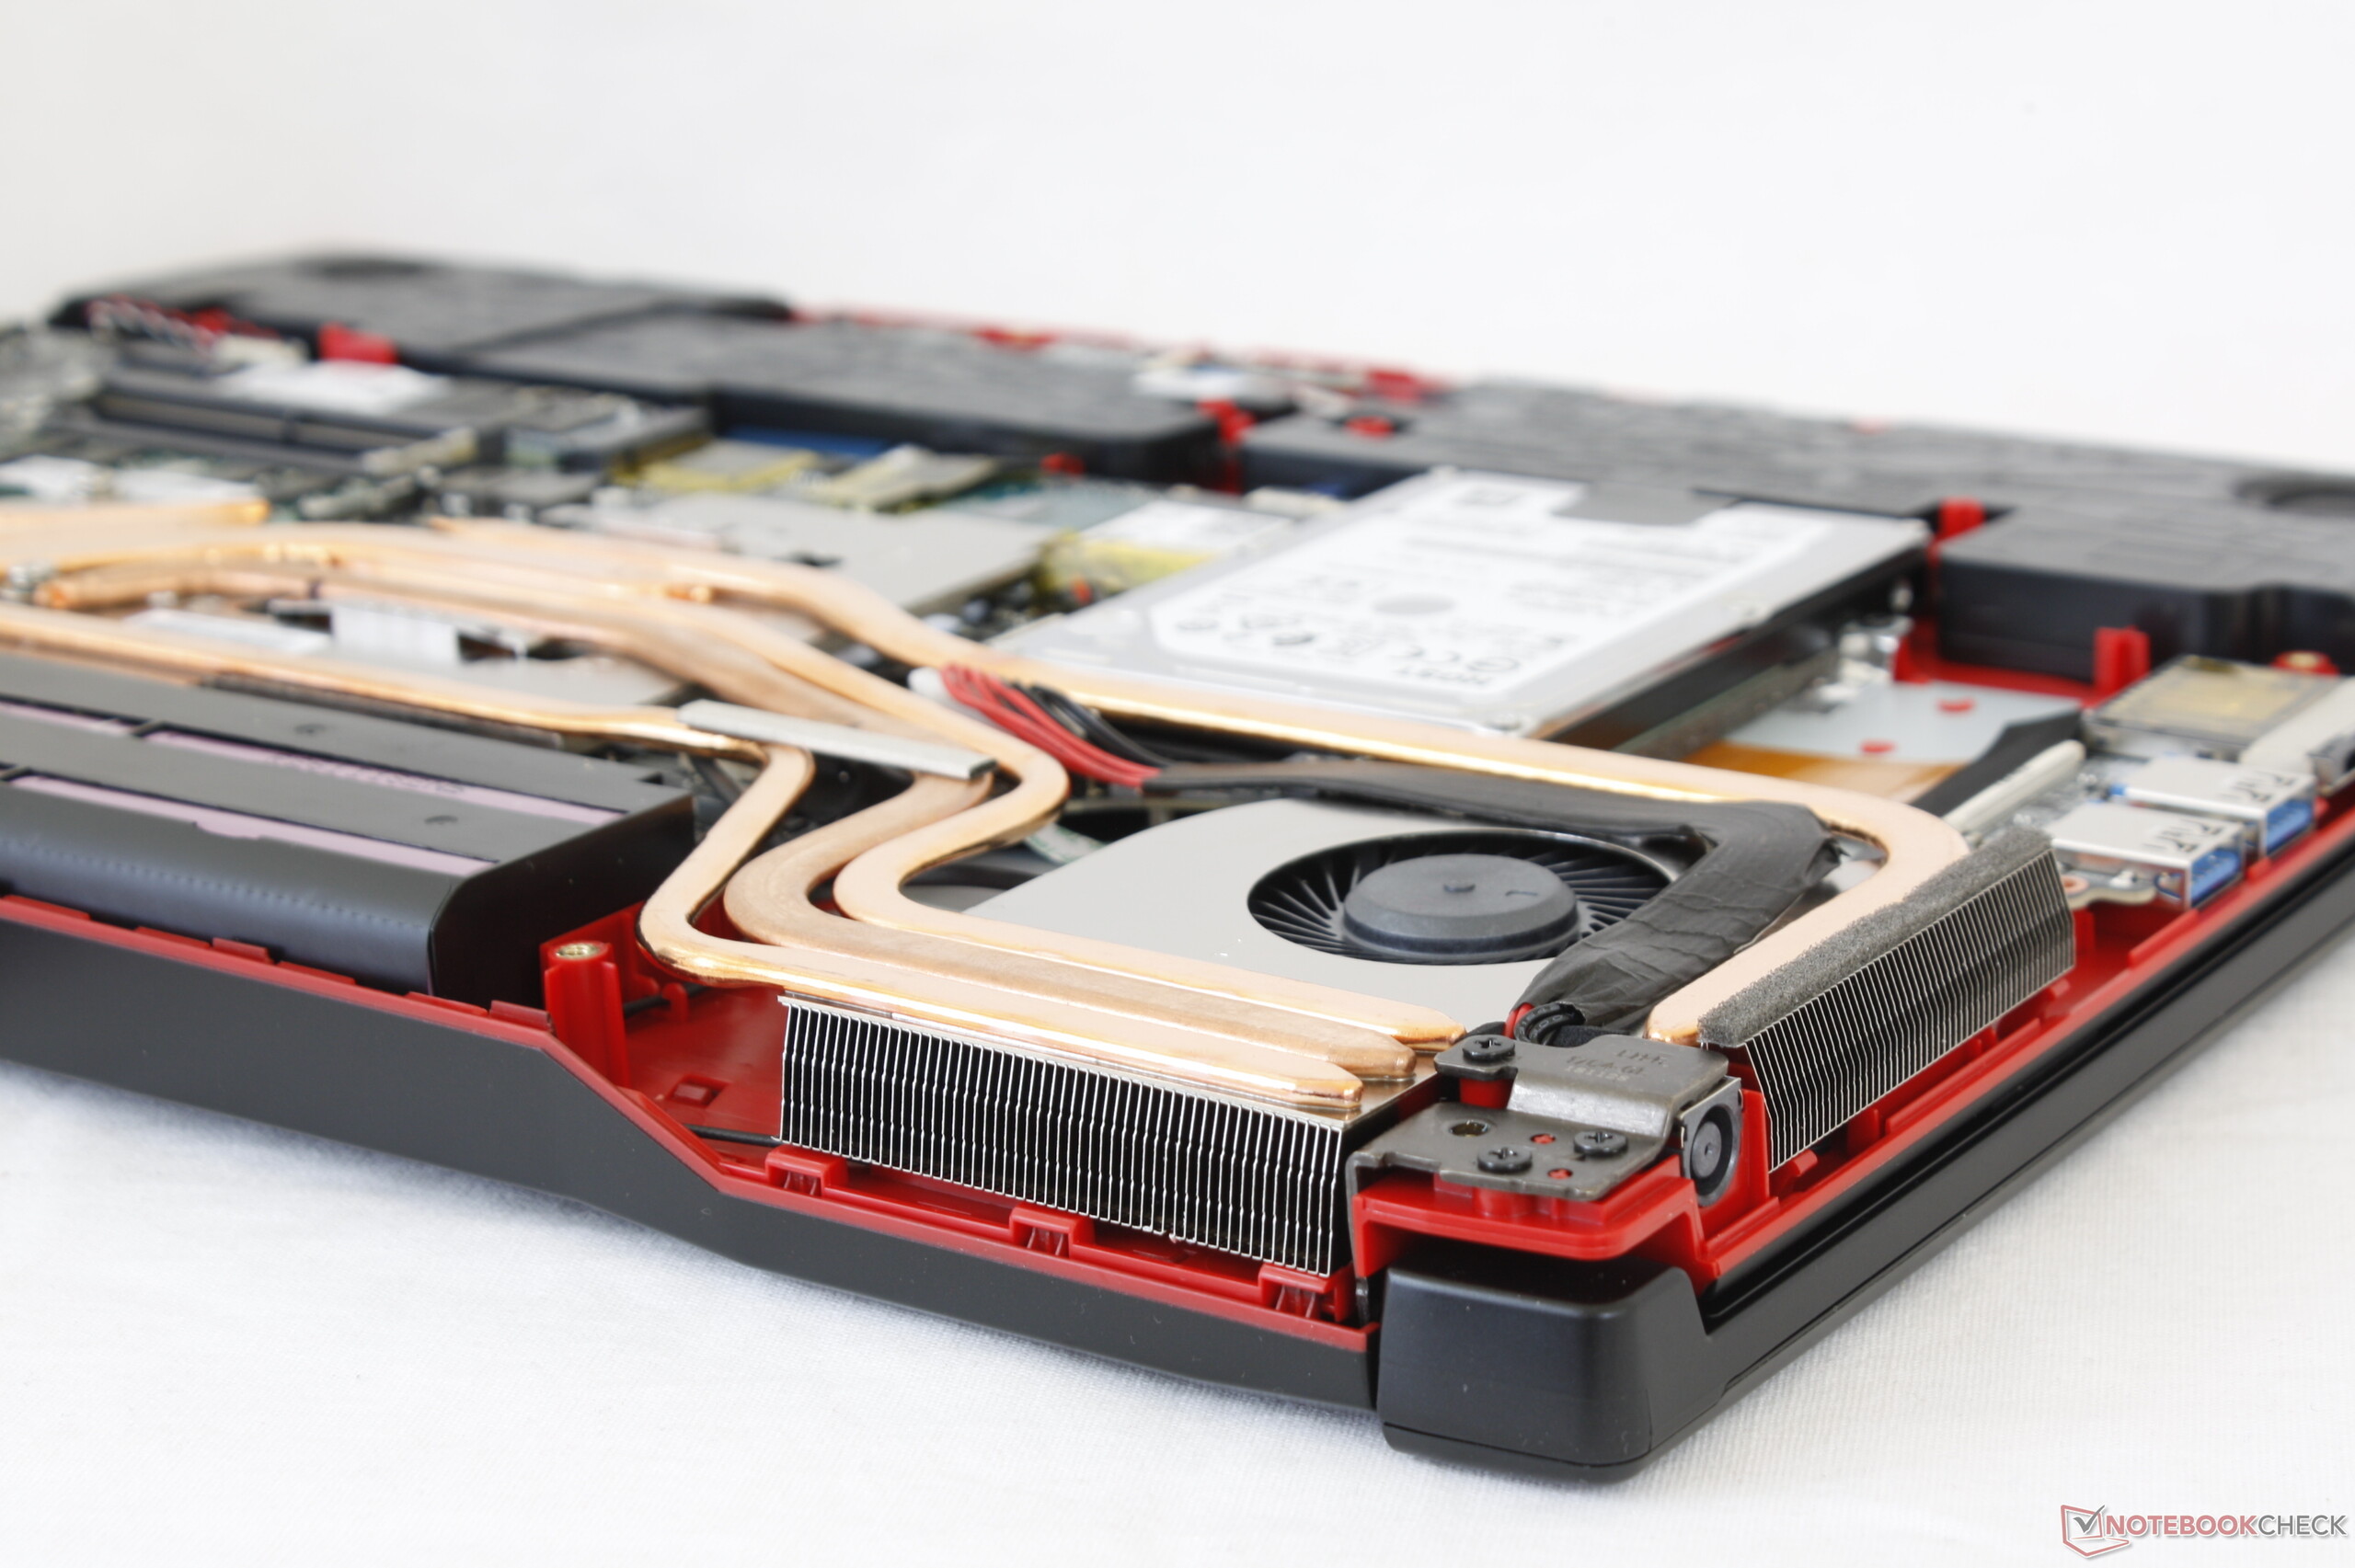
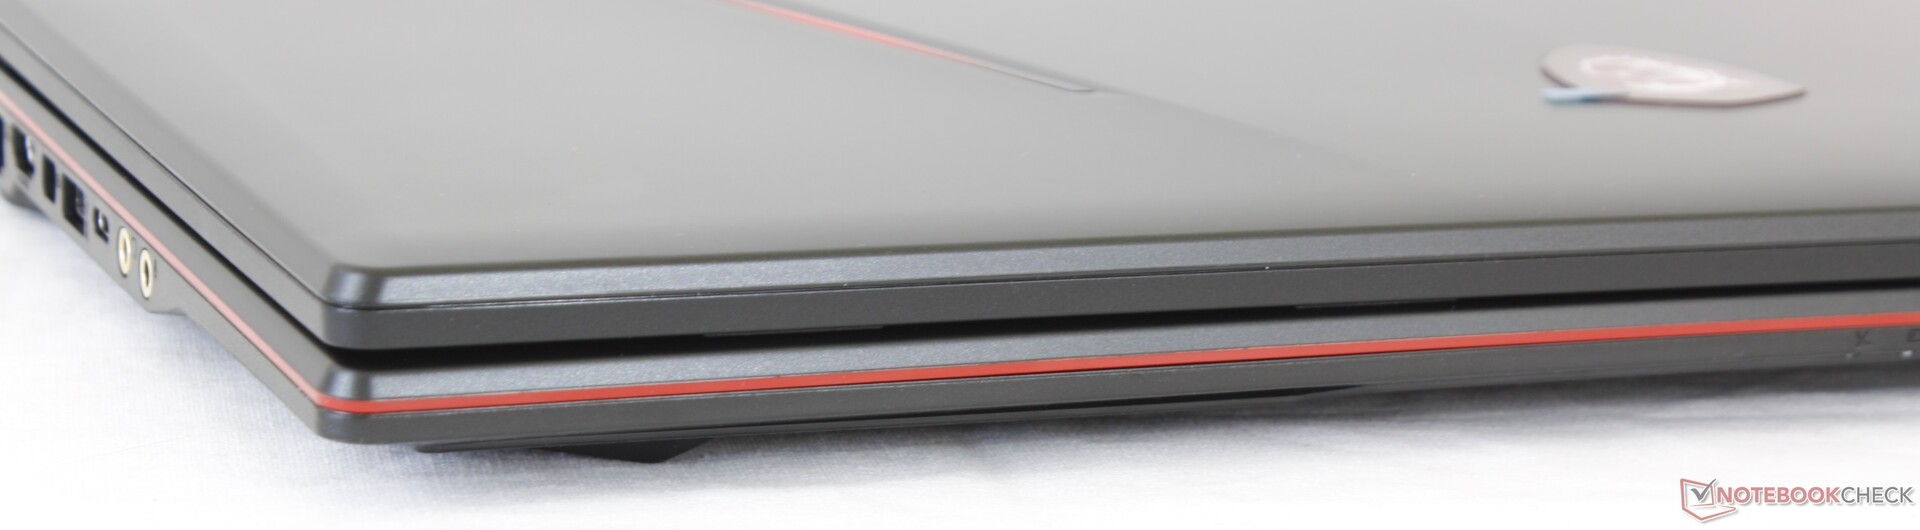
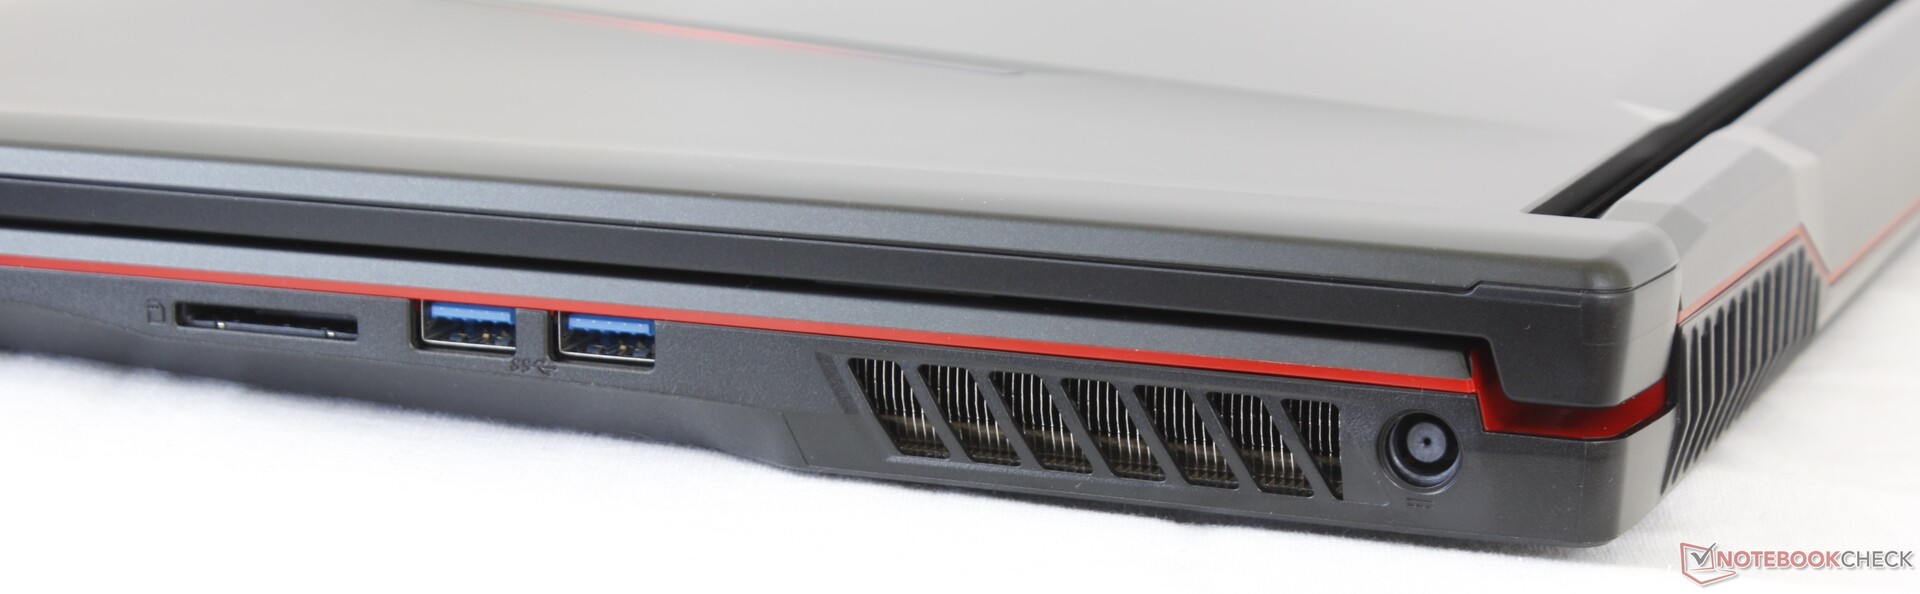
Quanto ao próprio MSI GL73, os recursos de destaque incluem seus compartimentos de armazenamento interno triplos, alto-falantes muito potentes e painel de alta qualidade de 120 Hz, que são relativamente incomuns em portáteis de jogos econômicos. Tenha em mente que seus ventiladores podem ser bastante barulhentos durante os jogos e que sua duração de bateria é de apenas duas horas, na melhor das hipóteses. O resto do portátil é padrão e orientado para o orçamento em vista de suas superfícies plásticas e dobradiças pequenas. Recomendamos uma calibração do usuário final para obter uma tela com maior precisão de cores também.
As principais características que nos impedem de declarar o MSI GL73 melhor que o concorrente Asus TUF FX705 são seus marcos grossos e maior tamanho. As temperaturas do núcleo são mais baixas do que as do Asus e há mais opções de armazenamento, mas o valor dessas trocas dependerá do usuário.
Se a GeForce RTX móvel não for uma opção indispensável, os sistemas com a GTX 1070 de última geração serão boas alternativas, especialmente agora que os preços de portáteis de jogos GTXestiveram caindo.
O MSI GL73 tem tudo o que você precisa para uma máquina de jogos 1080p, desde suas amplas opções de armazenamento até a sua tela rápida de 5 ms/120 Hz e gráficos Nvidia Turing de próxima geração. Se você vai viajar com frequência, no entanto, pode valer a pena considerar o mais portátil Asus TUF FX705.
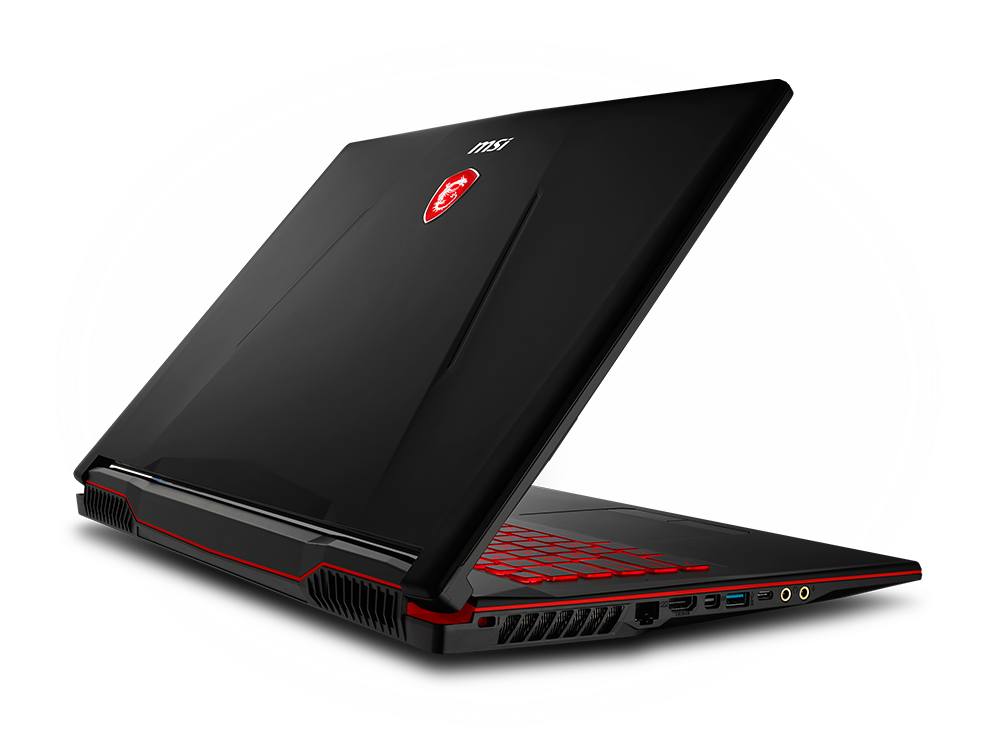
MSI GL73 8SE-010US
- 02/12/2019 v6 (old)
Allen Ngo
Price comparison
