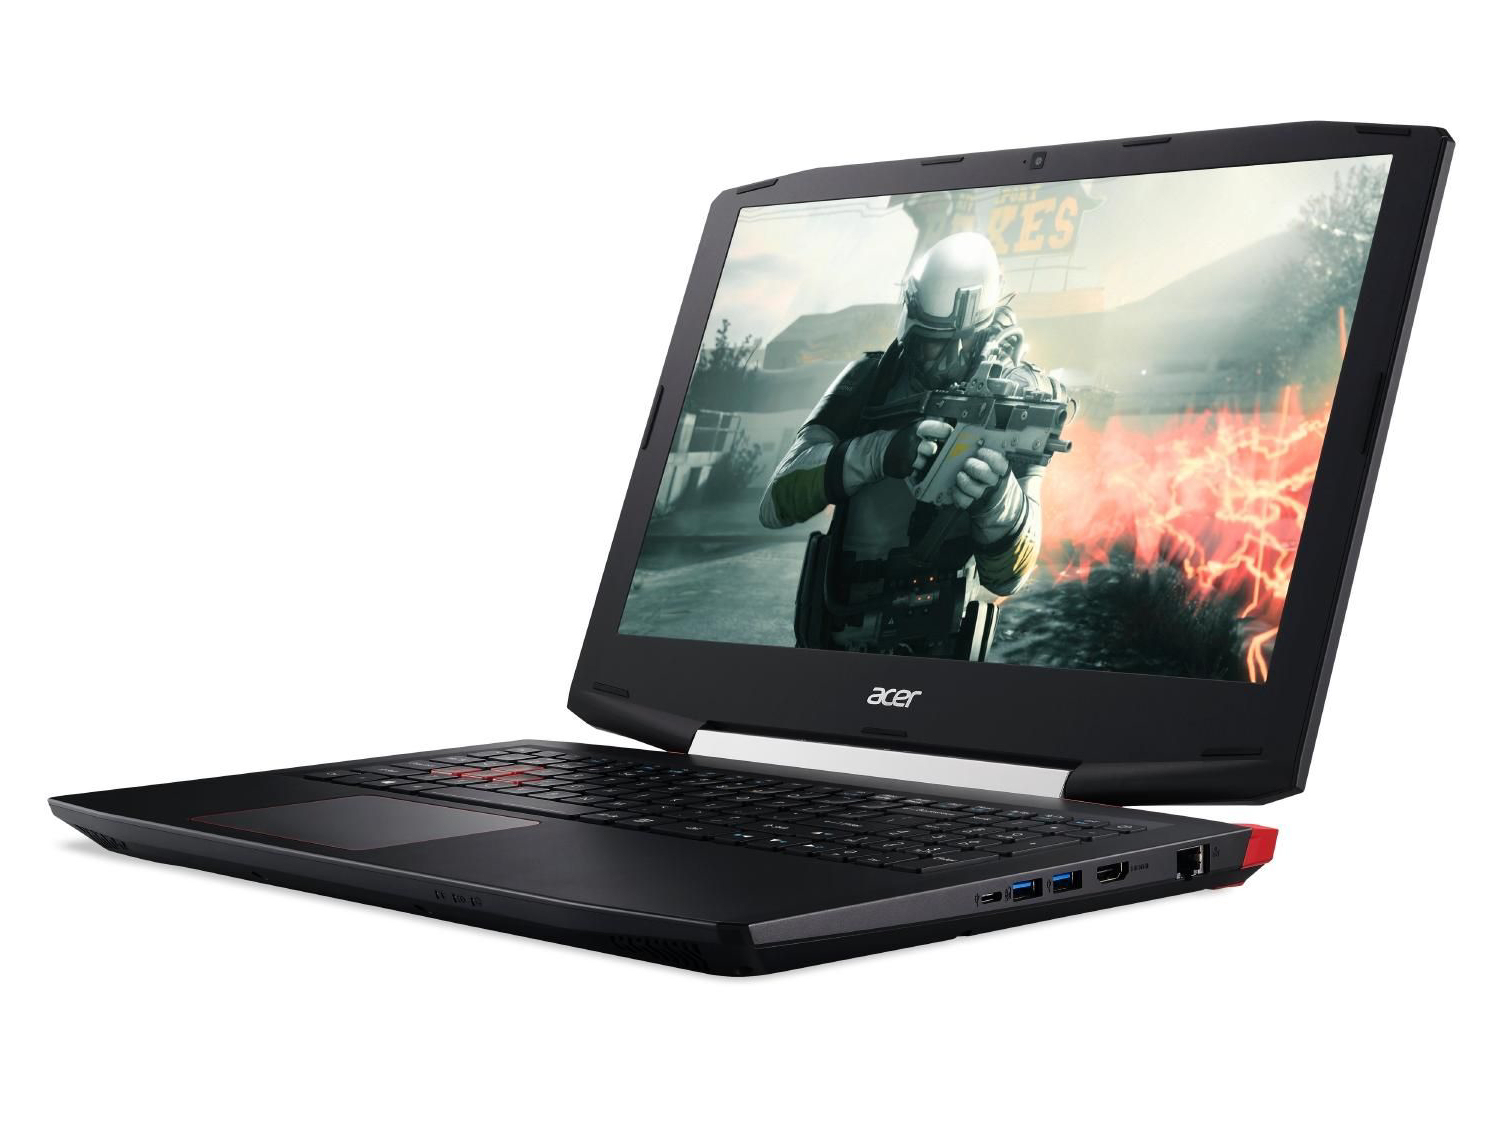
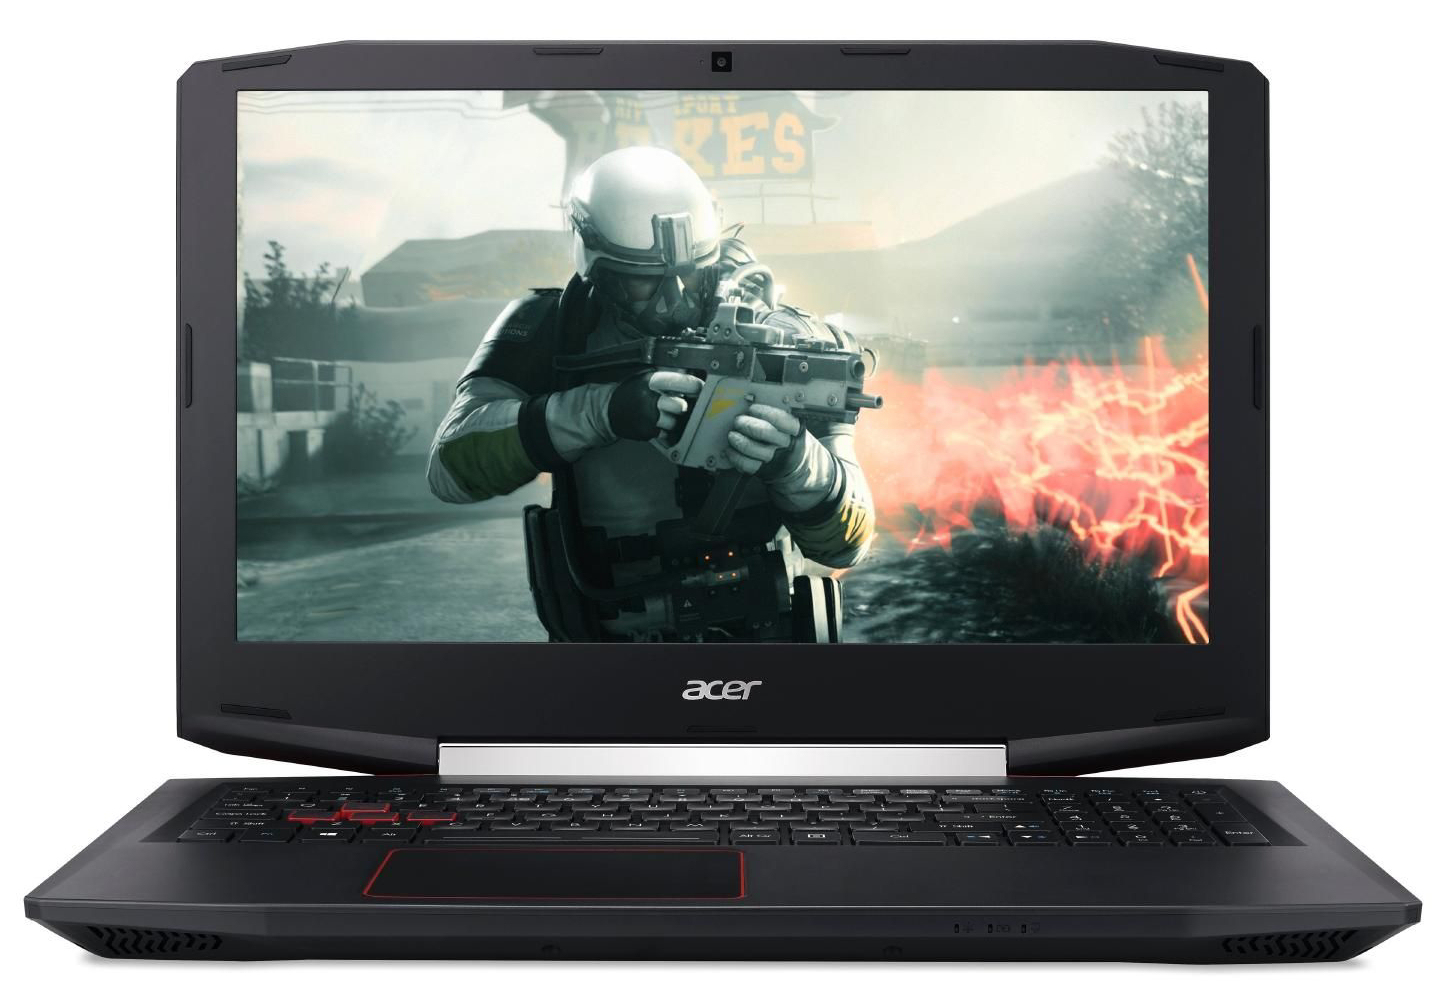
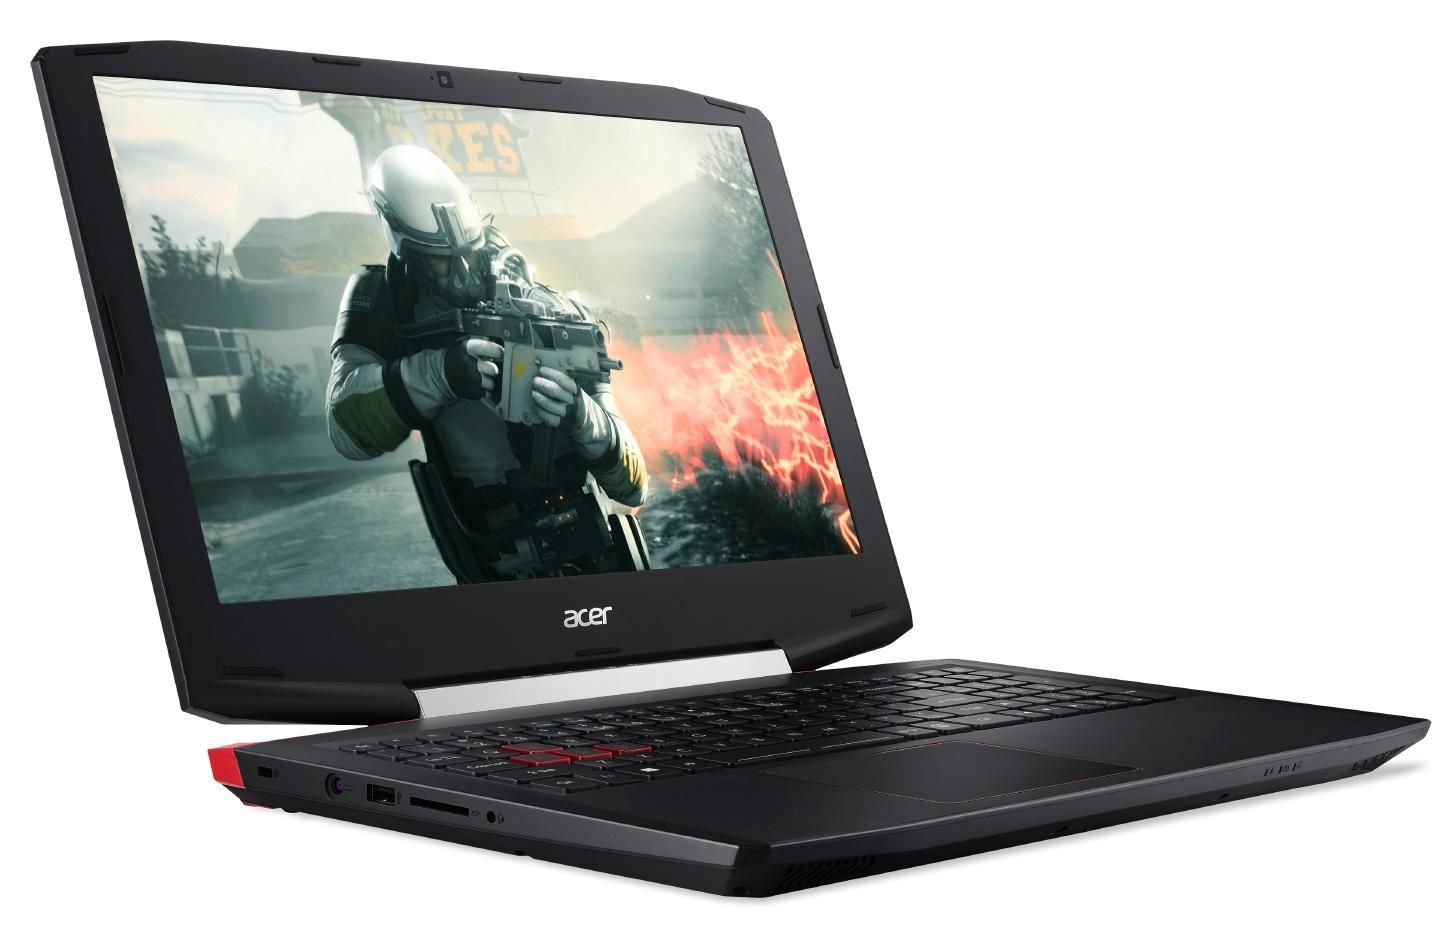
Breve Análise do Portátil Acer Aspire VX 15 VX5-591G (7300HQ, GTX 1050, Full HD)
| SD Card Reader | |
| average JPG Copy Test (av. of 3 runs) | |
| Asus FX553VD-DM249T | |
| HP Omen 15-ax007ng | |
| HP Pavilion 15t-X7P42AV | |
| Acer Aspire VX15 VX5-591G-589S | |
| Acer Aspire VX5-591G-75C4 VX15 | |
| Dell Inspiron 15 7000 7567 | |
| maximum AS SSD Seq Read Test (1GB) | |
| HP Pavilion 15t-X7P42AV | |
| Asus FX553VD-DM249T | |
| HP Omen 15-ax007ng | |
| Acer Aspire VX5-591G-75C4 VX15 | |
| Dell Inspiron 15 7000 7567 | |
| Acer Aspire VX15 VX5-591G-589S | |
| Networking | |
| iperf3 transmit AX12 | |
| Asus FX553VD-DM249T | |
| Acer Aspire VX5-591G-75C4 VX15 | |
| Acer Aspire VX15 VX5-591G-589S | |
| HP Pavilion 15t-X7P42AV | |
| Dell Inspiron 15 7000 7567 (jseb) | |
| iperf3 receive AX12 | |
| Acer Aspire VX15 VX5-591G-589S | |
| HP Pavilion 15t-X7P42AV | |
| Acer Aspire VX5-591G-75C4 VX15 | |
| Asus FX553VD-DM249T | |
| Dell Inspiron 15 7000 7567 (jseb) | |
| |||||||||||||||||||||||||
iluminação: 91 %
iluminação com acumulador: 281 cd/m²
Contraste: 1065:1 (Preto: 0.26 cd/m²)
ΔE ColorChecker Calman: 5.05 | ∀{0.5-29.43 Ø4.71}
ΔE Greyscale Calman: 2.97 | ∀{0.09-98 Ø4.96}
59% sRGB (Argyll 1.6.3 3D)
38% AdobeRGB 1998 (Argyll 1.6.3 3D)
41.9% AdobeRGB 1998 (Argyll 3D)
59.4% sRGB (Argyll 3D)
40.56% Display P3 (Argyll 3D)
Gamma: 2.39
CCT: 6466 K
| Acer Aspire VX15 VX5-591G-589S IPS, 1920x1080, 15.6" | Acer Aspire VX5-591G-75C4 VX15 IPS, 1920x1080, 15.6" | Asus FX553VD-DM249T TN, 1920x1080, 15.6" | Dell Inspiron 15 7000 7567 TN, 1920x1080, 15.6" | HP Omen 15-ax007ng IPS, 1920x1080, 15.6" | HP Pavilion 15t-X7P42AV IPS, 1920x1080, 15.6" | |
|---|---|---|---|---|---|---|
| Display | -3% | -5% | -9% | 24% | -6% | |
| Display P3 Coverage (%) | 40.56 | 38.88 -4% | 37.98 -6% | 36.42 -10% | 59.9 48% 40.34 -1% | 38.03 -6% |
| sRGB Coverage (%) | 59.4 | 58.2 -2% | 57.1 -4% | 54.9 -8% | 85.9 45% 60.3 2% | 56.5 -5% |
| AdobeRGB 1998 Coverage (%) | 41.9 | 40.2 -4% | 39.24 -6% | 37.62 -10% | 61.6 47% 41.73 0% | 39.29 -6% |
| Response Times | 42% | 38% | 8% | -6% | 12% | |
| Response Time Grey 50% / Grey 80% * (ms) | 46 ? | 22 ? 52% | 43 ? 7% | 36 ? 22% | 55 ? -20% | 44.4 ? 3% |
| Response Time Black / White * (ms) | 34 ? | 23 ? 32% | 11 ? 68% | 36 ? -6% | 31 ? 9% | 27.2 ? 20% |
| PWM Frequency (Hz) | 20000 ? | |||||
| Screen | -11% | -12% | -80% | -25% | -41% | |
| Brightness middle (cd/m²) | 277 | 281 1% | 225 -19% | 246 -11% | 214 -23% | 209.7 -24% |
| Brightness (cd/m²) | 268 | 257 -4% | 215 -20% | 235 -12% | 203 -24% | 193 -28% |
| Brightness Distribution (%) | 91 | 85 -7% | 91 0% | 75 -18% | 79 -13% | 75 -18% |
| Black Level * (cd/m²) | 0.26 | 0.32 -23% | 0.46 -77% | 0.55 -112% | 0.28 -8% | 0.19 27% |
| Contrast (:1) | 1065 | 878 -18% | 489 -54% | 447 -58% | 764 -28% | 1104 4% |
| Colorchecker dE 2000 * | 5.05 | 5.16 -2% | 3.94 22% | 10.97 -117% | 6.04 -20% | 7.8 -54% |
| Colorchecker dE 2000 max. * | 8.93 | 9.09 -2% | 6.83 24% | 12 -34% | 24.1 -170% | |
| Greyscale dE 2000 * | 2.97 | 4.57 -54% | 2.68 10% | 14.25 -380% | 5.91 -99% | 7.3 -146% |
| Gamma | 2.39 92% | 2.59 85% | 2.35 94% | 1.83 120% | 2.44 90% | 2.39 92% |
| CCT | 6466 101% | 6931 94% | 6709 97% | 11200 58% | 7362 88% | 5771 113% |
| Color Space (Percent of AdobeRGB 1998) (%) | 38 | 37 -3% | 36 -5% | 35 -8% | 38 0% | 39.3 3% |
| Color Space (Percent of sRGB) (%) | 59 | 58 -2% | 57 -3% | 55 -7% | 60 2% | 56.5 -4% |
| Média Total (Programa/Configurações) | 9% /
-3% | 7% /
-4% | -27% /
-53% | -2% /
-7% | -12% /
-27% |
* ... menor é melhor
Cintilação da tela / PWM (modulação por largura de pulso)
| Tela tremeluzindo/PWM detectado | 20000 Hz | ≤ 90 % configuração de brilho | 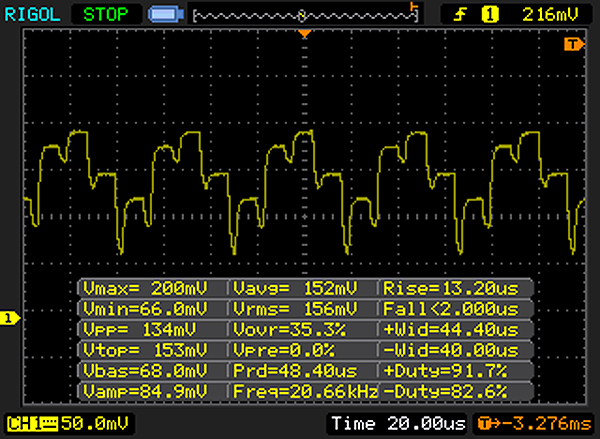 |
A luz de fundo da tela pisca em 20000 Hz (pior caso, por exemplo, utilizando PWM) Cintilação detectada em uma configuração de brilho de 90 % e abaixo. Não deve haver cintilação ou PWM acima desta configuração de brilho. A frequência de 20000 Hz é bastante alta, então a maioria dos usuários sensíveis ao PWM não deve notar nenhuma oscilação. [pwm_comparison] Em comparação: 52 % de todos os dispositivos testados não usam PWM para escurecer a tela. Se PWM foi detectado, uma média de 7757 (mínimo: 5 - máximo: 343500) Hz foi medida. | |||
Exibir tempos de resposta
| ↔ Tempo de resposta preto para branco | ||
|---|---|---|
| 34 ms ... ascensão ↗ e queda ↘ combinadas | ↗ 20 ms ascensão | 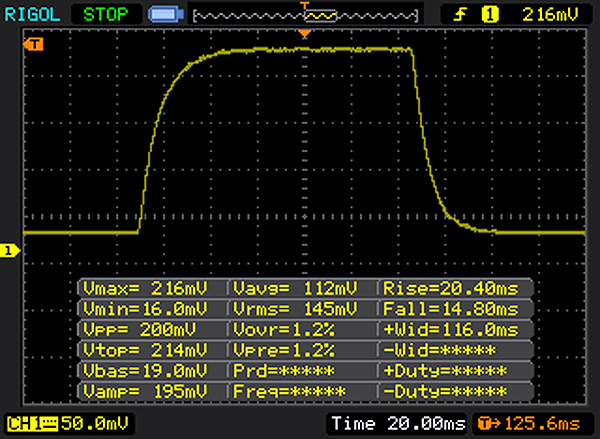 |
| ↘ 14 ms queda | ||
| A tela mostra taxas de resposta lentas em nossos testes e será insatisfatória para os jogadores. Em comparação, todos os dispositivos testados variam de 0.1 (mínimo) a 240 (máximo) ms. » 91 % de todos os dispositivos são melhores. Isso significa que o tempo de resposta medido é pior que a média de todos os dispositivos testados (19.8 ms). | ||
| ↔ Tempo de resposta 50% cinza a 80% cinza | ||
| 46 ms ... ascensão ↗ e queda ↘ combinadas | ↗ 25 ms ascensão |  |
| ↘ 21 ms queda | ||
| A tela mostra taxas de resposta lentas em nossos testes e será insatisfatória para os jogadores. Em comparação, todos os dispositivos testados variam de 0.165 (mínimo) a 636 (máximo) ms. » 79 % de todos os dispositivos são melhores. Isso significa que o tempo de resposta medido é pior que a média de todos os dispositivos testados (31 ms). | ||
| Cinebench R10 | |
| Rendering Multiple CPUs 32Bit | |
| Asus FX553VD-DM249T | |
| HP Pavilion 15t-X7P42AV | |
| Acer Aspire VX15 VX5-591G-589S | |
| Rendering Single 32Bit | |
| Asus FX553VD-DM249T | |
| HP Pavilion 15t-X7P42AV | |
| Acer Aspire VX15 VX5-591G-589S | |
| Geekbench 3 | |
| 32 Bit Multi-Core Score | |
| Acer Aspire VX15 VX5-591G-589S | |
| 32 Bit Single-Core Score | |
| Acer Aspire VX15 VX5-591G-589S | |
| Geekbench 4.0 | |
| 64 Bit Multi-Core Score | |
| Acer Aspire VX15 VX5-591G-589S | |
| 64 Bit Single-Core Score | |
| Acer Aspire VX15 VX5-591G-589S | |
| Geekbench 4.4 | |
| 64 Bit Multi-Core Score | |
| Acer Aspire VX15 VX5-591G-589S | |
| 64 Bit Single-Core Score | |
| Acer Aspire VX15 VX5-591G-589S | |
| JetStream 1.1 - 1.1 Total | |
| HP Pavilion 15t-X7P42AV | |
| Dell Inspiron 15 7000 7567 | |
| Acer Aspire VX15 VX5-591G-589S | |
| PCMark 8 Home Score Accelerated v2 | 3661 pontos | |
Ajuda | ||
| PCMark 8 - Home Score Accelerated v2 | |
| HP Pavilion 15t-X7P42AV | |
| HP Omen 15-ax007ng | |
| Dell Inspiron 15 7000 7567 | |
| Asus FX553VD-DM249T | |
| Acer Aspire VX15 VX5-591G-589S | |
| Dell XPS 15 2017 9560 (7300HQ, Full-HD) | |
| Acer Aspire VX5-591G-75C4 VX15 | |

| Acer Aspire VX15 VX5-591G-589S Hynix HFS128G39TND | Acer Aspire VX5-591G-75C4 VX15 Toshiba MQ01ABD100 | Asus FX553VD-DM249T Hynix HFS128G39TND | Dell Inspiron 15 7000 7567 Intel SSDSCKKF256H6 | HP Omen 15-ax007ng Adata IM2S3138E-128GM-B | HP Pavilion 15t-X7P42AV Samsung CM871a MZNTY128HDHP | |
|---|---|---|---|---|---|---|
| CrystalDiskMark 3.0 | -84% | -7% | 42% | -0% | 35% | |
| Read Seq (MB/s) | 510 | 101.5 -80% | 504 -1% | 485.8 -5% | 475.7 -7% | 522 2% |
| Write Seq (MB/s) | 137.6 | 100.6 -27% | 136.2 -1% | 422.8 207% | 169.2 23% | 476.6 246% |
| Read 512 (MB/s) | 362.1 | 28.33 -92% | 340.9 -6% | 338.9 -6% | 327.6 -10% | 399.7 10% |
| Write 512 (MB/s) | 137.2 | 28.31 -79% | 136.9 0% | 304 122% | 169.6 24% | 185.4 35% |
| Read 4k (MB/s) | 35.18 | 0.327 -99% | 29.74 -15% | 27.11 -23% | 33.14 -6% | 33.12 -6% |
| Write 4k (MB/s) | 104.8 | 0.846 -99% | 76.8 -27% | 85.4 -19% | 81.4 -22% | 89.8 -14% |
| Read 4k QD32 (MB/s) | 375.8 | 0.718 -100% | 348.2 -7% | 279.6 -26% | 276.8 -26% | 400.9 7% |
| Write 4k QD32 (MB/s) | 138.1 | 0.893 -99% | 136.4 -1% | 255.1 85% | 168 22% | 140.2 2% |
| 3DMark 11 Performance | 7226 pontos | |
Ajuda | ||
| baixo | média | alto | ultra | |
|---|---|---|---|---|
| BioShock Infinite (2013) | 206.5 | 160 | 147.5 | 63.6 |
| Mad Max (2015) | 140.4 | 70.1 | 64.3 | |
| Rainbow Six Siege (2015) | 185.2 | 139.7 | 76.4 | 63.6 |
| Just Cause 3 (2015) | 78.6 | 67.1 | 48.3 | 32.2 |
| XCOM 2 (2016) | 78.9 | 42.6 | 28.9 | 13.8 |
| Far Cry Primal (2016) | 90 | 49 | 43 | 31 |
| Resident Evil 7 (2017) | 216.5 | 100.3 | 56.6 | 21.4 |
| For Honor (2017) | 146.8 | 60.1 | 57 | 40.6 |
| Ghost Recon Wildlands (2017) | 81.8 | 36 | 34.4 | 18.5 |
| Mass Effect Andromeda (2017) | 75.7 | 41.5 | 26.4 | 24 |
| Warhammer 40.000: Dawn of War III (2017) | 81 | 36.5 | 23.2 | 20.2 |
| Prey (2017) | 125.2 | 82.5 | 68.1 | 53 |
| BioShock Infinite - 1920x1080 Ultra Preset, DX11 (DDOF) | |
| Dell Inspiron 15 7000 7567 | |
| HP Pavilion 15t-X7P42AV | |
| Acer Aspire VX15 VX5-591G-589S | |
| Lenovo Ideapad Y700 15ISK 80NV | |
Barulho
| Ocioso |
| 30 / 30 / 31.1 dB |
| HDD |
| 31.2 dB |
| Carga |
| 31.3 / 38.9 dB |
 | ||
30 dB silencioso 40 dB(A) audível 50 dB(A) ruidosamente alto |
||
min: | ||
(-) A temperatura máxima no lado superior é 47.2 °C / 117 F, em comparação com a média de 40.4 °C / 105 F , variando de 21.2 a 68.8 °C para a classe Gaming.
(±) A parte inferior aquece até um máximo de 42.2 °C / 108 F, em comparação com a média de 43.2 °C / 110 F
(+) Em uso inativo, a temperatura média para o lado superior é 27.2 °C / 81 F, em comparação com a média do dispositivo de 33.9 °C / ### class_avg_f### F.
(+) Os apoios para as mãos e o touchpad estão atingindo a temperatura máxima da pele (32.2 °C / 90 F) e, portanto, não estão quentes.
(-) A temperatura média da área do apoio para as mãos de dispositivos semelhantes foi 28.8 °C / 83.8 F (-3.4 °C / -6.2 F).
Acer Aspire VX15 VX5-591G-589S análise de áudio
(-) | alto-falantes não muito altos (###valor### dB)
Graves 100 - 315Hz
(±) | graves reduzidos - em média 8.1% menor que a mediana
(+) | o baixo é linear (6.6% delta para a frequência anterior)
Médios 400 - 2.000 Hz
(+) | médios equilibrados - apenas 2.1% longe da mediana
(+) | médios são lineares (3.2% delta para frequência anterior)
Altos 2 - 16 kHz
(+) | agudos equilibrados - apenas 3.8% longe da mediana
(+) | os máximos são lineares (6.5% delta da frequência anterior)
Geral 100 - 16.000 Hz
(+) | o som geral é linear (12.6% diferença em relação à mediana)
Comparado com a mesma classe
» 16% de todos os dispositivos testados nesta classe foram melhores, 4% semelhantes, 81% piores
» O melhor teve um delta de 6%, a média foi 18%, o pior foi 132%
Comparado com todos os dispositivos testados
» 11% de todos os dispositivos testados foram melhores, 3% semelhantes, 86% piores
» O melhor teve um delta de 4%, a média foi 23%, o pior foi 134%
Apple MacBook 12 (Early 2016) 1.1 GHz análise de áudio
(+) | os alto-falantes podem tocar relativamente alto (###valor### dB)
Graves 100 - 315Hz
(±) | graves reduzidos - em média 11.3% menor que a mediana
(±) | a linearidade dos graves é média (14.2% delta para a frequência anterior)
Médios 400 - 2.000 Hz
(+) | médios equilibrados - apenas 2.4% longe da mediana
(+) | médios são lineares (5.5% delta para frequência anterior)
Altos 2 - 16 kHz
(+) | agudos equilibrados - apenas 2% longe da mediana
(+) | os máximos são lineares (4.5% delta da frequência anterior)
Geral 100 - 16.000 Hz
(+) | o som geral é linear (10.2% diferença em relação à mediana)
Comparado com a mesma classe
» 7% de todos os dispositivos testados nesta classe foram melhores, 2% semelhantes, 90% piores
» O melhor teve um delta de 5%, a média foi 18%, o pior foi 53%
Comparado com todos os dispositivos testados
» 5% de todos os dispositivos testados foram melhores, 1% semelhantes, 94% piores
» O melhor teve um delta de 4%, a média foi 23%, o pior foi 134%
| desligado | |
| Ocioso | |
| Carga |
|
Key:
min: | |
| Battery Runtime - WiFi Websurfing | |
| Dell Inspiron 15 7000 7567 | |
| HP Pavilion 15t-X7P42AV | |
| Asus FX553VD-DM249T | |
| Dell XPS 15 2017 9560 (7300HQ, Full-HD) | |
| Acer Aspire VX15 VX5-591G-589S | |
| Acer Aspire VX5-591G-75C4 VX15 | |
| HP Omen 15-ax007ng | |
Pro
Contra
O gamer de nível de entrada da Acer vem com um preço de £799,99 (~ $1035). Em troca, você obtém um portátil de 15,6 polegadas com um potente processador quad-core Kaby Lake e um processador gráfico GeForce GTX 1050r. O hardware roda todos os jogos mais recentes de computador fluentemente, com alta resolução e configurações de qualidade média a alta. Em alguns (poucos) casos, a resolução e/ou as configurações de qualidade podem precisar ser reduzidas. O aparelho é silencioso durante o modo inativo e não aquece particularmente. Mesmo sob uso intenso, as emissões não aumentam excessivamente.
O Aspire não possui deficiências reais. Por £800 (~ $1035), você obtém um dispositivo de nível de entrada bem equipado - uma ótima introdução no mundo dos portáteis de jogos.
Um SSD garante um sistema veloz. O aparelho também fornece o espaço de armazenamento necessário para um portátil de jogos, com o disco rígido de 2,5 polegadas. Ambas as unidades são substituíveis, o que significaria abrir a tampa inferior - uma operação que não é muito complicada. A tela IPS mate tem ângulos de visão estáveis e bom contraste. O alto falante é bastante bom, mas poderia ser melhor.
A unidade de teste alemã veio sem um sistema operacional Windows. Uma maneira barata de obter o sistema operacional Windows 10 seria através do Windows 7/8.1. Se você instalar uma das duas versões anteriores do Windows com uma licença usada (£5 a £10, ~ $6 a $12), você pode obter uma atualização gratuita para o Windows 10 com a ajuda da ferramenta de criação de mídia da Microsoft.
Acer Aspire VX15 VX5-591G-589S
- 05/22/2017 v6 (old)
Sascha Mölck