Breve Análise do Portátil HP Pavilion 15t X7P44AV (7700HQ, FHD, GTX 1050)
| SD Card Reader | |
| average JPG Copy Test (av. of 3 runs) | |
| HP Pavilion 15t-X7P42AV | |
| Lenovo IdeaPad 510-15IKB 80SV0087GE | |
| Dell XPS 15 2017 9560 (7300HQ, Full-HD) | |
| Asus N552VX-FY103T | |
| maximum AS SSD Seq Read Test (1GB) | |
| Dell XPS 15 2017 9560 (7300HQ, Full-HD) | |
| HP Pavilion 15t-X7P42AV | |
| Asus N552VX-FY103T | |
| Lenovo IdeaPad 510-15IKB 80SV0087GE | |
| Networking | |
| iperf3 transmit AX12 | |
| Apple MacBook Pro 15 2016 (2.6 GHz, 450) (Klaus I211) | |
| Dell XPS 15 2017 9560 (7300HQ, Full-HD) | |
| HP Pavilion 15t-X7P42AV | |
| iperf3 receive AX12 | |
| Apple MacBook Pro 15 2016 (2.6 GHz, 450) (Klaus I211) | |
| Dell XPS 15 2017 9560 (7300HQ, Full-HD) | |
| HP Pavilion 15t-X7P42AV | |
| |||||||||||||||||||||||||
iluminação: 75 %
iluminação com acumulador: 209.7 cd/m²
Contraste: 1104:1 (Preto: 0.19 cd/m²)
ΔE ColorChecker Calman: 7.8 | ∀{0.5-29.43 Ø4.71}
ΔE Greyscale Calman: 7.3 | ∀{0.09-98 Ø4.96}
56.5% sRGB (Argyll 1.6.3 3D)
39.3% AdobeRGB 1998 (Argyll 1.6.3 3D)
39.29% AdobeRGB 1998 (Argyll 3D)
56.5% sRGB (Argyll 3D)
38.03% Display P3 (Argyll 3D)
Gamma: 2.39
CCT: 5771 K
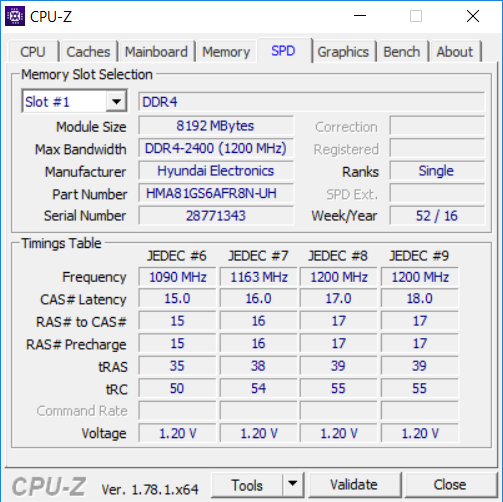
| HP Pavilion 15t-X7P42AV AU Optronics AUO41ED, IPS, 15.6", 1920x1080 | Dell XPS 15 2017 9560 (7300HQ, Full-HD) Sharp SHP1453 LQ156M1, LED IGZO IPS InfinityEdge, 15.6", 1920x1080 | Lenovo IdeaPad 510-15IKB 80SV0087GE BOE HF NV156FHM-N42, IPS, 15.6", 1920x1080 | Asus N552VX-FY103T LG Philips LP156WF6-SPB5, AH-IPS, 15.6", 1920x1080 | MSI PE60 6QE-056XUS Name: Chi Mei N156HGE-EAL, ID: CMN15D2, TN LED, 15.6", 1920x1080 | HP Pavilion 15 UHD T9Y85AV SDC5958, IPS, 15.6", 3840x2160 | |
|---|---|---|---|---|---|---|
| Display | 79% | 12% | 66% | 106% | 56% | |
| Display P3 Coverage (%) | 38.03 | 68.9 81% | 42.66 12% | 67.9 79% | 86 126% | 60 58% |
| sRGB Coverage (%) | 56.5 | 98.9 75% | 64.1 13% | 87.7 55% | 99.8 77% | 85.8 52% |
| AdobeRGB 1998 Coverage (%) | 39.29 | 70.9 80% | 44.08 12% | 64 63% | 84.2 114% | 61.8 57% |
| Response Times | -58% | -28% | 5% | 1% | 6% | |
| Response Time Grey 50% / Grey 80% * (ms) | 44.4 ? | 54 ? -22% | 51 ? -15% | 42 ? 5% | 43.6 ? 2% | 39.6 ? 11% |
| Response Time Black / White * (ms) | 27.2 ? | 52.4 ? -93% | 38 ? -40% | 26 ? 4% | 27.6 ? -1% | 27.2 ? -0% |
| PWM Frequency (Hz) | 50 ? | 1000 ? | 1282 ? | |||
| Screen | 45% | 25% | 27% | -8% | 14% | |
| Brightness middle (cd/m²) | 209.7 | 400 91% | 291 39% | 336 60% | 200.1 -5% | 336.2 60% |
| Brightness (cd/m²) | 193 | 392 103% | 265 37% | 304 58% | 194 1% | 323 67% |
| Brightness Distribution (%) | 75 | 89 19% | 86 15% | 85 13% | 86 15% | 87 16% |
| Black Level * (cd/m²) | 0.19 | 0.26 -37% | 0.23 -21% | 0.34 -79% | 0.429 -126% | 0.629 -231% |
| Contrast (:1) | 1104 | 1538 39% | 1265 15% | 988 -11% | 466 -58% | 534 -52% |
| Colorchecker dE 2000 * | 7.8 | 4.9 37% | 4.78 39% | 5.26 33% | 10.63 -36% | 3.32 57% |
| Colorchecker dE 2000 max. * | 24.1 | 11 54% | 9.51 61% | 10.49 56% | 18.19 25% | 7.4 69% |
| Greyscale dE 2000 * | 7.3 | 7.2 1% | 3.49 52% | 4.26 42% | 11.51 -58% | 2.88 61% |
| Gamma | 2.39 92% | 2.11 104% | 2.58 85% | 2.35 94% | 2.23 99% | 2.34 94% |
| CCT | 5771 113% | 6911 94% | 6013 108% | 6758 96% | 14492 45% | 6279 104% |
| Color Space (Percent of AdobeRGB 1998) (%) | 39.3 | 64.2 63% | 40 2% | 57 45% | 74.6 90% | 55.3 41% |
| Color Space (Percent of sRGB) (%) | 56.5 | 98.9 75% | 64 13% | 88 56% | 99.8 77% | 85.5 51% |
| Média Total (Programa/Configurações) | 22% /
38% | 3% /
16% | 33% /
32% | 33% /
16% | 25% /
21% |
* ... menor é melhor
Exibir tempos de resposta
| ↔ Tempo de resposta preto para branco | ||
|---|---|---|
| 27.2 ms ... ascensão ↗ e queda ↘ combinadas | ↗ 6.8 ms ascensão | 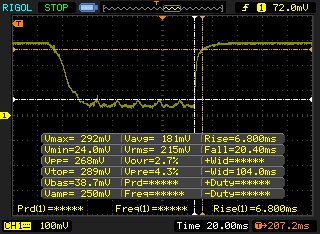 |
| ↘ 20.4 ms queda | ||
| A tela mostra taxas de resposta relativamente lentas em nossos testes e pode ser muito lenta para os jogadores. Em comparação, todos os dispositivos testados variam de 0.1 (mínimo) a 240 (máximo) ms. » 69 % de todos os dispositivos são melhores. Isso significa que o tempo de resposta medido é pior que a média de todos os dispositivos testados (19.8 ms). | ||
| ↔ Tempo de resposta 50% cinza a 80% cinza | ||
| 44.4 ms ... ascensão ↗ e queda ↘ combinadas | ↗ 15.2 ms ascensão | 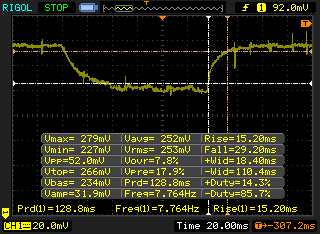 |
| ↘ 29.2 ms queda | ||
| A tela mostra taxas de resposta lentas em nossos testes e será insatisfatória para os jogadores. Em comparação, todos os dispositivos testados variam de 0.165 (mínimo) a 636 (máximo) ms. » 76 % de todos os dispositivos são melhores. Isso significa que o tempo de resposta medido é pior que a média de todos os dispositivos testados (31 ms). | ||
Cintilação da tela / PWM (modulação por largura de pulso)
| Tela tremeluzindo / PWM não detectado | 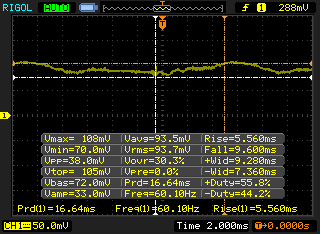 | ||
[pwm_comparison] Em comparação: 52 % de todos os dispositivos testados não usam PWM para escurecer a tela. Se PWM foi detectado, uma média de 7754 (mínimo: 5 - máximo: 343500) Hz foi medida. | |||

| Cinebench R15 | |
| CPU Single 64Bit | |
| HP Pavilion 15t-X7P42AV | |
| HP Pavilion 17t-ab200 | |
| Lenovo IdeaPad 510-15IKB 80SV0087GE | |
| Asus N552VX-FY103T | |
| Dell XPS 15 2017 9560 (7300HQ, Full-HD) | |
| HP Pavilion 15 UHD T9Y85AV | |
| MSI PE60 6QE-056XUS | |
| CPU Multi 64Bit | |
| HP Pavilion 15t-X7P42AV | |
| HP Pavilion 17t-ab200 | |
| MSI PE60 6QE-056XUS | |
| HP Pavilion 15 UHD T9Y85AV | |
| Asus N552VX-FY103T | |
| Dell XPS 15 2017 9560 (7300HQ, Full-HD) | |
| Lenovo IdeaPad 510-15IKB 80SV0087GE | |
| Cinebench R10 | |
| Rendering Multiple CPUs 32Bit | |
| Asus N552VX-FY103T | |
| MSI PE60 6QE-056XUS | |
| HP Pavilion 15 UHD T9Y85AV | |
| HP Pavilion 15t-X7P42AV | |
| Lenovo IdeaPad 510-15IKB 80SV0087GE | |
| Rendering Single 32Bit | |
| HP Pavilion 15t-X7P42AV | |
| Lenovo IdeaPad 510-15IKB 80SV0087GE | |
| MSI PE60 6QE-056XUS | |
| Asus N552VX-FY103T | |
| HP Pavilion 15 UHD T9Y85AV | |
| wPrime 2.10 - 1024m | |
| HP Pavilion 15t-X7P42AV | |
| HP Pavilion 17t-ab200 | |
| MSI PE60 6QE-056XUS | |
| HP Pavilion 15 UHD T9Y85AV | |
* ... menor é melhor
| PCMark 8 | |
| Home Score Accelerated v2 | |
| HP Pavilion 17t-ab200 | |
| HP Pavilion 15t-X7P42AV | |
| Lenovo IdeaPad 510-15IKB 80SV0087GE | |
| MSI PE60 6QE-056XUS | |
| Dell XPS 15 2017 9560 (7300HQ, Full-HD) | |
| Asus N552VX-FY103T | |
| HP Pavilion 15 UHD T9Y85AV | |
| Work Score Accelerated v2 | |
| HP Pavilion 17t-ab200 | |
| Dell XPS 15 2017 9560 (7300HQ, Full-HD) | |
| MSI PE60 6QE-056XUS | |
| Asus N552VX-FY103T | |
| HP Pavilion 15 UHD T9Y85AV | |
| HP Pavilion 15t-X7P42AV | |
| Creative Score Accelerated v2 | |
| HP Pavilion 17t-ab200 | |
| HP Pavilion 15t-X7P42AV | |
| MSI PE60 6QE-056XUS | |
| HP Pavilion 15 UHD T9Y85AV | |
| PCMark 8 Home Score Accelerated v2 | 4182 pontos | |
| PCMark 8 Creative Score Accelerated v2 | 5275 pontos | |
| PCMark 8 Work Score Accelerated v2 | 2880 pontos | |
Ajuda | ||
| HP Pavilion 15t-X7P42AV Samsung CM871a MZNTY128HDHP | Dell XPS 15 2017 9560 (7300HQ, Full-HD) WDC WD10SPCX-75KHST0 + SanDisk Z400s M.2 2242 32 GB Cache | Lenovo IdeaPad 510-15IKB 80SV0087GE Liteonit CV3-DE256 | MSI PE60 6QE-056XUS Intel SSD 535 SSDSCKJW120H6 | HP Pavilion 15 UHD T9Y85AV SanDisk Z400s SD8SNAT-128G | HP Pavilion 17t-ab200 Samsung CM871a MZNTY128HDHP | |
|---|---|---|---|---|---|---|
| CrystalDiskMark 3.0 | -83% | 7% | -36% | -22% | -10% | |
| Read Seq (MB/s) | 522 | 123 -76% | 469.2 -10% | 445.3 -15% | 484.6 -7% | 520 0% |
| Write Seq (MB/s) | 476.6 | 74.2 -84% | 431.5 -9% | 173.9 -64% | 185.2 -61% | 353.6 -26% |
| Read 512 (MB/s) | 399.7 | 101.7 -75% | 338.3 -15% | 212.4 -47% | 307.6 -23% | 376.2 -6% |
| Write 512 (MB/s) | 185.4 | 42.51 -77% | 297.9 61% | 133.7 -28% | 180 -3% | 118.5 -36% |
| Read 4k (MB/s) | 33.12 | 10.84 -67% | 28.68 -13% | 17.6 -47% | 22.08 -33% | 32.7 -1% |
| Write 4k (MB/s) | 89.8 | 1.021 -99% | 66.8 -26% | 83.6 -7% | 77.7 -13% | 85.3 -5% |
| Read 4k QD32 (MB/s) | 400.9 | 69.8 -83% | 364.7 -9% | 109.1 -73% | 143.7 -64% | 399 0% |
| Write 4k QD32 (MB/s) | 140.2 | 1.057 -99% | 245.9 75% | 130.7 -7% | 177.6 27% | 132.5 -5% |

| 3DMark 11 | |
| 1280x720 Performance GPU | |
| Dell XPS 15 2017 9560 (7300HQ, Full-HD) | |
| HP Pavilion 17t-ab200 | |
| HP Pavilion 15t-X7P42AV | |
| MSI PE60 6QE-056XUS | |
| HP Pavilion 15 UHD T9Y85AV | |
| Asus N552VX-FY103T | |
| HP Spectre x360 15-bl002xx | |
| Lenovo IdeaPad 510-15IKB 80SV0087GE | |
| 1280x720 Performance Combined | |
| HP Pavilion 17t-ab200 | |
| HP Pavilion 15t-X7P42AV | |
| Dell XPS 15 2017 9560 (7300HQ, Full-HD) | |
| MSI PE60 6QE-056XUS | |
| HP Pavilion 15 UHD T9Y85AV | |
| Asus N552VX-FY103T | |
| HP Spectre x360 15-bl002xx | |
| Lenovo IdeaPad 510-15IKB 80SV0087GE | |
| 3DMark | |
| 1280x720 Cloud Gate Standard Graphics | |
| Dell XPS 15 2017 9560 (7300HQ, Full-HD) | |
| HP Pavilion 15t-X7P42AV | |
| HP Pavilion 17t-ab200 | |
| MSI PE60 6QE-056XUS | |
| HP Pavilion 15 UHD T9Y85AV | |
| Asus N552VX-FY103T | |
| HP Spectre x360 15-bl002xx | |
| 1920x1080 Fire Strike Graphics | |
| Dell XPS 15 2017 9560 (7300HQ, Full-HD) | |
| HP Pavilion 15t-X7P42AV | |
| HP Pavilion 17t-ab200 | |
| MSI PE60 6QE-056XUS | |
| HP Pavilion 15 UHD T9Y85AV | |
| Asus N552VX-FY103T | |
| HP Spectre x360 15-bl002xx | |
| 1920x1080 Ice Storm Extreme Graphics | |
| HP Pavilion 15t-X7P42AV | |
| MSI PE60 6QE-056XUS | |
| HP Pavilion 15 UHD T9Y85AV | |
| HP Spectre x360 15-bl002xx | |
| 3DMark 11 Performance | 7706 pontos | |
| 3DMark Ice Storm Standard Score | 87227 pontos | |
| 3DMark Cloud Gate Standard Score | 19978 pontos | |
| 3DMark Fire Strike Score | 5528 pontos | |
| 3DMark Fire Strike Extreme Score | 2653 pontos | |
Ajuda | ||
| baixo | média | alto | ultra | |
|---|---|---|---|---|
| Dirt 3 (2011) | 176.1 | 161 | 152.9 | 102 |
| Tomb Raider (2013) | 106.5 | 87.6 | 75.6 | 42.3 |
| BioShock Infinite (2013) | 205.3 | 162.6 | 150.2 | 64.8 |
| Metro: Last Light (2013) | 135.2 | 126 | 83.1 | 43.9 |
| GRID 2 (2013) | 161.5 | 131.8 | 123 | 75.1 |
| Company of Heroes 2 (2013) | 65.6 | 61.7 | 58.8 | 45.2 |
| GRID: Autosport (2014) | 220.8 | 135.3 | 121.3 | 78.3 |
| Middle-earth: Shadow of Mordor (2014) | 169.7 | 105.8 | 58.7 | 45.2 |
| The Witcher 3 (2015) | 120.4 | 70.1 | 39.9 | 21.4 |
Barulho
| Ocioso |
| 32.3 / 32.3 / 32.4 dB |
| Carga |
| 44.4 / 49.2 dB |
 | ||
30 dB silencioso 40 dB(A) audível 50 dB(A) ruidosamente alto |
||
min: | ||
| HP Pavilion 15t-X7P42AV GeForce GTX 1050 Mobile, i7-7700HQ, Samsung CM871a MZNTY128HDHP | Dell XPS 15 2017 9560 (7300HQ, Full-HD) GeForce GTX 1050 Mobile, i5-7300HQ, WDC WD10SPCX-75KHST0 + SanDisk Z400s M.2 2242 32 GB Cache | Lenovo IdeaPad 510-15IKB 80SV0087GE GeForce 940MX, i7-7500U, Liteonit CV3-DE256 | MSI PE60 6QE-056XUS GeForce GTX 960M, 6700HQ, Intel SSD 535 SSDSCKJW120H6 | HP Pavilion 15 UHD T9Y85AV GeForce GTX 960M, 6700HQ, SanDisk Z400s SD8SNAT-128G | HP Pavilion 17t-ab200 GeForce GTX 1050 Mobile, i7-7700HQ, Samsung CM871a MZNTY128HDHP | |
|---|---|---|---|---|---|---|
| Noise | -1% | 6% | 1% | 1% | -7% | |
| desligado / ambiente * (dB) | 29.3 | 30.3 -3% | 31.6 -8% | 29.3 -0% | 29.5 -1% | 30.8 -5% |
| Idle Minimum * (dB) | 32.3 | 31.6 2% | 32.6 -1% | 32.4 -0% | 32.3 -0% | 35.3 -9% |
| Idle Average * (dB) | 32.3 | 31.6 2% | 32.6 -1% | 32.4 -0% | 32.4 -0% | 35.4 -10% |
| Idle Maximum * (dB) | 32.4 | 33.4 -3% | 32.6 -1% | 35.4 -9% | 32.4 -0% | 35.4 -9% |
| Load Average * (dB) | 44.4 | 47.8 -8% | 35.3 20% | 40.5 9% | 40.5 9% | 48.6 -9% |
| Load Maximum * (dB) | 49.2 | 47.8 3% | 37.1 25% | 45.3 8% | 50.3 -2% | 49.8 -1% |
* ... menor é melhor
(±) A temperatura máxima no lado superior é 41.8 °C / 107 F, em comparação com a média de 36.8 °C / 98 F , variando de 21 a 71 °C para a classe Multimedia.
(+) A parte inferior aquece até um máximo de 33.4 °C / 92 F, em comparação com a média de 39.1 °C / 102 F
(+) Em uso inativo, a temperatura média para o lado superior é 22.5 °C / 73 F, em comparação com a média do dispositivo de 31.3 °C / ### class_avg_f### F.
(+) Jogando The Witcher 3, a temperatura média para o lado superior é 28.9 °C / 84 F, em comparação com a média do dispositivo de 31.3 °C / ## #class_avg_f### F.
(±) Os apoios para as mãos e o touchpad podem ficar muito quentes ao toque, com um máximo de 37.6 °C / 99.7 F.
(-) A temperatura média da área do apoio para as mãos de dispositivos semelhantes foi 28.7 °C / 83.7 F (-8.9 °C / -16 F).
| desligado | |
| Ocioso | |
| Carga |
|
Key:
min: | |
| HP Pavilion 15t-X7P42AV i7-7700HQ, GeForce GTX 1050 Mobile, Samsung CM871a MZNTY128HDHP, IPS, 1920x1080, 15.6" | Dell XPS 15 2017 9560 (7300HQ, Full-HD) i5-7300HQ, GeForce GTX 1050 Mobile, WDC WD10SPCX-75KHST0 + SanDisk Z400s M.2 2242 32 GB Cache, LED IGZO IPS InfinityEdge, 1920x1080, 15.6" | Lenovo IdeaPad 510-15IKB 80SV0087GE i7-7500U, GeForce 940MX, Liteonit CV3-DE256, IPS, 1920x1080, 15.6" | MSI PE60 6QE-056XUS 6700HQ, GeForce GTX 960M, Intel SSD 535 SSDSCKJW120H6, TN LED, 1920x1080, 15.6" | HP Pavilion 15 UHD T9Y85AV 6700HQ, GeForce GTX 960M, SanDisk Z400s SD8SNAT-128G, IPS, 3840x2160, 15.6" | HP Pavilion 17t-ab200 i7-7700HQ, GeForce GTX 1050 Mobile, Samsung CM871a MZNTY128HDHP, IPS, 1920x1080, 17.3" | Asus N552VX-FY103T 6700HQ, GeForce GTX 950M, Toshiba MQ02ABD100H, AH-IPS, 1920x1080, 15.6" | HP Spectre x360 15-bl002xx i7-7500U, GeForce 940MX, Toshiba XG4 NVMe (THNSN5512GPUK), IPS, 3840x2160, 15.6" | |
|---|---|---|---|---|---|---|---|---|
| Power Consumption | 4% | 38% | -37% | -22% | -4% | -1% | 9% | |
| Idle Minimum * (Watt) | 8.29 | 6.6 20% | 3.9 53% | 9.7 -17% | 8.3 -0% | 8.2 1% | 7 16% | 8.14 2% |
| Idle Average * (Watt) | 8.9 | 9 -1% | 7.4 17% | 13.1 -47% | 14.8 -66% | 11 -24% | 10.9 -22% | 10.91 -23% |
| Idle Maximum * (Watt) | 10.2 | 10.7 -5% | 9.5 7% | 23.2 -127% | 16.8 -65% | 11.1 -9% | 12.9 -26% | 12.26 -20% |
| Load Average * (Watt) | 77.1 | 77.5 -1% | 41 47% | 79.1 -3% | 71 8% | 77 -0% | 72 7% | 45.67 41% |
| Load Maximum * (Watt) | 136.6 | 130 5% | 48 65% | 122.9 10% | 119.2 13% | 116.9 14% | 109 20% | 74.94 45% |
* ... menor é melhor
| HP Pavilion 15t-X7P42AV i7-7700HQ, GeForce GTX 1050 Mobile, 63.3 Wh | Dell XPS 15 2017 9560 (7300HQ, Full-HD) i5-7300HQ, GeForce GTX 1050 Mobile, 56 Wh | MSI PE60 6QE-056XUS 6700HQ, GeForce GTX 960M, 42 Wh | HP Pavilion 15 UHD T9Y85AV 6700HQ, GeForce GTX 960M, 61.5 Wh | HP Pavilion 17t-ab200 i7-7700HQ, GeForce GTX 1050 Mobile, 62 Wh | Asus N552VX-FY103T 6700HQ, GeForce GTX 950M, 44 Wh | HP Spectre x360 15-bl002xx i7-7500U, GeForce 940MX, 79.2 Wh | |
|---|---|---|---|---|---|---|---|
| Duração da bateria | -27% | -52% | -32% | -11% | -45% | 20% | |
| Reader / Idle (h) | 16 | 9.4 -41% | 5.7 -64% | 8.5 -47% | 11.5 -28% | 6 -62% | 14.4 -10% |
| WiFi v1.3 (h) | 6.5 | 5.6 -14% | 3 -54% | 4.4 -32% | 6.8 5% | 4.5 -31% | 8.9 37% |
| Load (h) | 1.9 | 1.4 -26% | 1.2 -37% | 1.6 -16% | 1.7 -11% | 1.1 -42% | 2.5 32% |
Pro
Contra
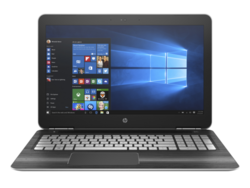

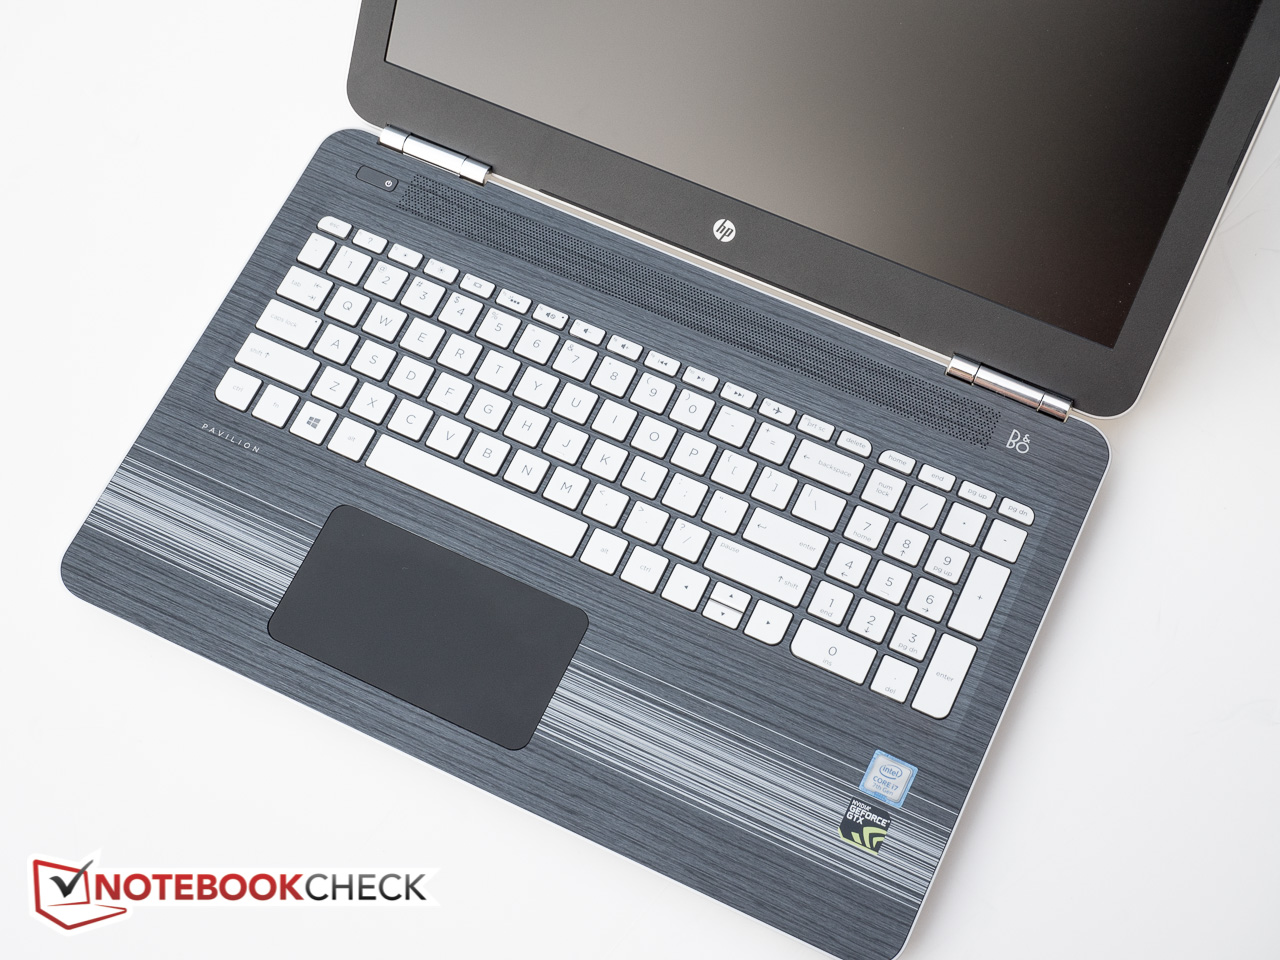
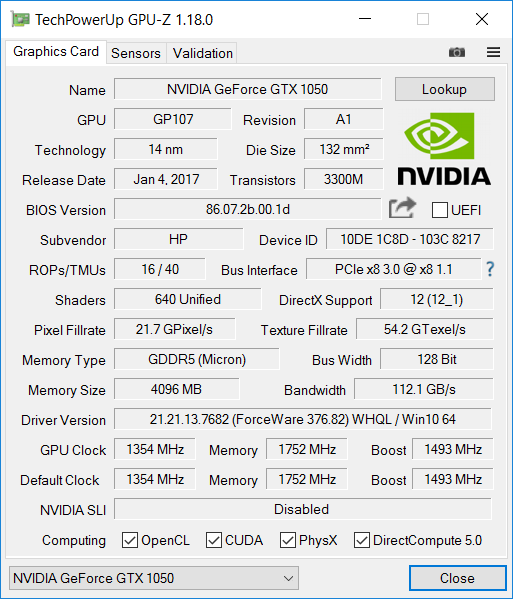
O HP Pavilion 15t X7P44AV oferece um desempenho muito bom a um preço razoável. O chassi de plástico não inspira muita confiança e pode não atrair usuários à procura de um design sofisticado (alumínio), mas o hardware certamente é forte: equipado com uma CPU quad-core de gama média, 16 GB de RAM, dois discos rígidos e uma GeForce GTX 1050, o sistema lida com tarefas diárias com desenvoltura. os usuários procurando um sistema poli funcional também devem ficar satisfeitos com o desempenho dos jogos, dado que o X744AV derrota facilmente concorrente do nível de entrada com uma GeForce 940MX.
Como, com frequência este é o caso, o portátil fica em desvantagem quando se trata da tela. Com apenas um pouco mais de 190 nits, a tela anti-refletiva é muito escura com espaço de cores inadequado e cores imprecisas. Embora a duração da bateria tenha melhorado, em comparação com o modelo quad-core da geração anterior, trabalhar em exteriores pode ser um desfio por esse mesmo motivo. A tela UHD opcional provavelmente consome mais energia e sobra mais da GPU, mas se fosse um pouco mais brilhante, provavelmente seria nossa escolha recomendável.
A principal vantagem dos Pavilions quad-core são seus preços comparativamente baixos: com CPU Intel Core i5-7300HQ, 8 GB de RAM, GeForce GTX 1050 (apenas com 2 GB de RAM neste caso) e o SSD M.2 de 256GB PCIe NVMe, o portátil pode ser adquirido por apenas $800.
Como uma máquina multimídia e para jogos em um orçamento, o HP Pavilion pode ser uma boa opção - desde que o usuário esteja ciente de suas desvantagens.
HP Pavilion 15t-X7P42AV
- 03/28/2017 v6 (old)
Bernhard Pechlaner
Price comparison
