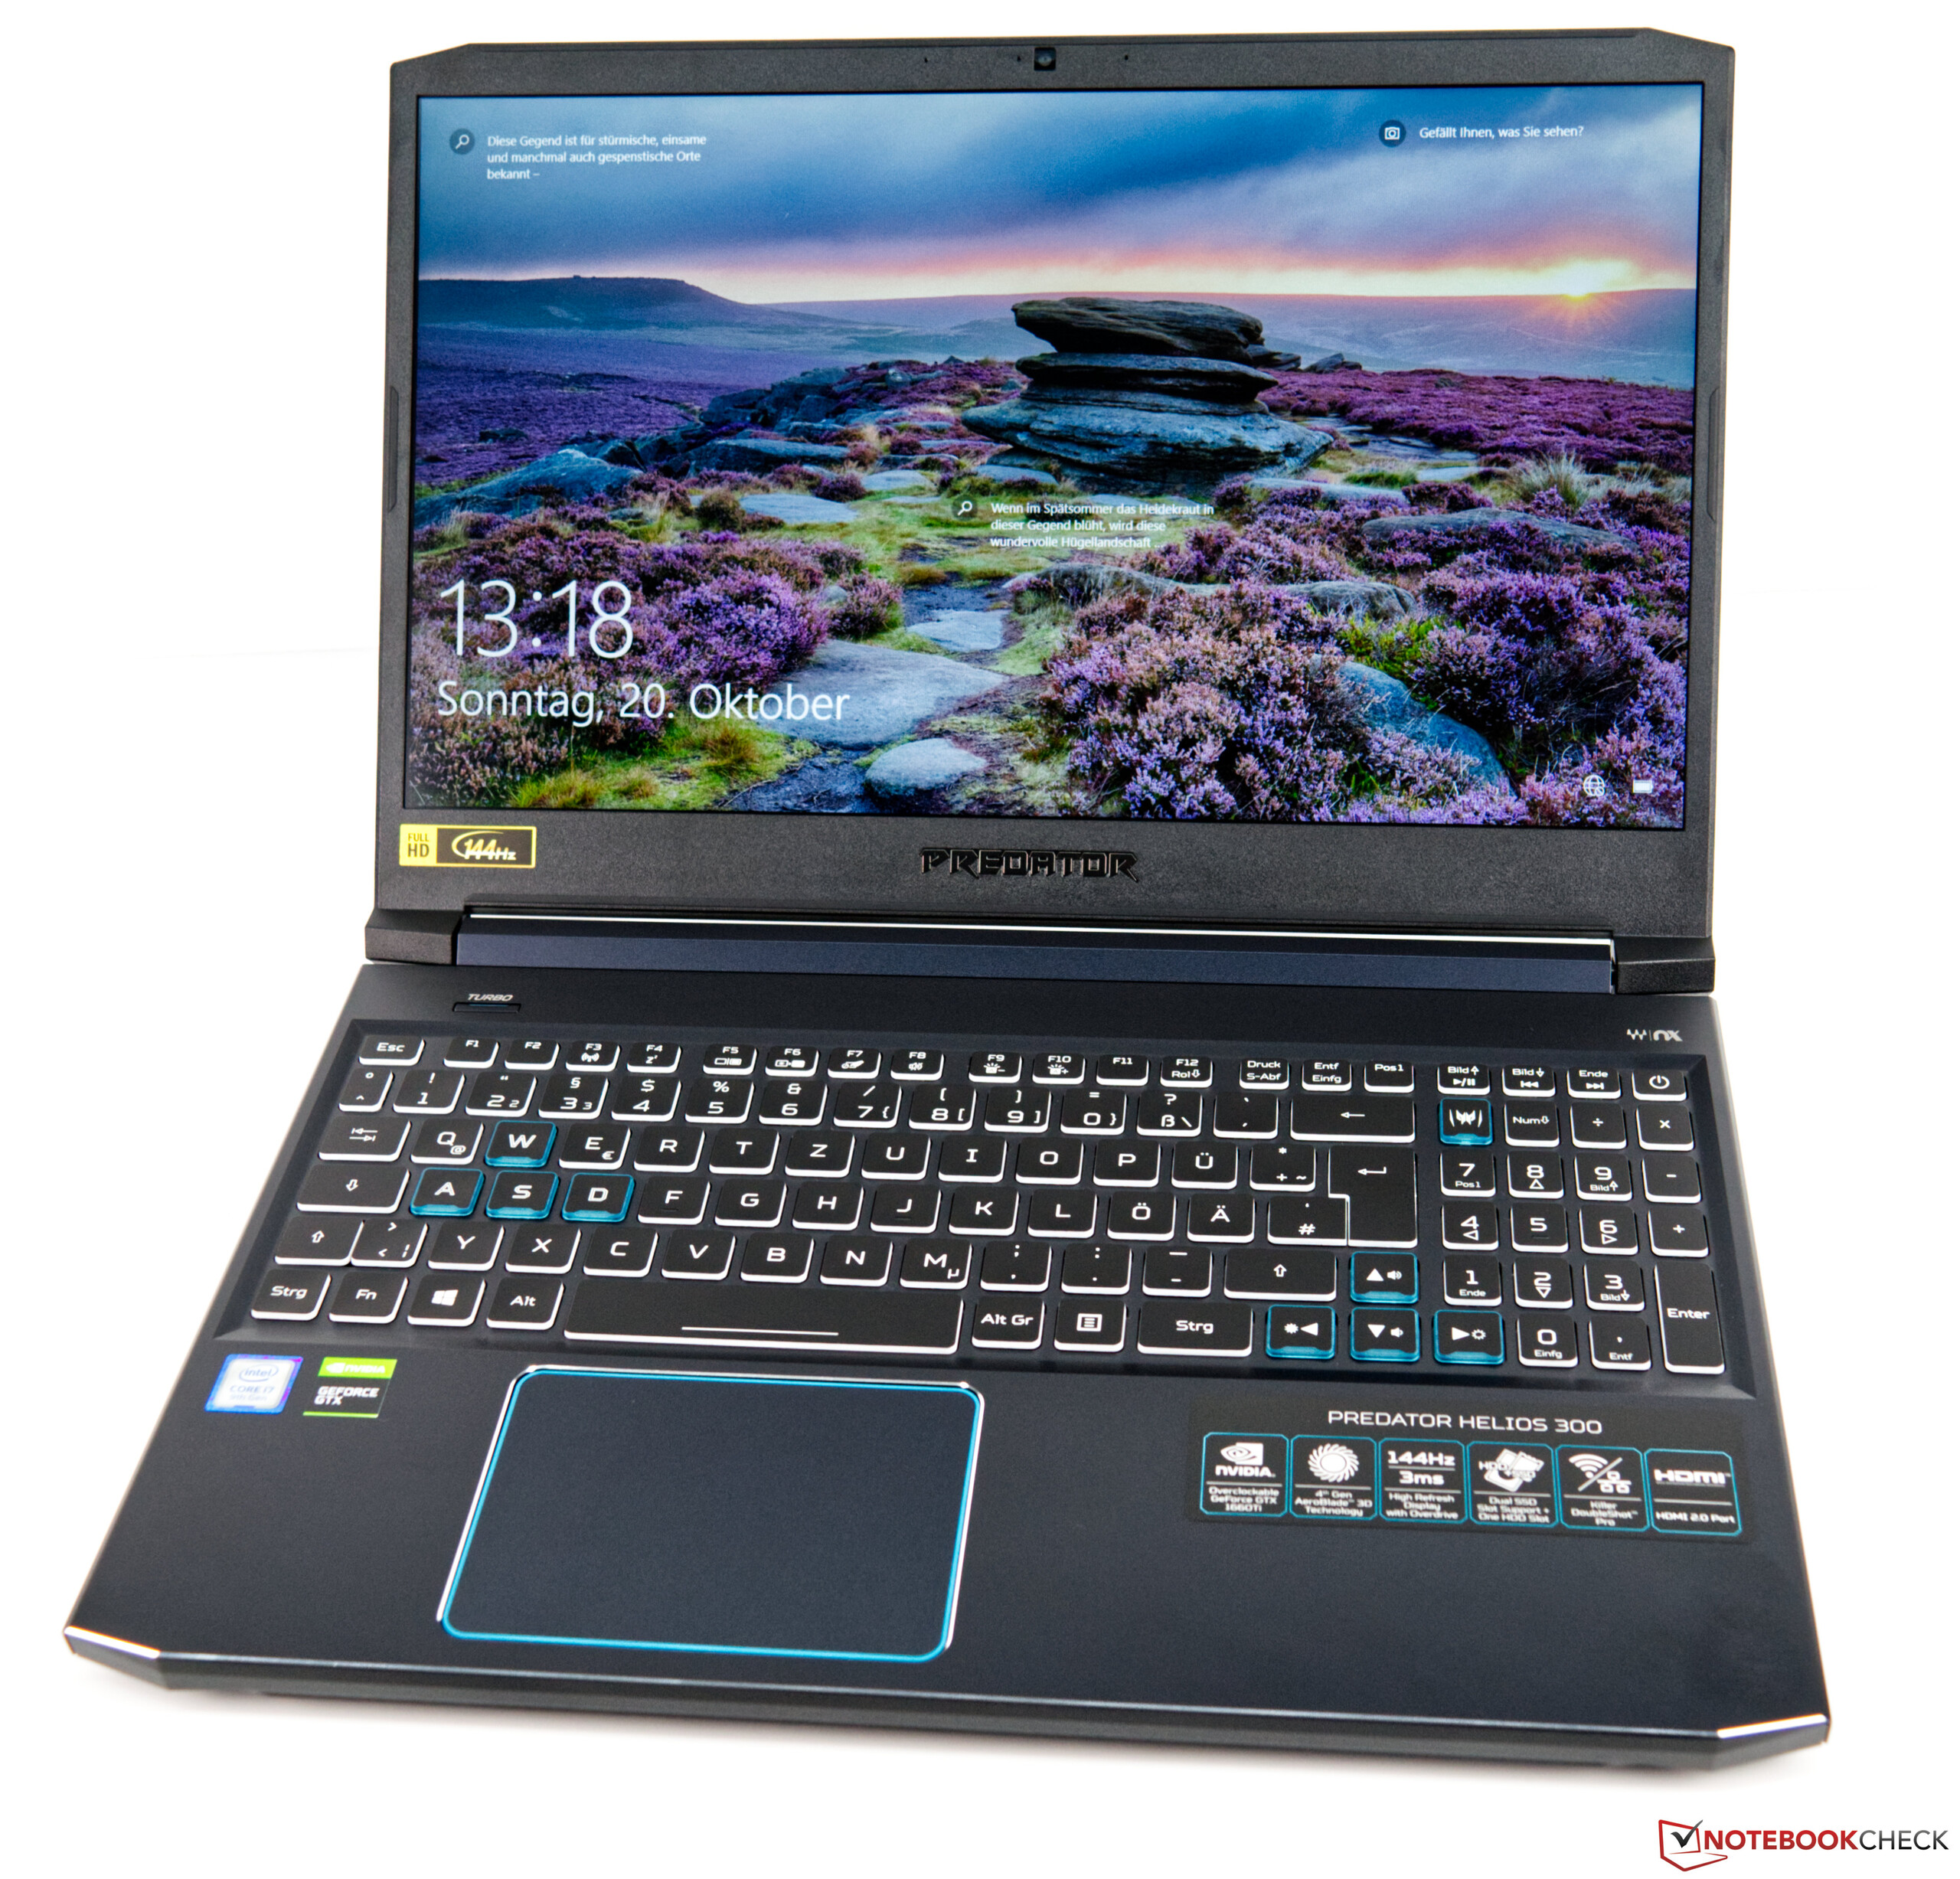
Breve Análise do Portátil Acer Predator Helios 300: Um portátil para jogos moderno com uma GPU Turing
Avaliação | Data | Modelo | Peso | Altura | Size | Resolução | Preço |
|---|---|---|---|---|---|---|---|
| 82.1 % v7 (old) | 11/2019 | Acer Predator Helios 300 PH315-52-79TY i7-9750H, GeForce GTX 1660 Ti Mobile | 2.3 kg | 23.2 mm | 15.60" | 1920x1080 | |
| 83.9 % v7 (old) | 08/2019 | HP Gaming Pavilion 15-dk0009ng i7-9750H, GeForce GTX 1660 Ti Max-Q | 2.4 kg | 23.4 mm | 15.60" | 1920x1080 | |
| 82.3 % v7 (old) | 08/2019 | Lenovo Legion Y540-15IRH-81SX00B2GE i7-9750H, GeForce GTX 1660 Ti Mobile | 2.2 kg | 26 mm | 15.60" | 1920x1080 | |
| 83 % v7 (old) | 05/2019 | Dell G5 15 5590 i7-8750H, GeForce RTX 2060 Mobile | 2.7 kg | 23.7 mm | 15.60" | 1920x1080 | |
| 84.8 % v7 (old) | Lenovo Legion Y740-15ICHg i7-9750H, GeForce RTX 2070 Max-Q | 2.3 kg | 25 mm | 15.60" | 1920x1080 | ||
| 82 % v6 (old) | 06/2018 | Acer Predator Helios 300 PH317-52-51M6 i5-8300H, GeForce GTX 1050 Ti Mobile | 2.9 kg | 29 mm | 17.30" | 1920x1080 |

| Networking | |
| iperf3 transmit AX12 | |
| Acer Predator Helios 300 PH315-52-79TY | |
| Dell G5 15 5590 | |
| Acer Predator Helios 300 PH317-52-51M6 | |
| HP Gaming Pavilion 15-dk0009ng | |
| Lenovo Legion Y540-15IRH-81SX00B2GE | |
| Lenovo Legion Y740-15ICHg | |
| iperf3 receive AX12 | |
| Acer Predator Helios 300 PH317-52-51M6 | |
| Acer Predator Helios 300 PH315-52-79TY | |
| Dell G5 15 5590 | |
| Lenovo Legion Y540-15IRH-81SX00B2GE | |
| Lenovo Legion Y740-15ICHg | |
| HP Gaming Pavilion 15-dk0009ng | |
| |||||||||||||||||||||||||
iluminação: 82 %
iluminação com acumulador: 326 cd/m²
Contraste: 1275:1 (Preto: 0.255 cd/m²)
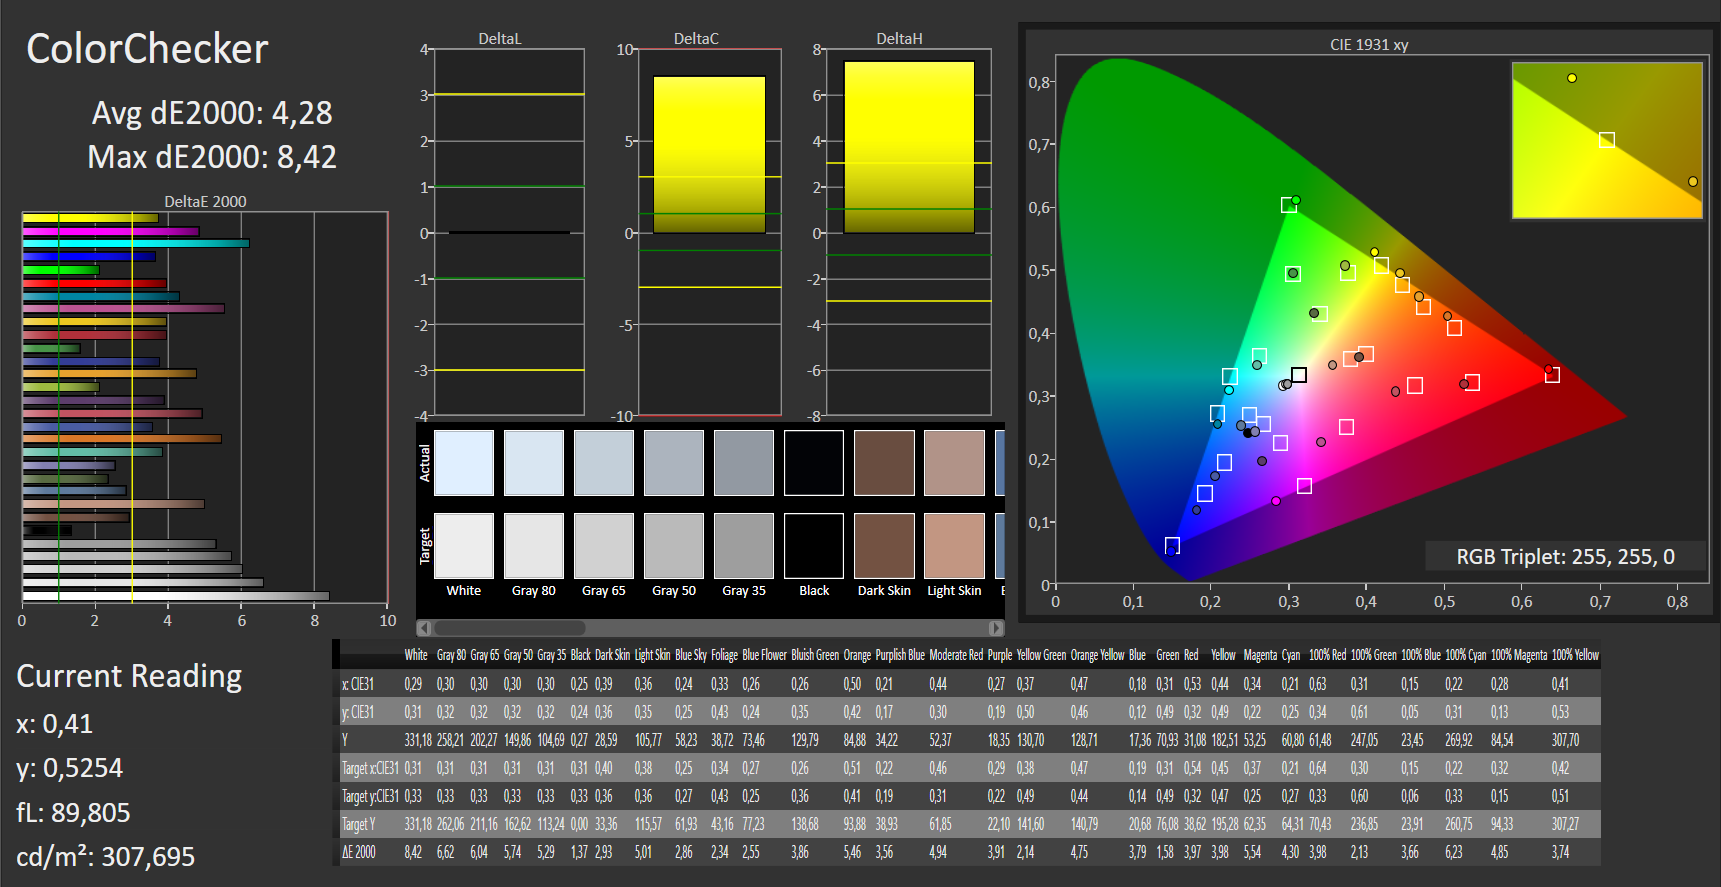
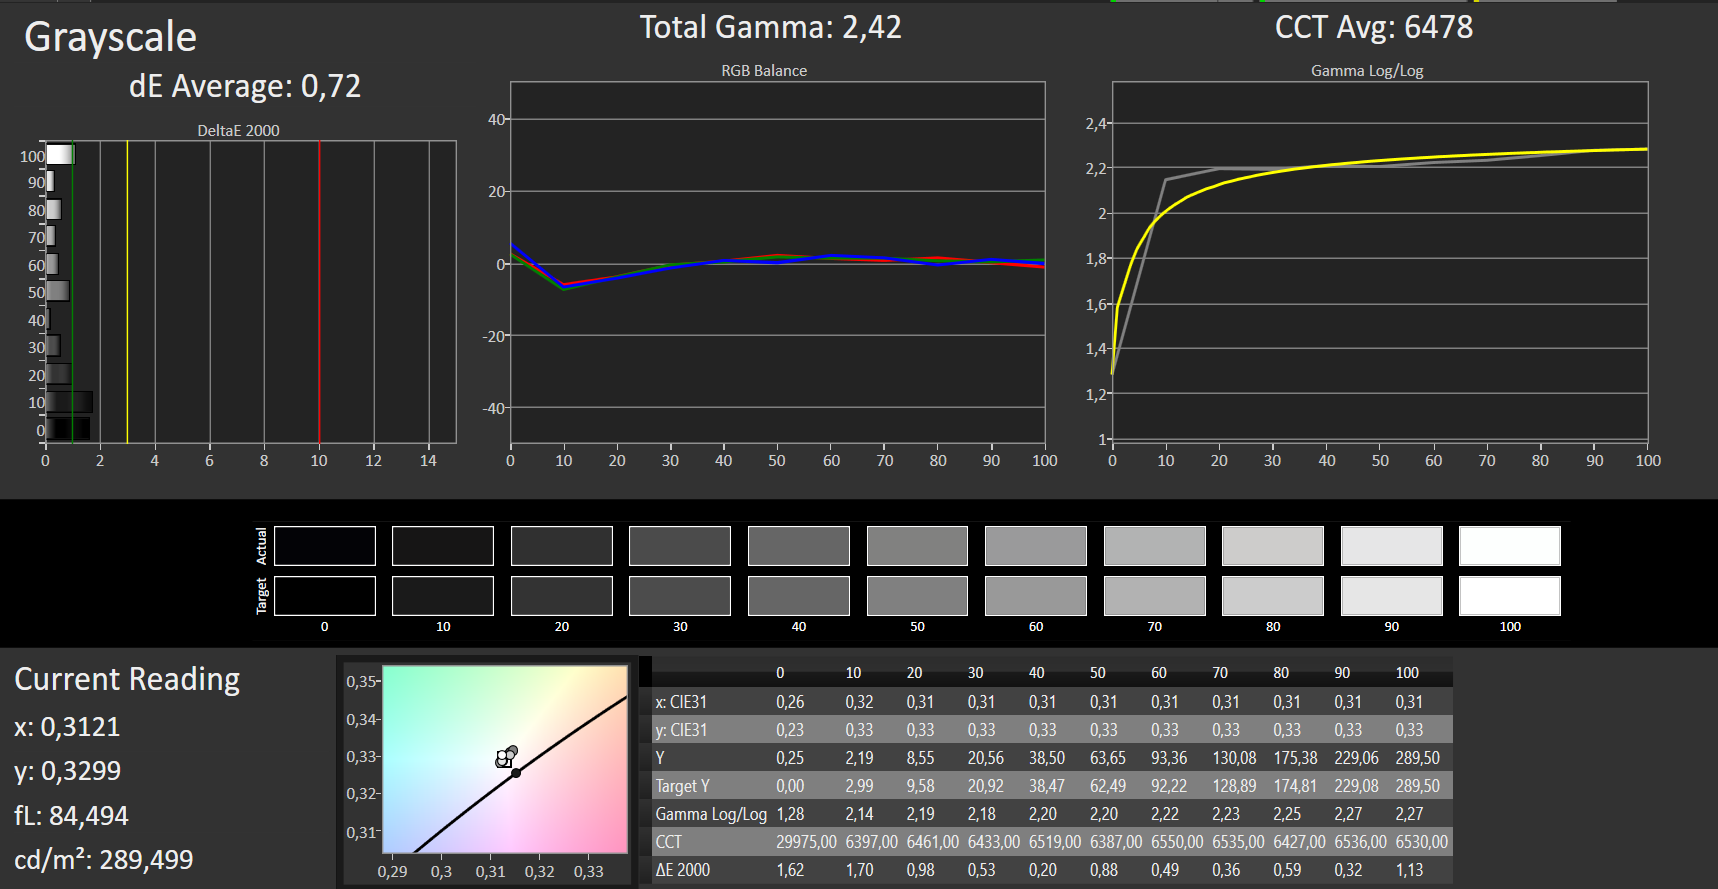
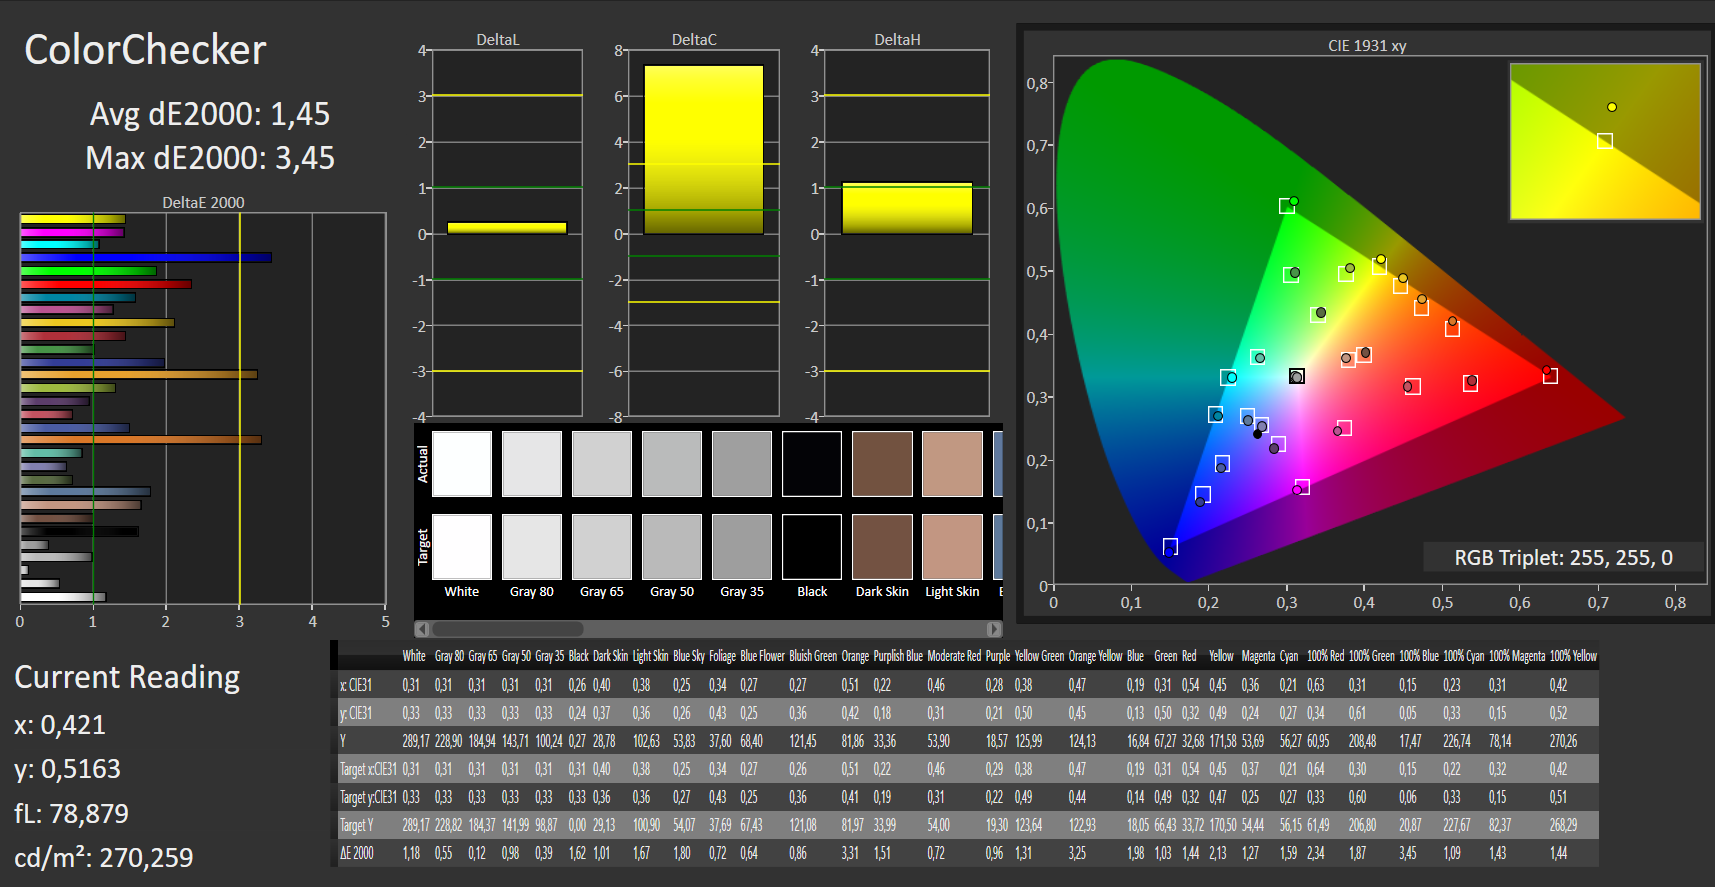
ΔE ColorChecker Calman: 4.28 | ∀{0.5-29.43 Ø4.72}
calibrated: 1.45
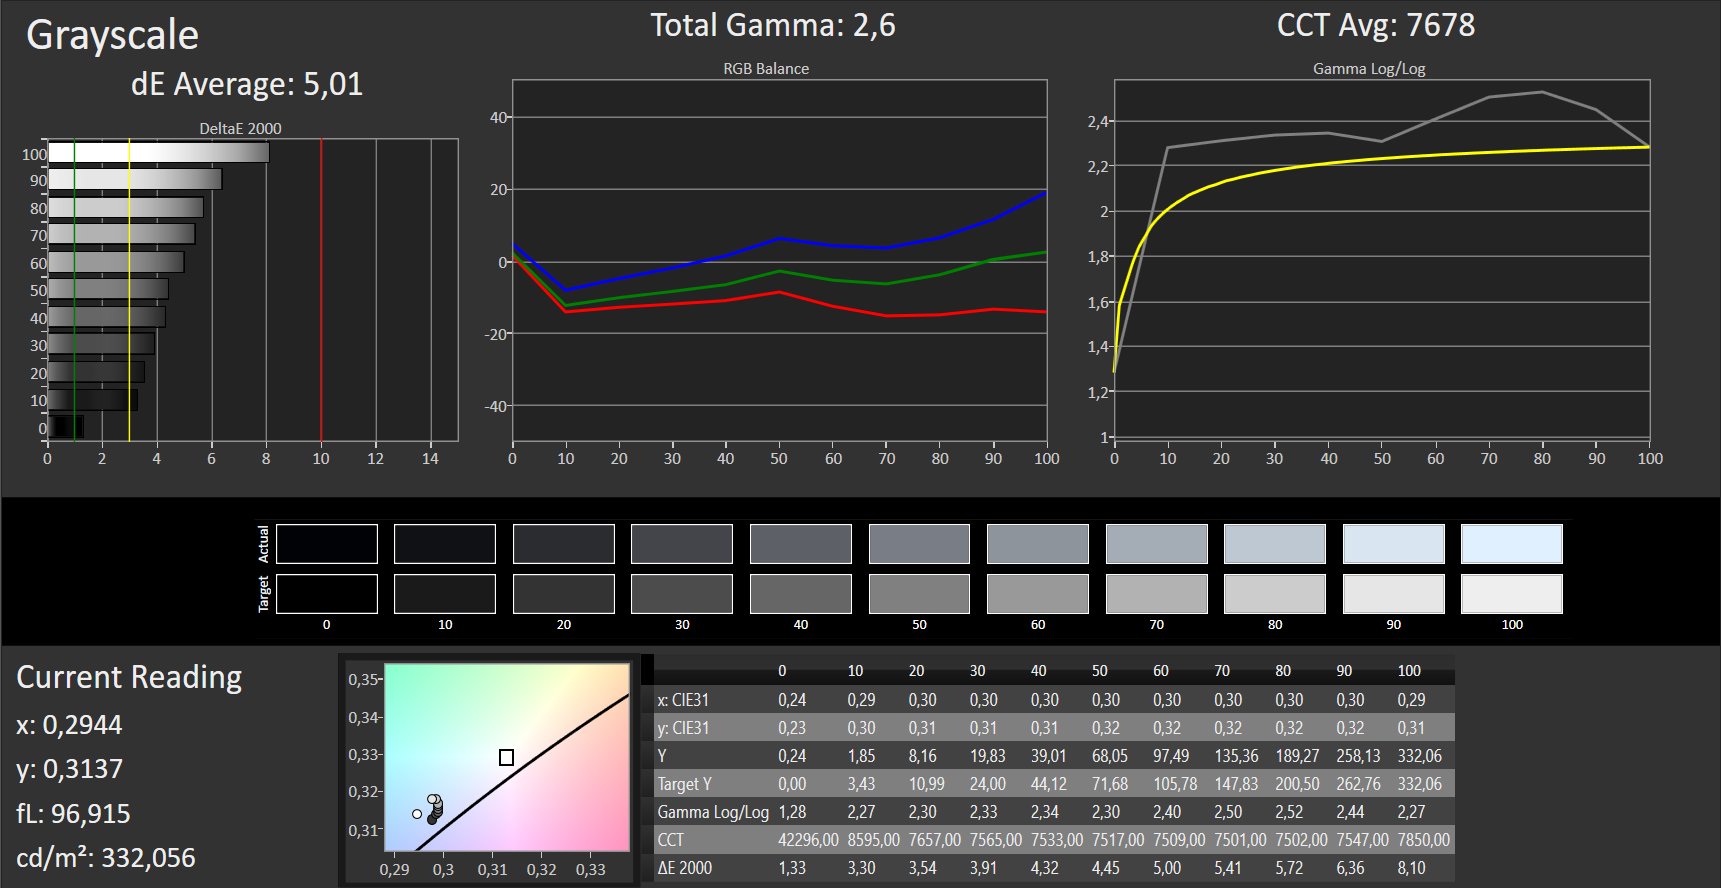
ΔE Greyscale Calman: 5.01 | ∀{0.09-98 Ø4.97}
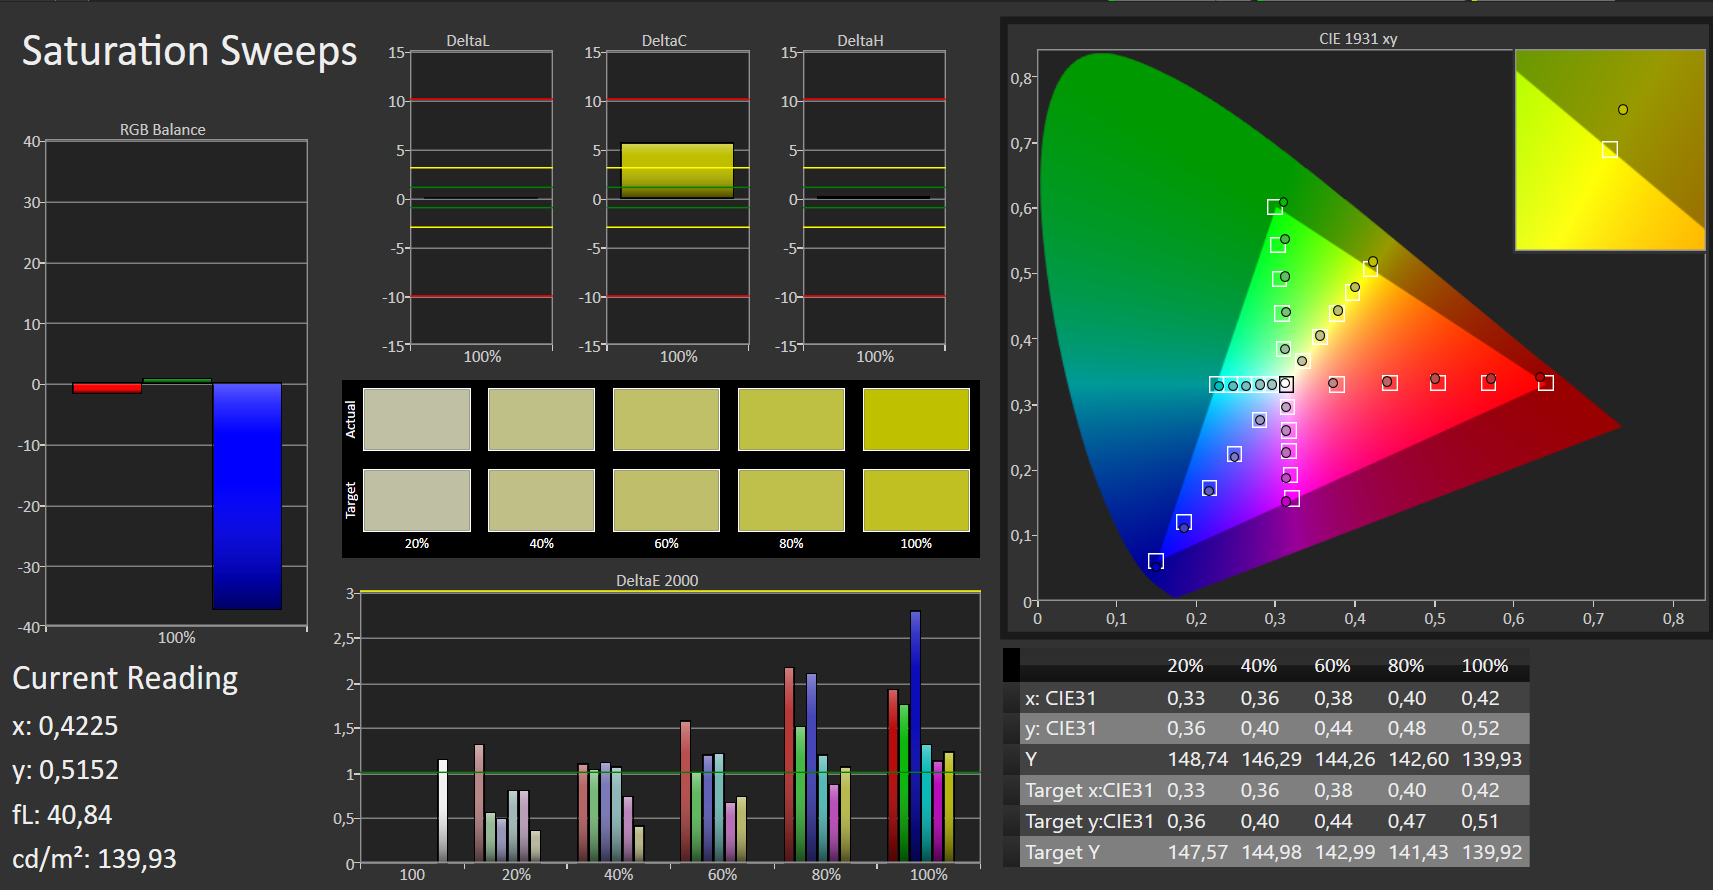
93% sRGB (Argyll 1.6.3 3D)
60% AdobeRGB 1998 (Argyll 1.6.3 3D)
65.7% AdobeRGB 1998 (Argyll 3D)
93% sRGB (Argyll 3D)
64.1% Display P3 (Argyll 3D)
Gamma: 2.6
CCT: 7678 K
| Acer Predator Helios 300 PH315-52-79TY AUO, B156HAN08.2, IPS, 1920x1080, 15.6" | HP Gaming Pavilion 15-dk0009ng LG Philips LGD05FE, IPS, 1920x1080, 15.6" | Lenovo Legion Y540-15IRH-81SX00B2GE BOE 084D, IPS, 1920x1080, 15.6" | Dell G5 15 5590 AU Optronics B156HAN, IPS, 1920x1080, 15.6" | Lenovo Legion Y740-15ICHg BOE NV156FHM-N4J, IPS, 1920x1080, 15.6" | Acer Predator Helios 300 PH317-52-51M6 LG Philips LP173WF4-SPF5 (LGD056D), IPS, 1920x1080, 17.3" | |
|---|---|---|---|---|---|---|
| Display | 1% | -1% | -38% | 2% | -2% | |
| Display P3 Coverage (%) | 64.1 | 64.2 0% | 63.6 -1% | 39.26 -39% | 67.7 6% | 67.1 5% |
| sRGB Coverage (%) | 93 | 95.1 2% | 91.7 -1% | 59.1 -36% | 91.6 -2% | 86.1 -7% |
| AdobeRGB 1998 Coverage (%) | 65.7 | 65.8 0% | 65.2 -1% | 40.56 -38% | 67.1 2% | 63 -4% |
| Response Times | -13% | 4% | -217% | -19% | -142% | |
| Response Time Grey 50% / Grey 80% * (ms) | 15 ? | 16.4 ? -9% | 8.8 ? 41% | 45 ? -200% | 19 ? -27% | 36 ? -140% |
| Response Time Black / White * (ms) | 9 ? | 10.4 ? -16% | 12 ? -33% | 30 ? -233% | 10 ? -11% | 22 ? -144% |
| PWM Frequency (Hz) | 122000 ? | |||||
| Screen | 14% | -3% | -50% | 19% | -25% | |
| Brightness middle (cd/m²) | 325 | 345 6% | 299 -8% | 234 -28% | 477 47% | 365 12% |
| Brightness (cd/m²) | 310 | 324 5% | 290 -6% | 219 -29% | 431 39% | 341 10% |
| Brightness Distribution (%) | 82 | 86 5% | 89 9% | 82 0% | 84 2% | 89 9% |
| Black Level * (cd/m²) | 0.255 | 0.42 -65% | 0.29 -14% | 0.17 33% | 0.175 31% | 0.32 -25% |
| Contrast (:1) | 1275 | 821 -36% | 1031 -19% | 1376 8% | 2726 114% | 1141 -11% |
| Colorchecker dE 2000 * | 4.28 | 1.3 70% | 3.7 14% | 8.6 -101% | 4.17 3% | 6.51 -52% |
| Colorchecker dE 2000 max. * | 8.42 | 2.8 67% | 7 17% | 17.49 -108% | 6.97 17% | 12.32 -46% |
| Colorchecker dE 2000 calibrated * | 1.45 | 1.1 24% | 2 -38% | 4.06 -180% | 2.51 -73% | 2.9 -100% |
| Greyscale dE 2000 * | 5.01 | 1.2 76% | 4.1 18% | 8.55 -71% | 3.49 30% | 7.65 -53% |
| Gamma | 2.6 85% | 2.31 95% | 2.19 100% | 3.02 73% | 2.5 88% | 2.64 83% |
| CCT | 7678 85% | 6476 100% | 7166 91% | 7802 83% | 7076 92% | 8066 81% |
| Color Space (Percent of AdobeRGB 1998) (%) | 60 | 60.5 1% | 59.3 -1% | 37 -38% | 60 0% | 56 -7% |
| Color Space (Percent of sRGB) (%) | 93 | 94.9 2% | 91.5 -2% | 59 -37% | 91 -2% | 86 -8% |
| Média Total (Programa/Configurações) | 1% /
8% | 0% /
-2% | -102% /
-69% | 1% /
11% | -56% /
-35% |
* ... menor é melhor
Exibir tempos de resposta
| ↔ Tempo de resposta preto para branco | ||
|---|---|---|
| 9 ms ... ascensão ↗ e queda ↘ combinadas | ↗ 5 ms ascensão | 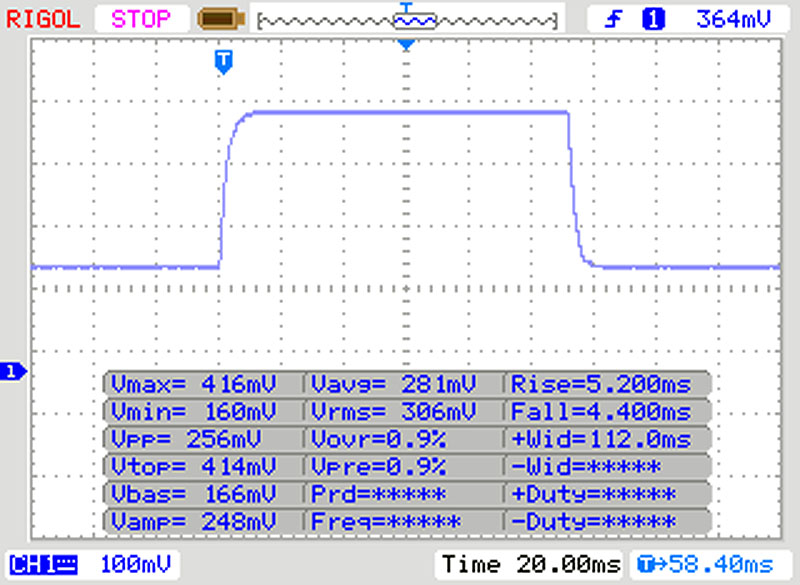 |
| ↘ 4 ms queda | ||
| A tela mostra taxas de resposta rápidas em nossos testes e deve ser adequada para jogos. Em comparação, todos os dispositivos testados variam de 0.1 (mínimo) a 240 (máximo) ms. » 25 % de todos os dispositivos são melhores. Isso significa que o tempo de resposta medido é melhor que a média de todos os dispositivos testados (19.8 ms). | ||
| ↔ Tempo de resposta 50% cinza a 80% cinza | ||
| 15 ms ... ascensão ↗ e queda ↘ combinadas | ↗ 8 ms ascensão | 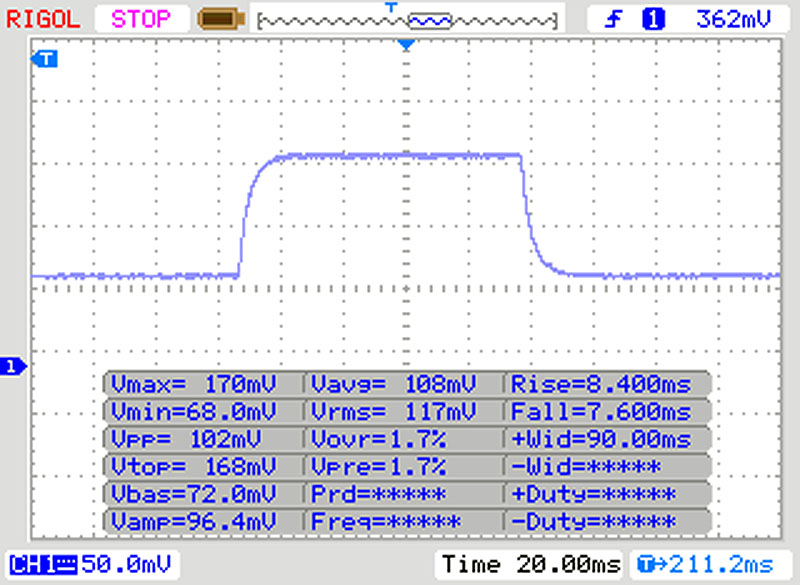 |
| ↘ 7 ms queda | ||
| A tela mostra boas taxas de resposta em nossos testes, mas pode ser muito lenta para jogadores competitivos. Em comparação, todos os dispositivos testados variam de 0.165 (mínimo) a 636 (máximo) ms. » 29 % de todos os dispositivos são melhores. Isso significa que o tempo de resposta medido é melhor que a média de todos os dispositivos testados (31 ms). | ||
Cintilação da tela / PWM (modulação por largura de pulso)
| Tela tremeluzindo / PWM não detectado | 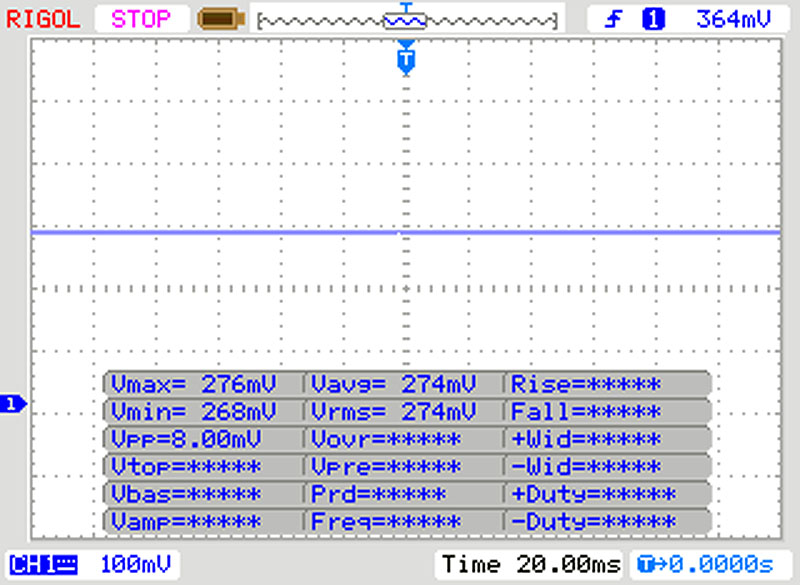 | ||
[pwm_comparison] Em comparação: 52 % de todos os dispositivos testados não usam PWM para escurecer a tela. Se PWM foi detectado, uma média de 7765 (mínimo: 5 - máximo: 343500) Hz foi medida. | |||
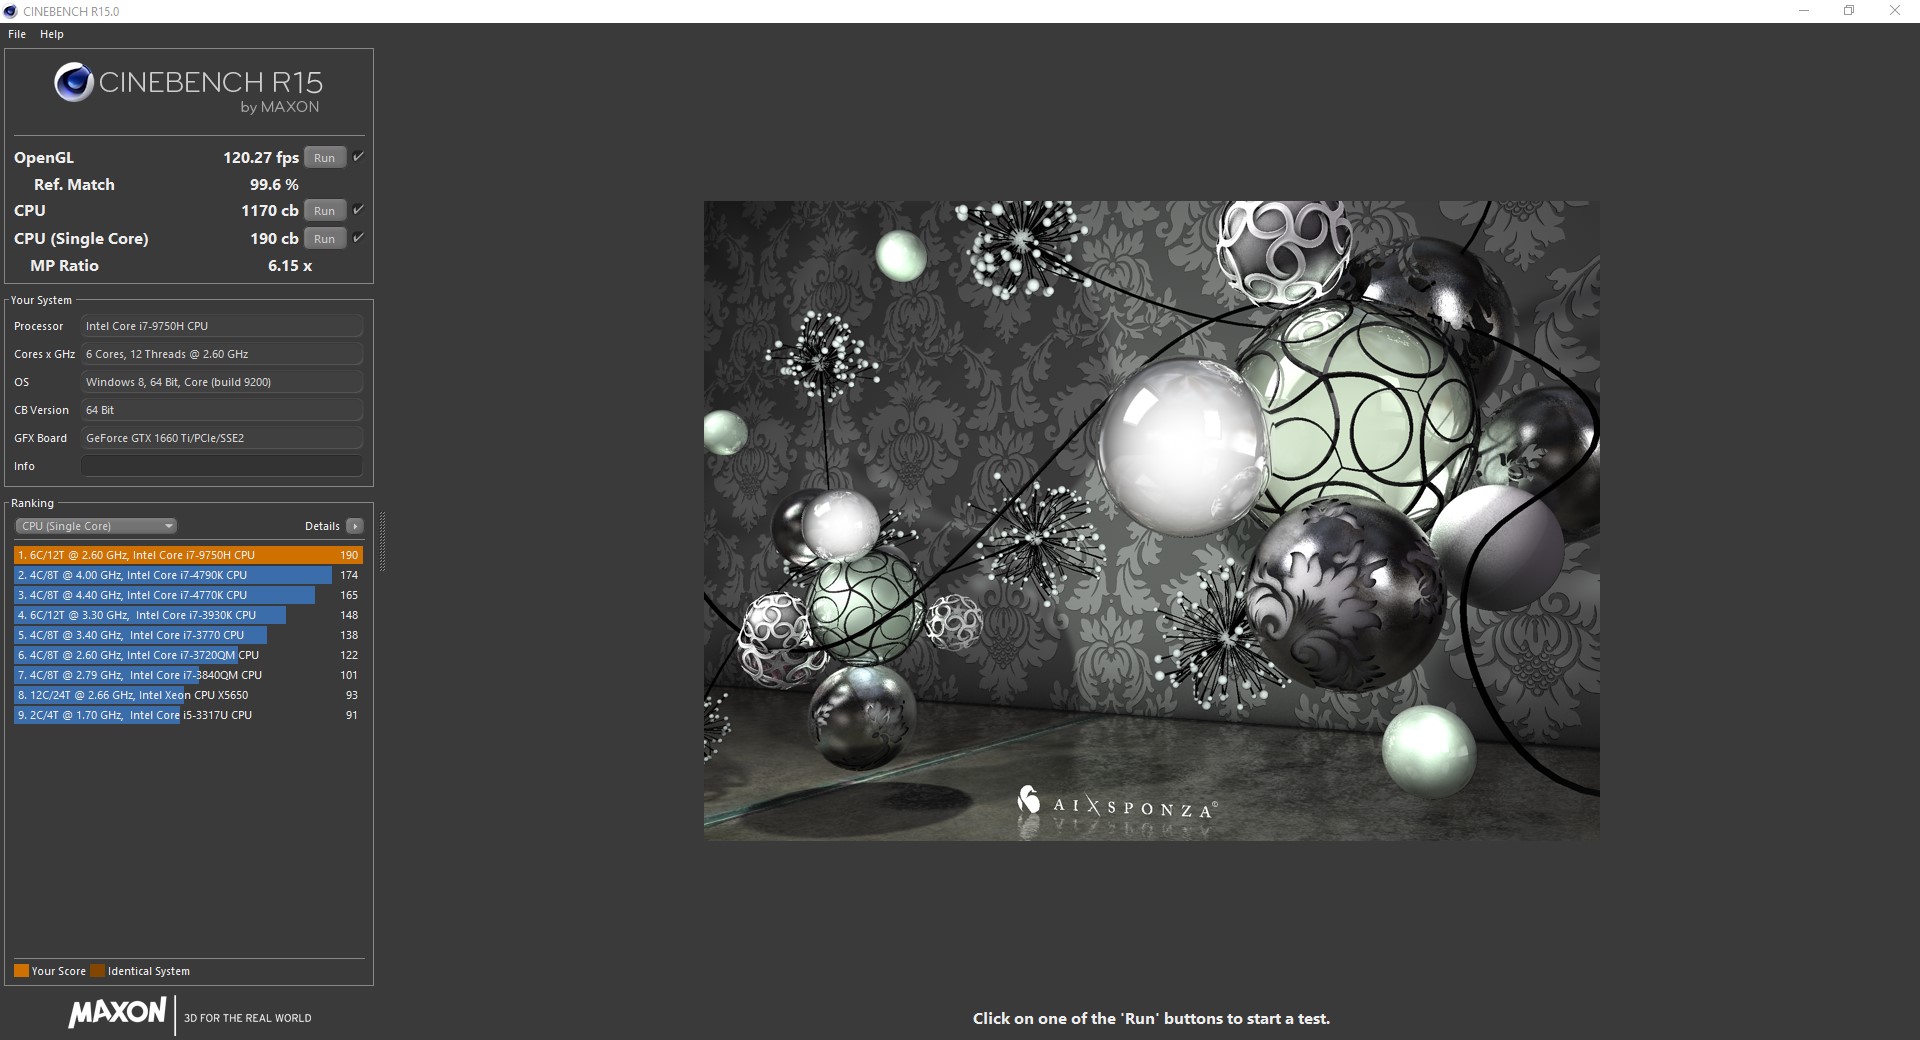
| Cinebench R15 | |
| CPU Single 64Bit | |
| Acer Predator Helios 300 PH315-52-79TY | |
| Lenovo Legion Y540-15IRH-81SX00B2GE | |
| HP Gaming Pavilion 15-dk0009ng | |
| Média Intel Core i7-9750H (170 - 194, n=82) | |
| Lenovo Legion Y740-15ICHg | |
| Acer Predator Helios 300 PH317-52-51M6 | |
| Dell G5 15 5590 | |
| CPU Multi 64Bit | |
| Dell G5 15 5590 | |
| Lenovo Legion Y740-15ICHg | |
| Média Intel Core i7-9750H (952 - 1306, n=85) | |
| Acer Predator Helios 300 PH315-52-79TY | |
| Lenovo Legion Y540-15IRH-81SX00B2GE | |
| HP Gaming Pavilion 15-dk0009ng | |
| Acer Predator Helios 300 PH317-52-51M6 | |
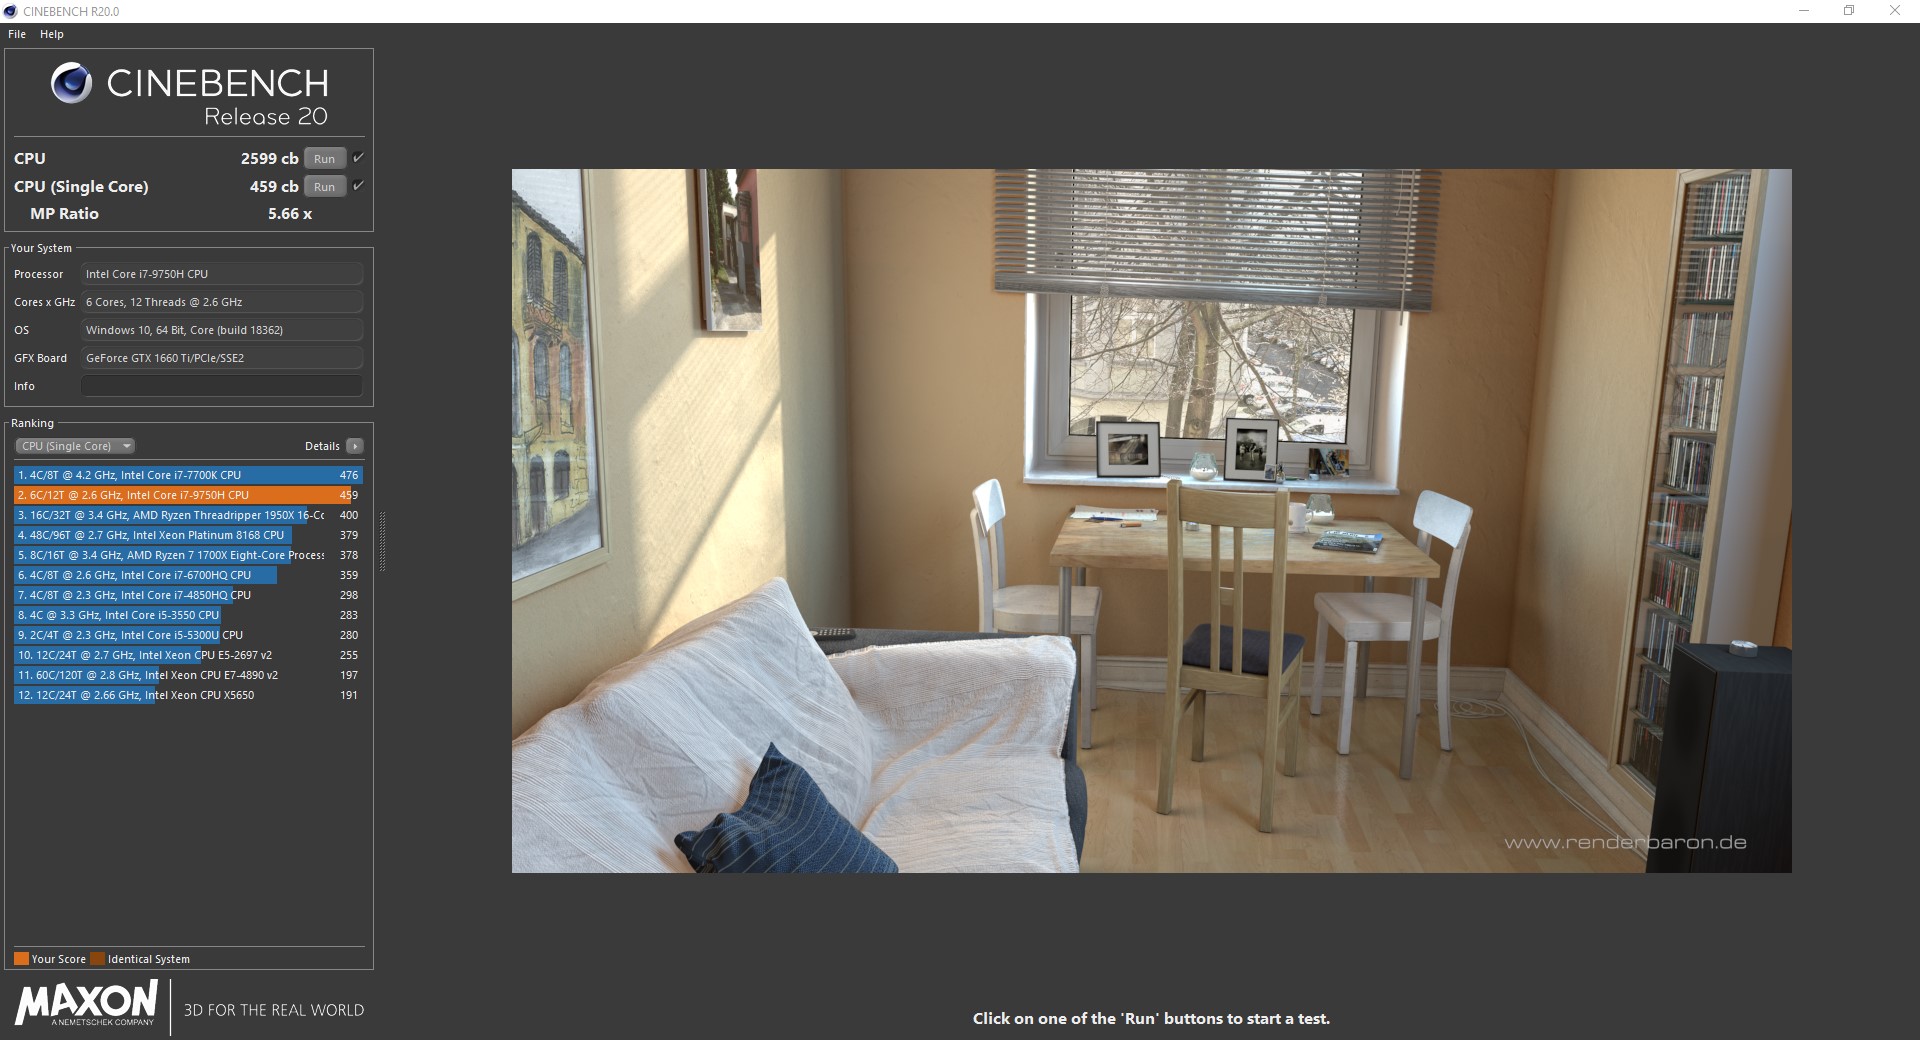
| Cinebench R20 | |
| CPU (Single Core) | |
| Acer Predator Helios 300 PH315-52-79TY | |
| Lenovo Legion Y540-15IRH-81SX00B2GE | |
| Lenovo Legion Y740-15ICHg | |
| HP Gaming Pavilion 15-dk0009ng | |
| Média Intel Core i7-9750H (416 - 486, n=55) | |
| Dell G5 15 5590 | |
| CPU (Multi Core) | |
| Dell G5 15 5590 | |
| Lenovo Legion Y740-15ICHg | |
| Acer Predator Helios 300 PH315-52-79TY | |
| Lenovo Legion Y540-15IRH-81SX00B2GE | |
| Média Intel Core i7-9750H (2017 - 3133, n=55) | |
| HP Gaming Pavilion 15-dk0009ng | |
| 3DMark 11 - 1280x720 Performance Physics | |
| HP Gaming Pavilion 15-dk0009ng | |
| Lenovo Legion Y540-15IRH-81SX00B2GE | |
| Lenovo Legion Y740-15ICHg | |
| Média Intel Core i7-9750H (9704 - 14337, n=80) | |
| Acer Predator Helios 300 PH315-52-79TY | |
| Dell G5 15 5590 | |
| Acer Predator Helios 300 PH317-52-51M6 | |
| Blender - v2.79 BMW27 CPU | |
| Acer Predator Helios 300 PH315-52-79TY | |
| Média Intel Core i7-9750H (342 - 495, n=21) | |
| Lenovo Legion Y540-15IRH-81SX00B2GE | |
| Lenovo Legion Y740-15ICHg | |
| Geekbench 4.4 | |
| 64 Bit Single-Core Score | |
| HP Gaming Pavilion 15-dk0009ng | |
| Lenovo Legion Y740-15ICHg | |
| Média Intel Core i7-9750H (4440 - 5511, n=27) | |
| Acer Predator Helios 300 PH315-52-79TY | |
| Acer Predator Helios 300 PH315-52-79TY | |
| Dell G5 15 5590 | |
| Lenovo Legion Y540-15IRH-81SX00B2GE | |
| 64 Bit Multi-Core Score | |
| HP Gaming Pavilion 15-dk0009ng | |
| Lenovo Legion Y740-15ICHg | |
| Média Intel Core i7-9750H (17054 - 25043, n=27) | |
| Dell G5 15 5590 | |
| Acer Predator Helios 300 PH315-52-79TY | |
| Acer Predator Helios 300 PH315-52-79TY | |
| Lenovo Legion Y540-15IRH-81SX00B2GE | |
| 7-Zip 18.03 | |
| 7z b 4 | |
| Lenovo Legion Y540-15IRH-81SX00B2GE | |
| Lenovo Legion Y740-15ICHg | |
| Média Intel Core i7-9750H (28512 - 35174, n=21) | |
| Acer Predator Helios 300 PH315-52-79TY | |
| 7z b 4 -mmt1 | |
| Lenovo Legion Y740-15ICHg | |
| Lenovo Legion Y540-15IRH-81SX00B2GE | |
| Média Intel Core i7-9750H (4580 - 5090, n=21) | |
| Acer Predator Helios 300 PH315-52-79TY | |
* ... menor é melhor
| PCMark 8 Home Score Accelerated v2 | 4688 pontos | |
| PCMark 8 Creative Score Accelerated v2 | 7682 pontos | |
| PCMark 8 Work Score Accelerated v2 | 5483 pontos | |
| PCMark 10 Score | 5279 pontos | |
Ajuda | ||
| Acer Predator Helios 300 PH315-52-79TY WDC PC SN720 SDAPNTW-512G | HP Gaming Pavilion 15-dk0009ng Samsung SSD PM981 MZVLB256HAHQ | Lenovo Legion Y540-15IRH-81SX00B2GE WDC PC SN720 SDAPNTW-512G | Dell G5 15 5590 KBG30ZMS128G | Lenovo Legion Y740-15ICHg WDC PC SN520 SDAPMUW-128G | Acer Predator Helios 300 PH317-52-51M6 Hynix HFS128G39TND | Média WDC PC SN720 SDAPNTW-512G | |
|---|---|---|---|---|---|---|---|
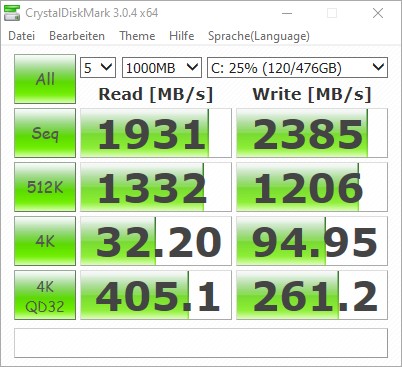
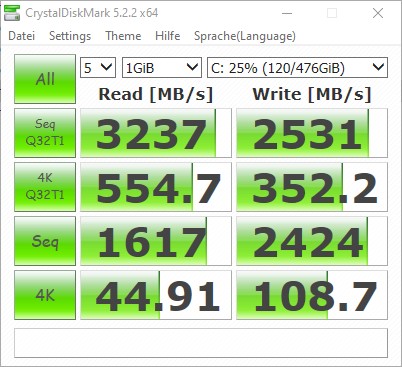
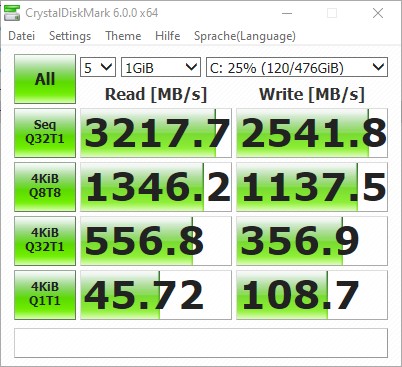
| CrystalDiskMark 5.2 / 6 | -23% | 0% | -65% | -45% | -70% | -14% | |
| Write 4K (MB/s) | 108.7 | 100 -8% | 158.8 46% | 64.3 -41% | 134.2 23% | 61.9 -43% | 110 ? 1% |
| Read 4K (MB/s) | 44.91 | 31.39 -30% | 29.11 -35% | 29.3 -35% | 37.72 -16% | 22.78 -49% | 36.9 ? -18% |
| Write Seq (MB/s) | 2424 | 1308 -46% | 1584 -35% | 131.1 -95% | 389.2 -84% | 136.1 -94% | 1976 ? -18% |
| Read Seq (MB/s) | 1617 | 1083 -33% | 1694 5% | 776 -52% | 1030 -36% | 490.1 -70% | 1710 ? 6% |
| Write 4K Q32T1 (MB/s) | 356.9 | 362.9 2% | 536 50% | 96.8 -73% | 238.9 -33% | 136.2 -62% | 339 ? -5% |
| Read 4K Q32T1 (MB/s) | 557 | 425.7 -24% | 363.9 -35% | 198.6 -64% | 343.9 -38% | 208.4 -63% | 417 ? -25% |
| Write Seq Q32T1 (MB/s) | 2542 | 1411 -44% | 2536 0% | 127.8 -95% | 789 -69% | 136 -95% | 2218 ? -13% |
| Read Seq Q32T1 (MB/s) | 3218 | 3240 1% | 3458 7% | 1044 -68% | 1502 -53% | 553 -83% | 2940 ? -9% |
| Write 4K Q8T8 (MB/s) | 1138 | 293.4 -74% | 721 ? -37% | ||||
| Read 4K Q8T8 (MB/s) | 1346 | 405.8 -70% | 993 ? -26% | ||||
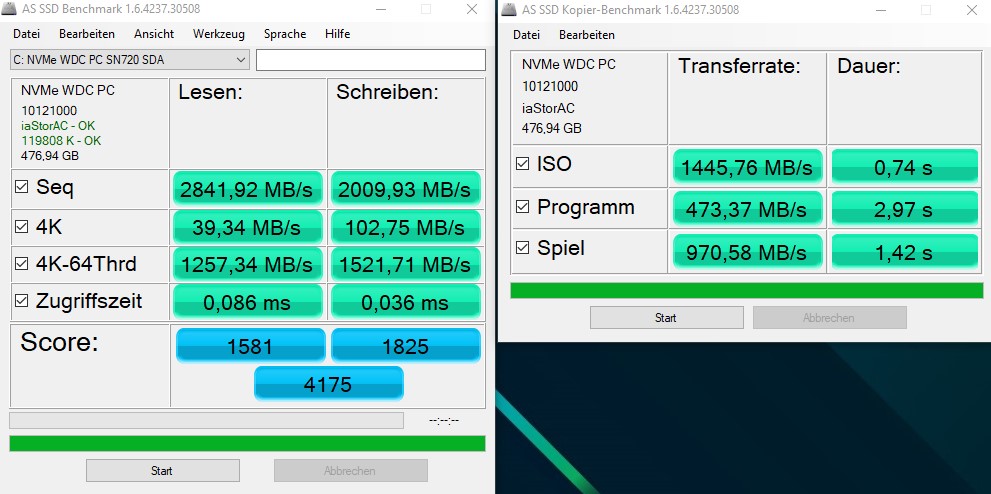
| AS SSD | -33% | 10% | -227% | -46% | -128% | -9% | |
| Seq Read (MB/s) | 2841 | 2088 -27% | 2927 3% | 1036 -64% | 1372 -52% | 513 -82% | 2544 ? -10% |
| Seq Write (MB/s) | 2009 | 1347 -33% | 2149 7% | 115.1 -94% | 746 -63% | 128.2 -94% | 2034 ? 1% |
| 4K Read (MB/s) | 39.34 | 36.14 -8% | 42.43 8% | 29.6 -25% | 35.42 -10% | 26.5 -33% | 36.5 ? -7% |
| 4K Write (MB/s) | 102.8 | 96.5 -6% | 147.1 43% | 67.8 -34% | 99.9 -3% | 62.7 -39% | 110.8 ? 8% |
| 4K-64 Read (MB/s) | 1257 | 565 -55% | 1286 2% | 184.5 -85% | 302.1 -76% | 336.6 -73% | 1112 ? -12% |
| 4K-64 Write (MB/s) | 1522 | 588 -61% | 1432 -6% | 95.2 -94% | 191.4 -87% | 120.1 -92% | 1222 ? -20% |
| Access Time Read * (ms) | 0.086 | 0.093 -8% | 0.065 24% | 1.519 -1666% | 0.132 -53% | 0.0965 ? -12% | |
| Access Time Write * (ms) | 0.036 | 0.038 -6% | 0.026 28% | 0.255 -608% | 0.037 -3% | 0.259 -619% | 0.04212 ? -17% |
| Score Read (Points) | 1581 | 810 -49% | 1621 3% | 318 -80% | 475 -70% | 414 -74% | 1403 ? -11% |
| Score Write (Points) | 1825 | 819 -55% | 1794 -2% | 174 -90% | 366 -80% | 196 -89% | 1536 ? -16% |
| Score Total (Points) | 4175 | 2014 -52% | 4208 1% | 620 -85% | 1065 -74% | 811 -81% | 3633 ? -13% |
| Copy ISO MB/s (MB/s) | 1446 | 1043 -28% | 159.2 -89% | 1062 -27% | 1506 ? 4% | ||
| Copy Program MB/s (MB/s) | 473.4 | 371.7 -21% | 94.4 -80% | 426 -10% | 410 ? -13% | ||
| Copy Game MB/s (MB/s) | 971 | 399.9 -59% | 106.3 -89% | 650 -33% | 894 ? -8% | ||
| Média Total (Programa/Configurações) | -28% /
-30% | 5% /
6% | -146% /
-168% | -46% /
-45% | -99% /
-102% | -12% /
-11% |
* ... menor é melhor

| 3DMark 11 - 1280x720 Performance GPU | |
| Média da turma Gaming (21841 - 80022, n=106, últimos 2 anos) | |
| Lenovo Legion Y740-15ICHg | |
| Dell G5 15 5590 | |
| Média NVIDIA GeForce GTX 1660 Ti Mobile (18610 - 22670, n=24) | |
| Lenovo Legion Y540-15IRH-81SX00B2GE | |
| Acer Predator Helios 300 PH315-52-79TY | |
| HP Gaming Pavilion 15-dk0009ng | |
| Acer Predator Helios 300 PH317-52-51M6 | |
| 3DMark | |
| 1280x720 Cloud Gate Standard Graphics | |
| Média da turma Gaming (86886 - 223650, n=62, últimos 2 anos) | |
| Lenovo Legion Y740-15ICHg | |
| Acer Predator Helios 300 PH315-52-79TY | |
| Dell G5 15 5590 | |
| Média NVIDIA GeForce GTX 1660 Ti Mobile (59839 - 104780, n=18) | |
| Lenovo Legion Y540-15IRH-81SX00B2GE | |
| HP Gaming Pavilion 15-dk0009ng | |
| Acer Predator Helios 300 PH317-52-51M6 | |
| 1920x1080 Fire Strike Graphics | |
| Média da turma Gaming (12242 - 62849, n=118, últimos 2 anos) | |
| Lenovo Legion Y740-15ICHg | |
| Dell G5 15 5590 | |
| Média NVIDIA GeForce GTX 1660 Ti Mobile (14186 - 16488, n=24) | |
| Acer Predator Helios 300 PH315-52-79TY | |
| Lenovo Legion Y540-15IRH-81SX00B2GE | |
| HP Gaming Pavilion 15-dk0009ng | |
| Acer Predator Helios 300 PH317-52-51M6 | |
| 2560x1440 Time Spy Graphics | |
| Média da turma Gaming (5012 - 26212, n=117, últimos 2 anos) | |
| Lenovo Legion Y740-15ICHg | |
| Dell G5 15 5590 | |
| Média NVIDIA GeForce GTX 1660 Ti Mobile (5335 - 6123, n=22) | |
| Acer Predator Helios 300 PH315-52-79TY | |
| HP Gaming Pavilion 15-dk0009ng | |
| 3DMark 11 Performance | 16344 pontos | |
| 3DMark Ice Storm Standard Score | 106089 pontos | |
| 3DMark Cloud Gate Standard Score | 35033 pontos | |
| 3DMark Fire Strike Score | 12903 pontos | |
| 3DMark Fire Strike Extreme Score | 6532 pontos | |
| 3DMark Time Spy Score | 5615 pontos | |
Ajuda | ||
| The Witcher 3 | |
| 1024x768 Low Graphics & Postprocessing | |
| Média da turma Gaming (389 - 686, n=3, últimos 2 anos) | |
| Lenovo Legion Y740-15ICHg | |
| Média NVIDIA GeForce GTX 1660 Ti Mobile (177.3 - 298, n=14) | |
| HP Gaming Pavilion 15-dk0009ng | |
| Dell G5 15 5590 | |
| Acer Predator Helios 300 PH315-52-79TY | |
| 1366x768 Medium Graphics & Postprocessing | |
| Média da turma Gaming (295 - 517, n=3, últimos 2 anos) | |
| Lenovo Legion Y740-15ICHg | |
| Média NVIDIA GeForce GTX 1660 Ti Mobile (148 - 200, n=14) | |
| Dell G5 15 5590 | |
| HP Gaming Pavilion 15-dk0009ng | |
| Acer Predator Helios 300 PH315-52-79TY | |
| 1920x1080 High Graphics & Postprocessing (Nvidia HairWorks Off) | |
| Média da turma Gaming (181 - 341, n=3, últimos 2 anos) | |
| Lenovo Legion Y740-15ICHg | |
| Dell G5 15 5590 | |
| Média NVIDIA GeForce GTX 1660 Ti Mobile (93 - 120.4, n=17) | |
| HP Gaming Pavilion 15-dk0009ng | |
| Acer Predator Helios 300 PH315-52-79TY | |
| Acer Predator Helios 300 PH317-52-51M6 | |
| baixo | média | alto | ultra | |
|---|---|---|---|---|
| BioShock Infinite (2013) | 283 | 241 | 237 | 128 |
| The Witcher 3 (2015) | 204 | 151 | 93 | 54.6 |
| Dota 2 Reborn (2015) | 119.4 | 110.4 | 103.3 | 94.6 |
| Rise of the Tomb Raider (2016) | 118 | 116 | 86 | 74 |
| X-Plane 11.11 (2018) | 83 | 76 | 64 |
Barulho
| Ocioso |
| 31 / 31 / 31 dB |
| Carga |
| 41.5 / 46.9 dB |
 | ||
30 dB silencioso 40 dB(A) audível 50 dB(A) ruidosamente alto |
||
min: | ||
| Acer Predator Helios 300 PH315-52-79TY GeForce GTX 1660 Ti Mobile, i7-9750H, WDC PC SN720 SDAPNTW-512G | HP Gaming Pavilion 15-dk0009ng GeForce GTX 1660 Ti Max-Q, i7-9750H, Samsung SSD PM981 MZVLB256HAHQ | Lenovo Legion Y540-15IRH-81SX00B2GE GeForce GTX 1660 Ti Mobile, i7-9750H, WDC PC SN720 SDAPNTW-512G | Dell G5 15 5590 GeForce RTX 2060 Mobile, i7-8750H, KBG30ZMS128G | Lenovo Legion Y740-15ICHg GeForce RTX 2070 Max-Q, i7-9750H, WDC PC SN520 SDAPMUW-128G | Acer Predator Helios 300 PH317-52-51M6 GeForce GTX 1050 Ti Mobile, i5-8300H, Hynix HFS128G39TND | |
|---|---|---|---|---|---|---|
| Noise | 12% | 6% | -2% | 1% | -1% | |
| desligado / ambiente * (dB) | 30.2 | 28.2 7% | 29.3 3% | 30.4 -1% | 30 1% | 29 4% |
| Idle Minimum * (dB) | 31 | 29.3 5% | 29.3 5% | 30.4 2% | 31.3 -1% | 29 6% |
| Idle Average * (dB) | 31 | 29.3 5% | 29.3 5% | 30.4 2% | 31.3 -1% | 31 -0% |
| Idle Maximum * (dB) | 31 | 29.3 5% | 29.3 5% | 33.4 -8% | 31.3 -1% | 33 -6% |
| Load Average * (dB) | 41.5 | 32.3 22% | 35.7 14% | 42 -1% | 42 -1% | 45 -8% |
| Witcher 3 ultra * (dB) | 46.7 | 34 27% | 44.2 5% | 42.1 10% | 45 4% | |
| Load Maximum * (dB) | 46.9 | 41.2 12% | 45.6 3% | 48.7 -4% | 46.5 1% | 51 -9% |
* ... menor é melhor
(-) A temperatura máxima no lado superior é 52 °C / 126 F, em comparação com a média de 40.4 °C / 105 F , variando de 21.2 a 68.8 °C para a classe Gaming.
(-) A parte inferior aquece até um máximo de 46.3 °C / 115 F, em comparação com a média de 43.2 °C / 110 F
(+) Em uso inativo, a temperatura média para o lado superior é 24.1 °C / 75 F, em comparação com a média do dispositivo de 33.9 °C / ### class_avg_f### F.
(±) Jogando The Witcher 3, a temperatura média para o lado superior é 38 °C / 100 F, em comparação com a média do dispositivo de 33.9 °C / ## #class_avg_f### F.
(+) Os apoios para as mãos e o touchpad estão atingindo a temperatura máxima da pele (33 °C / 91.4 F) e, portanto, não estão quentes.
(-) A temperatura média da área do apoio para as mãos de dispositivos semelhantes foi 28.8 °C / 83.8 F (-4.2 °C / -7.6 F).
| Acer Predator Helios 300 PH315-52-79TY GeForce GTX 1660 Ti Mobile, i7-9750H, WDC PC SN720 SDAPNTW-512G | HP Gaming Pavilion 15-dk0009ng GeForce GTX 1660 Ti Max-Q, i7-9750H, Samsung SSD PM981 MZVLB256HAHQ | Lenovo Legion Y540-15IRH-81SX00B2GE GeForce GTX 1660 Ti Mobile, i7-9750H, WDC PC SN720 SDAPNTW-512G | Dell G5 15 5590 GeForce RTX 2060 Mobile, i7-8750H, KBG30ZMS128G | Lenovo Legion Y740-15ICHg GeForce RTX 2070 Max-Q, i7-9750H, WDC PC SN520 SDAPMUW-128G | Acer Predator Helios 300 PH317-52-51M6 GeForce GTX 1050 Ti Mobile, i5-8300H, Hynix HFS128G39TND | |
|---|---|---|---|---|---|---|
| Heat | 1% | -23% | -5% | -26% | -15% | |
| Maximum Upper Side * (°C) | 52 | 46.7 10% | 42.7 18% | 51.5 1% | 43.9 16% | 50 4% |
| Maximum Bottom * (°C) | 46.3 | 53.7 -16% | 52.7 -14% | 48.3 -4% | 47.6 -3% | 52 -12% |
| Idle Upper Side * (°C) | 24.8 | 23.8 4% | 33.1 -33% | 27.2 -10% | 38.6 -56% | 33 -33% |
| Idle Bottom * (°C) | 25.4 | 23.7 7% | 41 -61% | 27.4 -8% | 40.8 -61% | 30 -18% |
* ... menor é melhor
Acer Predator Helios 300 PH315-52-79TY análise de áudio
(-) | alto-falantes não muito altos (###valor### dB)
Graves 100 - 315Hz
(-) | quase nenhum baixo - em média 22.4% menor que a mediana
(±) | a linearidade dos graves é média (12.4% delta para a frequência anterior)
Médios 400 - 2.000 Hz
(+) | médios equilibrados - apenas 3.8% longe da mediana
(±) | a linearidade dos médios é média (9.8% delta para frequência anterior)
Altos 2 - 16 kHz
(+) | agudos equilibrados - apenas 2% longe da mediana
(+) | os máximos são lineares (6.9% delta da frequência anterior)
Geral 100 - 16.000 Hz
(±) | a linearidade do som geral é média (21.4% diferença em relação à mediana)
Comparado com a mesma classe
» 77% de todos os dispositivos testados nesta classe foram melhores, 5% semelhantes, 18% piores
» O melhor teve um delta de 6%, a média foi 18%, o pior foi 132%
Comparado com todos os dispositivos testados
» 60% de todos os dispositivos testados foram melhores, 7% semelhantes, 33% piores
» O melhor teve um delta de 4%, a média foi 24%, o pior foi 134%
Lenovo Legion Y540-15IRH-81SX00B2GE análise de áudio
(±) | o volume do alto-falante é médio, mas bom (###valor### dB)
Graves 100 - 315Hz
(-) | quase nenhum baixo - em média 17.7% menor que a mediana
(±) | a linearidade dos graves é média (11.6% delta para a frequência anterior)
Médios 400 - 2.000 Hz
(+) | médios equilibrados - apenas 3.7% longe da mediana
(+) | médios são lineares (4.5% delta para frequência anterior)
Altos 2 - 16 kHz
(+) | agudos equilibrados - apenas 3.3% longe da mediana
(+) | os máximos são lineares (5.9% delta da frequência anterior)
Geral 100 - 16.000 Hz
(±) | a linearidade do som geral é média (18.1% diferença em relação à mediana)
Comparado com a mesma classe
» 57% de todos os dispositivos testados nesta classe foram melhores, 8% semelhantes, 35% piores
» O melhor teve um delta de 6%, a média foi 18%, o pior foi 132%
Comparado com todos os dispositivos testados
» 38% de todos os dispositivos testados foram melhores, 8% semelhantes, 54% piores
» O melhor teve um delta de 4%, a média foi 24%, o pior foi 134%
| desligado | |
| Ocioso | |
| Carga |
|
Key:
min: | |
| Acer Predator Helios 300 PH315-52-79TY i7-9750H, GeForce GTX 1660 Ti Mobile, WDC PC SN720 SDAPNTW-512G, IPS, 1920x1080, 15.6" | HP Gaming Pavilion 15-dk0009ng i7-9750H, GeForce GTX 1660 Ti Max-Q, Samsung SSD PM981 MZVLB256HAHQ, IPS, 1920x1080, 15.6" | Lenovo Legion Y540-15IRH-81SX00B2GE i7-9750H, GeForce GTX 1660 Ti Mobile, WDC PC SN720 SDAPNTW-512G, IPS, 1920x1080, 15.6" | Dell G5 15 5590 i7-8750H, GeForce RTX 2060 Mobile, KBG30ZMS128G, IPS, 1920x1080, 15.6" | Lenovo Legion Y740-15ICHg i7-9750H, GeForce RTX 2070 Max-Q, WDC PC SN520 SDAPMUW-128G, IPS, 1920x1080, 15.6" | Acer Predator Helios 300 PH317-52-51M6 i5-8300H, GeForce GTX 1050 Ti Mobile, Hynix HFS128G39TND, IPS, 1920x1080, 17.3" | Média NVIDIA GeForce GTX 1660 Ti Mobile | Média da turma Gaming | |
|---|---|---|---|---|---|---|---|---|
| Power Consumption | 31% | 9% | 34% | -16% | 38% | 7% | -5% | |
| Idle Minimum * (Watt) | 17.2 | 6.8 60% | 14.5 16% | 3.5 80% | 22.2 -29% | 6 65% | 12.4 ? 28% | 13.2 ? 23% |
| Idle Average * (Watt) | 22.6 | 10.7 53% | 18.5 18% | 6.9 69% | 24.9 -10% | 9 60% | 18 ? 20% | 18.9 ? 16% |
| Idle Maximum * (Watt) | 25.5 | 12.5 51% | 20 22% | 8.5 67% | 30.6 -20% | 13 49% | 25.3 ? 1% | 24.5 ? 4% |
| Load Average * (Watt) | 88 | 87.2 1% | 81.6 7% | 127 -44% | 101 -15% | 95 -8% | 93.5 ? -6% | 108.8 ? -24% |
| Load Maximum * (Watt) | 177 | 191.4 -8% | 208.1 -18% | 179 -1% | 186 -5% | 134 24% | 191.9 ? -8% | 254 ? -44% |
| Witcher 3 ultra * (Watt) | 121 | 132 | 143 | 102 |
* ... menor é melhor


| Acer Predator Helios 300 PH315-52-79TY i7-9750H, GeForce GTX 1660 Ti Mobile, 58.75 Wh | HP Gaming Pavilion 15-dk0009ng i7-9750H, GeForce GTX 1660 Ti Max-Q, 52.5 Wh | Lenovo Legion Y540-15IRH-81SX00B2GE i7-9750H, GeForce GTX 1660 Ti Mobile, 57 Wh | Dell G5 15 5590 i7-8750H, GeForce RTX 2060 Mobile, 60 Wh | Lenovo Legion Y740-15ICHg i7-9750H, GeForce RTX 2070 Max-Q, 57 Wh | Acer Predator Helios 300 PH317-52-51M6 i5-8300H, GeForce GTX 1050 Ti Mobile, 48 Wh | Média da turma Gaming | |
|---|---|---|---|---|---|---|---|
| Duração da bateria | 44% | -14% | 149% | -14% | 82% | 85% | |
| Reader / Idle (h) | 5 | 8.7 74% | 4 -20% | 14.8 196% | 11.8 136% | 8.71 ? 74% | |
| H.264 (h) | 3.4 | 5.3 56% | 8.4 147% | 8.28 ? 144% | |||
| WiFi v1.3 (h) | 3.5 | 4.8 37% | 2.4 -31% | 7.7 120% | 3 -14% | 5.9 69% | 6.96 ? 99% |
| Load (h) | 1.2 | 1.3 8% | 1.3 8% | 2.8 133% | 1.7 42% | 1.47 ? 23% | |
| Witcher 3 ultra (h) | 1 |
Pro
Contra
Veredicto - Um poderoso portátil para jogos 1080p com falhas
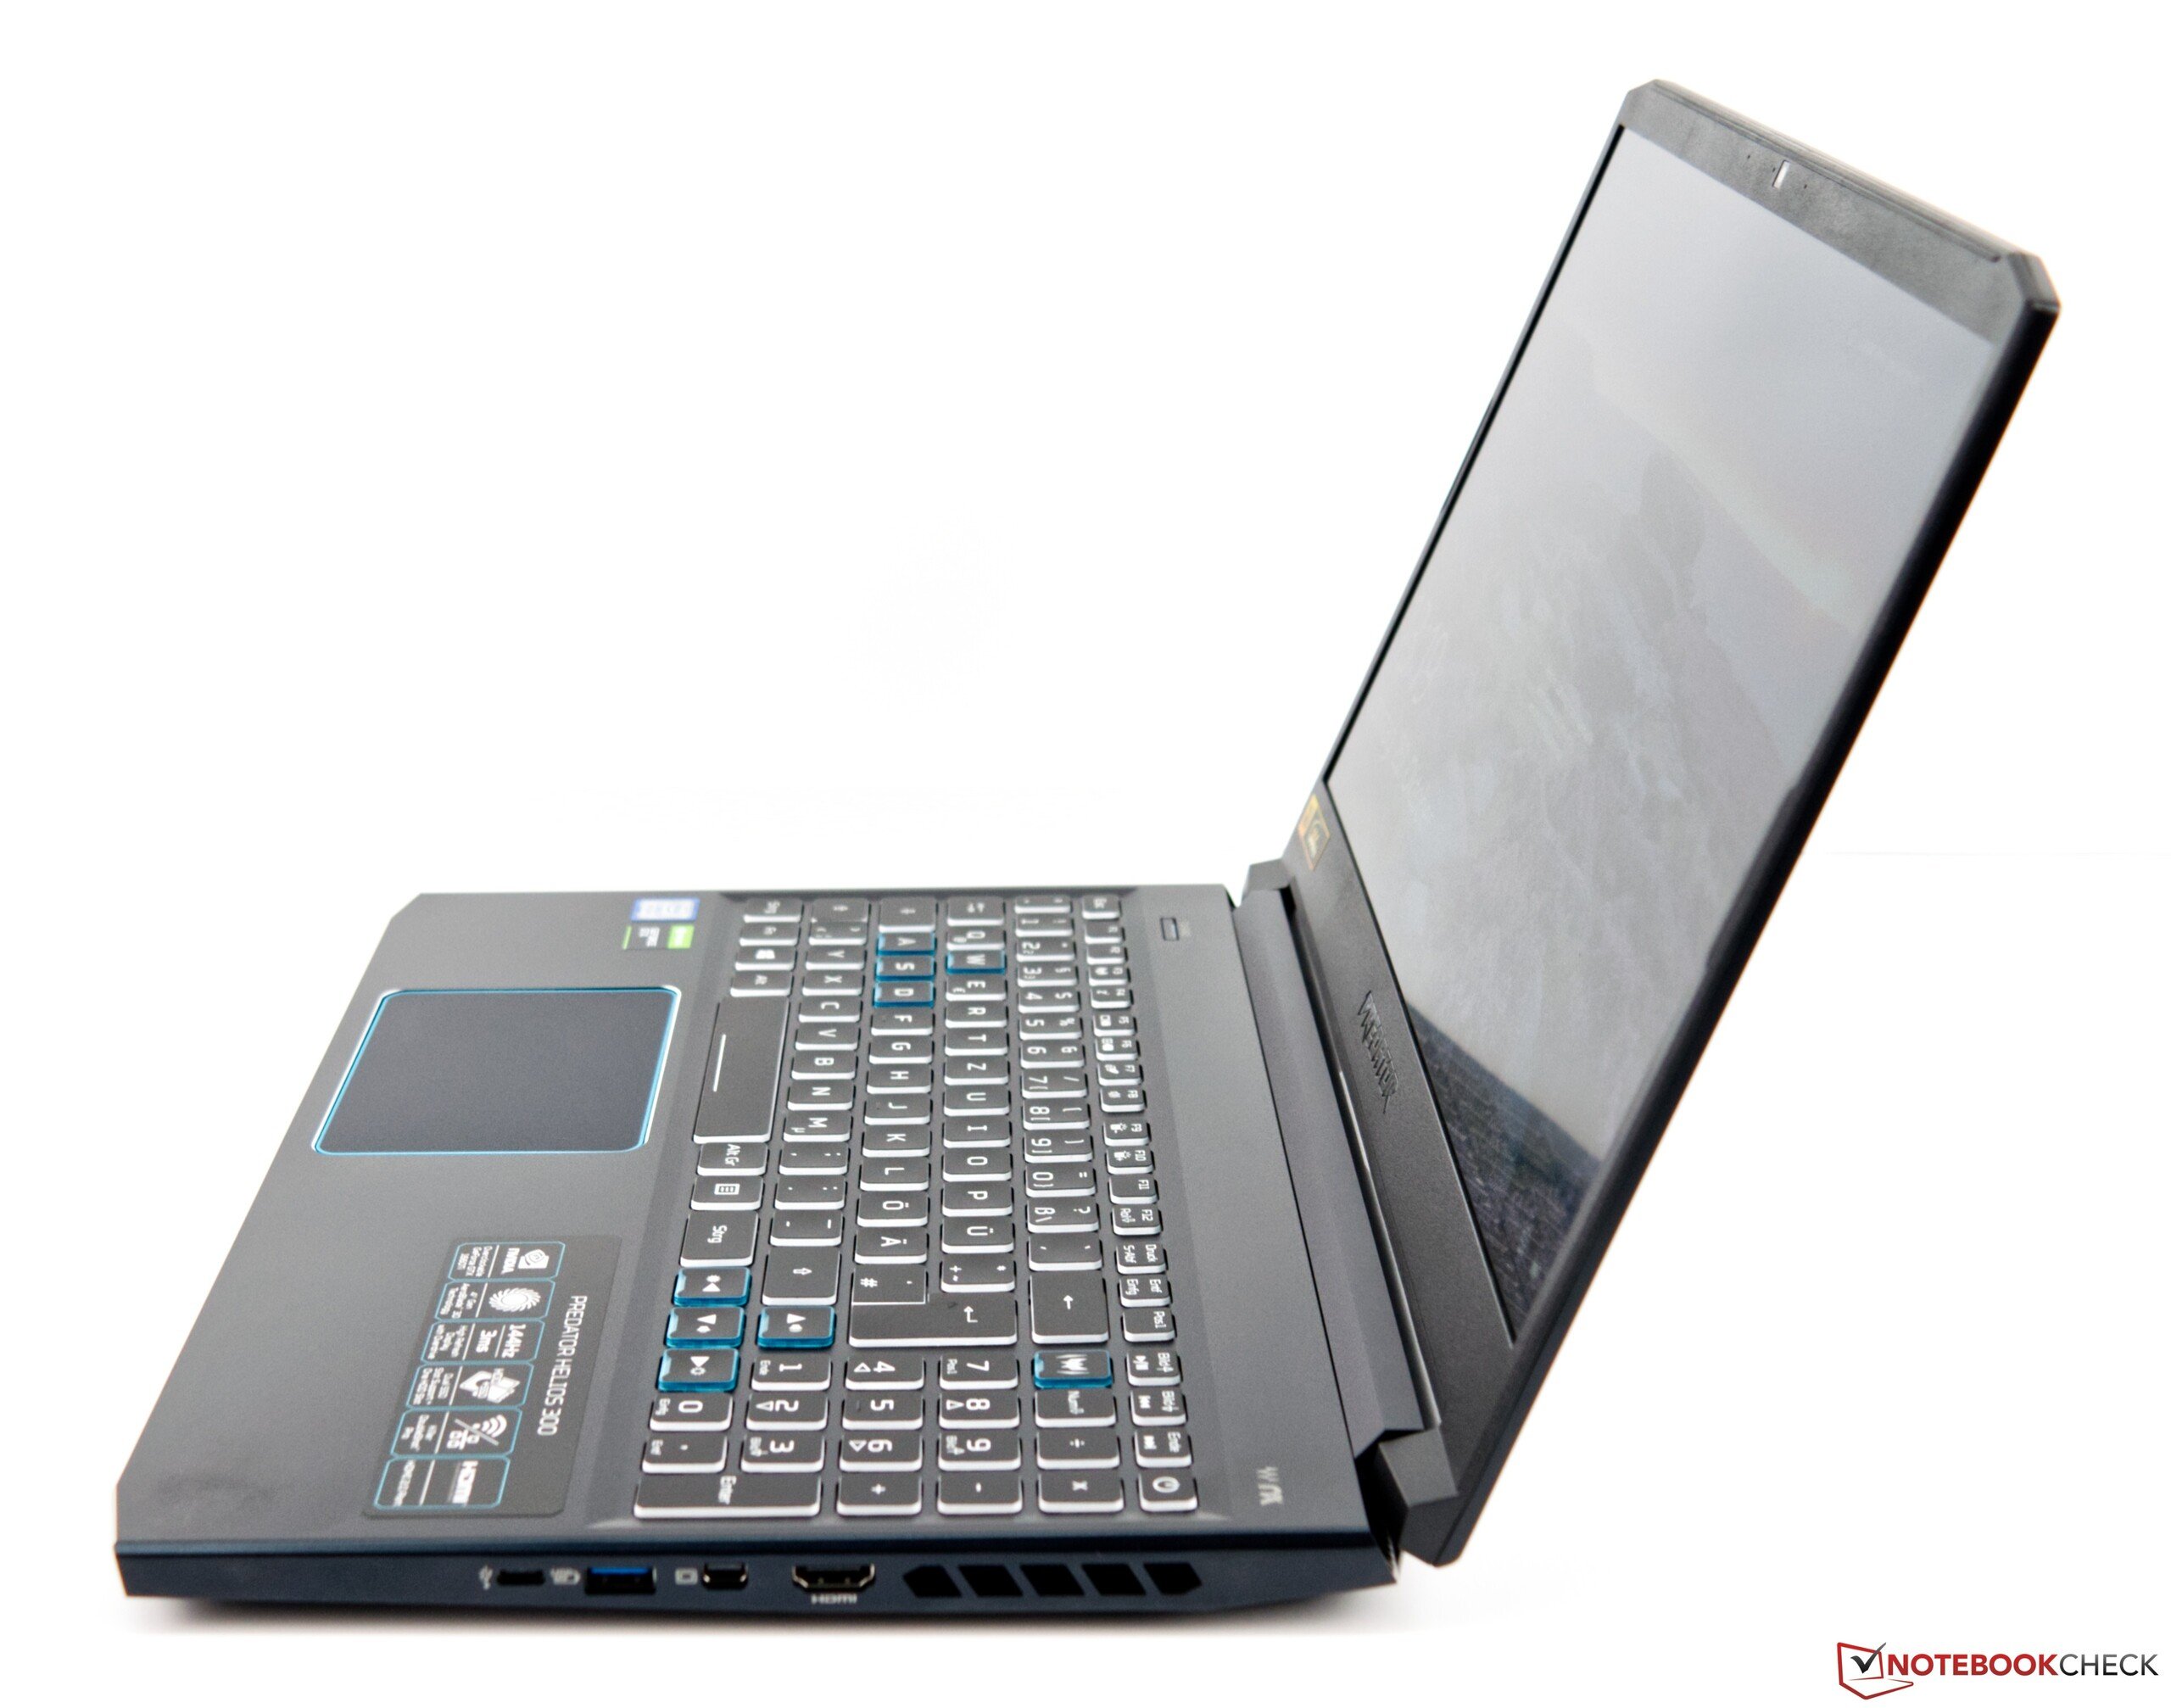
O Acer Predator Helios 300 PH315 é um portátil moderno para jogos com desempenho de jogos aceitável. O modelo básico não tem preço competitivo em torno de € 1.400 (~ US$ 1.550). No entanto, o portátil de 15 polegadas revisado é bem projetado e possui hardware que pode lidar com todos os jogos triple A atuais de forma nativa a 1080p.
Embora gostemos sempre de ver os OEMs incluírem painéis de 144 Hz em seus portáteis para jogos, as telas com alta taxa de atualização agora se tornaram a norma. No entanto, aquela em nossa unidade de análise nos deixou um sabor amargo. Por um lado, é brilhante e com cores precisas, ambas qualidades louváveis. Por outro lado, sofre de bleeding desagradável da luz de fundo, algo que não esperávamos em um portátil tão caro. Separadamente, a inclusão de 512 GB de armazenamento em um portátil para jogos parece um pouco mesquinha; portanto, recomendamos a opção de 1 TB, se possível. Caso contrário, poderá ser necessário adicionar rapidamente uma segunda unidade, principalmente por alguns jogos que agora exigem mais de 100 GB de espaço.
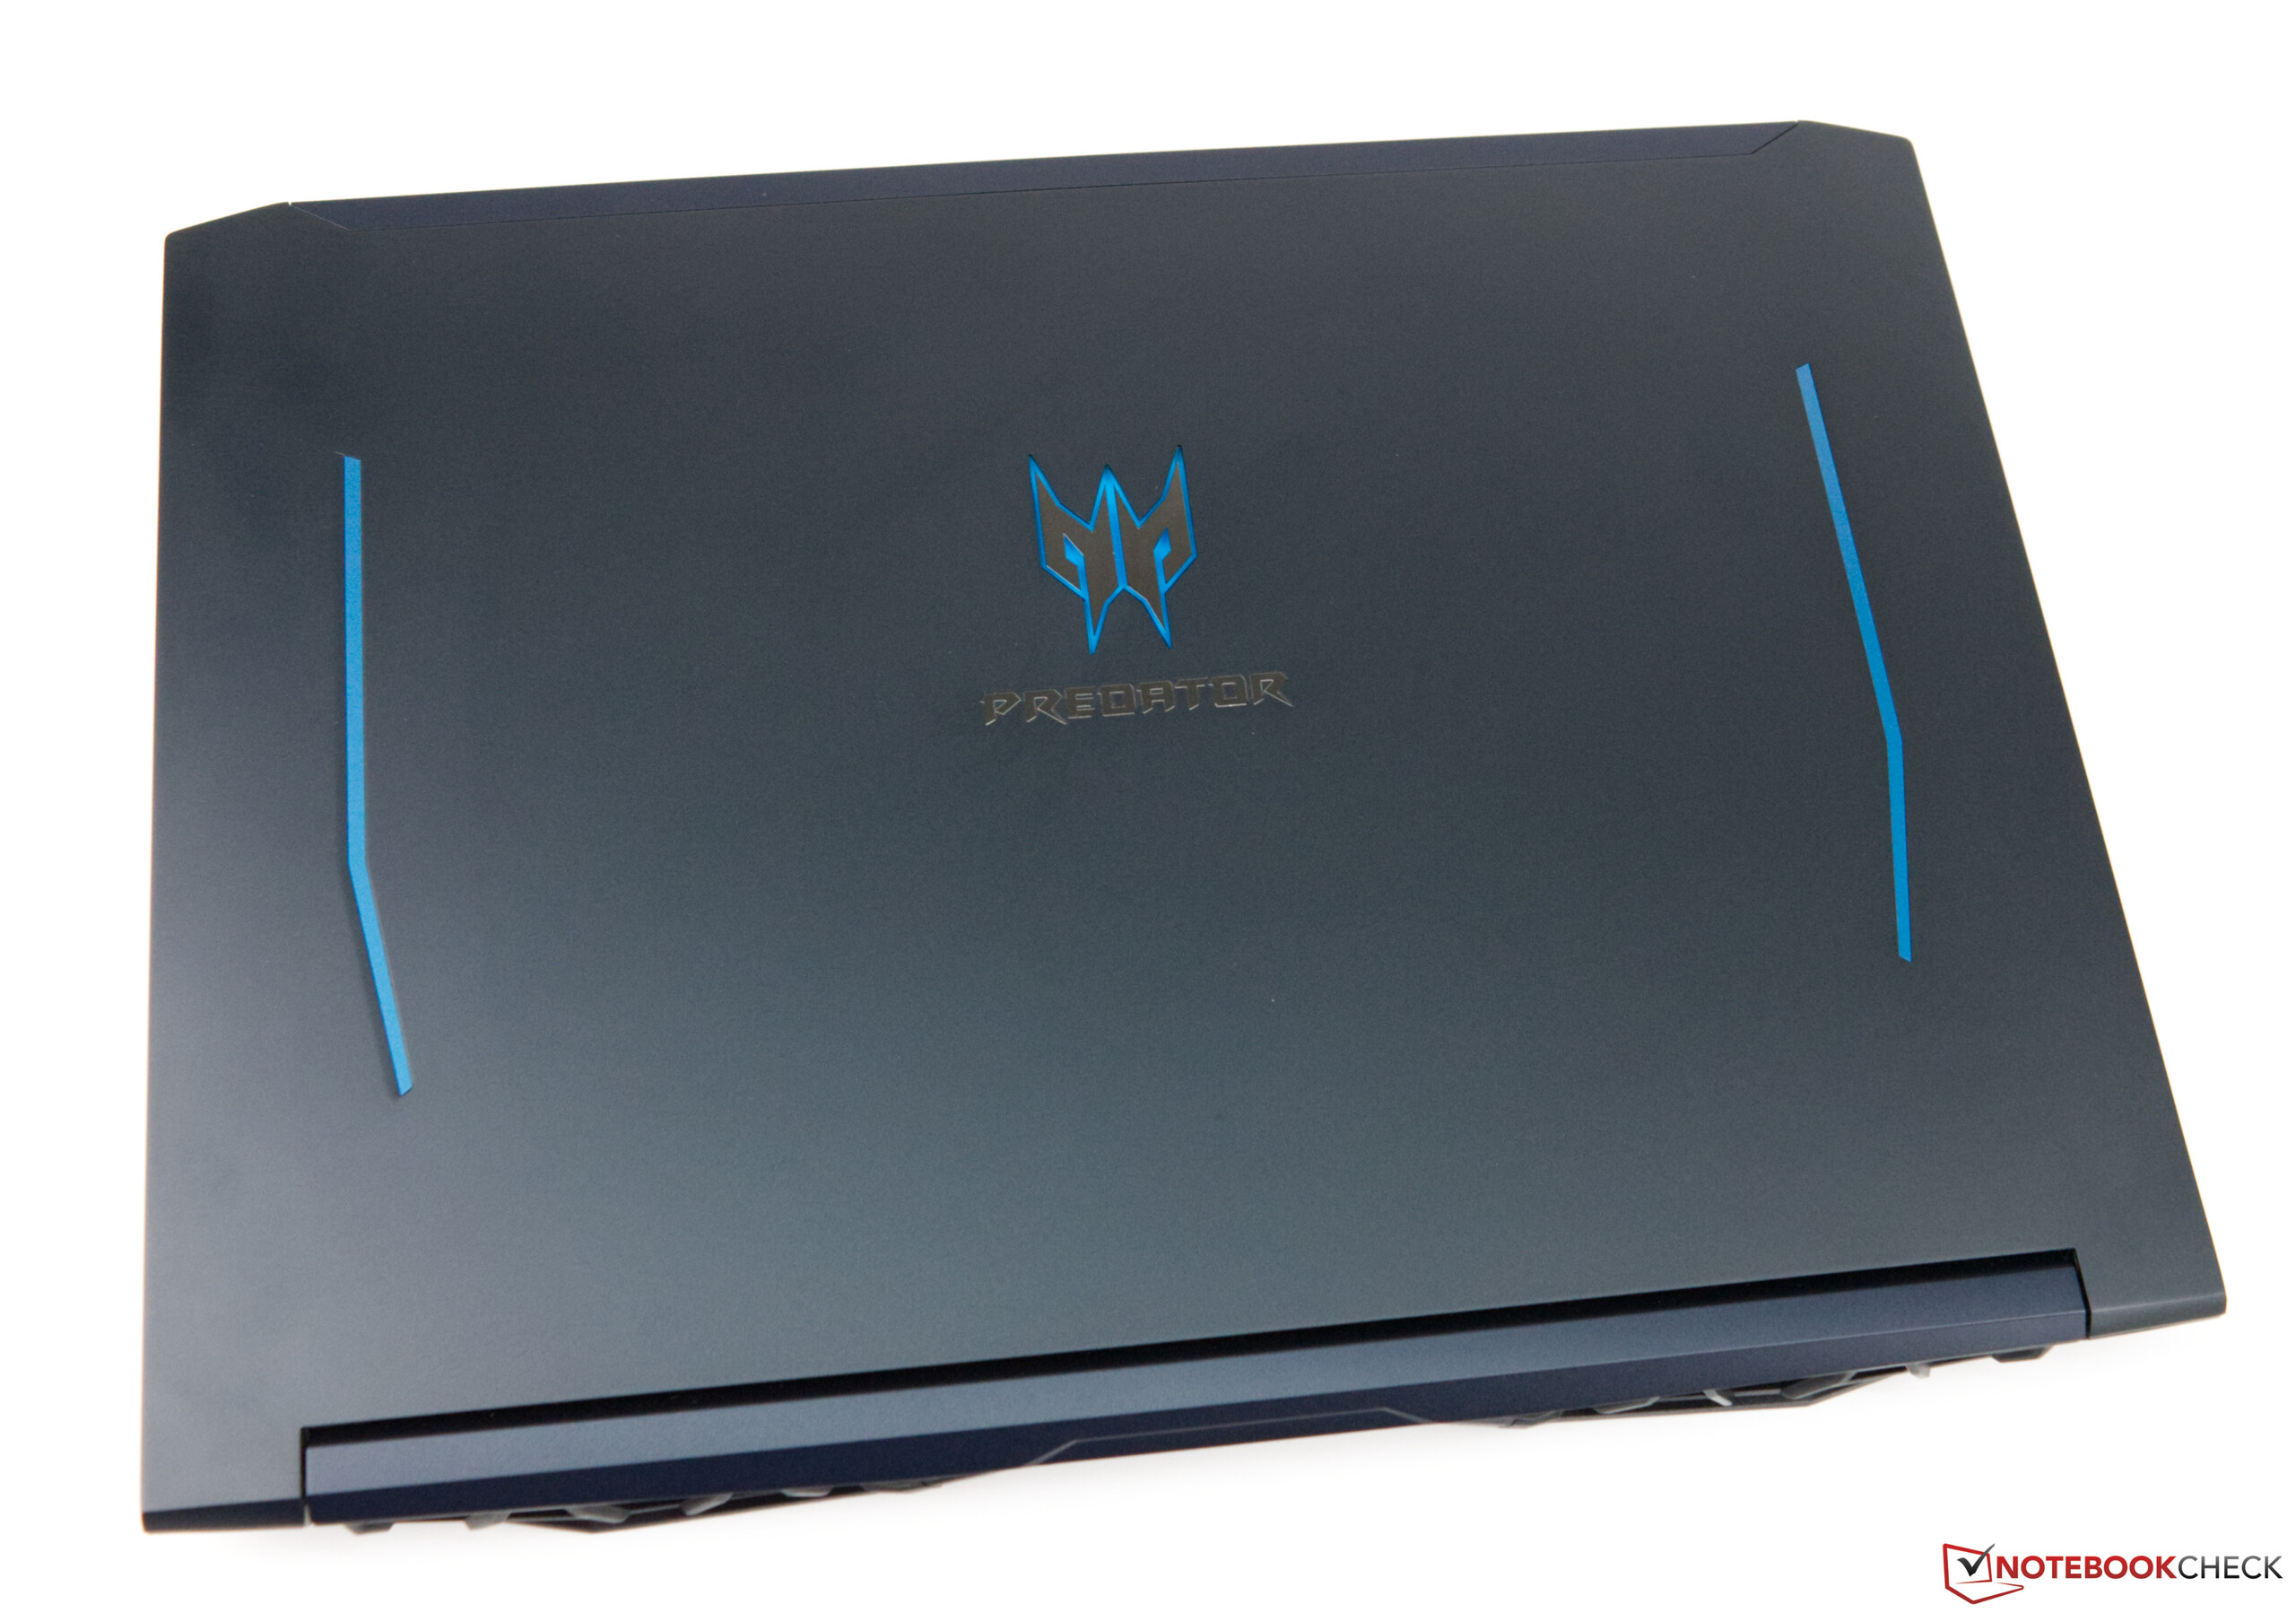
O Acer Predator Helios 300 PH315 é um sólido portátil para jogos de nível básico, com uma nova aparência. No entanto, algumas deficiências permanecem.
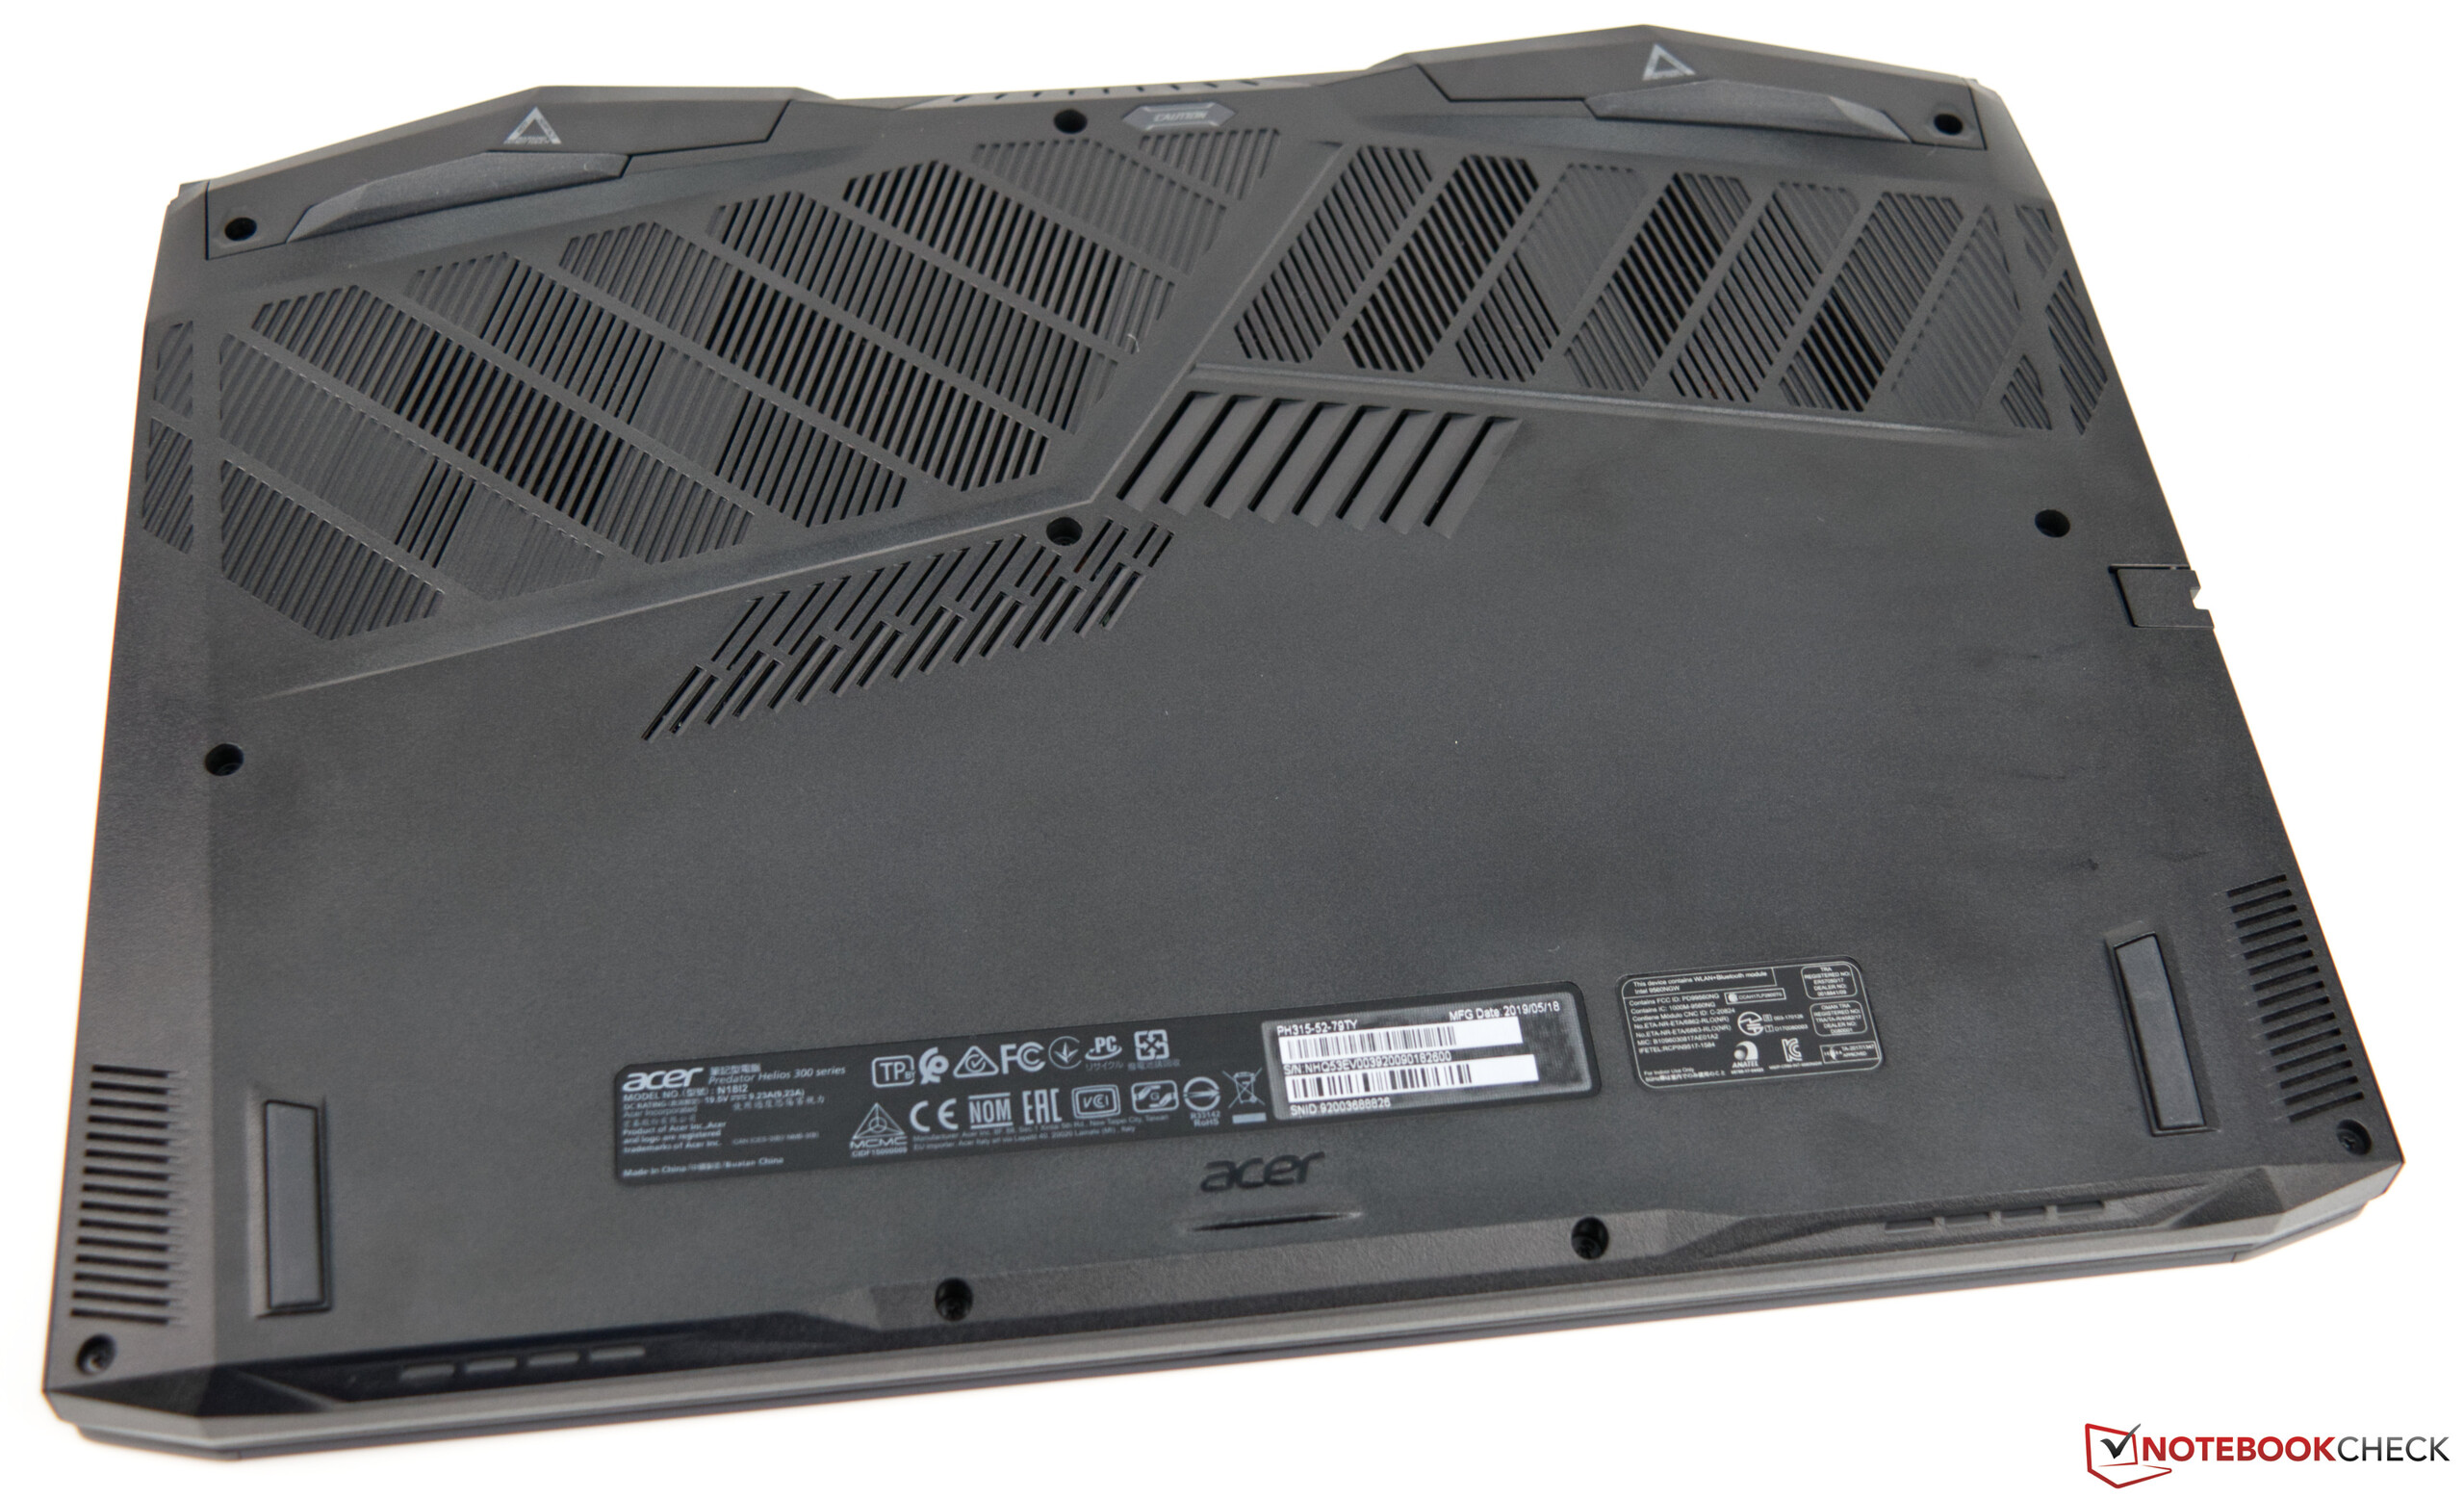
A atualização de unidades adicionais é relativamente simples, com as baias das unidades escondidas atrás de uma placa inferior que é fácil de remover. Embora não tenhamos praticamente nenhuma crítica sobre a qualidade da construção, o Helios 300 PH315 consome mais energia do que deveria, em nossa opinião. No geral, embora o dispositivo tenha algumas desvantagens, como a curta duração da bateria e alto-falantes, ele é, em última análise, um portátil de jogos decente.
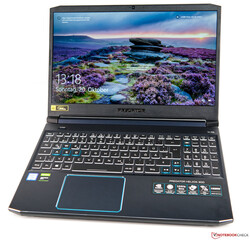
The Acer Predator Helios 300 PH315 is a modern gaming laptop with acceptable gaming performance. The entry-level model is not competitively priced at around €1,400 (~US$1,550), though. Nevertheless, the overhauled 15-inch laptop is well designed and features hardware that can handle all current triple-A games natively at 1080p.
While we always like seeing OEMs include 144 Hz panels on their gaming laptops, high refresh rate displays have now become the norm. However, the one in our review unit left us with a bit of a sour aftertaste. On the one hand, it is bright and colour accurate, both laudable qualities. On the other, it suffers from obnoxious backlight bleeding, something that we would not have expected on such an expensive laptop. Separately, including 512 GB of storage on a gaming laptop feels rather stingy, so we would recommend choosing the 1 TB option if possible. Otherwise, you may find yourself quickly needing to add a second drive, especially with some games now requiring over 100 GB of space.
The Acer Predator Helios 300 PH315 is a solid entry-level gaming laptop in a new guise. Some shortcomings remain, though.
Retrofitting additional drives is relatively simple to do, with the drive bays hiding behind a bottom plate that is easy to remove. While we have hardly any criticisms about build quality, the Helios 300 PH315 consumes more power than it should in our opinion. Overall, while the device has some downsides like short battery life and sub-par speakers, it is ultimately a decent gaming laptop.
Acer Predator Helios 300 PH315-52-79TY
- 05/15/2020 v7 (old)
Sebastian Bade
Price comparison
