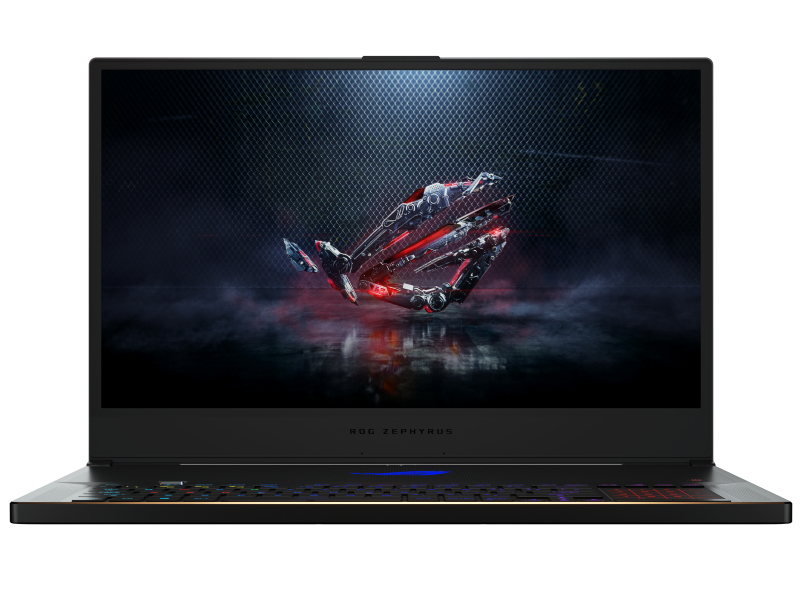
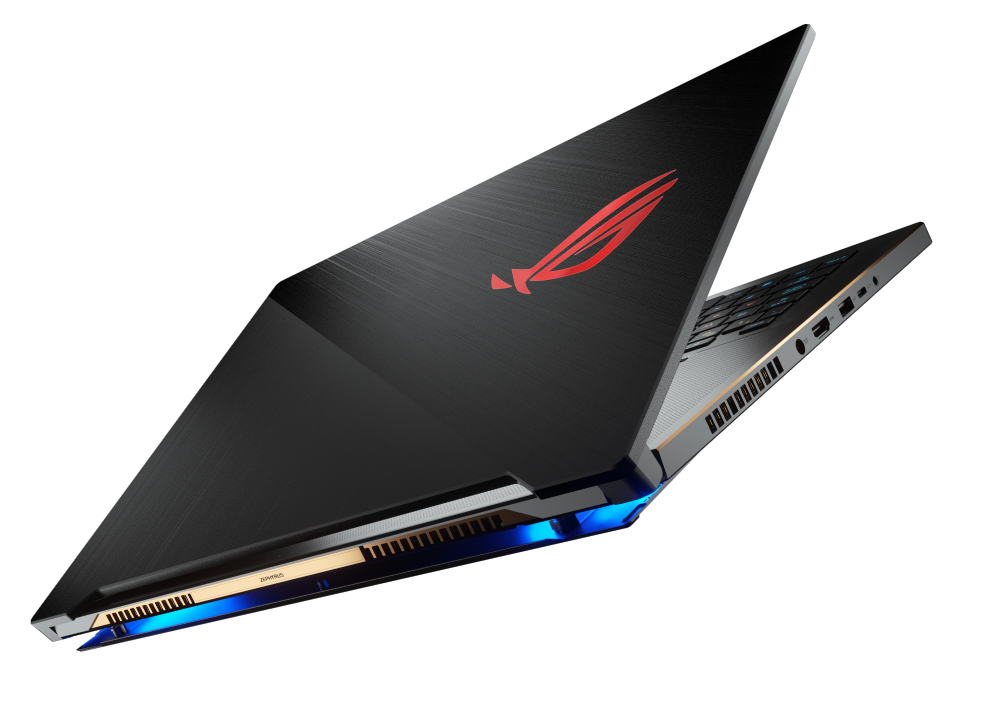
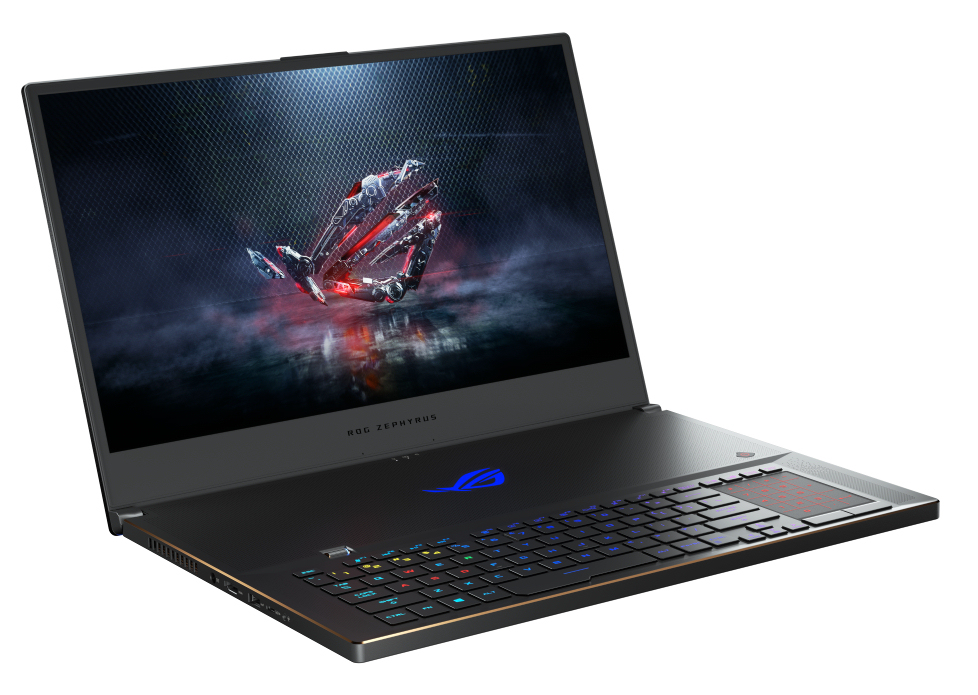
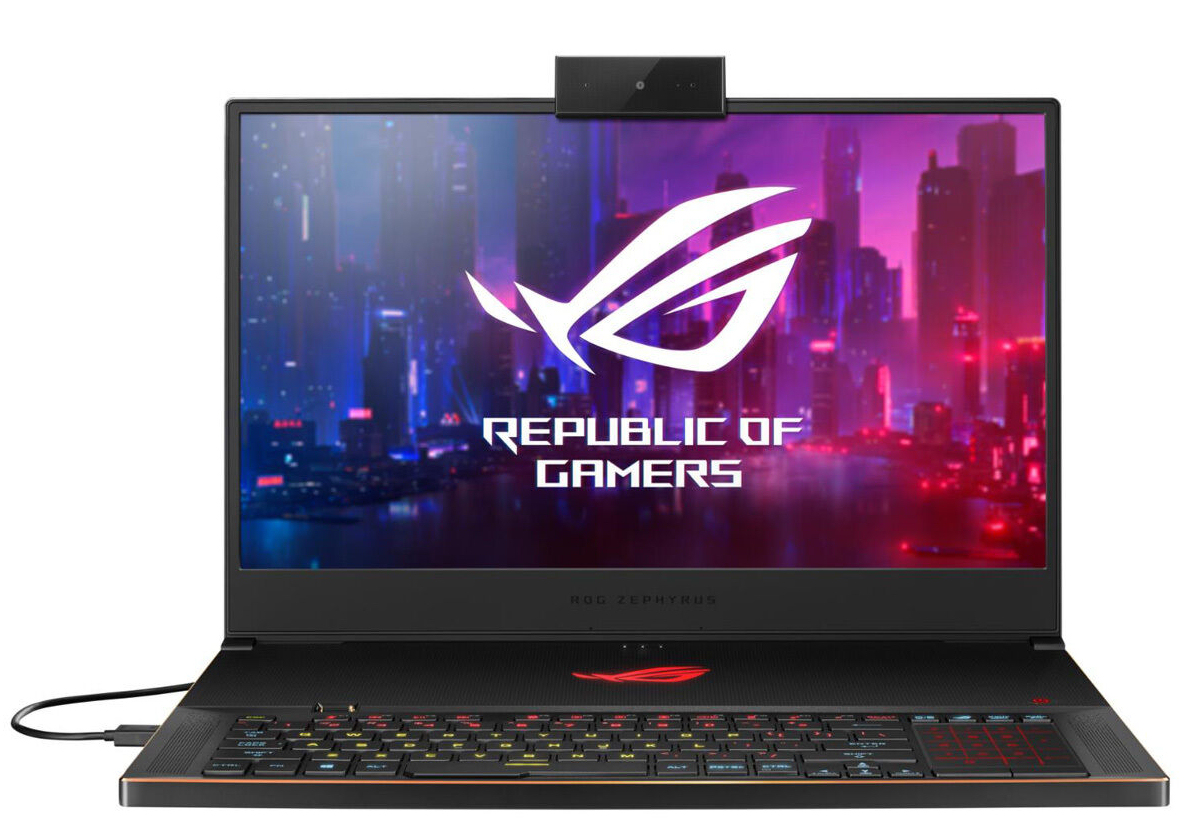
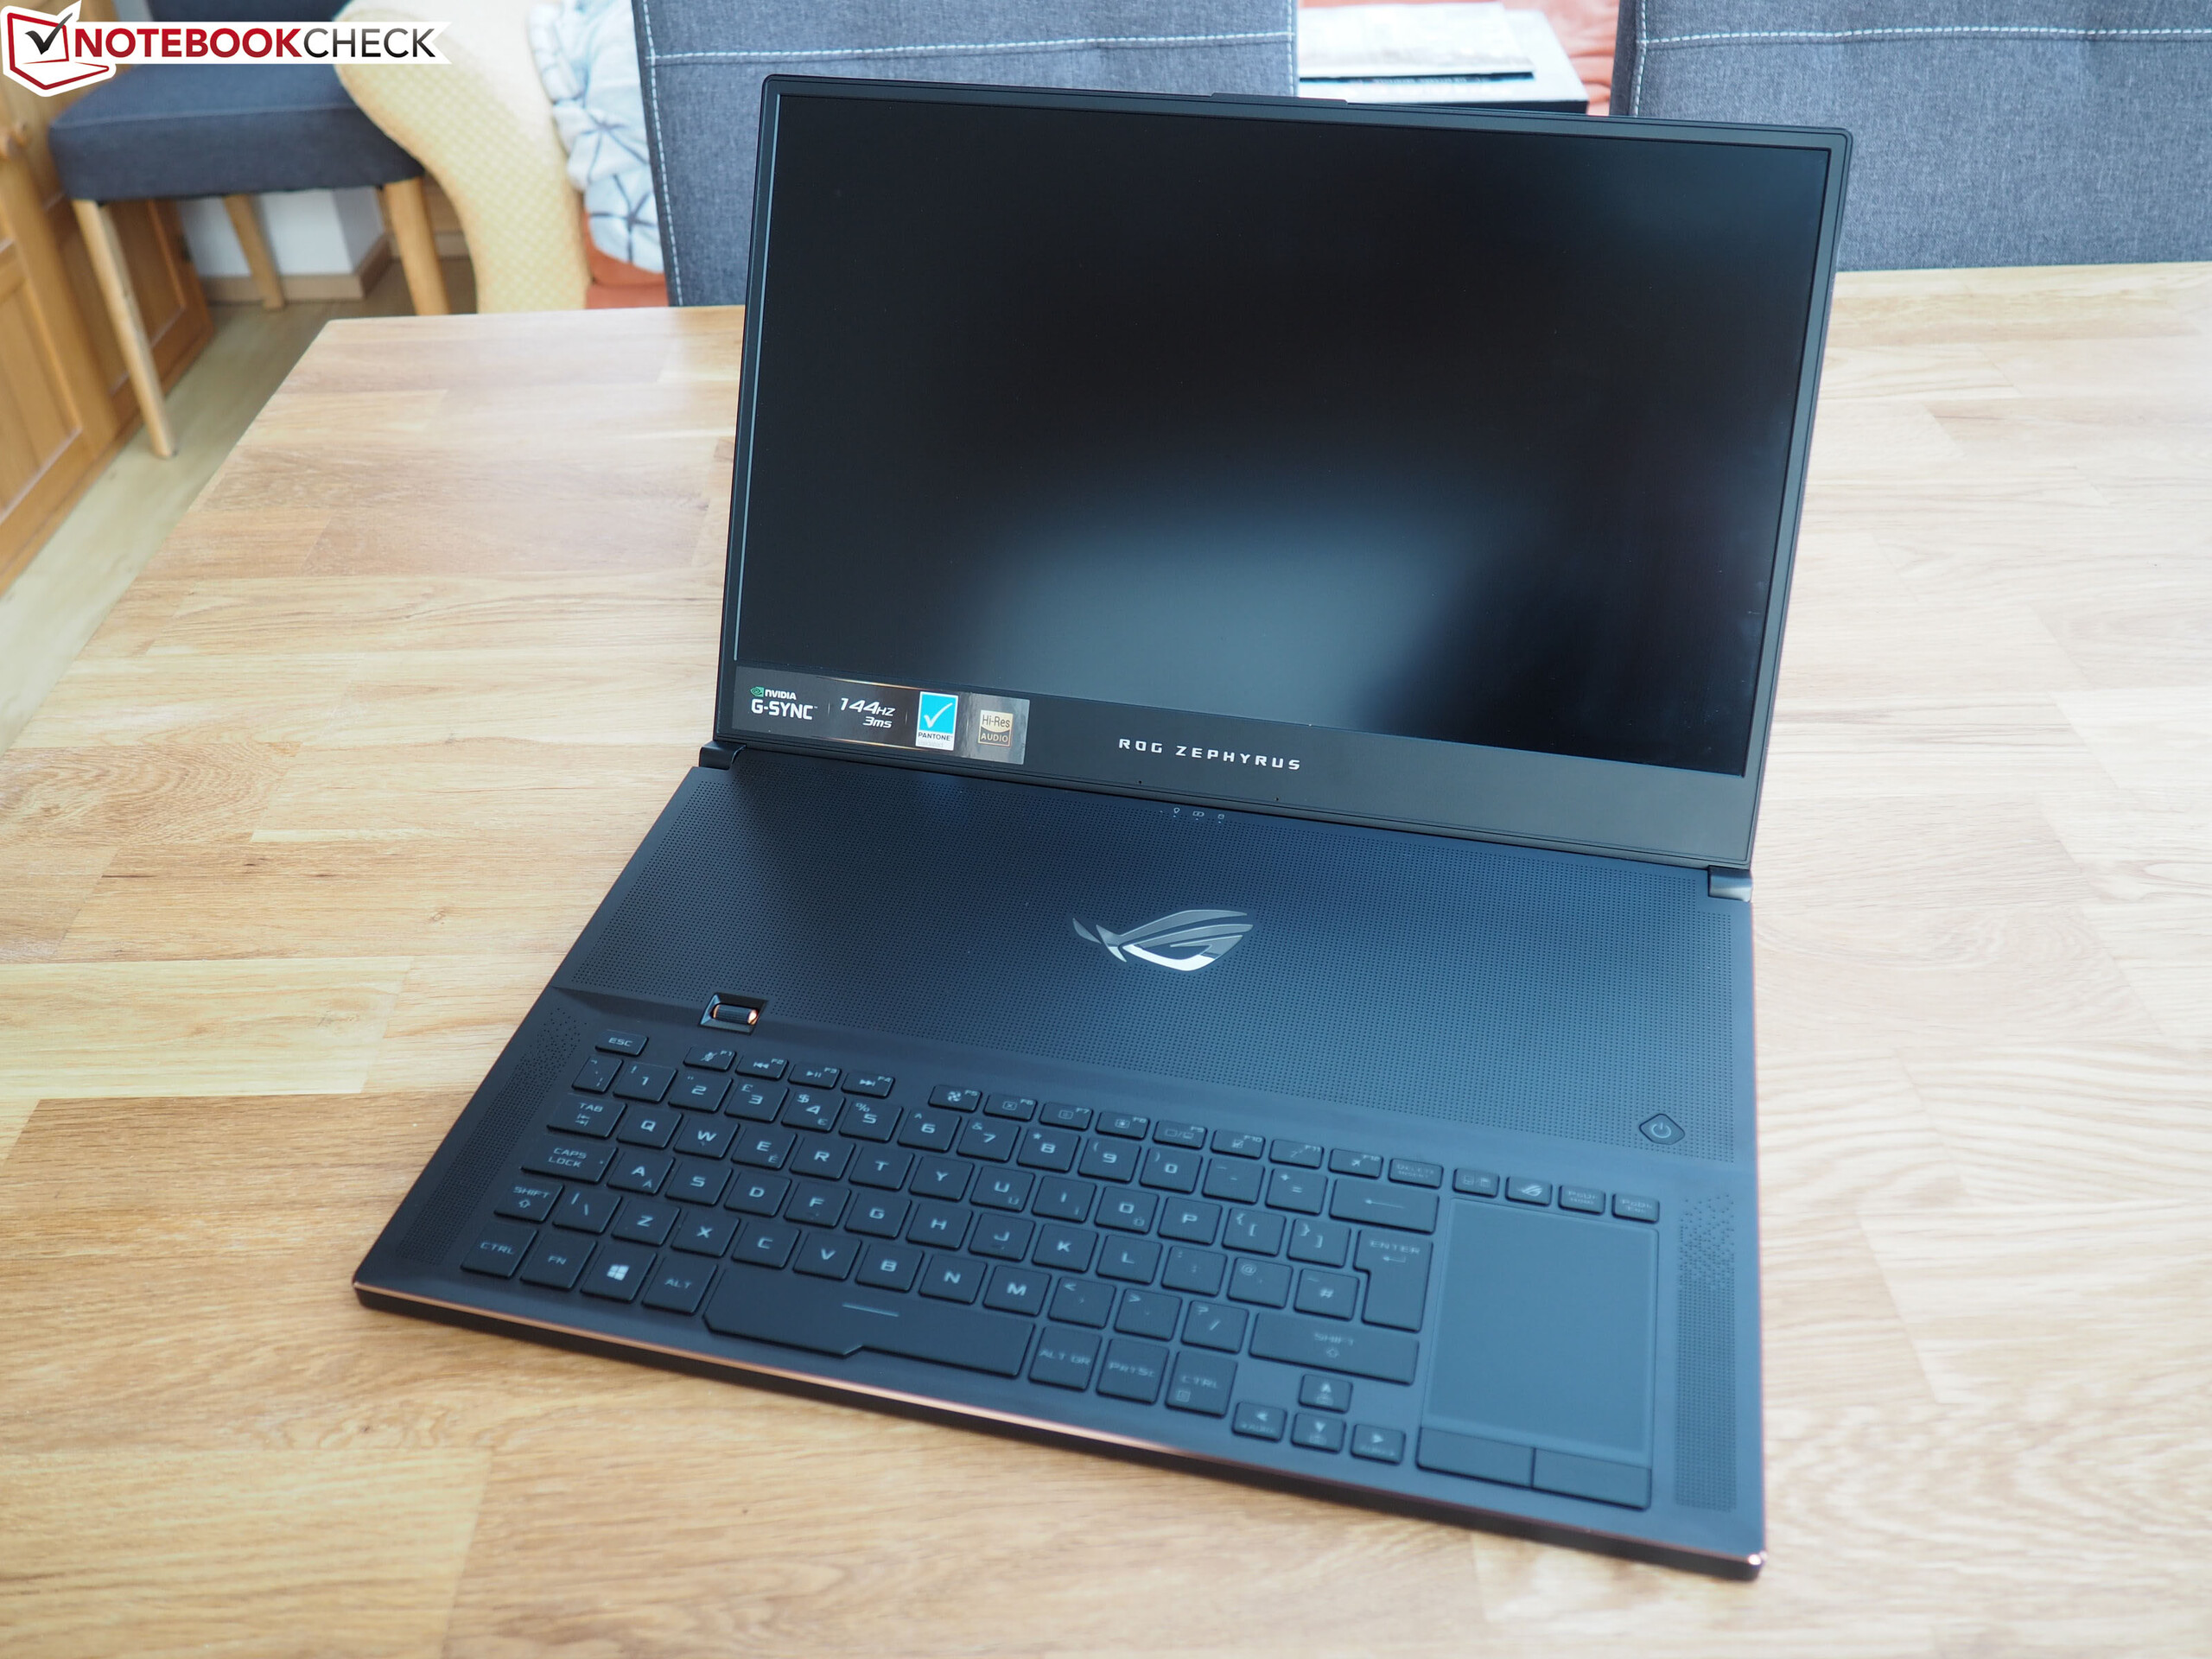
Breve Análise do Portátil Asus ROG Zephyrus S GX701GXR: O fino portátil para jogos ganha pontos com uma tela rápida de 300 Hz
Avaliação | Data | Modelo | Peso | Altura | Size | Resolução | Preço |
|---|---|---|---|---|---|---|---|
| 81.2 % v7 (old) | 12/2019 | Asus ROG Zephyrus S GX701GXR i7-9750H, GeForce RTX 2080 Max-Q | 2.7 kg | 18.7 mm | 17.30" | 1920x1080 | |
| 87.7 % v7 (old) | 06/2019 | Razer Blade Pro 17 RTX 2080 Max-Q i7-9750H, GeForce RTX 2080 Max-Q | 2.8 kg | 19.9 mm | 17.30" | 1920x1080 | |
| 86.1 % v7 (old) | 09/2019 | Gigabyte Aero 17 XA RP77 i9-9980HK, GeForce RTX 2070 Max-Q | 2.5 kg | 21.4 mm | 17.30" | 3840x2160 | |
| 87.4 % v6 (old) | 04/2019 | Alienware m17 P37E i9-8950HK, GeForce RTX 2080 Max-Q | 2.6 kg | 23 mm | 17.30" | 3840x2160 | |
| 85.6 % v6 (old) | 03/2019 | Lenovo Legion Y740-17ICH i7-8750H, GeForce RTX 2080 Max-Q | 2.8 kg | 23 mm | 17.30" | 1920x1080 |

| Networking | |
| iperf3 transmit AX12 | |
| Asus ROG Zephyrus S GX701GXR | |
| iperf3 receive AX12 | |
| Asus ROG Zephyrus S GX701GXR | |
| |||||||||||||||||||||||||
iluminação: 93 %
iluminação com acumulador: 288 cd/m²
Contraste: 1200:1 (Preto: 0.24 cd/m²)
ΔE ColorChecker Calman: 1.92 | ∀{0.5-29.43 Ø4.71}
calibrated: 1.14
ΔE Greyscale Calman: 3.08 | ∀{0.09-98 Ø4.96}
96% sRGB (Argyll 1.6.3 3D)
65% AdobeRGB 1998 (Argyll 1.6.3 3D)
72.3% AdobeRGB 1998 (Argyll 3D)
96.6% sRGB (Argyll 3D)
70% Display P3 (Argyll 3D)
Gamma: 2.42
CCT: 7055 K
| Asus ROG Zephyrus S GX701GXR AU Optronics B173HAN05.1, IPS, 1920x1080 | Asus Zephyrus S GX701GX B173HAN04.0 (AUO409D), IPS, 1920x1080 | Razer Blade Pro 17 RTX 2080 Max-Q AU Optronics B173HAN04.0, IPS, 1920x1080 | Gigabyte Aero 17 XA RP77 AU Optronics B173ZAN03.2, IPS, 3840x2160 | Alienware m17 P37E AU Optronics B173ZAN01.0, IPS, 3840x2160 | Lenovo Legion Y740-17ICH AU Optronics B173HAN03.2, IPS, 1920x1080 | |
|---|---|---|---|---|---|---|
| Display | -10% | -12% | 22% | 21% | -8% | |
| Display P3 Coverage (%) | 70 | 62.9 -10% | 60.6 -13% | 86.8 24% | 86.4 23% | 64 -9% |
| sRGB Coverage (%) | 96.6 | 87.8 -9% | 89 -8% | 100 4% | 99.9 3% | 90.4 -6% |
| AdobeRGB 1998 Coverage (%) | 72.3 | 63.9 -12% | 62.1 -14% | 99.5 38% | 99.1 37% | 64.8 -10% |
| Response Times | -28% | -24% | -507% | -402% | -124% | |
| Response Time Grey 50% / Grey 80% * (ms) | 5.6 ? | 7.2 ? -29% | 6.8 ? -21% | 45.6 ? -714% | 35.6 ? -536% | 15.6 ? -179% |
| Response Time Black / White * (ms) | 7.6 ? | 9.6 ? -26% | 9.6 ? -26% | 30.4 ? -300% | 28 ? -268% | 12.8 ? -68% |
| PWM Frequency (Hz) | ||||||
| Screen | -7% | -23% | -6% | -77% | -59% | |
| Brightness middle (cd/m²) | 288 | 288 0% | 299.3 4% | 667.3 132% | 357.9 24% | 299.1 4% |
| Brightness (cd/m²) | 276 | 287 4% | 294 7% | 633 129% | 347 26% | 273 -1% |
| Brightness Distribution (%) | 93 | 91 -2% | 94 1% | 90 -3% | 94 1% | 81 -13% |
| Black Level * (cd/m²) | 0.24 | 0.2 17% | 0.29 -21% | 0.46 -92% | 0.33 -38% | 0.27 -13% |
| Contrast (:1) | 1200 | 1440 20% | 1032 -14% | 1451 21% | 1085 -10% | 1108 -8% |
| Colorchecker dE 2000 * | 1.92 | 2.33 -21% | 2.55 -33% | 3.53 -84% | 6.57 -242% | 5.07 -164% |
| Colorchecker dE 2000 max. * | 4.57 | 5.34 -17% | 4.73 -4% | 6.88 -51% | 9.86 -116% | 10.55 -131% |
| Colorchecker dE 2000 calibrated * | 1.14 | 2.47 -117% | 2.9 -154% | 3.79 -232% | 6.74 -491% | 3.31 -190% |
| Greyscale dE 2000 * | 3.08 | 1.19 61% | 3.5 -14% | 0.9 71% | 4.3 -40% | 6.8 -121% |
| Gamma | 2.42 91% | 2.41 91% | 2.28 96% | 2.17 101% | 2.6 85% | 2.46 89% |
| CCT | 7055 92% | 6710 97% | 7101 92% | 6533 99% | 6403 102% | 7805 83% |
| Color Space (Percent of AdobeRGB 1998) (%) | 65 | 57 -12% | 57 -12% | 87.1 34% | 88.4 36% | 58.5 -10% |
| Color Space (Percent of sRGB) (%) | 96 | 88 -8% | 88.7 -8% | 100 4% | 100 4% | 89.9 -6% |
| Média Total (Programa/Configurações) | -15% /
-10% | -20% /
-21% | -164% /
-64% | -153% /
-99% | -64% /
-58% |
* ... menor é melhor
Exibir tempos de resposta
| ↔ Tempo de resposta preto para branco | ||
|---|---|---|
| 7.6 ms ... ascensão ↗ e queda ↘ combinadas | ↗ 3.4 ms ascensão | 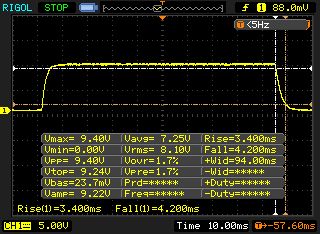 |
| ↘ 4.2 ms queda | ||
| A tela mostra taxas de resposta muito rápidas em nossos testes e deve ser muito adequada para jogos em ritmo acelerado. Em comparação, todos os dispositivos testados variam de 0.1 (mínimo) a 240 (máximo) ms. » 22 % de todos os dispositivos são melhores. Isso significa que o tempo de resposta medido é melhor que a média de todos os dispositivos testados (19.8 ms). | ||
| ↔ Tempo de resposta 50% cinza a 80% cinza | ||
| 5.6 ms ... ascensão ↗ e queda ↘ combinadas | ↗ 2.4 ms ascensão | 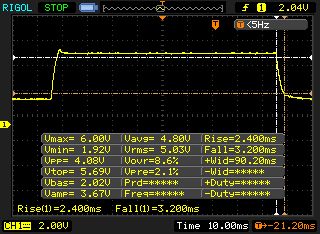 |
| ↘ 3.2 ms queda | ||
| A tela mostra taxas de resposta muito rápidas em nossos testes e deve ser muito adequada para jogos em ritmo acelerado. Em comparação, todos os dispositivos testados variam de 0.165 (mínimo) a 636 (máximo) ms. » 18 % de todos os dispositivos são melhores. Isso significa que o tempo de resposta medido é melhor que a média de todos os dispositivos testados (30.9 ms). | ||
Cintilação da tela / PWM (modulação por largura de pulso)
| Tela tremeluzindo / PWM não detectado | 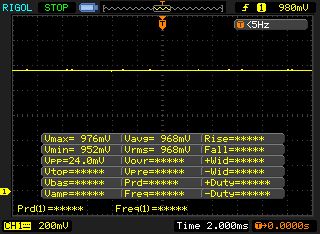 | ||
[pwm_comparison] Em comparação: 52 % de todos os dispositivos testados não usam PWM para escurecer a tela. Se PWM foi detectado, uma média de 7748 (mínimo: 5 - máximo: 343500) Hz foi medida. | |||


| Cinebench R15 | |
| CPU Single 64Bit | |
| Média da turma Gaming (188.8 - 350, n=107, últimos 2 anos) | |
| Gigabyte Aero 17 XA RP77 | |
| Alienware m17 P37E | |
| Razer Blade Pro 17 RTX 2080 Max-Q | |
| Asus ROG Zephyrus S GX701GXR (Turbo) | |
| Asus ROG Zephyrus S GX701GXR | |
| Asus Zephyrus S GX701GX | |
| Lenovo Legion Y740-17ICH | |
| CPU Multi 64Bit | |
| Média da turma Gaming (1578 - 6330, n=106, últimos 2 anos) | |
| Gigabyte Aero 17 XA RP77 | |
| Alienware m17 P37E | |
| Lenovo Legion Y740-17ICH | |
| Asus Zephyrus S GX701GX | |
| Asus ROG Zephyrus S GX701GXR (Turbo) | |
| Razer Blade Pro 17 RTX 2080 Max-Q | |
| Asus ROG Zephyrus S GX701GXR | |
| Cinebench R10 | |
| Rendering Multiple CPUs 32Bit | |
| Média da turma Gaming (42932 - 102066, n=9, últimos 2 anos) | |
| Asus ROG Zephyrus S GX701GXR | |
| Shading 32Bit | |
| Média da turma Gaming (13696 - 24952, n=6, últimos 2 anos) | |
| Asus ROG Zephyrus S GX701GXR | |
| Cinebench R20 | |
| CPU (Single Core) | |
| Média da turma Gaming (442 - 913, n=107, últimos 2 anos) | |
| Gigabyte Aero 17 XA RP77 | |
| Asus ROG Zephyrus S GX701GXR | |
| CPU (Multi Core) | |
| Média da turma Gaming (4029 - 16433, n=107, últimos 2 anos) | |
| Gigabyte Aero 17 XA RP77 | |
| Asus ROG Zephyrus S GX701GXR | |
| Geekbench 3 | |
| 32 Bit Multi-Core Score | |
| Asus ROG Zephyrus S GX701GXR | |
| 32 Bit Single-Core Score | |
| Asus ROG Zephyrus S GX701GXR | |
| Geekbench 4.4 | |
| 64 Bit Multi-Core Score | |
| Média da turma Gaming (89200 - 101054, n=3, últimos 2 anos) | |
| Asus ROG Zephyrus S GX701GXR | |
| 64 Bit Single-Core Score | |
| Média da turma Gaming (9335 - 9775, n=3, últimos 2 anos) | |
| Asus ROG Zephyrus S GX701GXR | |
| Geekbench 5.0 | |
| 5.0 Multi-Core | |
| Média da turma Gaming (21768 - 28184, n=3, últimos 2 anos) | |
| Asus ROG Zephyrus S GX701GXR | |
| 5.0 Single-Core | |
| Média da turma Gaming (2237 - 2318, n=3, últimos 2 anos) | |
| Asus ROG Zephyrus S GX701GXR | |
| Mozilla Kraken 1.1 - Total | |
| Asus ROG Zephyrus S GX701GXR (Edge 44) | |
| Lenovo Legion Y740-17ICH (Edge 44.17763.1.0) | |
| Razer Blade Pro 17 RTX 2080 Max-Q (Edge 44.18362.1.0) | |
| Gigabyte Aero 17 XA RP77 (Edge 44.18362.267.0) | |
| Média da turma Gaming (391 - 590, n=101, últimos 2 anos) | |
| Octane V2 - Total Score | |
| Média da turma Gaming (93292 - 139447, n=27, últimos 2 anos) | |
| Gigabyte Aero 17 XA RP77 (Edge 44.18362.267.0) | |
| Razer Blade Pro 17 RTX 2080 Max-Q (Edge 44.18362.1.0) | |
| Lenovo Legion Y740-17ICH (Edge 44.17763.1.0) | |
| Asus ROG Zephyrus S GX701GXR (Edge 44) | |
| JetStream 1.1 - 1.1 Total | |
| Média da turma Gaming (549 - 647, n=3, últimos 2 anos) | |
| Gigabyte Aero 17 XA RP77 (Edge 44.18362.267.0) | |
| Razer Blade Pro 17 RTX 2080 Max-Q (Edge 44.18362.1.0) | |
| Lenovo Legion Y740-17ICH (Edge 44.17763.1.0) | |
| Asus ROG Zephyrus S GX701GXR (Edge 44) | |
* ... menor é melhor
| PCMark 8 Home Score Accelerated v2 | 5319 pontos | |
| PCMark 8 Creative Score Accelerated v2 | 6716 pontos | |
| PCMark 8 Work Score Accelerated v2 | 6593 pontos | |
| PCMark 10 Score | 6049 pontos | |
Ajuda | ||

| Asus ROG Zephyrus S GX701GXR Samsung SSD PM981 MZVLB1T0HALR | Razer Blade Pro 17 RTX 2080 Max-Q Samsung SSD PM981 MZVLB512HAJQ | Gigabyte Aero 17 XA RP77 Intel SSD 760p SSDPEKKW512G8 | Alienware m17 P37E SK Hynix PC401 512GB M.2 (HFS512GD9TNG) | Lenovo Legion Y740-17ICH Samsung SSD PM981 MZVLB256HAHQ | Asus Zephyrus S GX701GX Samsung SSD PM981 MZVLB1T0HALR | |
|---|---|---|---|---|---|---|
| CrystalDiskMark 5.2 / 6 | -1% | 34% | 6% | 12% | -6% | |
| Write 4K (MB/s) | 96.1 | 100.7 5% | 169.6 76% | 120.2 25% | 99.8 4% | 92.4 -4% |
| Read 4K (MB/s) | 40.86 | 41.03 0% | 58 42% | 44.3 8% | 40.81 0% | 39.59 -3% |
| Write Seq (MB/s) | 1317 | 1146 -13% | 1516 15% | 1278 -3% | 1385 5% | 1221 -7% |
| Read Seq (MB/s) | 1030 | 1115 8% | 2362 129% | 1389 35% | 2089 103% | 1005 -2% |
| Write 4K Q32T1 (MB/s) | 350.4 | 384.6 10% | 481.8 38% | 436.2 24% | 380 8% | 292.5 -17% |
| Read 4K Q32T1 (MB/s) | 404.1 | 429.5 6% | 506 25% | 515 27% | 445.5 10% | 330.8 -18% |
| Write Seq Q32T1 (MB/s) | 2396 | 1859 -22% | 1530 -36% | 1157 -52% | 1380 -42% | 2385 0% |
| Read Seq Q32T1 (MB/s) | 3194 | 3179 0% | 2645 -17% | 2671 -16% | 3471 9% | 3339 5% |
| 3DMark 06 Standard Score | 36228 pontos | |
| 3DMark 11 Performance | 20578 pontos | |
| 3DMark Ice Storm Standard Score | 171155 pontos | |
| 3DMark Cloud Gate Standard Score | 32628 pontos | |
| 3DMark Fire Strike Score | 17374 pontos | |
| 3DMark Time Spy Score | 7484 pontos | |
Ajuda | ||
| 3DMark | |
| 1920x1080 Fire Strike Graphics | |
| Média da turma Gaming (12242 - 62849, n=116, últimos 2 anos) | |
| Razer Blade Pro 17 RTX 2080 Max-Q | |
| Asus ROG Zephyrus S GX701GXR (Turbo) | |
| Asus Zephyrus S GX701GX | |
| Asus ROG Zephyrus S GX701GXR | |
| Alienware m17 P37E | |
| Lenovo Legion Y740-17ICH | |
| Gigabyte Aero 17 XA RP77 | |
| 2560x1440 Time Spy Graphics | |
| Média da turma Gaming (5012 - 26212, n=116, últimos 2 anos) | |
| Razer Blade Pro 17 RTX 2080 Max-Q | |
| Asus Zephyrus S GX701GX | |
| Asus ROG Zephyrus S GX701GXR (Turbo) | |
| Asus ROG Zephyrus S GX701GXR | |
| Alienware m17 P37E | |
| Lenovo Legion Y740-17ICH | |
| Gigabyte Aero 17 XA RP77 | |
| 3DMark 11 - 1280x720 Performance GPU | |
| Média da turma Gaming (21841 - 80022, n=105, últimos 2 anos) | |
| Razer Blade Pro 17 RTX 2080 Max-Q | |
| Asus ROG Zephyrus S GX701GXR (Turbo) | |
| Asus Zephyrus S GX701GX | |
| Asus ROG Zephyrus S GX701GXR | |
| Alienware m17 P37E | |
| Lenovo Legion Y740-17ICH | |
| Gigabyte Aero 17 XA RP77 | |
| The Witcher 3 - 1920x1080 Ultra Graphics & Postprocessing (HBAO+) | |
| Média da turma Gaming (104.7 - 240, n=7, últimos 2 anos) | |
| Razer Blade Pro 17 RTX 2080 Max-Q | |
| Asus Zephyrus S GX701GX | |
| Asus ROG Zephyrus S GX701GXR | |
| Alienware m17 P37E | |
| Lenovo Legion Y740-17ICH | |
| Gigabyte Aero 17 XA RP77 | |
| BioShock Infinite - 1920x1080 Ultra Preset, DX11 (DDOF) | |
| Razer Blade Pro 17 RTX 2080 Max-Q | |
| Asus ROG Zephyrus S GX701GXR | |
| Alienware m17 P37E | |
| Lenovo Legion Y740-17ICH | |
| Gigabyte Aero 17 XA RP77 | |
| baixo | média | alto | ultra | |
|---|---|---|---|---|
| BioShock Infinite (2013) | 350.6 | 306 | 285.9 | 176.5 |
| The Witcher 3 (2015) | 295.5 | 230.3 | 153.2 | 80.7 |
| Metro Exodus (2019) | 121.7 | 94.6 | 72.1 | 59 |
| Control (2019) | 231.9 | 92.8 | 71.9 | |
| Borderlands 3 (2019) | 128.8 | 110.8 | 84.7 | 67.1 |
| FIFA 20 (2019) | 214.6 | 208.1 | 197.7 | 197.1 |
| Ghost Recon Breakpoint (2019) | 105 | 95 | 92 | 71 |
| GRID 2019 (2019) | 213.5 | 187.6 | 120.7 | 81.3 |
| Call of Duty Modern Warfare 2019 (2019) | 171.5 | 126.7 | 104.9 | 90.6 |
| Need for Speed Heat (2019) | 85.6 | 66 | 63.6 | 57.2 |
| Star Wars Jedi Fallen Order (2019) | 94.5 | 84.2 | 82.3 | |
| Red Dead Redemption 2 (2019) | 121 | 102.6 | 72.8 | 45.6 |
| Escape from Tarkov (2020) | 121 | 121 | 120 | 117 |
| Hunt Showdown (2020) | 184 | 134 | 121 | |
| Doom Eternal (2020) | 156 | 140 | 138 | 134 |
Barulho
| Ocioso |
| 32 / 33 / 34 dB |
| Carga |
| 40 / 50 dB |
 | ||
30 dB silencioso 40 dB(A) audível 50 dB(A) ruidosamente alto |
||
min: | ||
| Asus ROG Zephyrus S GX701GXR i7-9750H, GeForce RTX 2080 Max-Q | Razer Blade Pro 17 RTX 2080 Max-Q i7-9750H, GeForce RTX 2080 Max-Q | Gigabyte Aero 17 XA RP77 i9-9980HK, GeForce RTX 2070 Max-Q | Alienware m17 P37E i9-8950HK, GeForce RTX 2080 Max-Q | Lenovo Legion Y740-17ICH i7-8750H, GeForce RTX 2080 Max-Q | Asus Zephyrus S GX701GX i7-8750H, GeForce RTX 2080 Max-Q | Média da turma Gaming | |
|---|---|---|---|---|---|---|---|
| Noise | 4% | -1% | 1% | 8% | -0% | 8% | |
| desligado / ambiente * (dB) | 30 | 28.2 6% | 29.3 2% | 28.2 6% | 28.3 6% | 29 3% | 24.1 ? 20% |
| Idle Minimum * (dB) | 32 | 28.2 12% | 33 -3% | 28.2 12% | 31.5 2% | 29 9% | 26 ? 19% |
| Idle Average * (dB) | 33 | 28.2 15% | 33 -0% | 28.2 15% | 31.6 4% | 32 3% | 27.5 ? 17% |
| Idle Maximum * (dB) | 34 | 30.8 9% | 33 3% | 31 9% | 31.6 7% | 33 3% | 30.1 ? 11% |
| Load Average * (dB) | 40 | 42 -5% | 42.5 -6% | 50.8 -27% | 32.3 19% | 47 -18% | 43.8 ? -10% |
| Witcher 3 ultra * (dB) | 49 | 51 -4% | 42 14% | 50.8 -4% | 43 12% | 49 -0% | |
| Load Maximum * (dB) | 50 | 53 -6% | 59.6 -19% | 50.8 -2% | 45.5 9% | 51 -2% | 54.3 ? -9% |
* ... menor é melhor
(-) A temperatura máxima no lado superior é 50 °C / 122 F, em comparação com a média de 40.4 °C / 105 F , variando de 21.2 a 68.8 °C para a classe Gaming.
(-) A parte inferior aquece até um máximo de 47 °C / 117 F, em comparação com a média de 43.2 °C / 110 F
(+) Em uso inativo, a temperatura média para o lado superior é 31.2 °C / 88 F, em comparação com a média do dispositivo de 33.9 °C / ### class_avg_f### F.
(-) Jogando The Witcher 3, a temperatura média para o lado superior é 44.1 °C / 111 F, em comparação com a média do dispositivo de 33.9 °C / ## #class_avg_f### F.
(±) Os apoios para as mãos e o touchpad podem ficar muito quentes ao toque, com um máximo de 38 °C / 100.4 F.
(-) A temperatura média da área do apoio para as mãos de dispositivos semelhantes foi 28.8 °C / 83.8 F (-9.2 °C / -16.6 F).
| Asus ROG Zephyrus S GX701GXR i7-9750H, GeForce RTX 2080 Max-Q | Razer Blade Pro 17 RTX 2080 Max-Q i7-9750H, GeForce RTX 2080 Max-Q | Gigabyte Aero 17 XA RP77 i9-9980HK, GeForce RTX 2070 Max-Q | Alienware m17 P37E i9-8950HK, GeForce RTX 2080 Max-Q | Lenovo Legion Y740-17ICH i7-8750H, GeForce RTX 2080 Max-Q | Asus Zephyrus S GX701GX i7-8750H, GeForce RTX 2080 Max-Q | Média da turma Gaming | |
|---|---|---|---|---|---|---|---|
| Heat | 11% | -4% | -6% | 9% | 5% | 3% | |
| Maximum Upper Side * (°C) | 50 | 43 14% | 46.8 6% | 55 -10% | 38.6 23% | 53 -6% | 45.2 ? 10% |
| Maximum Bottom * (°C) | 47 | 47.2 -0% | 62.2 -32% | 60 -28% | 43.6 7% | 50 -6% | 48.2 ? -3% |
| Idle Upper Side * (°C) | 33 | 27.2 18% | 29 12% | 30.4 8% | 30.2 8% | 27 18% | 31 ? 6% |
| Idle Bottom * (°C) | 34 | 30 12% | 34 -0% | 31.8 6% | 35 -3% | 30 12% | 34.2 ? -1% |
* ... menor é melhor
Asus ROG Zephyrus S GX701GXR análise de áudio
(+) | os alto-falantes podem tocar relativamente alto (###valor### dB)
Graves 100 - 315Hz
(±) | graves reduzidos - em média 10.3% menor que a mediana
(±) | a linearidade dos graves é média (11.1% delta para a frequência anterior)
Médios 400 - 2.000 Hz
(+) | médios equilibrados - apenas 2.6% longe da mediana
(+) | médios são lineares (4.3% delta para frequência anterior)
Altos 2 - 16 kHz
(+) | agudos equilibrados - apenas 3.3% longe da mediana
(+) | os máximos são lineares (4.1% delta da frequência anterior)
Geral 100 - 16.000 Hz
(+) | o som geral é linear (12.5% diferença em relação à mediana)
Comparado com a mesma classe
» 15% de todos os dispositivos testados nesta classe foram melhores, 3% semelhantes, 81% piores
» O melhor teve um delta de 6%, a média foi 18%, o pior foi 132%
Comparado com todos os dispositivos testados
» 11% de todos os dispositivos testados foram melhores, 2% semelhantes, 86% piores
» O melhor teve um delta de 4%, a média foi 23%, o pior foi 134%
Razer Blade Pro 17 RTX 2080 Max-Q análise de áudio
(+) | os alto-falantes podem tocar relativamente alto (###valor### dB)
Graves 100 - 315Hz
(±) | graves reduzidos - em média 10.5% menor que a mediana
(±) | a linearidade dos graves é média (14.4% delta para a frequência anterior)
Médios 400 - 2.000 Hz
(±) | médios mais altos - em média 5.3% maior que a mediana
(+) | médios são lineares (4.6% delta para frequência anterior)
Altos 2 - 16 kHz
(+) | agudos equilibrados - apenas 3.5% longe da mediana
(±) | a linearidade dos máximos é média (10% delta para frequência anterior)
Geral 100 - 16.000 Hz
(±) | a linearidade do som geral é média (17.9% diferença em relação à mediana)
Comparado com a mesma classe
» 55% de todos os dispositivos testados nesta classe foram melhores, 9% semelhantes, 36% piores
» O melhor teve um delta de 6%, a média foi 18%, o pior foi 132%
Comparado com todos os dispositivos testados
» 37% de todos os dispositivos testados foram melhores, 8% semelhantes, 55% piores
» O melhor teve um delta de 4%, a média foi 23%, o pior foi 134%
| desligado | |
| Ocioso | |
| Carga |
|
Key:
min: | |
| Asus ROG Zephyrus S GX701GXR i7-9750H, GeForce RTX 2080 Max-Q | Razer Blade Pro 17 RTX 2080 Max-Q i7-9750H, GeForce RTX 2080 Max-Q | Gigabyte Aero 17 XA RP77 i9-9980HK, GeForce RTX 2070 Max-Q | Alienware m17 P37E i9-8950HK, GeForce RTX 2080 Max-Q | Lenovo Legion Y740-17ICH i7-8750H, GeForce RTX 2080 Max-Q | Asus Zephyrus S GX701GX i7-8750H, GeForce RTX 2080 Max-Q | Média da turma Gaming | |
|---|---|---|---|---|---|---|---|
| Power Consumption | 14% | 4% | -3% | 16% | 11% | 16% | |
| Idle Minimum * (Watt) | 32 | 16.2 49% | 13.9 57% | 21.2 34% | 20.2 37% | 19 41% | 13 ? 59% |
| Idle Average * (Watt) | 34 | 20.4 40% | 24.3 29% | 29.6 13% | 27.2 20% | 22 35% | 19 ? 44% |
| Idle Maximum * (Watt) | 36 | 26.1 27% | 35.5 1% | 34 6% | 28.7 20% | 30 17% | 24.5 ? 32% |
| Load Average * (Watt) | 95 | 96.5 -2% | 127.6 -34% | 130.9 -38% | 90.8 4% | 104 -9% | 111.1 ? -17% |
| Witcher 3 ultra * (Watt) | 155 | 182.9 -18% | 158 -2% | 177.5 -15% | 152.1 2% | 167 -8% | |
| Load Maximum * (Watt) | 187 | 214.3 -15% | 237.5 -27% | 219.7 -17% | 165.4 12% | 203 -9% | 260 ? -39% |
* ... menor é melhor
| Asus ROG Zephyrus S GX701GXR i7-9750H, GeForce RTX 2080 Max-Q, 76 Wh | Razer Blade Pro 17 RTX 2080 Max-Q i7-9750H, GeForce RTX 2080 Max-Q, 70 Wh | Gigabyte Aero 17 XA RP77 i9-9980HK, GeForce RTX 2070 Max-Q, 94.24 Wh | Alienware m17 P37E i9-8950HK, GeForce RTX 2080 Max-Q, 90 Wh | Lenovo Legion Y740-17ICH i7-8750H, GeForce RTX 2080 Max-Q, 76 Wh | Asus Zephyrus S GX701GX i7-8750H, GeForce RTX 2080 Max-Q, 76 Wh | Média da turma Gaming | |
|---|---|---|---|---|---|---|---|
| Duração da bateria | 31% | 121% | 51% | 7% | 8% | 115% | |
| Reader / Idle (h) | 4.1 | 4.9 20% | 11.9 190% | 9.1 122% | 5 22% | 8.27 ? 102% | |
| H.264 (h) | 2.8 | 8.32 ? 197% | |||||
| WiFi v1.3 (h) | 3 | 4.7 57% | 7.2 140% | 4.9 63% | 3.2 7% | 3.8 27% | 7.11 ? 137% |
| Load (h) | 1.2 | 1.4 17% | 1.6 33% | 0.8 -33% | 0.9 -25% | 1.502 ? 25% |
Pro
Contra
Com o Zephyrus S GX701GXR, a Asus oferece um portátil compacto para jogos de 17,3 polegadas que roda todos os jogos atuais sem problemas na tela Full HD mate, graças ao processador Core i7-9750H e a GPU GeForce RTX 2080 Max Q. O desenvolvimento de calor e ruído está em um nível aceitável. Vale a pena mencionar a duração da bateria, mas pode ser aumentada com a ativação da GPU integrada.
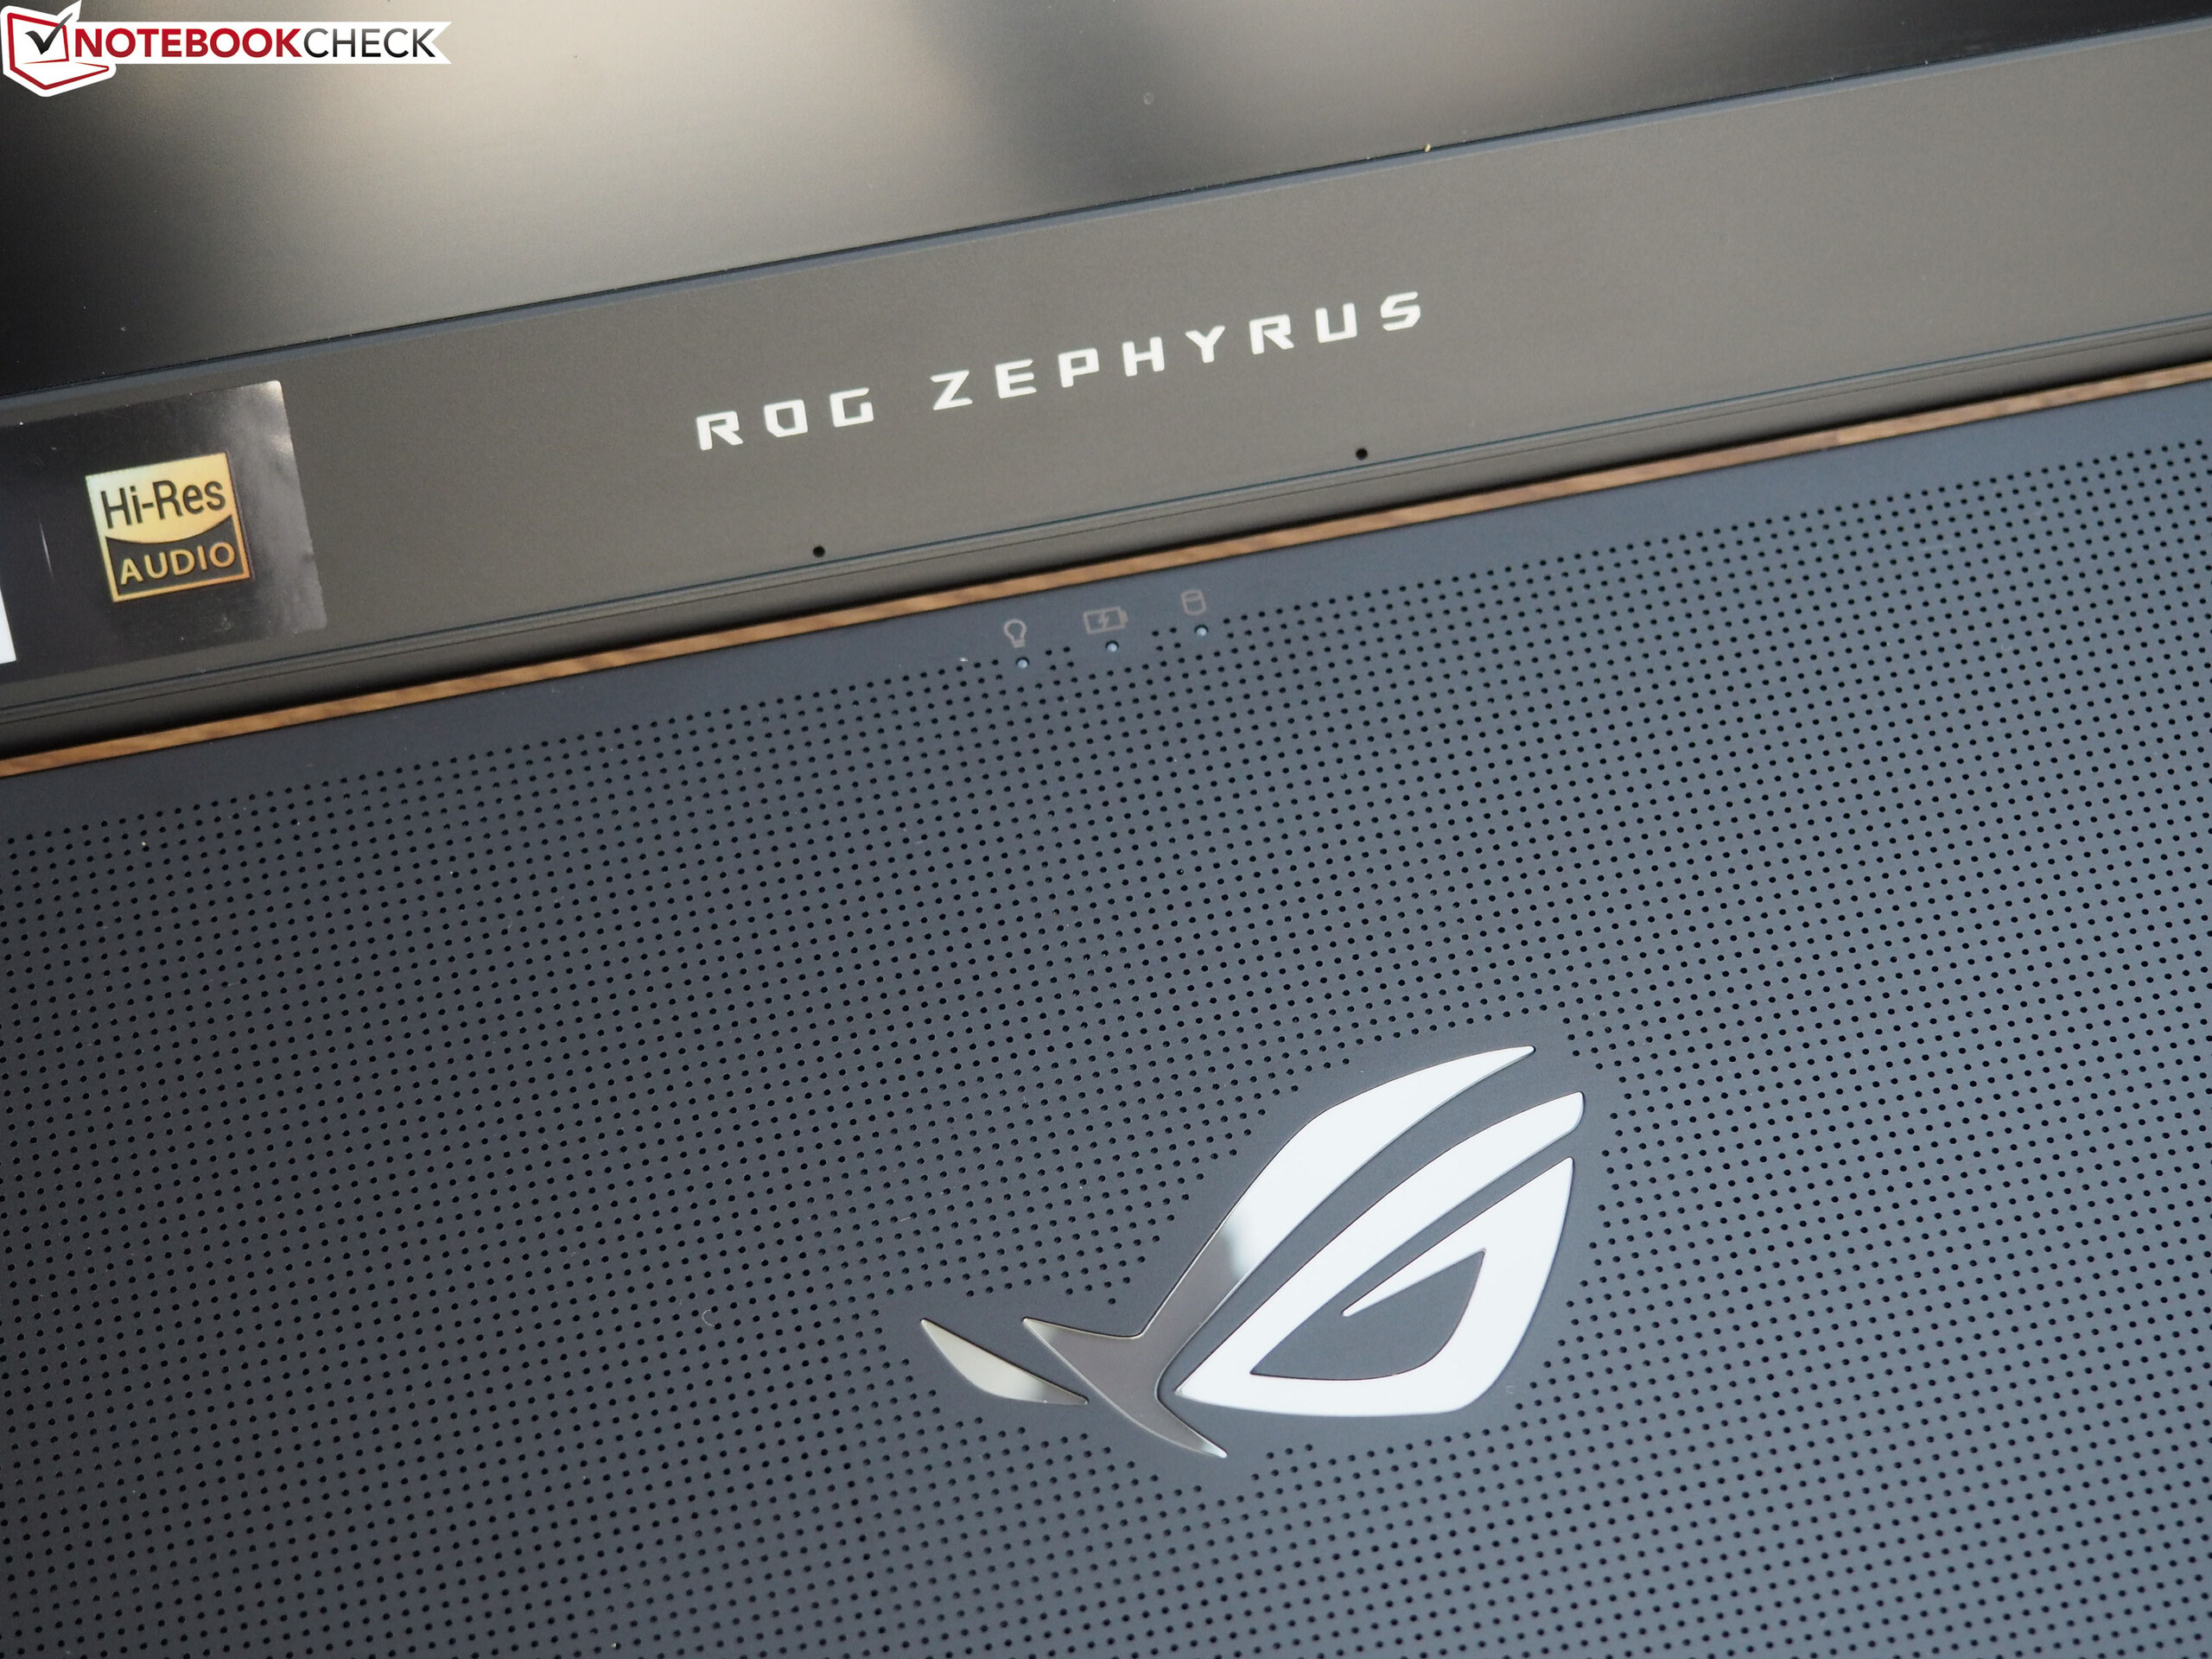
A tela IPS de 300 Hz ganha pontos com tempos de resposta curtos, ângulos de visão estáveis, bom contraste, certificação X-Rite Pantone e ótima reprodução de cores.
O brilho máximo da tela é um pouco baixo demais. Um portátil nessa faixa de preço deve oferecer mais a esse respeito.
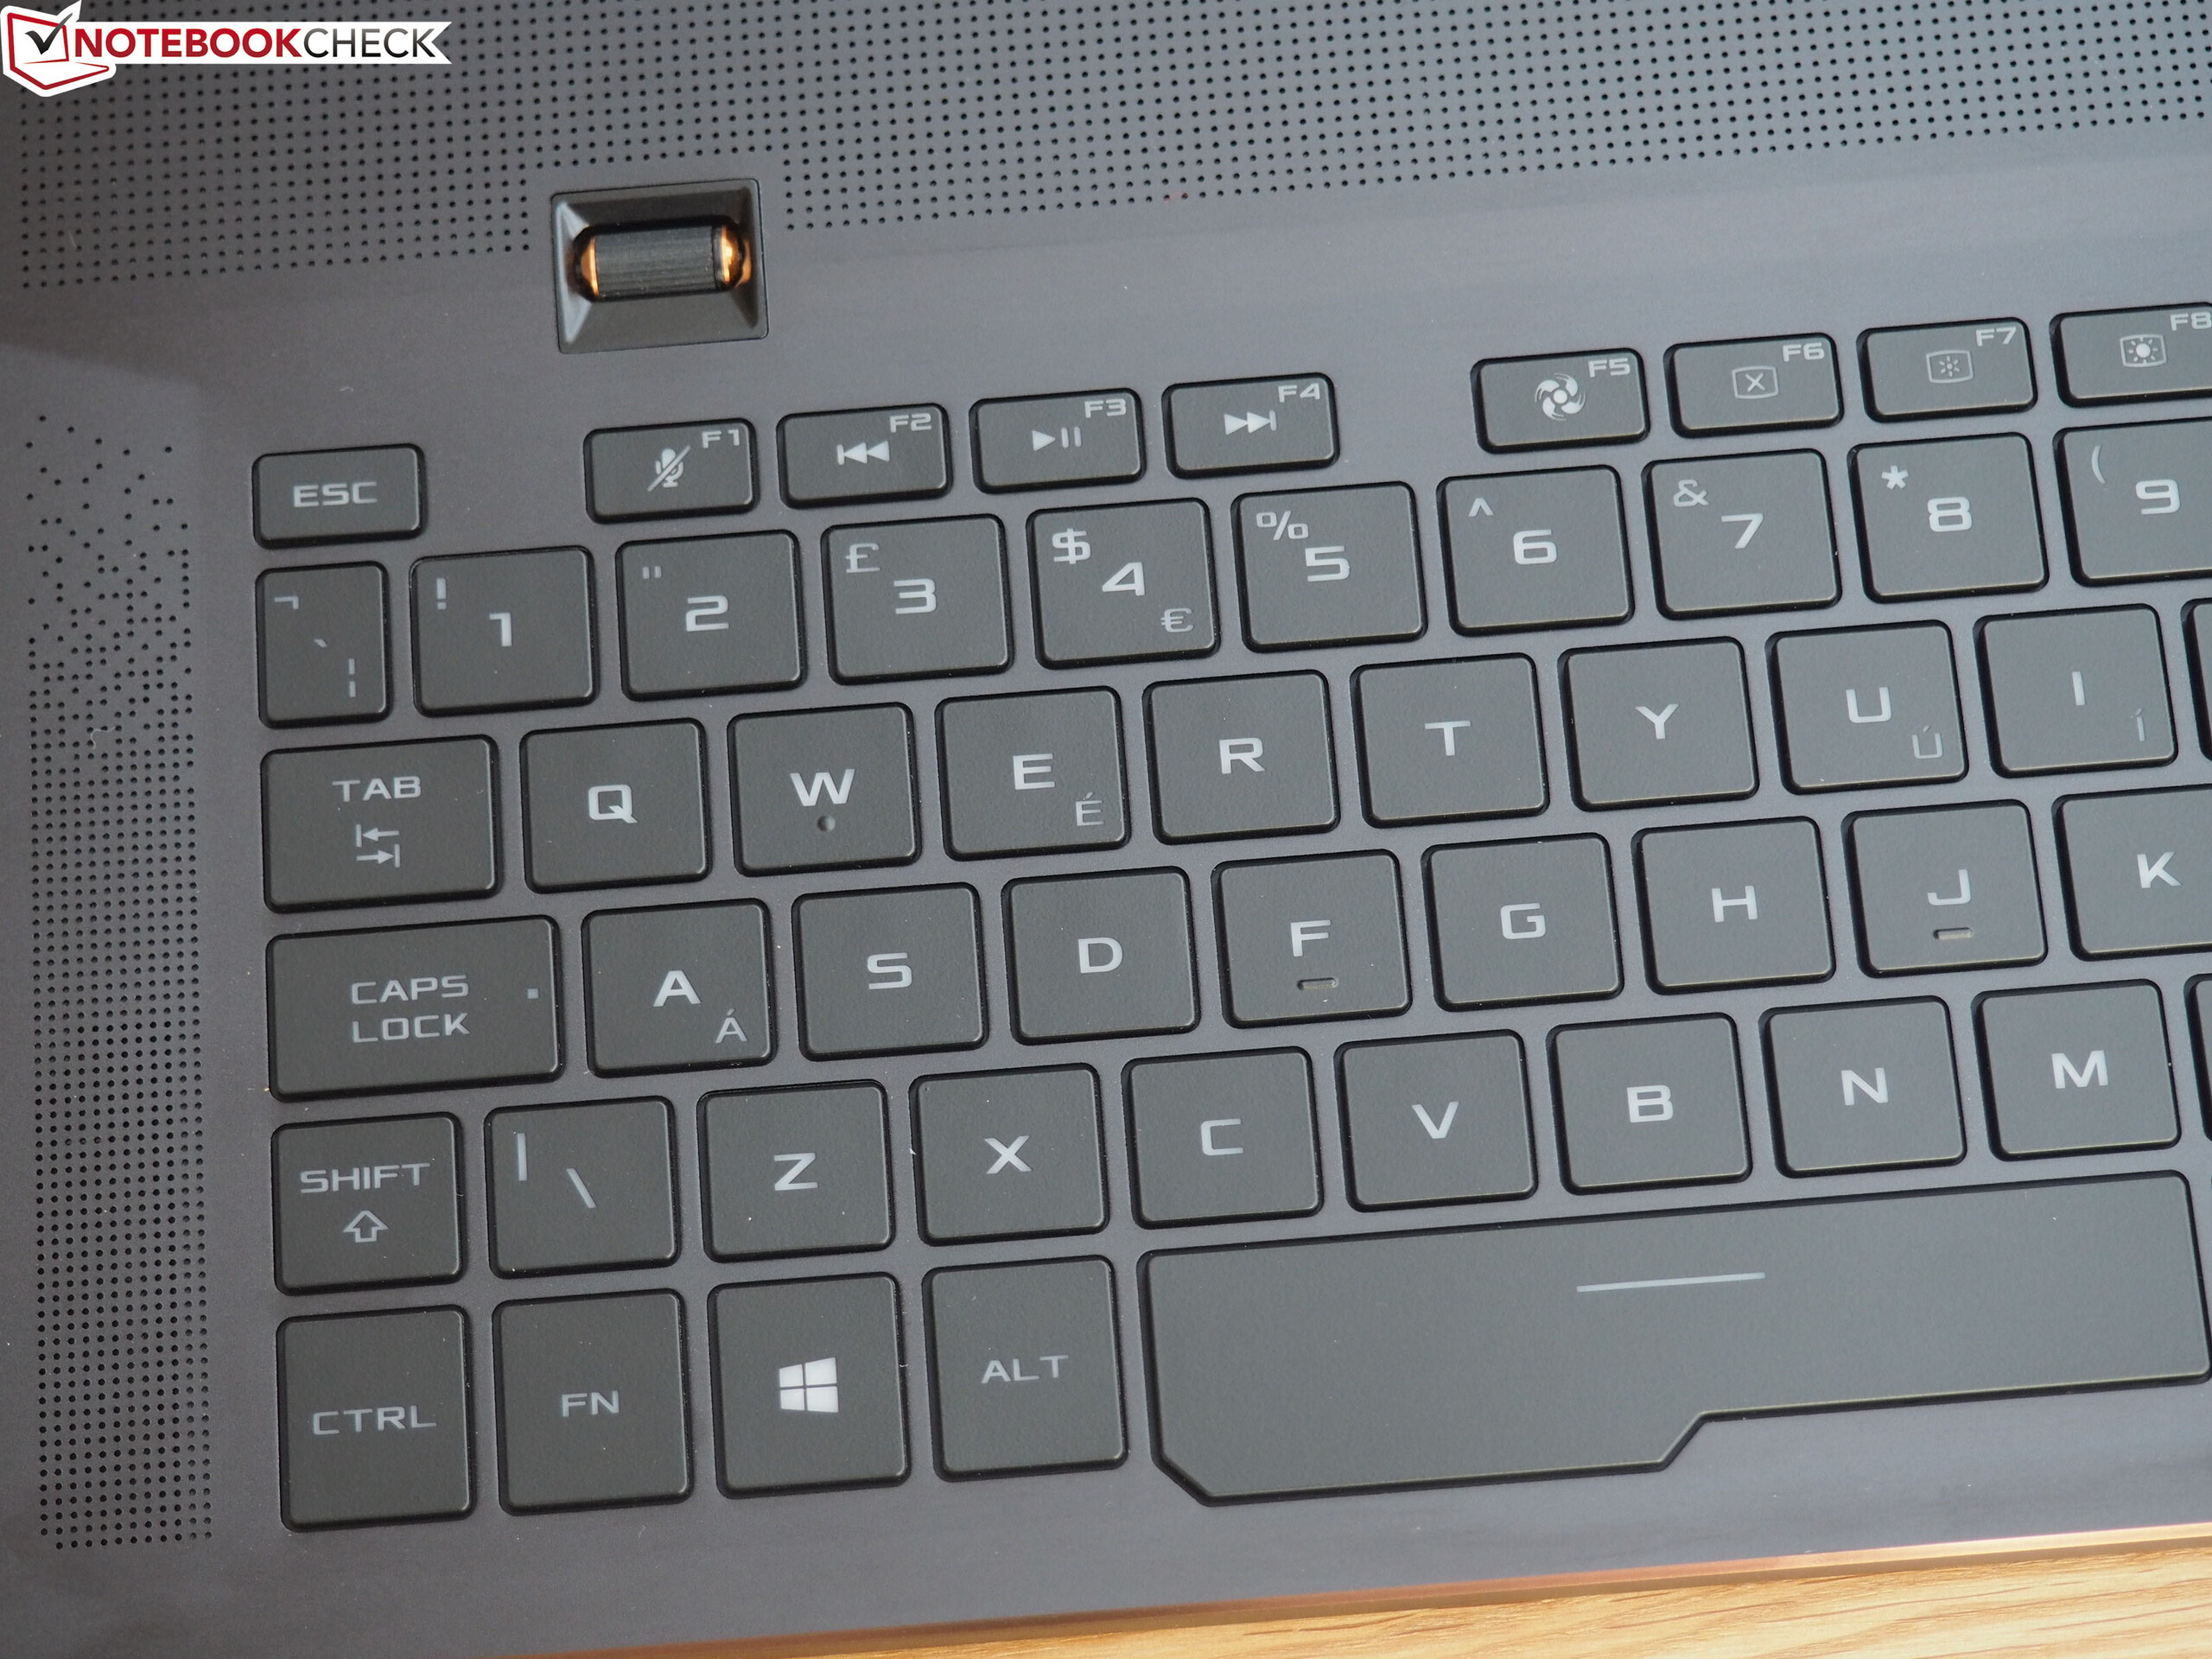
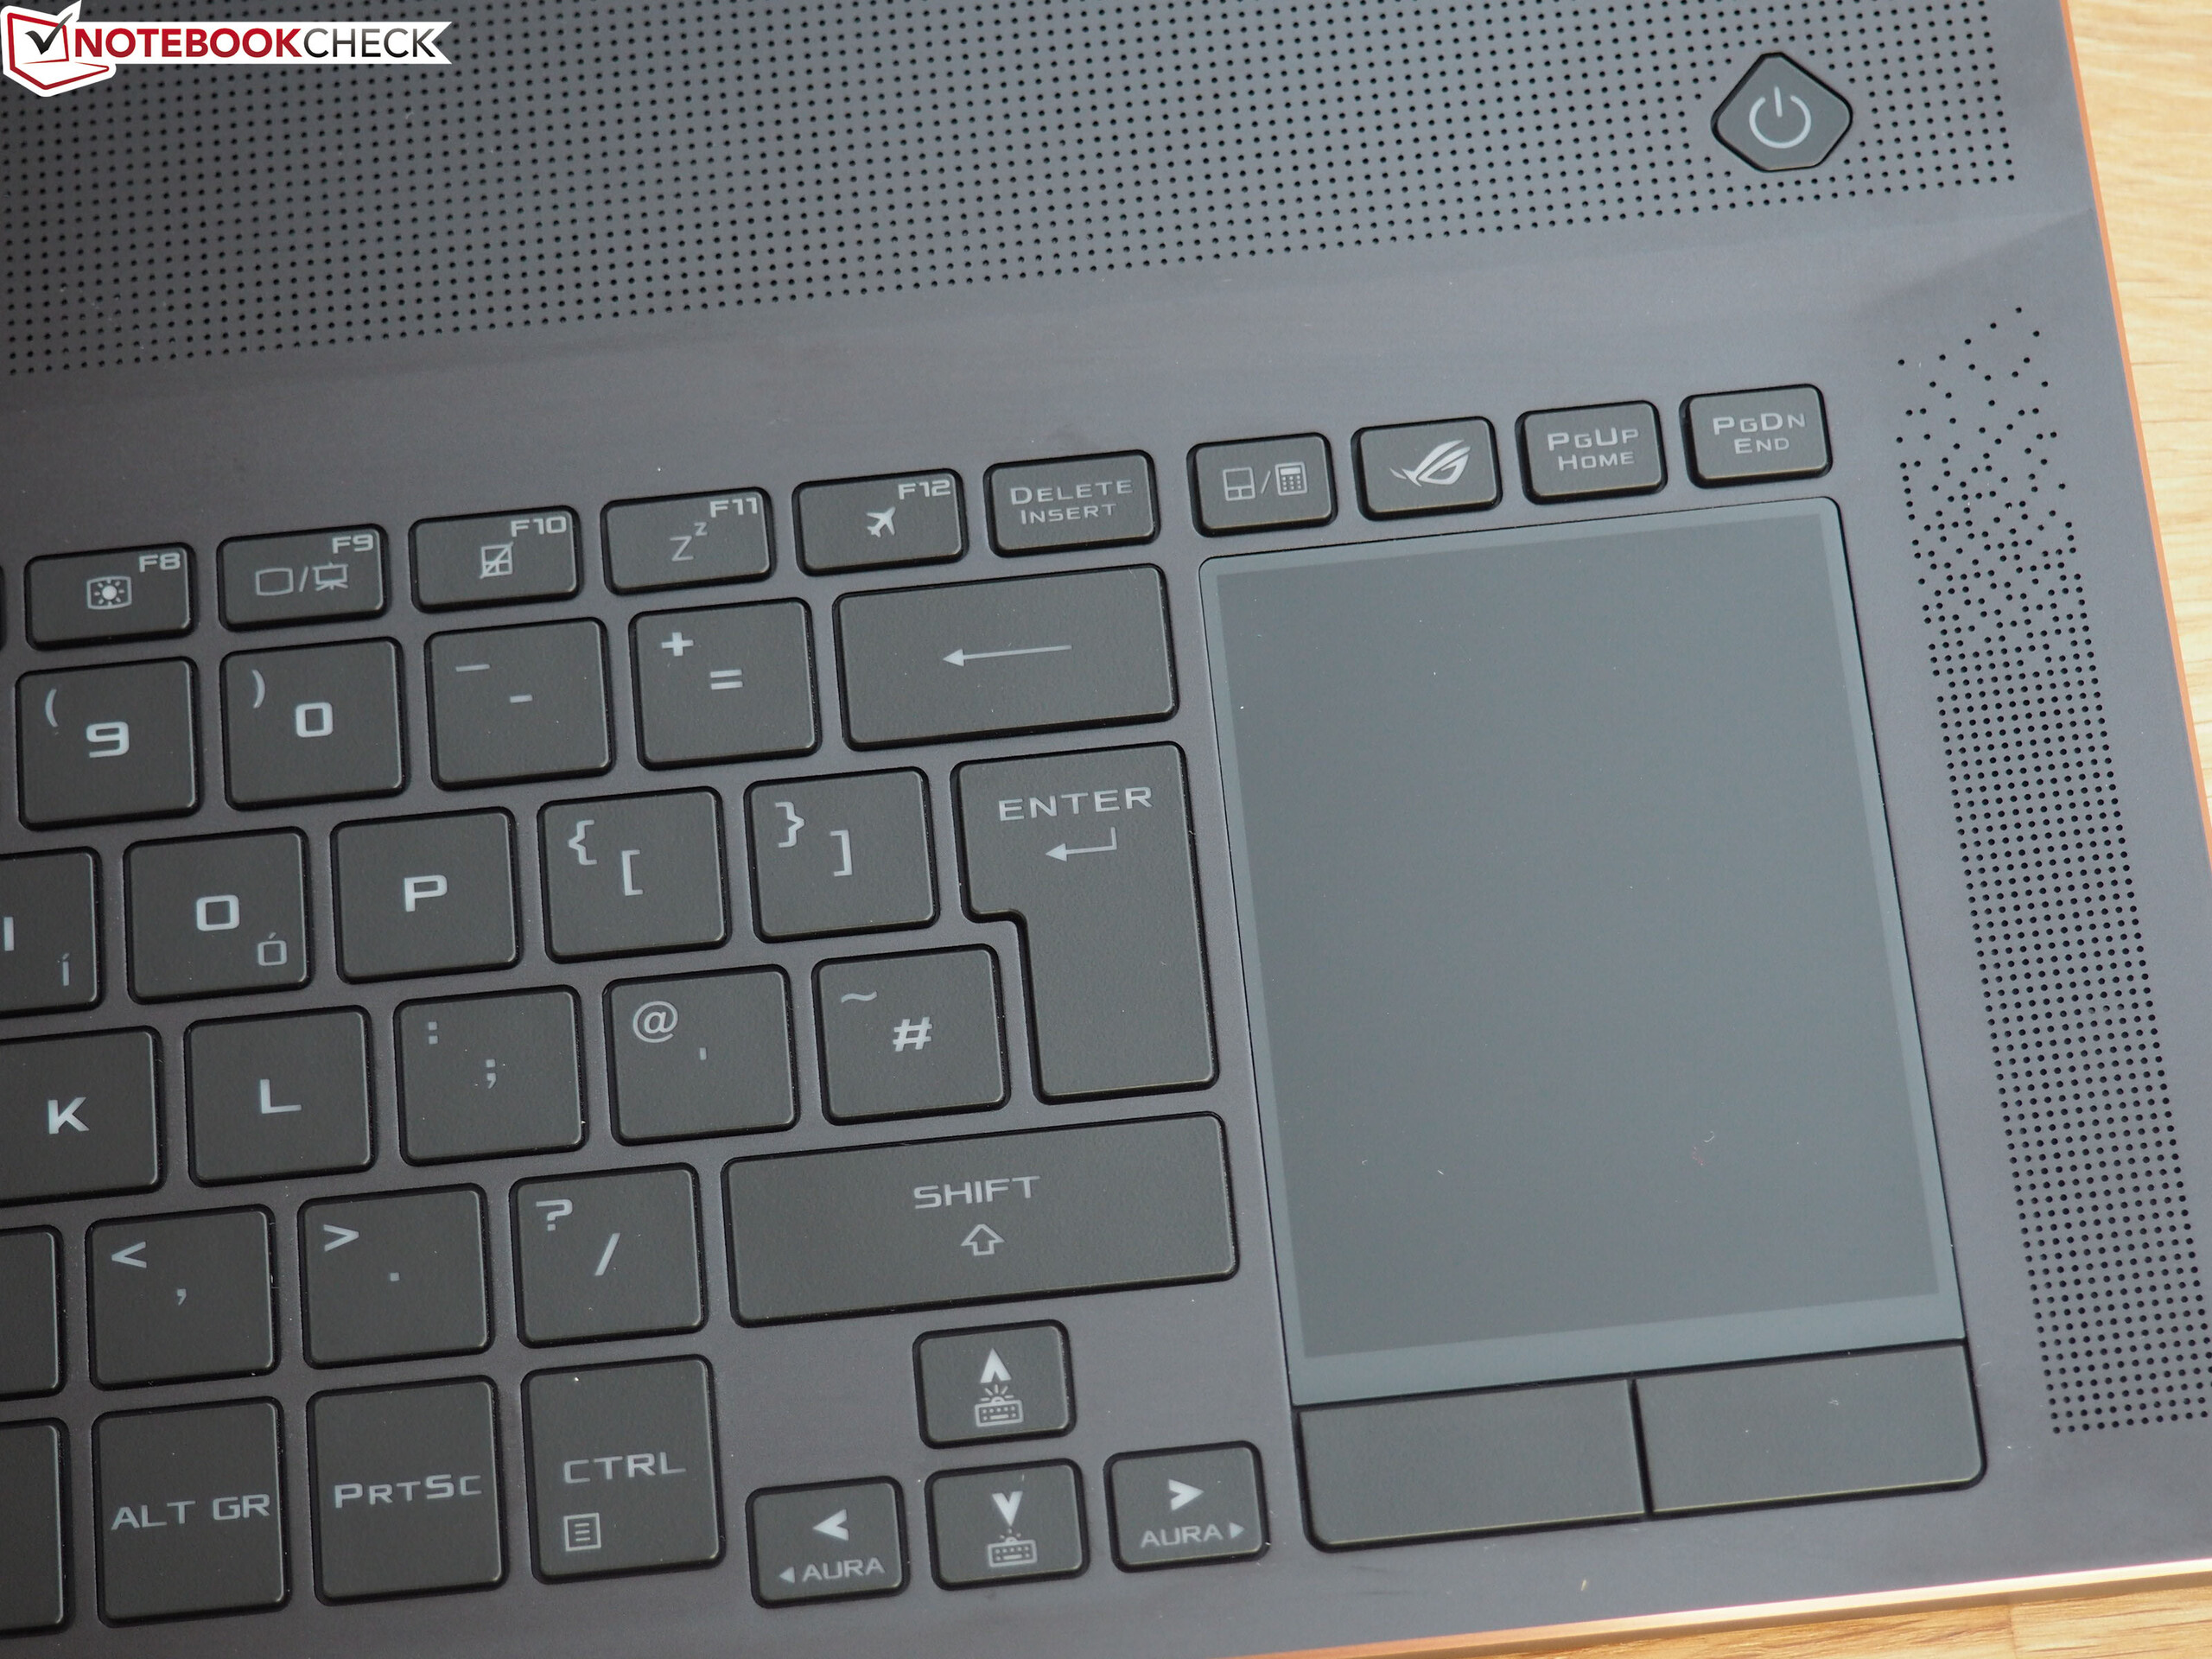
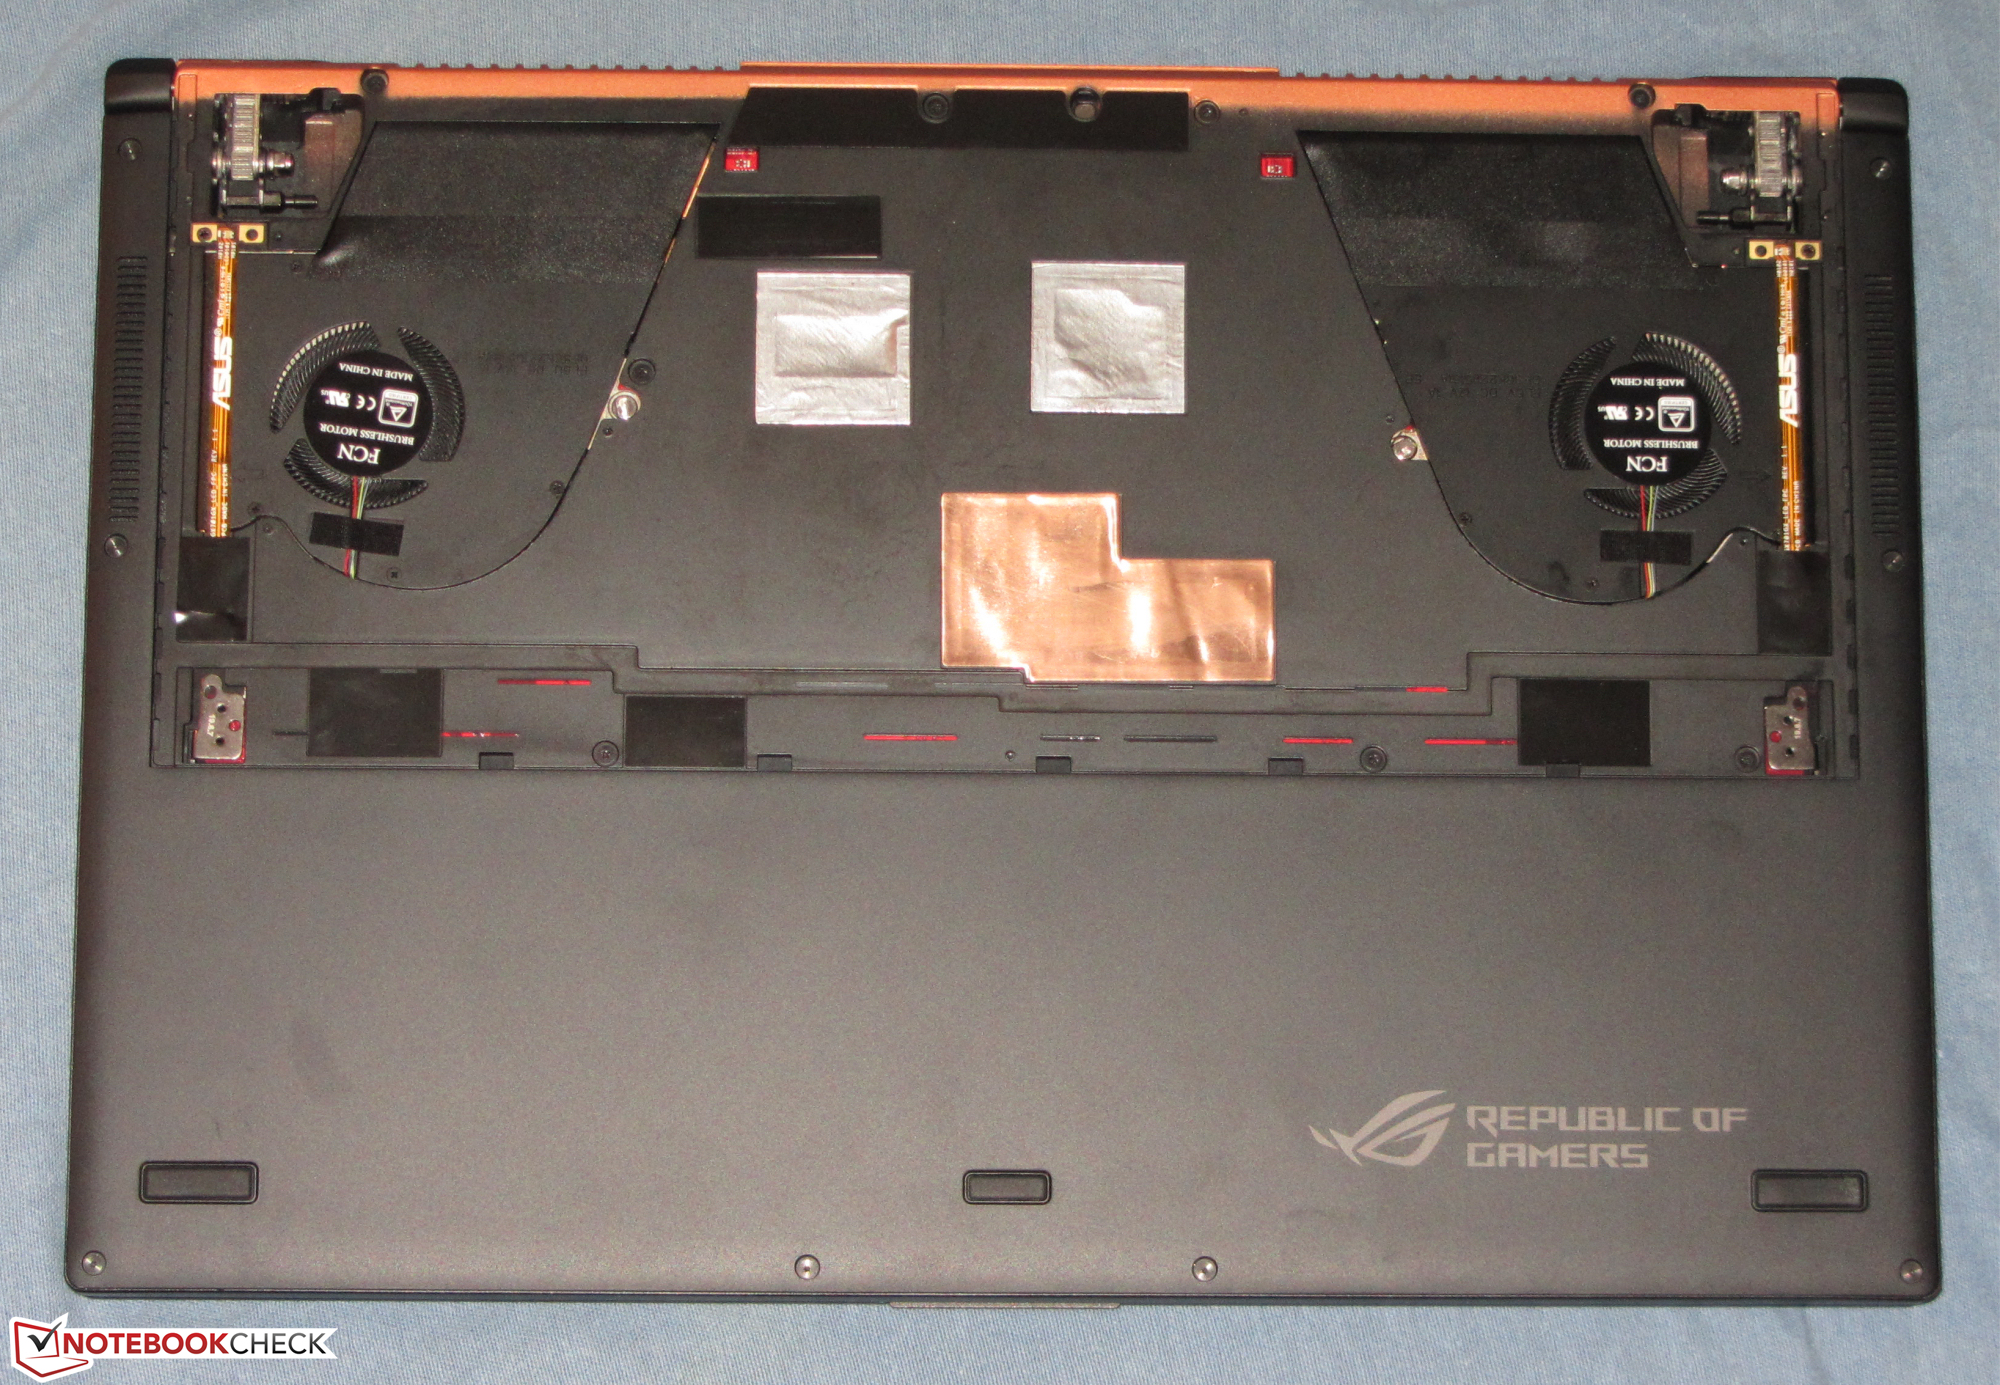
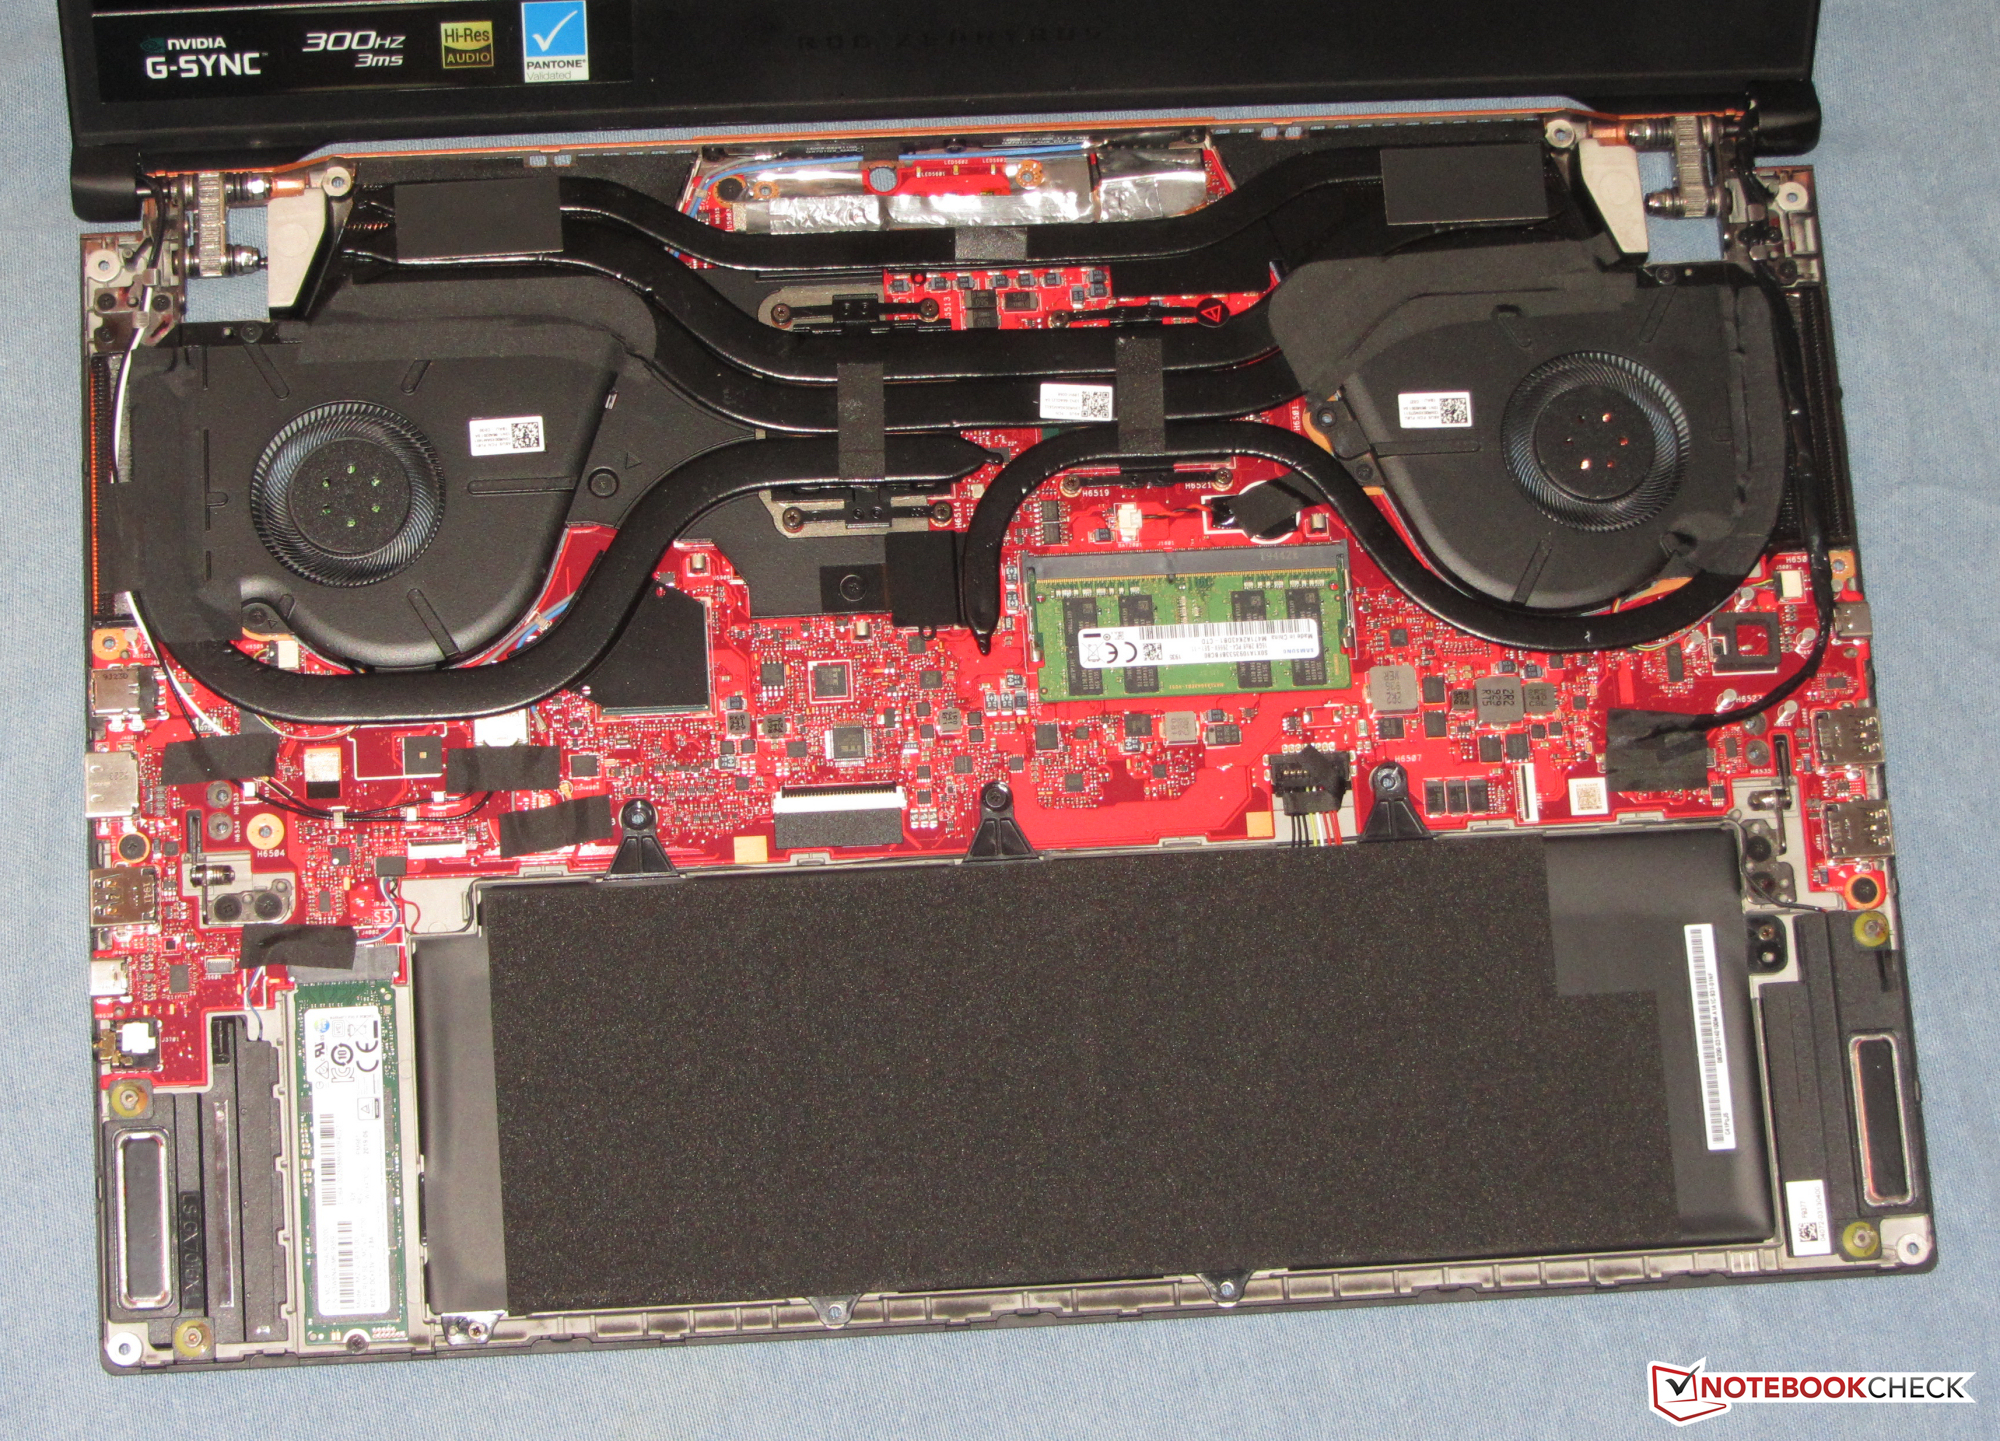
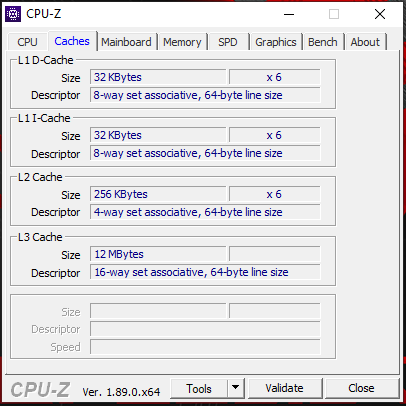
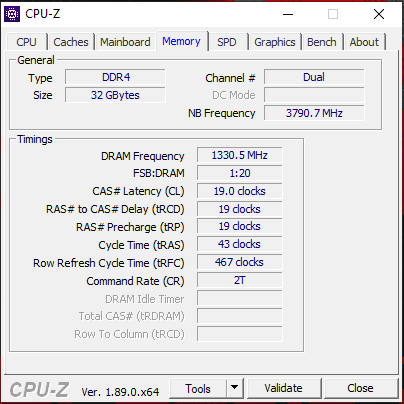
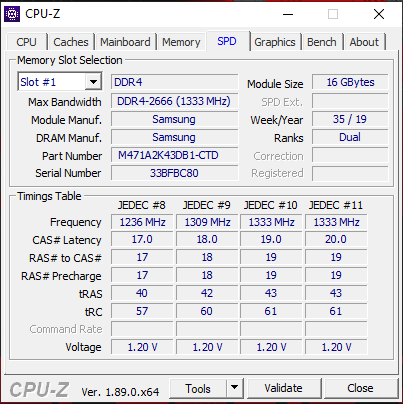
As opções de atualização são muito limitadas. Somente um meio de armazenamento (SSD M.2) pode ser instalado; Não há espaço para um disco rígido de 2,5 polegadas. Além disso, o computador possui apenas um slot de memória (16 GB de RAM estão soldados). Não há suporte para mais memória do que os 32 GB de instalados. Além disso, abrir a carcaça acaba sendo mais complexo do que com muitos concorrentes.
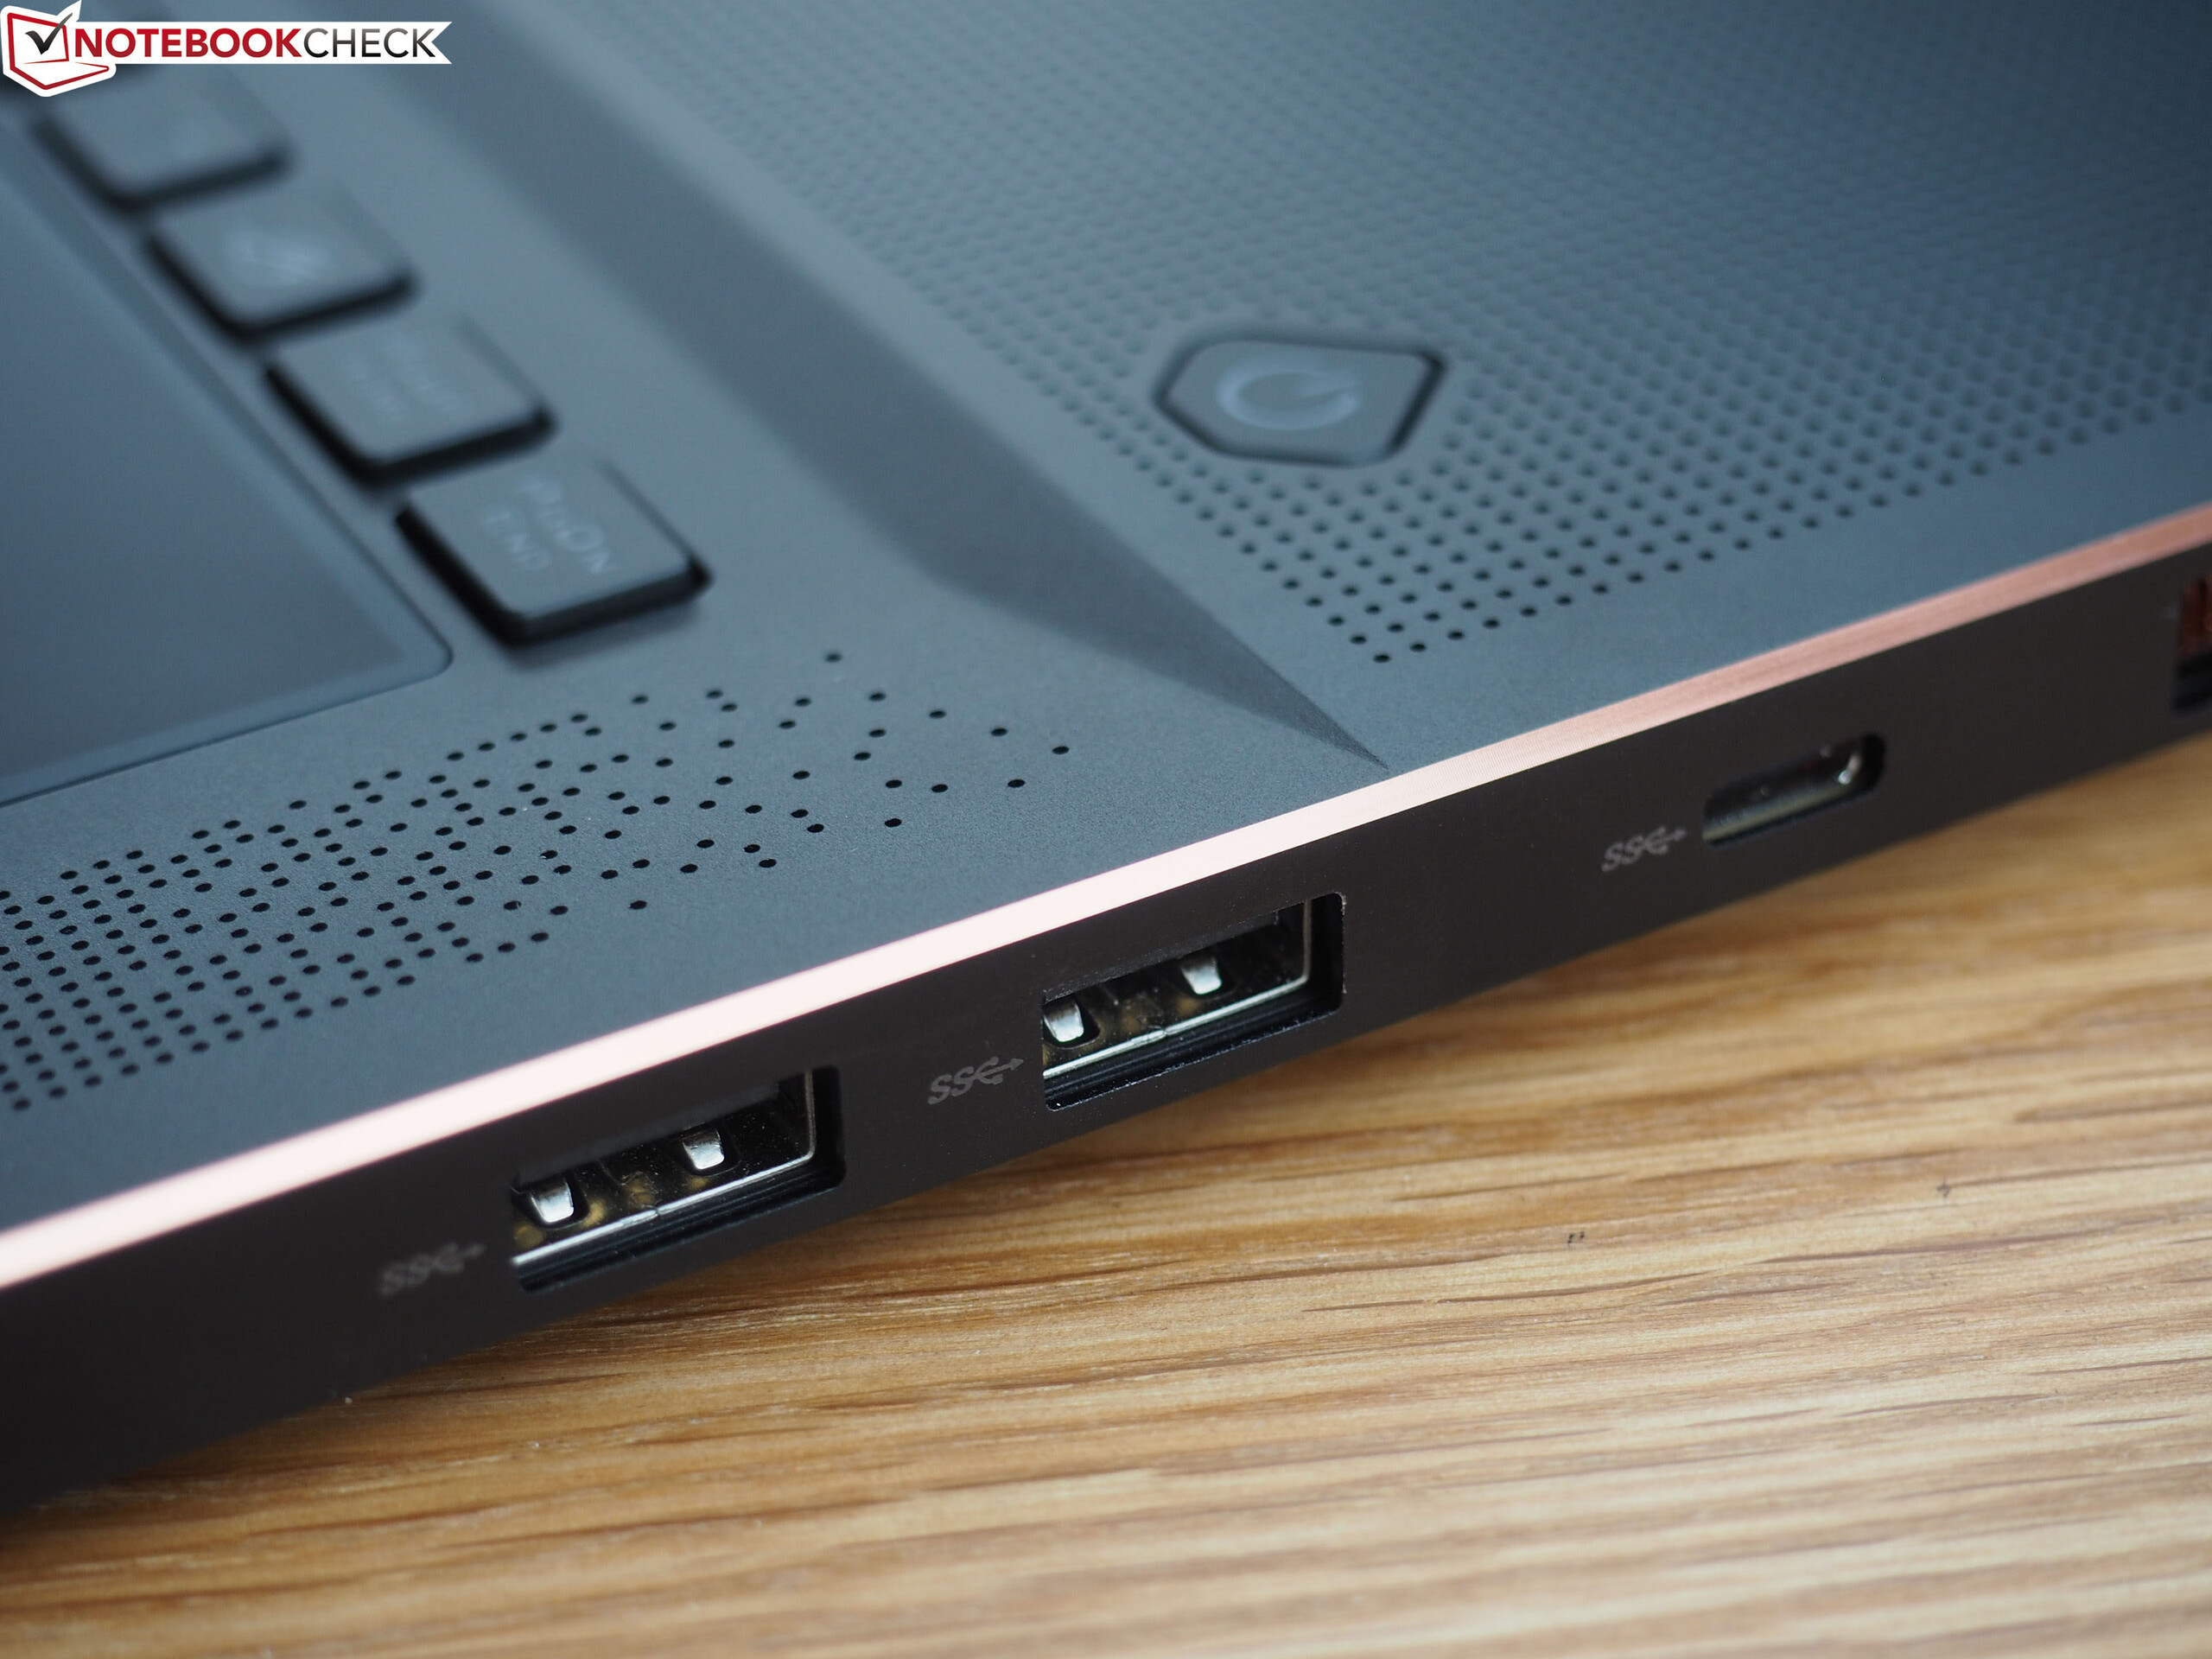
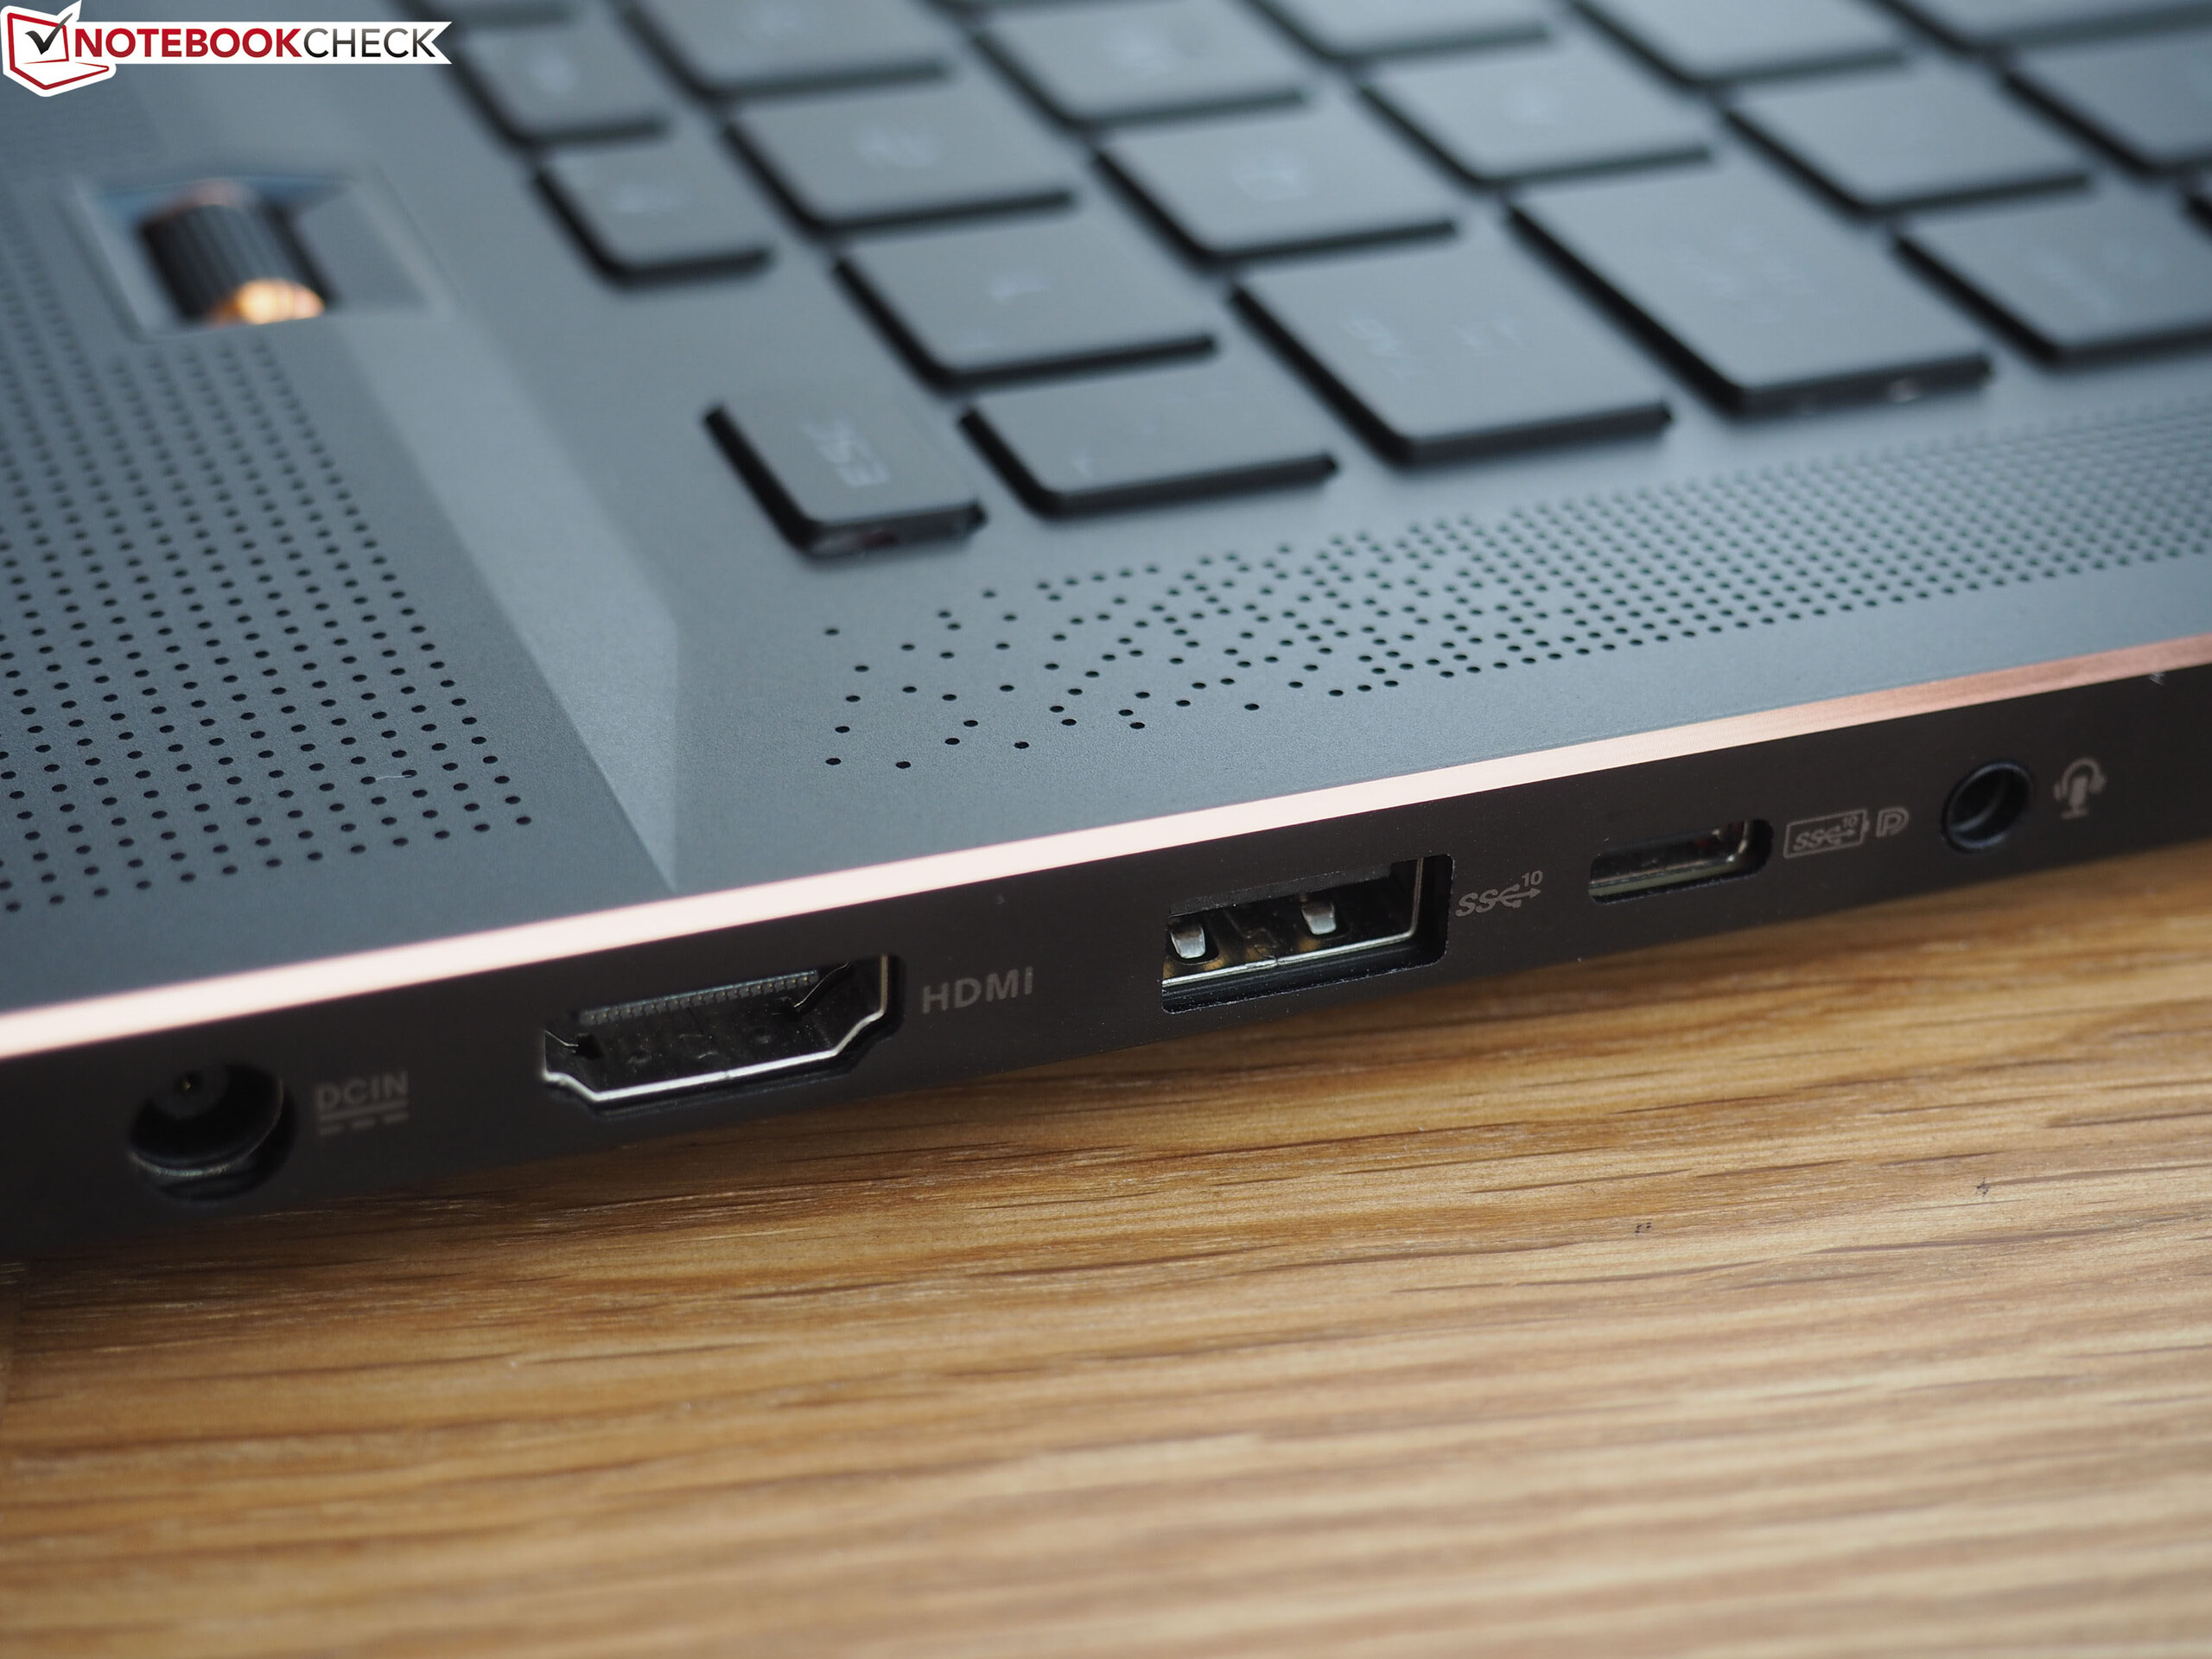
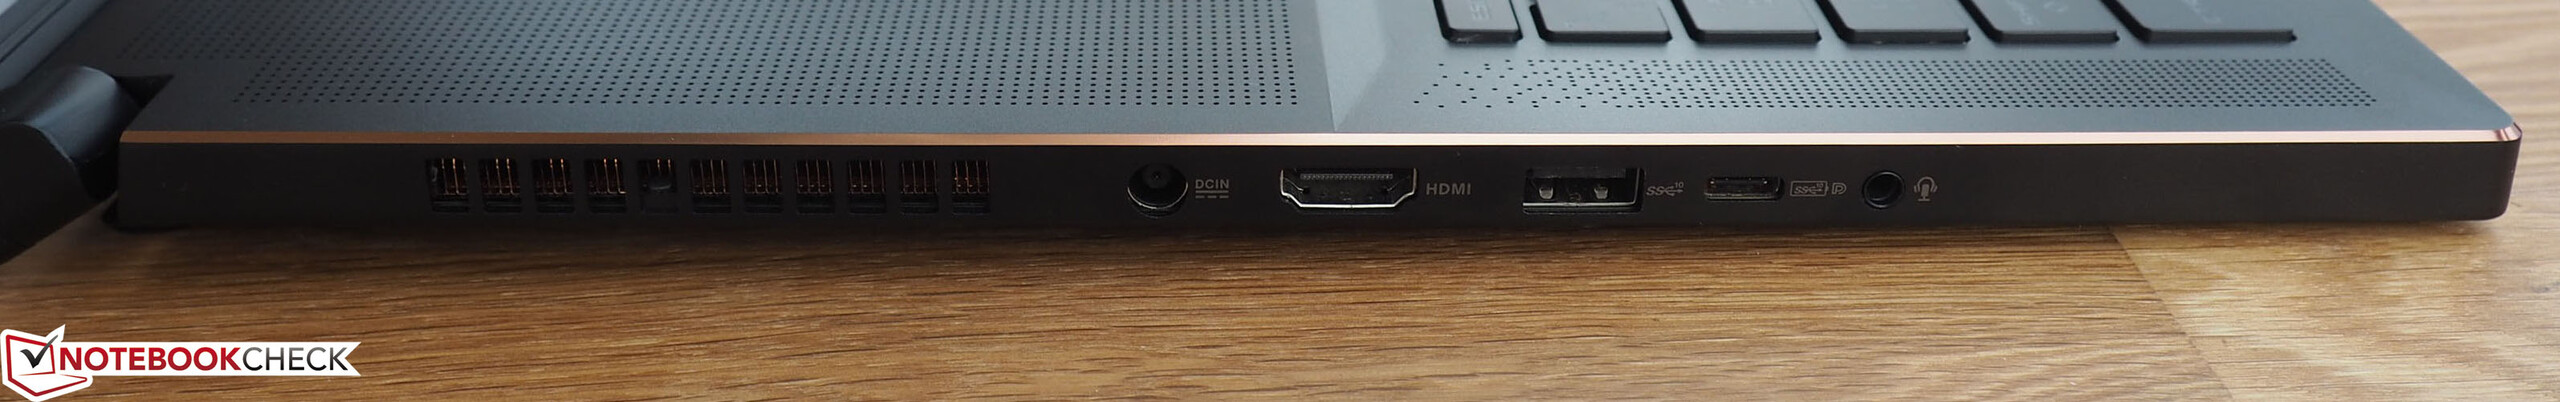
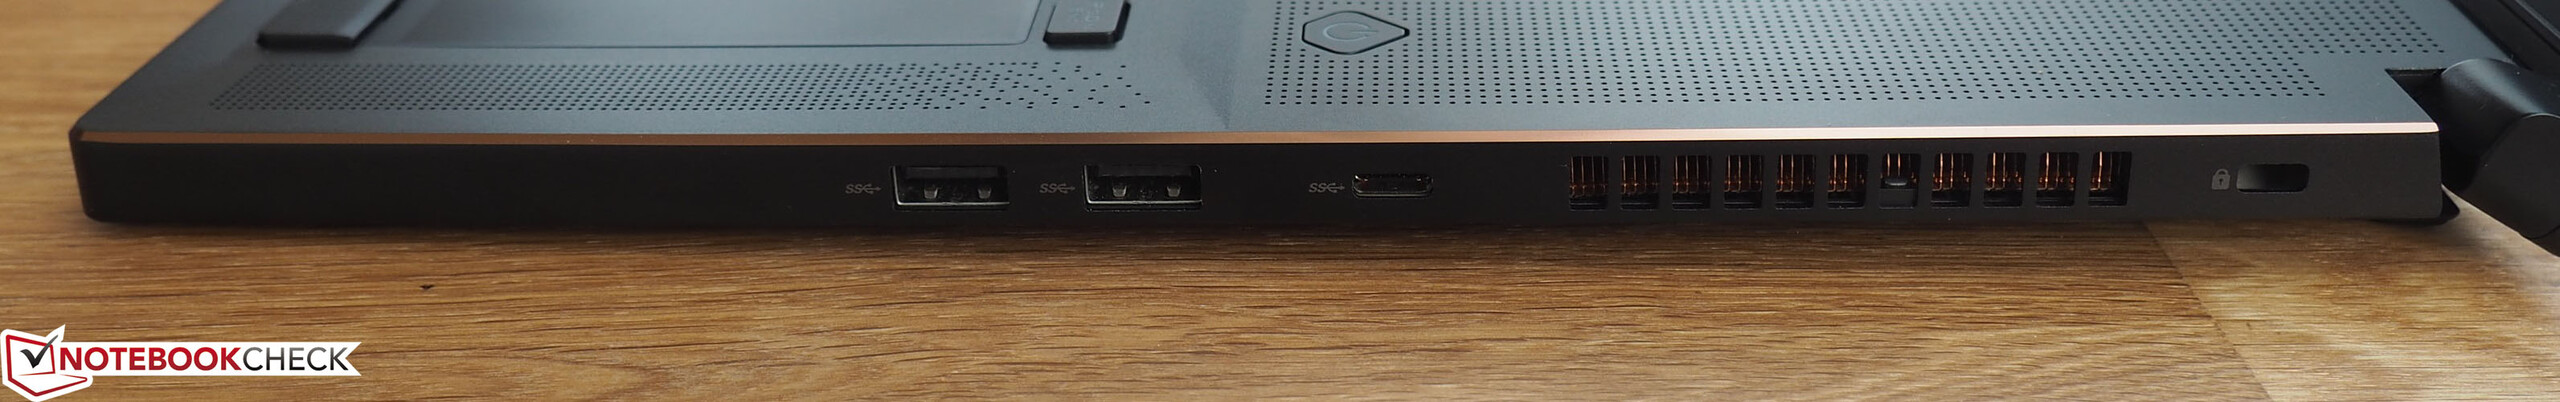
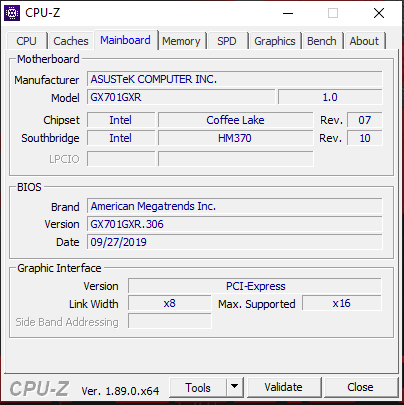
Também há espaço para melhorias em termos de portas. A Asus não equipa o portátil com uma porta Thunderbolt 3, mas apenas com duas portas USB Tipo C 3.1 (1x Gen 1, 1x Gen 2). O dispositivo também não fornece um leitor de cartão de memória ou uma porta Ethernet. Os usuários que esperam mais em termos de atualização/manutenção ou seleção de portas devem recorrer a um dispositivo concorrente - por exemplo, o Breve Análise do Portátil Razer Blade Pro (17) ou o Gigabyte Aero 17 XA.
Asus ROG Zephyrus S GX701GXR
- 05/14/2020 v7 (old)
Sascha Mölck