Muito melhor que antes: Breve Análise do Portátil Razer Blade Pro (17)
| SD Card Reader | |
| average JPG Copy Test (av. of 3 runs) | |
| Dell XPS 15 9570 Core i9 UHD (Toshiba Exceria Pro SDXC 64 GB UHS-II) | |
| Razer Blade Pro 17 RTX 2080 Max-Q (Toshiba Exceria Pro SDXC 64 GB UHS-II) | |
| Asus ROG Strix Scar II GL704GW (Toshiba Exceria Pro SDXC 64 GB UHS-II) | |
| Razer Blade Pro 2017 (Toshiba Exceria Pro SDXC 64 GB UHS-II) | |
| maximum AS SSD Seq Read Test (1GB) | |
| Dell XPS 15 9570 Core i9 UHD (Toshiba Exceria Pro SDXC 64 GB UHS-II) | |
| Razer Blade Pro 17 RTX 2080 Max-Q (Toshiba Exceria Pro SDXC 64 GB UHS-II) | |
| Asus ROG Strix Scar II GL704GW (Toshiba Exceria Pro SDXC 64 GB UHS-II) | |
| Razer Blade Pro 2017 (Toshiba Exceria Pro SDXC 64 GB UHS-II) | |
| |||||||||||||||||||||||||
iluminação: 94 %
iluminação com acumulador: 299.3 cd/m²
Contraste: 1032:1 (Preto: 0.29 cd/m²)
ΔE ColorChecker Calman: 2.55 | ∀{0.5-29.43 Ø4.73}
calibrated: 2.9
ΔE Greyscale Calman: 3.5 | ∀{0.09-98 Ø4.97}
88.7% sRGB (Argyll 1.6.3 3D)
57% AdobeRGB 1998 (Argyll 1.6.3 3D)
62.1% AdobeRGB 1998 (Argyll 3D)
89% sRGB (Argyll 3D)
60.6% Display P3 (Argyll 3D)
Gamma: 2.28
CCT: 7101 K
| Razer Blade Pro 17 RTX 2080 Max-Q AU Optronics B173HAN04.0, IPS, 17.3", 1920x1080 | Asus Zephyrus S GX701GX B173HAN04.0 (AUO409D), IPS, 17.3", 1920x1080 | Lenovo Legion Y740-17ICH AU Optronics B173HAN03.2, IPS, 17.3", 1920x1080 | Razer Blade Pro 2017 Sharp LQ173D1JW33 (SHP145A), IGZO, 17.3", 3840x2160 | MSI GS75 8SG Stealth N173HCE-G33 (CMN175C), IPS, 17.3", 1920x1080 | Alienware m17 P37E AU Optronics B173ZAN01.0, IPS, 17.3", 3840x2160 | |
|---|---|---|---|---|---|---|
| Display | 2% | 4% | 40% | 6% | 38% | |
| Display P3 Coverage (%) | 60.6 | 62.9 4% | 64 6% | 88.9 47% | 63.6 5% | 86.4 43% |
| sRGB Coverage (%) | 89 | 87.8 -1% | 90.4 2% | 100 12% | 95.4 7% | 99.9 12% |
| AdobeRGB 1998 Coverage (%) | 62.1 | 63.9 3% | 64.8 4% | 99.7 61% | 65.5 5% | 99.1 60% |
| Response Times | -3% | -81% | -547% | -6% | -308% | |
| Response Time Grey 50% / Grey 80% * (ms) | 6.8 ? | 7.2 ? -6% | 15.6 ? -129% | 60.8 ? -794% | 7.6 ? -12% | 35.6 ? -424% |
| Response Time Black / White * (ms) | 9.6 ? | 9.6 ? -0% | 12.8 ? -33% | 38.4 ? -300% | 9.6 ? -0% | 28 ? -192% |
| PWM Frequency (Hz) | 204.9 ? | 25510 ? | ||||
| Screen | 13% | -30% | -22% | 24% | -29% | |
| Brightness middle (cd/m²) | 299.3 | 288 -4% | 299.1 0% | 230 -23% | 355 19% | 357.9 20% |
| Brightness (cd/m²) | 294 | 287 -2% | 273 -7% | 207 -30% | 327 11% | 347 18% |
| Brightness Distribution (%) | 94 | 91 -3% | 81 -14% | 83 -12% | 85 -10% | 94 0% |
| Black Level * (cd/m²) | 0.29 | 0.2 31% | 0.27 7% | 0.2 31% | 0.26 10% | 0.33 -14% |
| Contrast (:1) | 1032 | 1440 40% | 1108 7% | 1150 11% | 1365 32% | 1085 5% |
| Colorchecker dE 2000 * | 2.55 | 2.33 9% | 5.07 -99% | 5.62 -120% | 1.54 40% | 6.57 -158% |
| Colorchecker dE 2000 max. * | 4.73 | 5.34 -13% | 10.55 -123% | 10.24 -116% | 3 37% | 9.86 -108% |
| Colorchecker dE 2000 calibrated * | 2.9 | 2.47 15% | 3.31 -14% | 0.77 73% | 6.74 -132% | |
| Greyscale dE 2000 * | 3.5 | 1.19 66% | 6.8 -94% | 4.54 -30% | 2.19 37% | 4.3 -23% |
| Gamma | 2.28 96% | 2.41 91% | 2.46 89% | 2.36 93% | 2.42 91% | 2.6 85% |
| CCT | 7101 92% | 6710 97% | 7805 83% | 6625 98% | 6893 94% | 6403 102% |
| Color Space (Percent of AdobeRGB 1998) (%) | 57 | 57 0% | 58.5 3% | 88 54% | 61 7% | 88.4 55% |
| Color Space (Percent of sRGB) (%) | 88.7 | 88 -1% | 89.9 1% | 100 13% | 95 7% | 100 13% |
| Média Total (Programa/Configurações) | 4% /
9% | -36% /
-30% | -176% /
-80% | 8% /
17% | -100% /
-52% |
* ... menor é melhor
Exibir tempos de resposta
| ↔ Tempo de resposta preto para branco | ||
|---|---|---|
| 9.6 ms ... ascensão ↗ e queda ↘ combinadas | ↗ 5.2 ms ascensão | 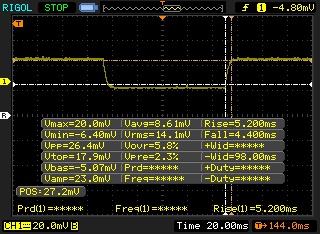 |
| ↘ 4.4 ms queda | ||
| A tela mostra taxas de resposta rápidas em nossos testes e deve ser adequada para jogos. Em comparação, todos os dispositivos testados variam de 0.1 (mínimo) a 240 (máximo) ms. » 26 % de todos os dispositivos são melhores. Isso significa que o tempo de resposta medido é melhor que a média de todos os dispositivos testados (19.9 ms). | ||
| ↔ Tempo de resposta 50% cinza a 80% cinza | ||
| 6.8 ms ... ascensão ↗ e queda ↘ combinadas | ↗ 3.4 ms ascensão | 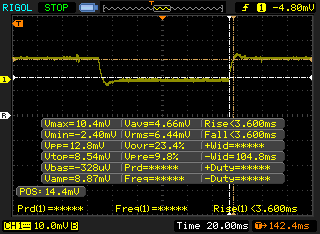 |
| ↘ 3.4 ms queda | ||
| A tela mostra taxas de resposta muito rápidas em nossos testes e deve ser muito adequada para jogos em ritmo acelerado. Em comparação, todos os dispositivos testados variam de 0.165 (mínimo) a 636 (máximo) ms. » 19 % de todos os dispositivos são melhores. Isso significa que o tempo de resposta medido é melhor que a média de todos os dispositivos testados (31.1 ms). | ||
Cintilação da tela / PWM (modulação por largura de pulso)
| Tela tremeluzindo / PWM não detectado | 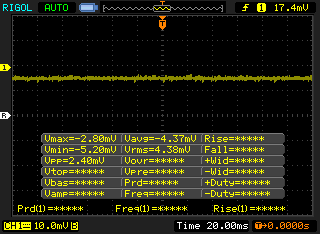 | ||
[pwm_comparison] Em comparação: 52 % de todos os dispositivos testados não usam PWM para escurecer a tela. Se PWM foi detectado, uma média de 7798 (mínimo: 5 - máximo: 343500) Hz foi medida. | |||
| Cinebench R11.5 | |
| CPU Single 64Bit | |
| MSI GE75 9SG | |
| Média Intel Core i7-9750H (1.96 - 2.19, n=10) | |
| Razer Blade Pro 2017 | |
| Asus ROG Zephyrus G15 GA502DU | |
| CPU Multi 64Bit | |
| MSI GE75 9SG | |
| Média Intel Core i7-9750H (11.3 - 14.1, n=10) | |
| Asus ROG Zephyrus G15 GA502DU | |
| Razer Blade Pro 2017 | |
| Cinebench R10 | |
| Rendering Multiple CPUs 32Bit | |
| MSI GE75 9SG | |
| Média Intel Core i7-9750H (28251 - 36304, n=13) | |
| Asus ROG Zephyrus G15 GA502DU | |
| Rendering Single 32Bit | |
| MSI GE75 9SG | |
| Média Intel Core i7-9750H (6659 - 7214, n=13) | |
| Asus ROG Zephyrus G15 GA502DU | |
| wPrime 2.10 - 1024m | |
| Asus ROG Zephyrus G15 GA502DU | |
| Média Intel Core i7-9750H (n=1) | |
| MSI GE75 9SG | |
* ... menor é melhor
| PCMark 8 Home Score Accelerated v2 | 4412 pontos | |
| PCMark 8 Work Score Accelerated v2 | 5672 pontos | |
| PCMark 10 Score | 5734 pontos | |
Ajuda | ||
| Razer Blade Pro 17 RTX 2080 Max-Q Samsung SSD PM981 MZVLB512HAJQ | Asus ROG Strix Scar II GL704GW Intel SSD 660p SSDPEKNW512G8 | Alienware m17 P37E SK Hynix PC401 512GB M.2 (HFS512GD9TNG) | Lenovo Legion Y740-17ICH Samsung SSD PM981 MZVLB256HAHQ | Razer Blade Pro 2017 2x Samsung SSD PM951 MZVLV256HCHP (RAID 0) | MSI GS75 8SG Stealth 2x Samsung SSD PM981 MZVLB512HAJQ (RAID 0) | |
|---|---|---|---|---|---|---|
| AS SSD | -40% | -26% | -10% | -19% | 7% | |
| Seq Read (MB/s) | 1831 | 1315 -28% | 1835 0% | 1153 -37% | 2599 42% | 3005 64% |
| Seq Write (MB/s) | 1744 | 927 -47% | 1121 -36% | 1328 -24% | 588 -66% | 2668 53% |
| 4K Read (MB/s) | 45.16 | 52.4 16% | 23.98 -47% | 35.05 -22% | 37.57 -17% | 40.89 -9% |
| 4K Write (MB/s) | 107.1 | 122.8 15% | 100 -7% | 96 -10% | 104.4 -3% | 94.4 -12% |
| 4K-64 Read (MB/s) | 1240 | 326.5 -74% | 687 -45% | 727 -41% | 1116 -10% | 1366 10% |
| 4K-64 Write (MB/s) | 1695 | 727 -57% | 776 -54% | 1212 -28% | 513 -70% | 1197 -29% |
| Access Time Read * (ms) | 0.064 | 0.11 -72% | 0.047 27% | 0.063 2% | 0.051 20% | 0.055 14% |
| Access Time Write * (ms) | 0.037 | 0.045 -22% | 0.053 -43% | 0.04 -8% | 0.036 3% | 0.039 -5% |
| Score Read (Points) | 1468 | 510 -65% | 895 -39% | 878 -40% | 1414 -4% | 1708 16% |
| Score Write (Points) | 1977 | 942 -52% | 988 -50% | 1441 -27% | 676 -66% | 1558 -21% |
| Score Total (Points) | 4197 | 1715 -59% | 2306 -45% | 2784 -34% | 2715 -35% | 4123 -2% |
| Copy ISO MB/s (MB/s) | 2086 | 773 -63% | 1487 -29% | |||
| Copy Program MB/s (MB/s) | 425.5 | 493 16% | 608 43% | |||
| Copy Game MB/s (MB/s) | 555 | 647 17% | 1162 109% |
* ... menor é melhor

| 3DMark 11 Performance | 22693 pontos | |
| 3DMark Cloud Gate Standard Score | 38597 pontos | |
| 3DMark Fire Strike Score | 18887 pontos | |
| 3DMark Time Spy Score | 8460 pontos | |
Ajuda | ||
| baixo | média | alto | ultra | |
|---|---|---|---|---|
| BioShock Infinite (2013) | 307.6 | 282.2 | 252.3 | 177.7 |
| The Witcher 3 (2015) | 287.9 | 237.3 | 152.2 | 87.4 |
| Rocket League (2017) | 249 | 247.7 | 248.4 |
| Razer Blade Pro 17 RTX 2080 Max-Q GeForce RTX 2080 Max-Q, i7-9750H, Samsung SSD PM981 MZVLB512HAJQ | Asus ROG Strix Scar II GL704GW GeForce RTX 2070 Mobile, i7-8750H, Intel SSD 660p SSDPEKNW512G8 | Alienware m17 P37E GeForce RTX 2080 Max-Q, i9-8950HK, SK Hynix PC401 512GB M.2 (HFS512GD9TNG) | Lenovo Legion Y740-17ICH GeForce RTX 2080 Max-Q, i7-8750H, Samsung SSD PM981 MZVLB256HAHQ | Razer Blade Pro 2017 GeForce GTX 1080 Mobile, i7-7820HK, 2x Samsung SSD PM951 MZVLV256HCHP (RAID 0) | MSI GS75 8SG Stealth GeForce RTX 2080 Max-Q, i7-8750H, 2x Samsung SSD PM981 MZVLB512HAJQ (RAID 0) | |
|---|---|---|---|---|---|---|
| Noise | -8% | -3% | 4% | -7% | -8% | |
| desligado / ambiente * (dB) | 28.2 | 29 -3% | 28.2 -0% | 28.3 -0% | 30 -6% | 30 -6% |
| Idle Minimum * (dB) | 28.2 | 29 -3% | 28.2 -0% | 31.5 -12% | 30 -6% | 31 -10% |
| Idle Average * (dB) | 28.2 | 32 -13% | 28.2 -0% | 31.6 -12% | 31 -10% | 32 -13% |
| Idle Maximum * (dB) | 30.8 | 40 -30% | 31 -1% | 31.6 -3% | 33 -7% | 41 -33% |
| Load Average * (dB) | 42 | 46 -10% | 50.8 -21% | 32.3 23% | 43 -2% | 47 -12% |
| Witcher 3 ultra * (dB) | 51 | 51 -0% | 50.8 -0% | 43 16% | 55 -8% | 47 8% |
| Load Maximum * (dB) | 53 | 52 2% | 50.8 4% | 45.5 14% | 58 -9% | 48 9% |
* ... menor é melhor
Barulho
| Ocioso |
| 28.2 / 28.2 / 30.8 dB |
| Carga |
| 42 / 53 dB |
 | ||
30 dB silencioso 40 dB(A) audível 50 dB(A) ruidosamente alto |
||
min: | ||
(±) A temperatura máxima no lado superior é 43 °C / 109 F, em comparação com a média de 40.4 °C / 105 F , variando de 21.2 a 68.8 °C para a classe Gaming.
(-) A parte inferior aquece até um máximo de 47.2 °C / 117 F, em comparação com a média de 43.2 °C / 110 F
(+) Em uso inativo, a temperatura média para o lado superior é 25.5 °C / 78 F, em comparação com a média do dispositivo de 33.9 °C / ### class_avg_f### F.
(±) Jogando The Witcher 3, a temperatura média para o lado superior é 34.8 °C / 95 F, em comparação com a média do dispositivo de 33.9 °C / ## #class_avg_f### F.
(+) Os apoios para as mãos e o touchpad estão atingindo a temperatura máxima da pele (32.8 °C / 91 F) e, portanto, não estão quentes.
(-) A temperatura média da área do apoio para as mãos de dispositivos semelhantes foi 28.8 °C / 83.8 F (-4 °C / -7.2 F).
Razer Blade Pro 17 RTX 2080 Max-Q análise de áudio
(+) | os alto-falantes podem tocar relativamente alto (###valor### dB)
Graves 100 - 315Hz
(±) | graves reduzidos - em média 10.5% menor que a mediana
(±) | a linearidade dos graves é média (14.4% delta para a frequência anterior)
Médios 400 - 2.000 Hz
(±) | médios mais altos - em média 5.3% maior que a mediana
(+) | médios são lineares (4.6% delta para frequência anterior)
Altos 2 - 16 kHz
(+) | agudos equilibrados - apenas 3.5% longe da mediana
(±) | a linearidade dos máximos é média (10% delta para frequência anterior)
Geral 100 - 16.000 Hz
(±) | a linearidade do som geral é média (17.9% diferença em relação à mediana)
Comparado com a mesma classe
» 54% de todos os dispositivos testados nesta classe foram melhores, 9% semelhantes, 37% piores
» O melhor teve um delta de 6%, a média foi 18%, o pior foi 132%
Comparado com todos os dispositivos testados
» 37% de todos os dispositivos testados foram melhores, 8% semelhantes, 55% piores
» O melhor teve um delta de 4%, a média foi 24%, o pior foi 134%
Apple MacBook 12 (Early 2016) 1.1 GHz análise de áudio
(+) | os alto-falantes podem tocar relativamente alto (###valor### dB)
Graves 100 - 315Hz
(±) | graves reduzidos - em média 11.3% menor que a mediana
(±) | a linearidade dos graves é média (14.2% delta para a frequência anterior)
Médios 400 - 2.000 Hz
(+) | médios equilibrados - apenas 2.4% longe da mediana
(+) | médios são lineares (5.5% delta para frequência anterior)
Altos 2 - 16 kHz
(+) | agudos equilibrados - apenas 2% longe da mediana
(+) | os máximos são lineares (4.5% delta da frequência anterior)
Geral 100 - 16.000 Hz
(+) | o som geral é linear (10.2% diferença em relação à mediana)
Comparado com a mesma classe
» 7% de todos os dispositivos testados nesta classe foram melhores, 2% semelhantes, 91% piores
» O melhor teve um delta de 5%, a média foi 18%, o pior foi 53%
Comparado com todos os dispositivos testados
» 5% de todos os dispositivos testados foram melhores, 1% semelhantes, 94% piores
» O melhor teve um delta de 4%, a média foi 24%, o pior foi 134%
| desligado | |
| Ocioso | |
| Carga |
|
Key:
min: | |
| Razer Blade Pro 17 RTX 2080 Max-Q i7-9750H, GeForce RTX 2080 Max-Q, Samsung SSD PM981 MZVLB512HAJQ, IPS, 1920x1080, 17.3" | Asus ROG Strix Scar II GL704GW i7-8750H, GeForce RTX 2070 Mobile, Intel SSD 660p SSDPEKNW512G8, AHVA, 1920x1080, 17.3" | Razer Blade Pro 2017 i7-7820HK, GeForce GTX 1080 Mobile, 2x Samsung SSD PM951 MZVLV256HCHP (RAID 0), IGZO, 3840x2160, 17.3" | MSI GS75 8SG Stealth i7-8750H, GeForce RTX 2080 Max-Q, 2x Samsung SSD PM981 MZVLB512HAJQ (RAID 0), IPS, 1920x1080, 17.3" | MSI GE75 9SG i9-9880H, GeForce RTX 2080 Mobile, Samsung SSD PM981 MZVLB1T0HALR, AHVA, 1920x1080, 17.3" | MSI GP75 Leopard 9SD i7-9750H, GeForce GTX 1660 Ti Mobile, Kingston RBUSNS8154P3256GJ1, IPS, 1920x1080, 17.3" | |
|---|---|---|---|---|---|---|
| Power Consumption | -9% | -47% | 13% | -8% | 17% | |
| Idle Minimum * (Watt) | 16.2 | 19 -17% | 31 -91% | 13 20% | 13.9 14% | 10 38% |
| Idle Average * (Watt) | 20.4 | 22 -8% | 36 -76% | 17 17% | 18.8 8% | 15 26% |
| Idle Maximum * (Watt) | 26.1 | 29 -11% | 44 -69% | 23 12% | 23.1 11% | 22 16% |
| Load Average * (Watt) | 96.5 | 102 -6% | 107 -11% | 90 7% | 112.3 -16% | 92 5% |
| Witcher 3 ultra * (Watt) | 182.9 | 190 -4% | 212 -16% | 147 20% | 231 -26% | 153 16% |
| Load Maximum * (Watt) | 214.3 | 231 -8% | 258 -20% | 215 -0% | 291.5 -36% | 216 -1% |
* ... menor é melhor
| Razer Blade Pro 17 RTX 2080 Max-Q i7-9750H, GeForce RTX 2080 Max-Q, 70 Wh | Asus ROG Strix Scar II GL704GW i7-8750H, GeForce RTX 2070 Mobile, 66 Wh | Alienware m17 P37E i9-8950HK, GeForce RTX 2080 Max-Q, 90 Wh | Lenovo Legion Y740-17ICH i7-8750H, GeForce RTX 2080 Max-Q, 76 Wh | Razer Blade Pro 2017 i7-7820HK, GeForce GTX 1080 Mobile, 99 Wh | MSI GS75 8SG Stealth i7-8750H, GeForce RTX 2080 Max-Q, 80.25 Wh | MSI GE75 9SG i9-9880H, GeForce RTX 2080 Mobile, 65 Wh | |
|---|---|---|---|---|---|---|---|
| Duração da bateria | -4% | 16% | -32% | -15% | 11% | 4% | |
| Reader / Idle (h) | 4.9 | 6.2 27% | 9.1 86% | 4.2 -14% | 7.7 57% | ||
| WiFi v1.3 (h) | 4.7 | 3.9 -17% | 4.9 4% | 3.2 -32% | 3.3 -30% | 5.3 13% | 4.9 4% |
| Load (h) | 1.4 | 1.1 -21% | 0.8 -43% | 1.4 0% | 0.9 -36% | ||
| Witcher 3 ultra (h) | 0.9 |
Pro
Contra
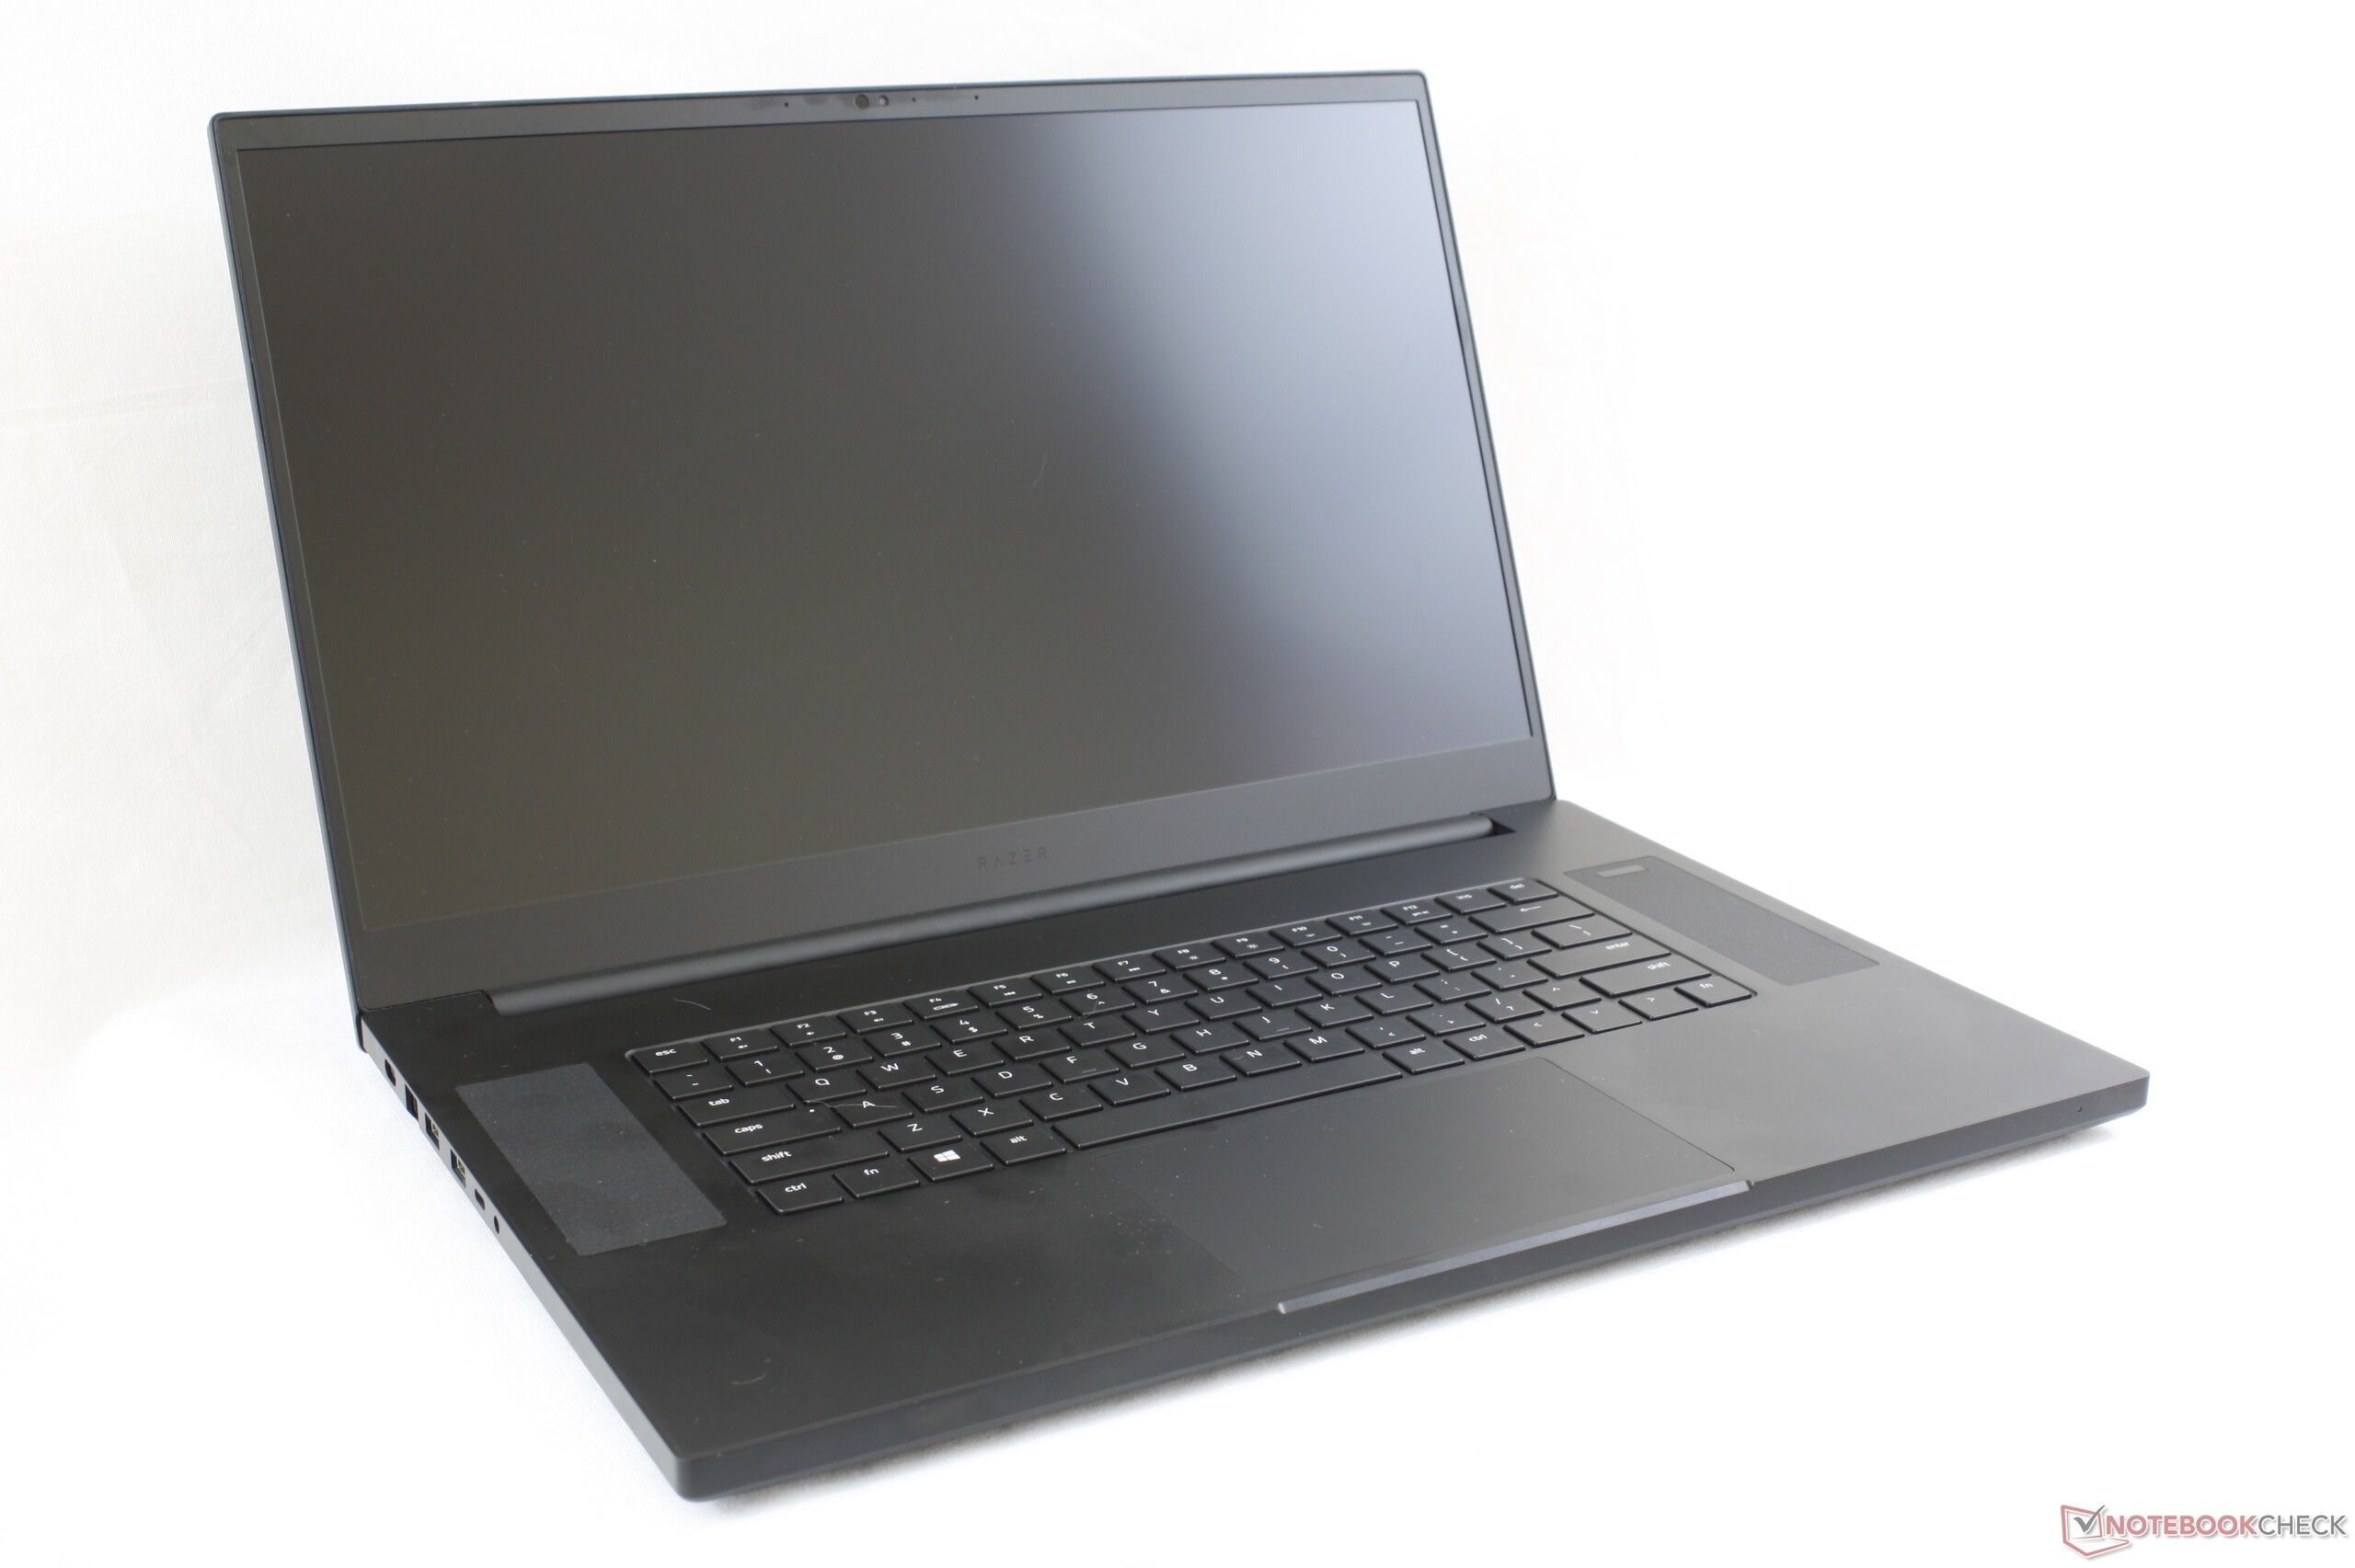
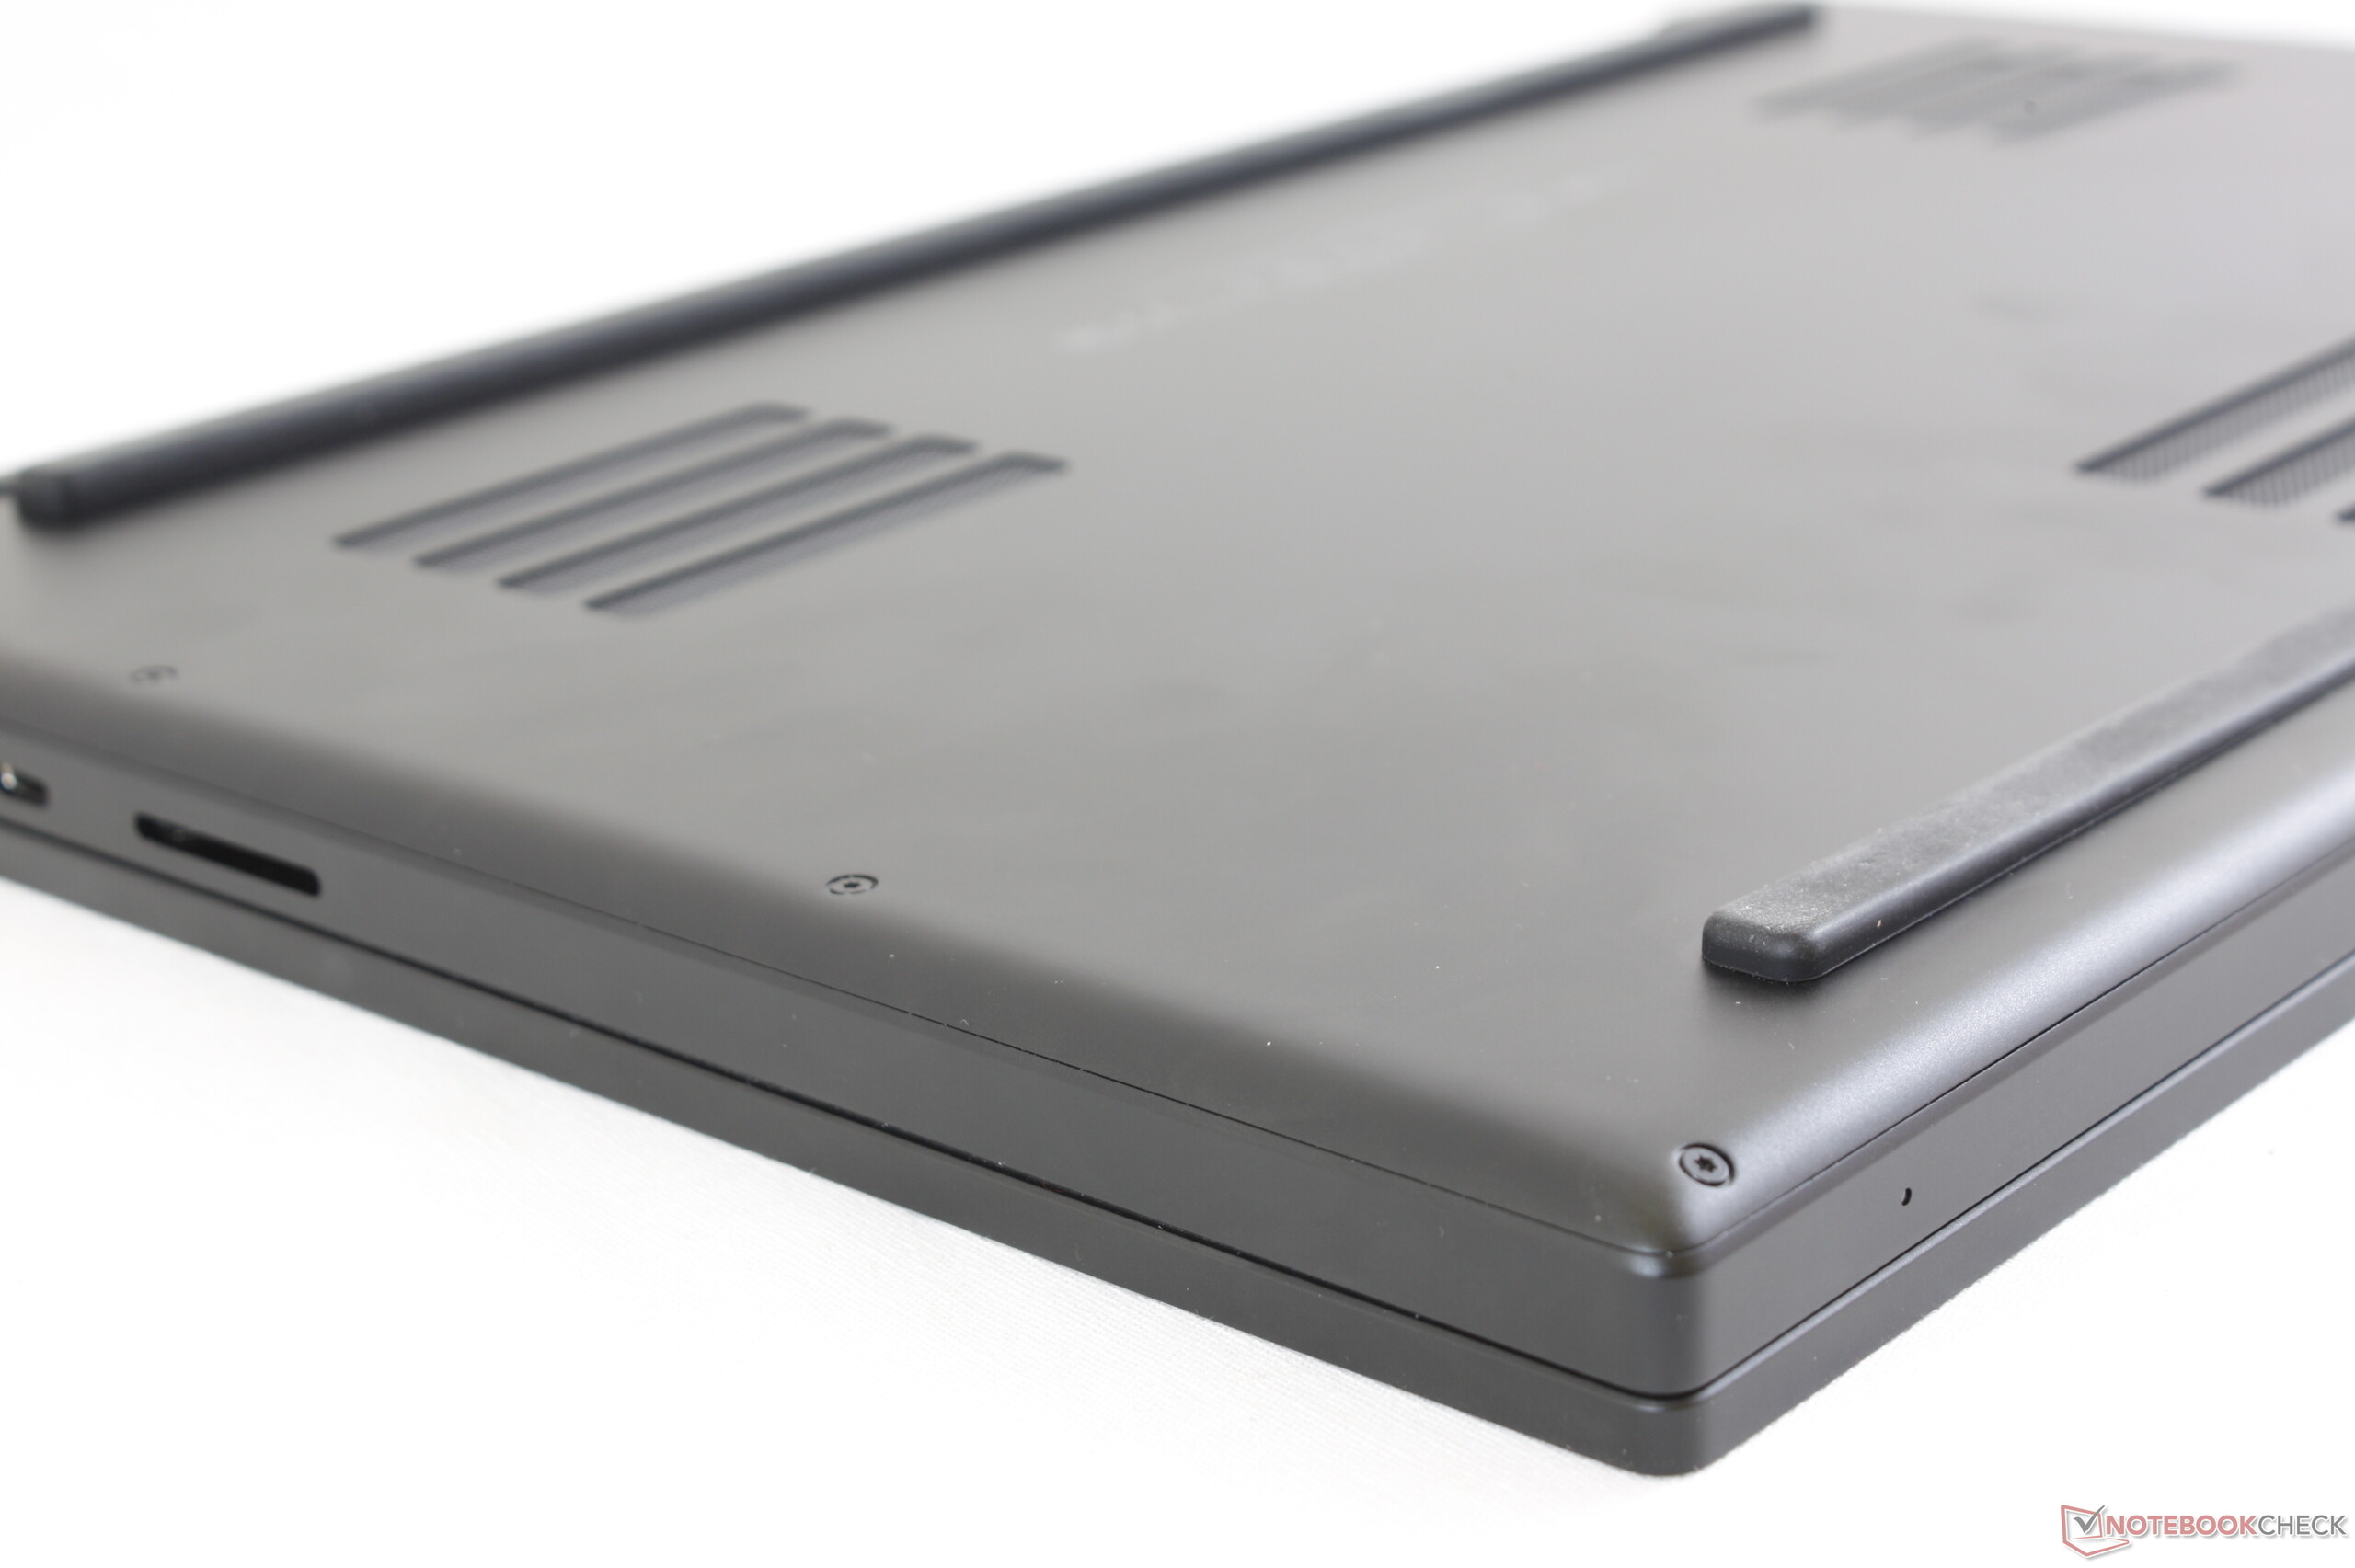
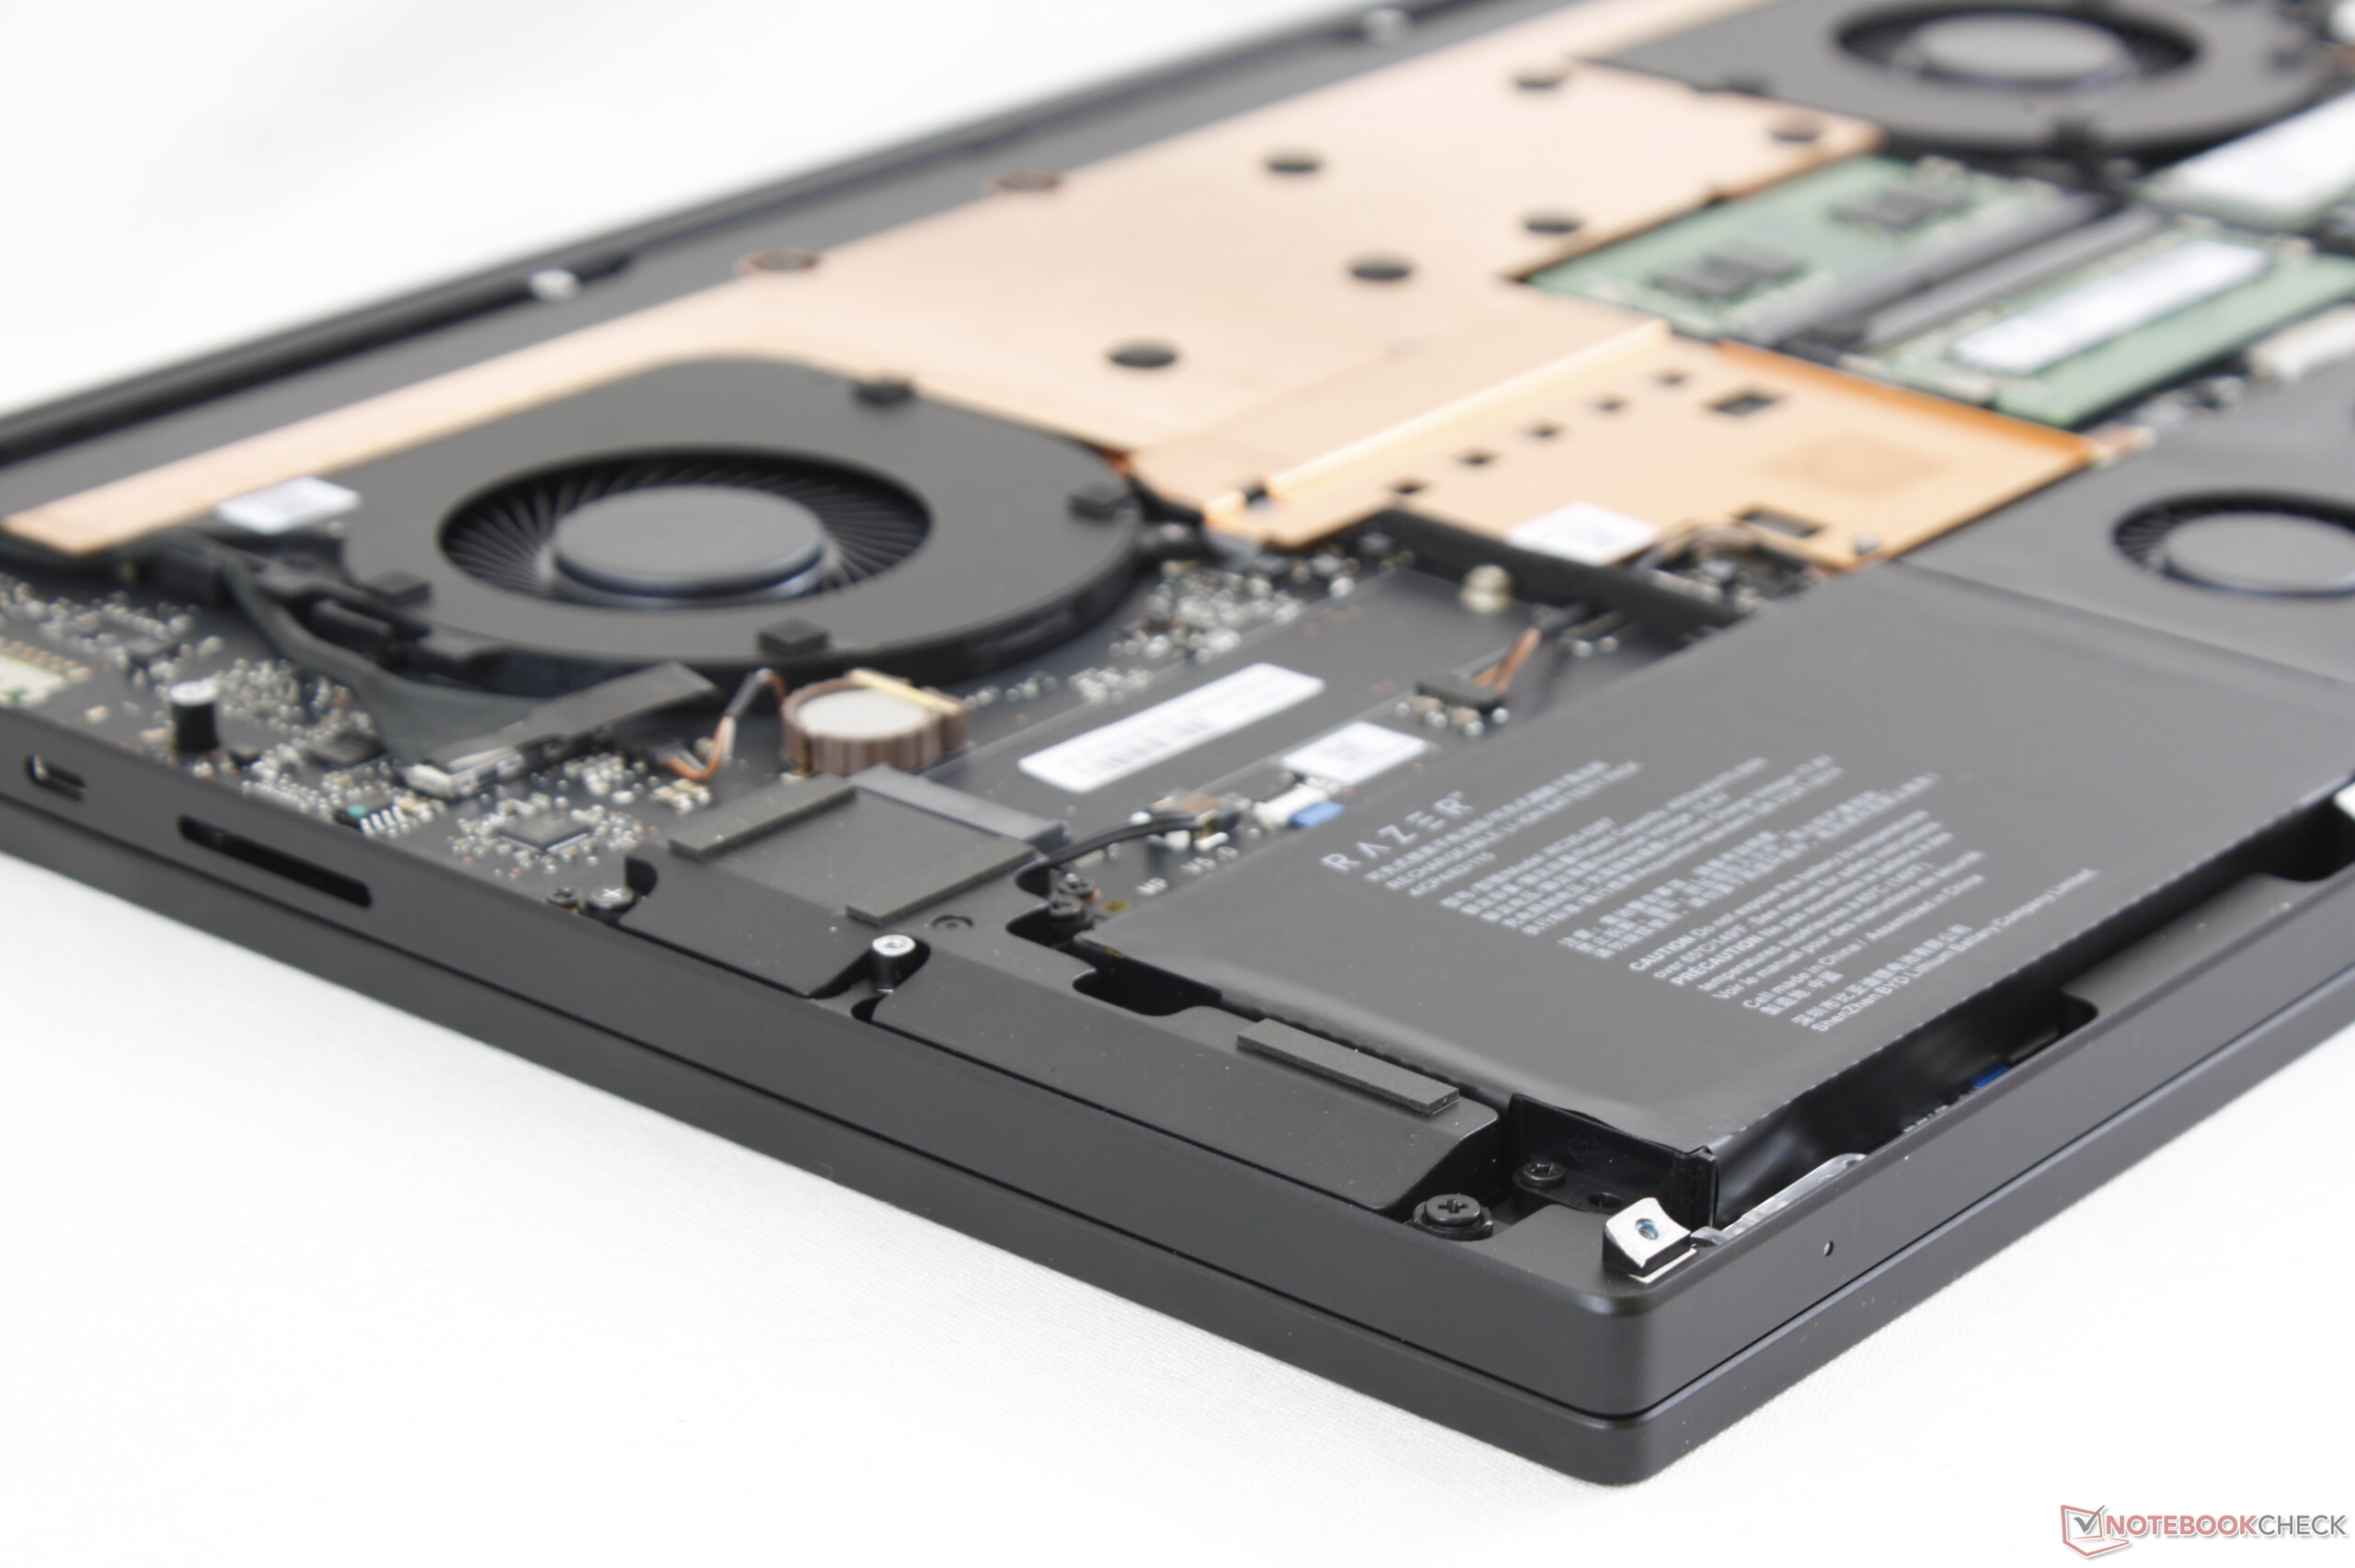
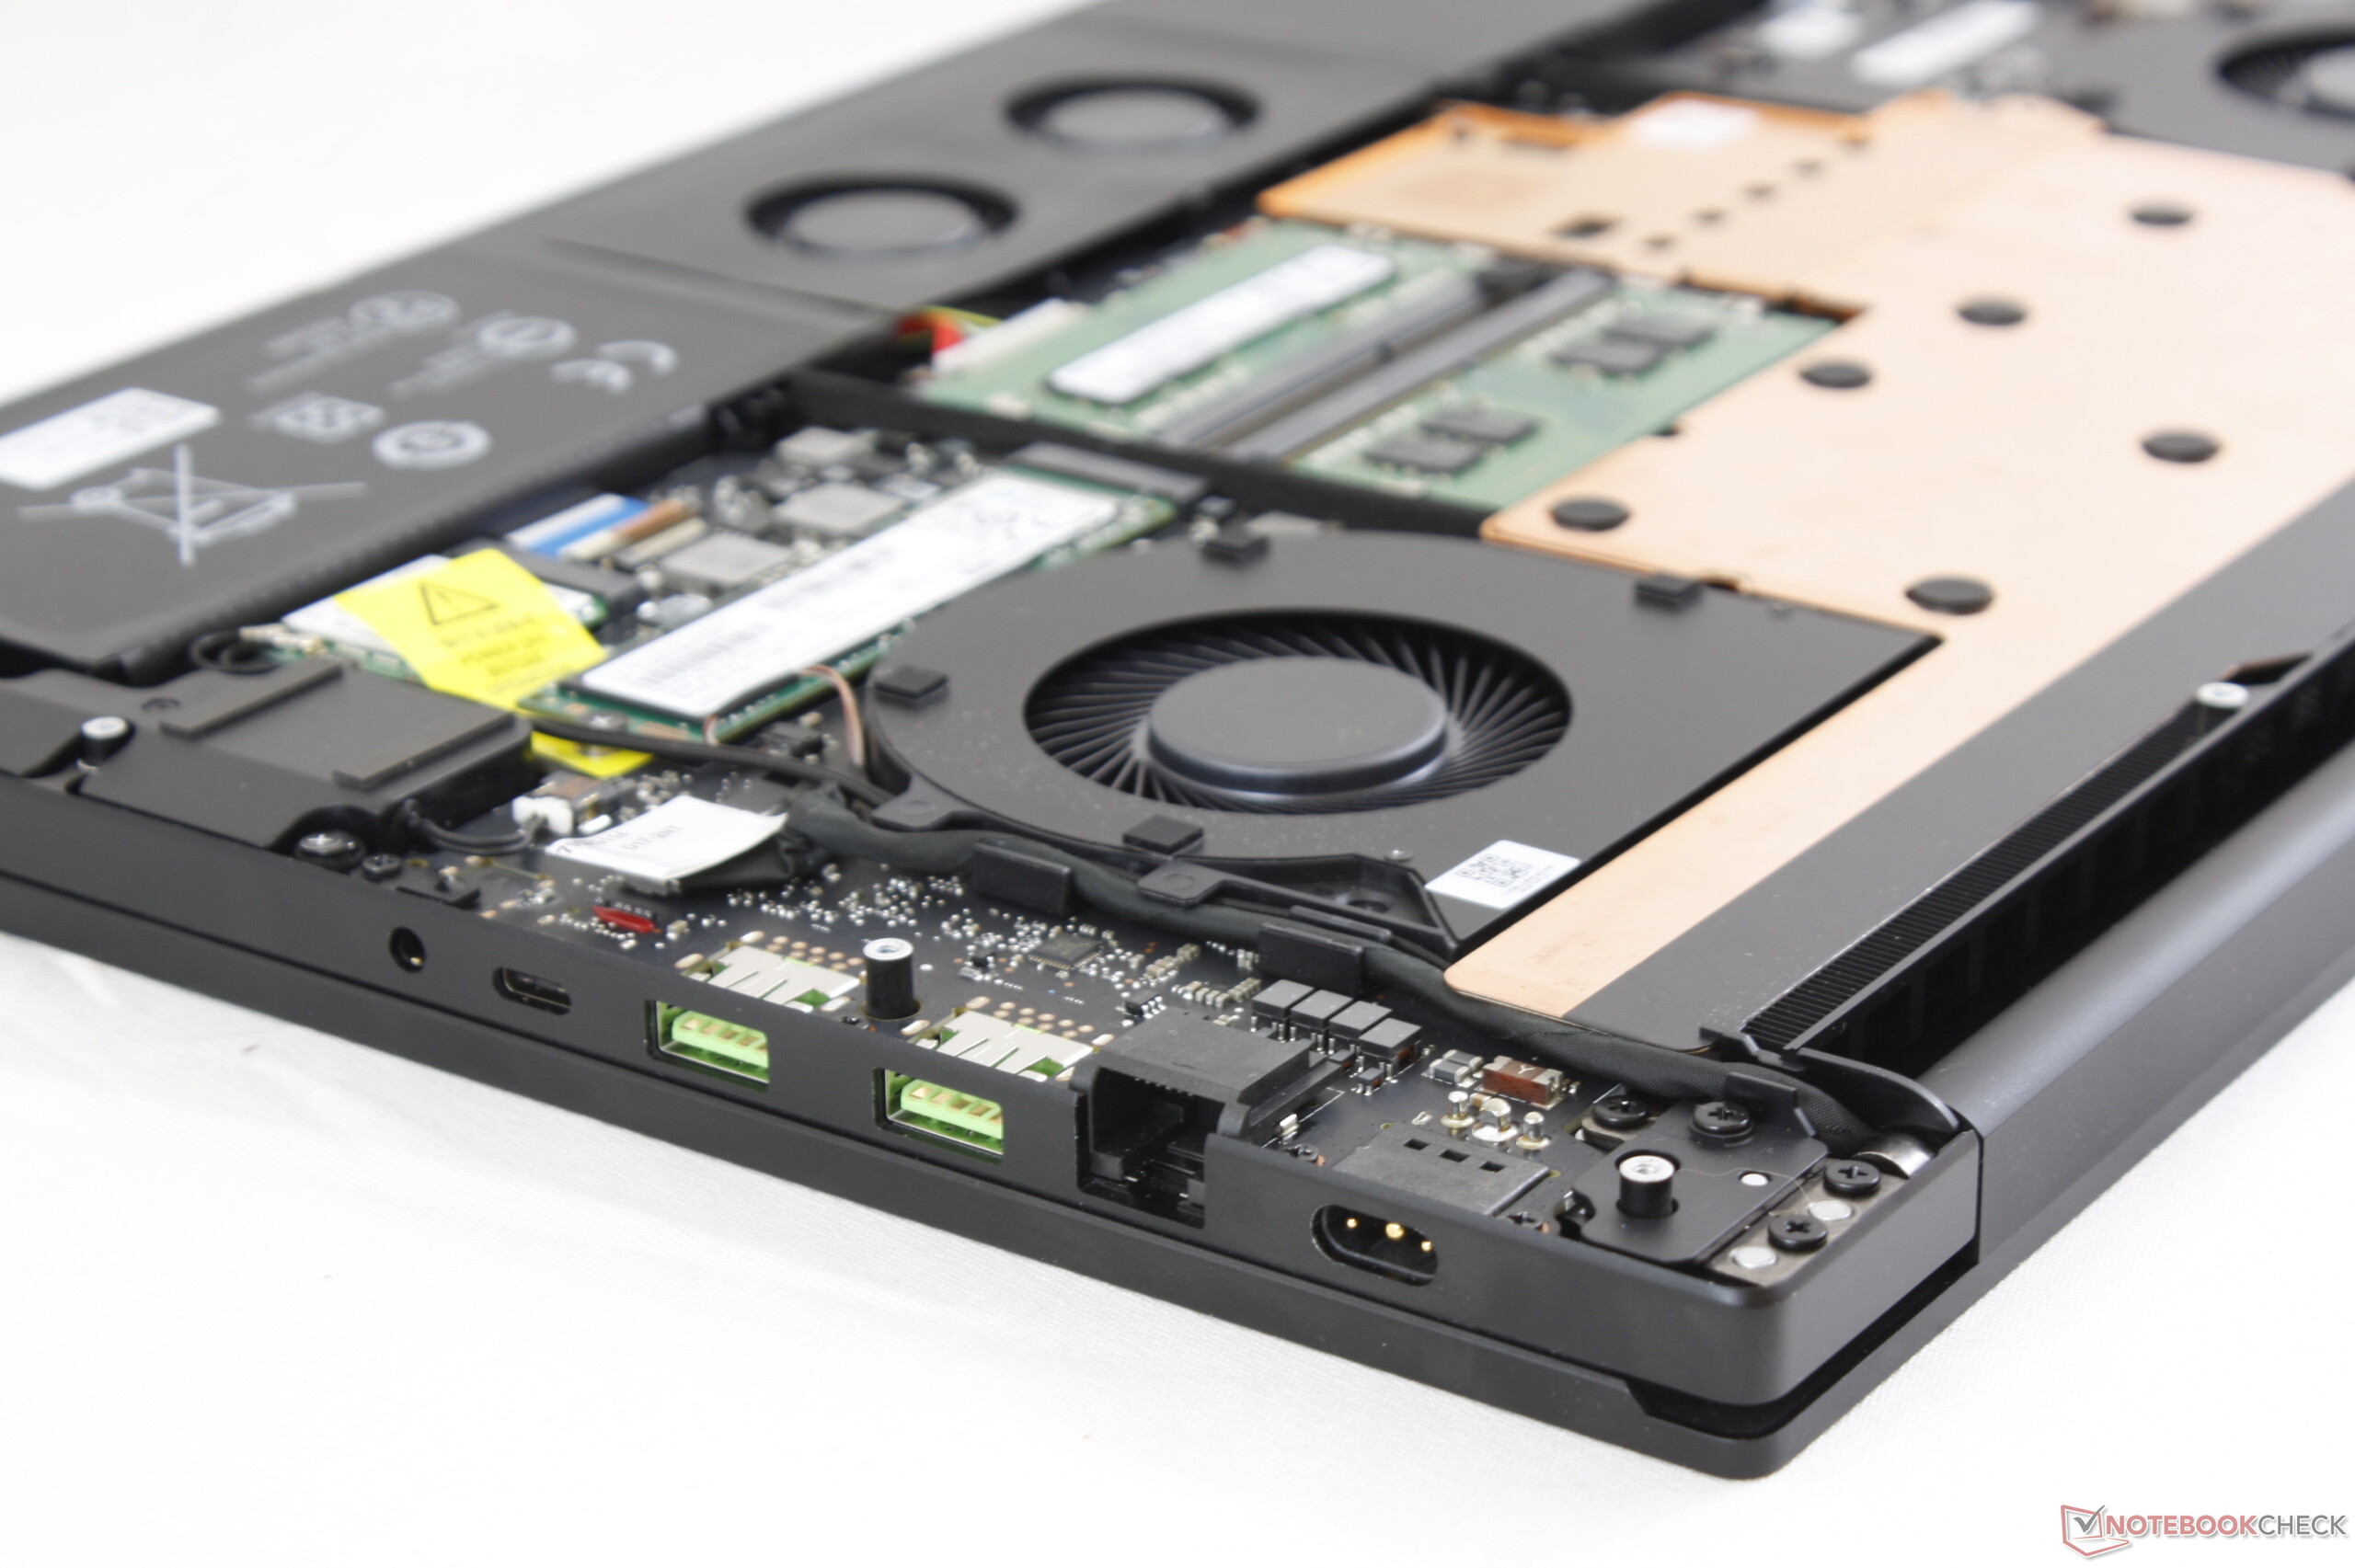
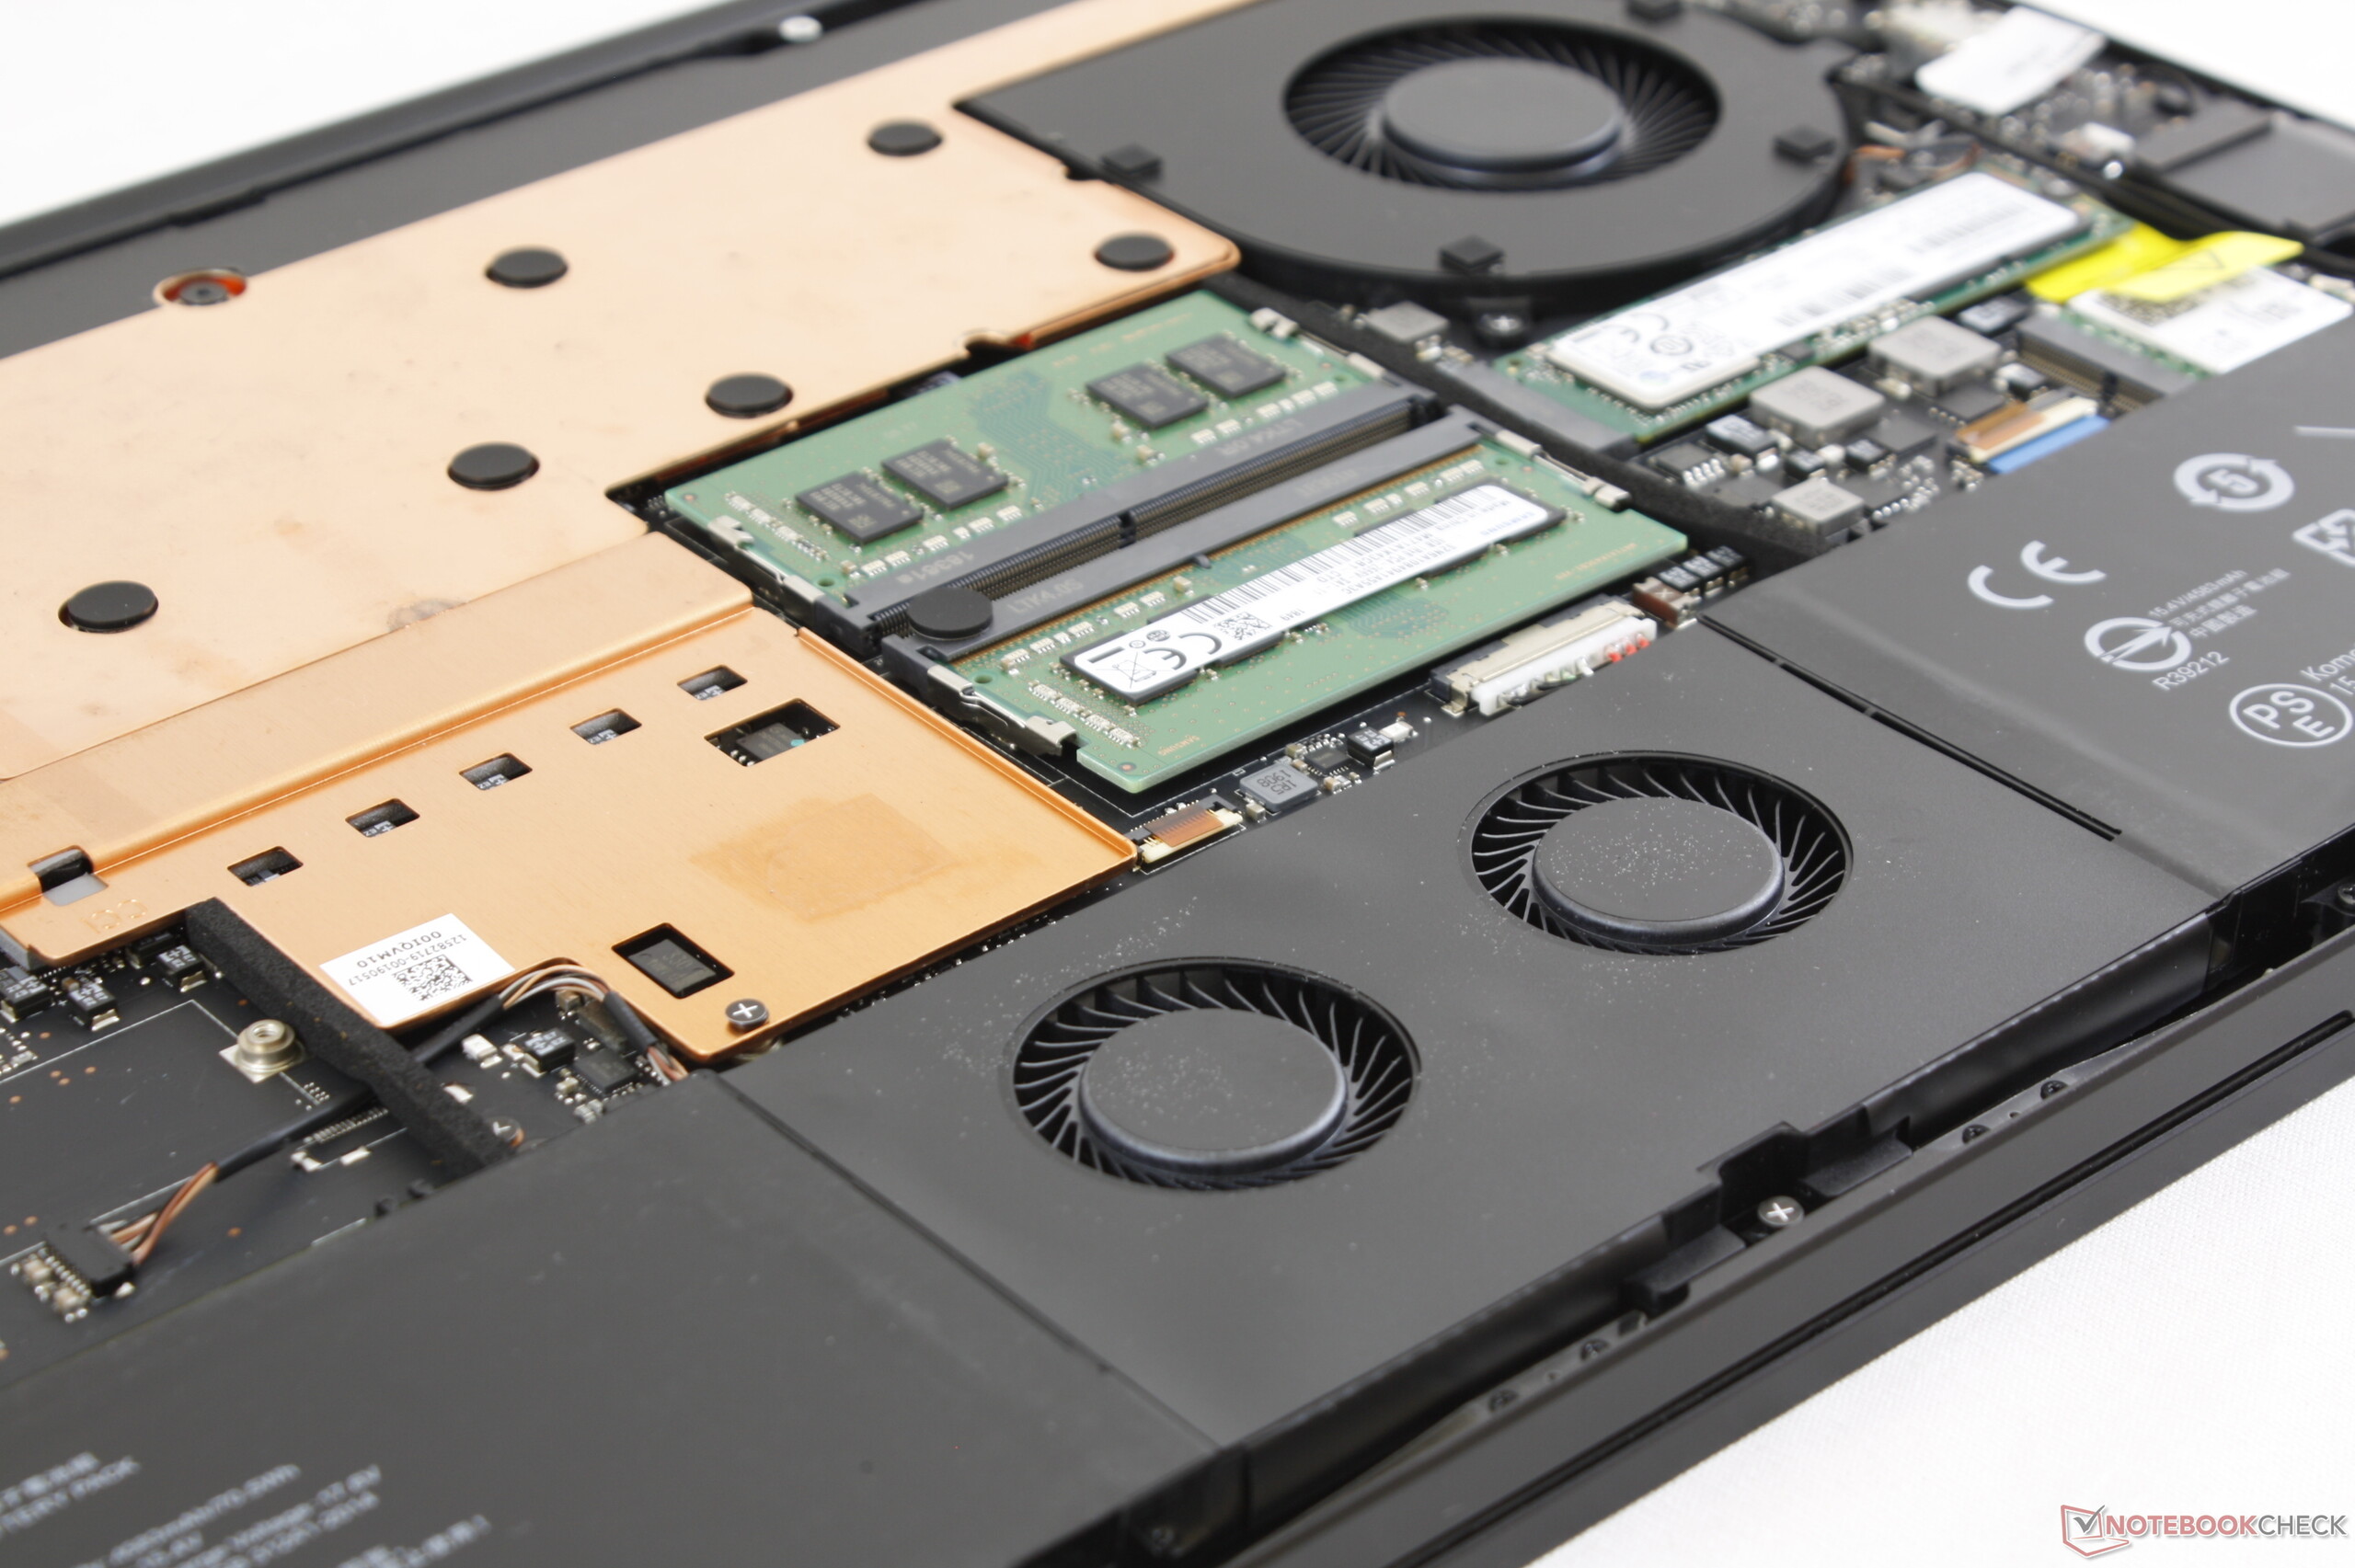
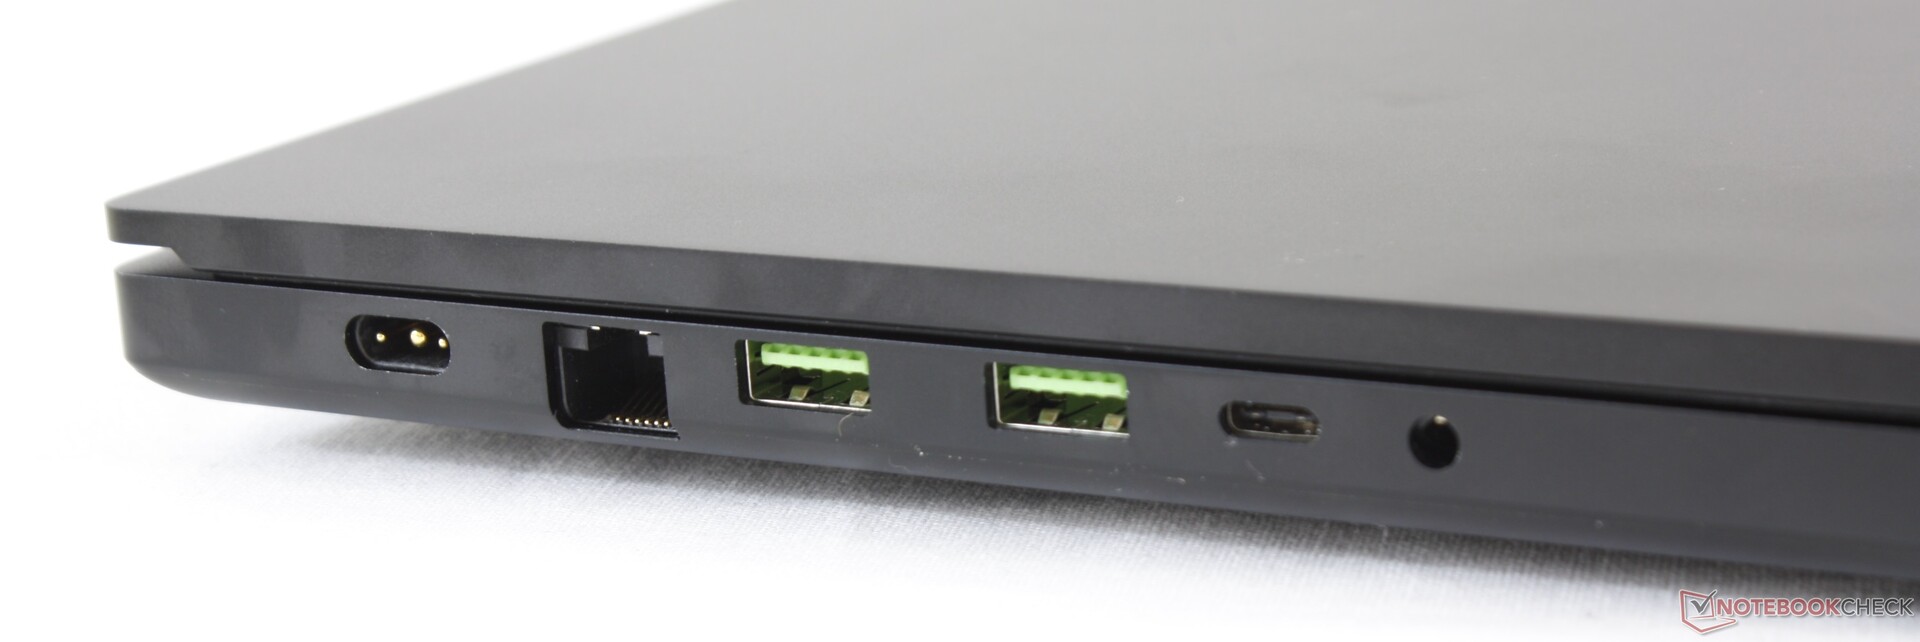
Historicamente, os portáteis Razer Blade Pro sempre tiveram recursos inovadores para se distinguirem dos concorrentes. O Blade Pro 2015, por exemplo, tinha um teclado exclusivo, enquanto o Blade Pro 2017 tinha teclas mecânicas, luzes do trackpad, certificação THX e uma roda de volume. O 2019 Blade Pro 17 deixa de lado todos esses recursos sofisticados para focar no básico e o resultado é o melhor portátil Blade que já saiu da Razer. As melhorias “geração a geração” são realmente tangíveis e não apenas marginais ou superficiais; ele é 22 por cento mais leve, 24 por cento menor, 30 por cento mais brilhante, e 14 por cento mais energeticamente eficiente durante os jogos, tudo isso oferecendo um desempenho gráfico até 39 por cento mais veloz que o Blade Pro 2017 GTX 1080 da última geração. Acrescente a memória RAM e armazenamento facilmente atualizáveis e você tem um portátil para jogos que aparentemente verifica todas as caixas de verificação certas.
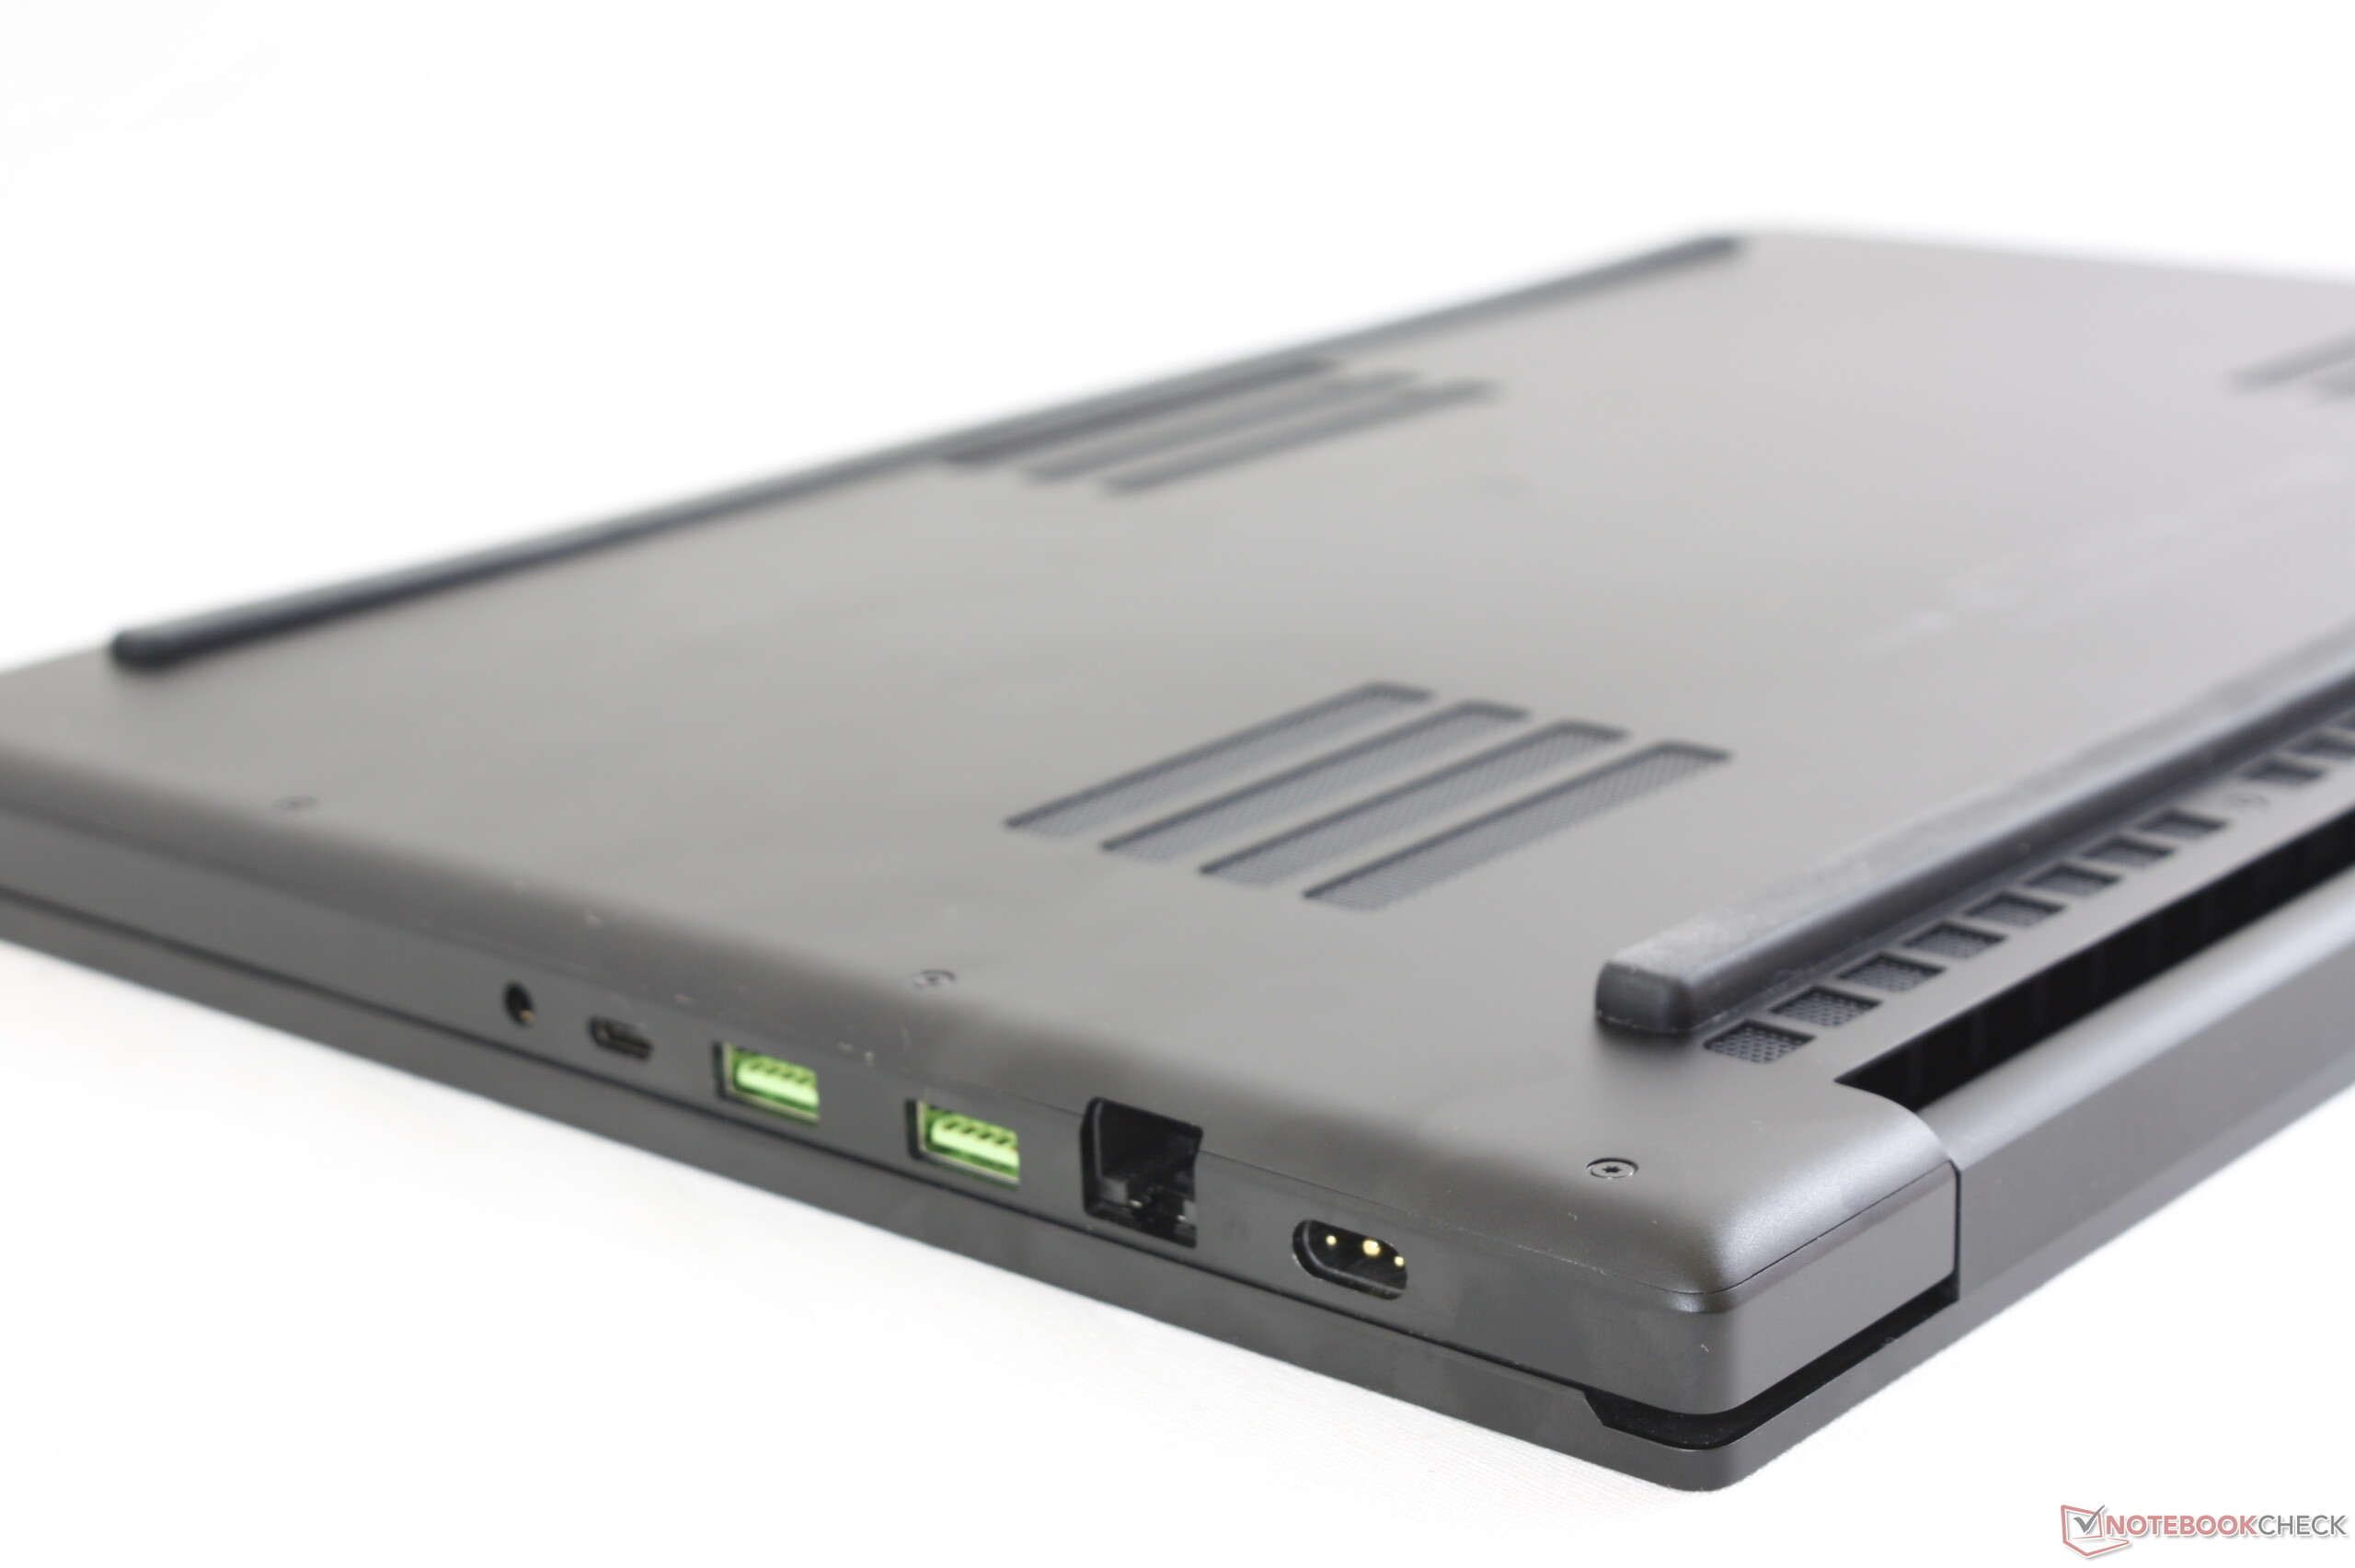
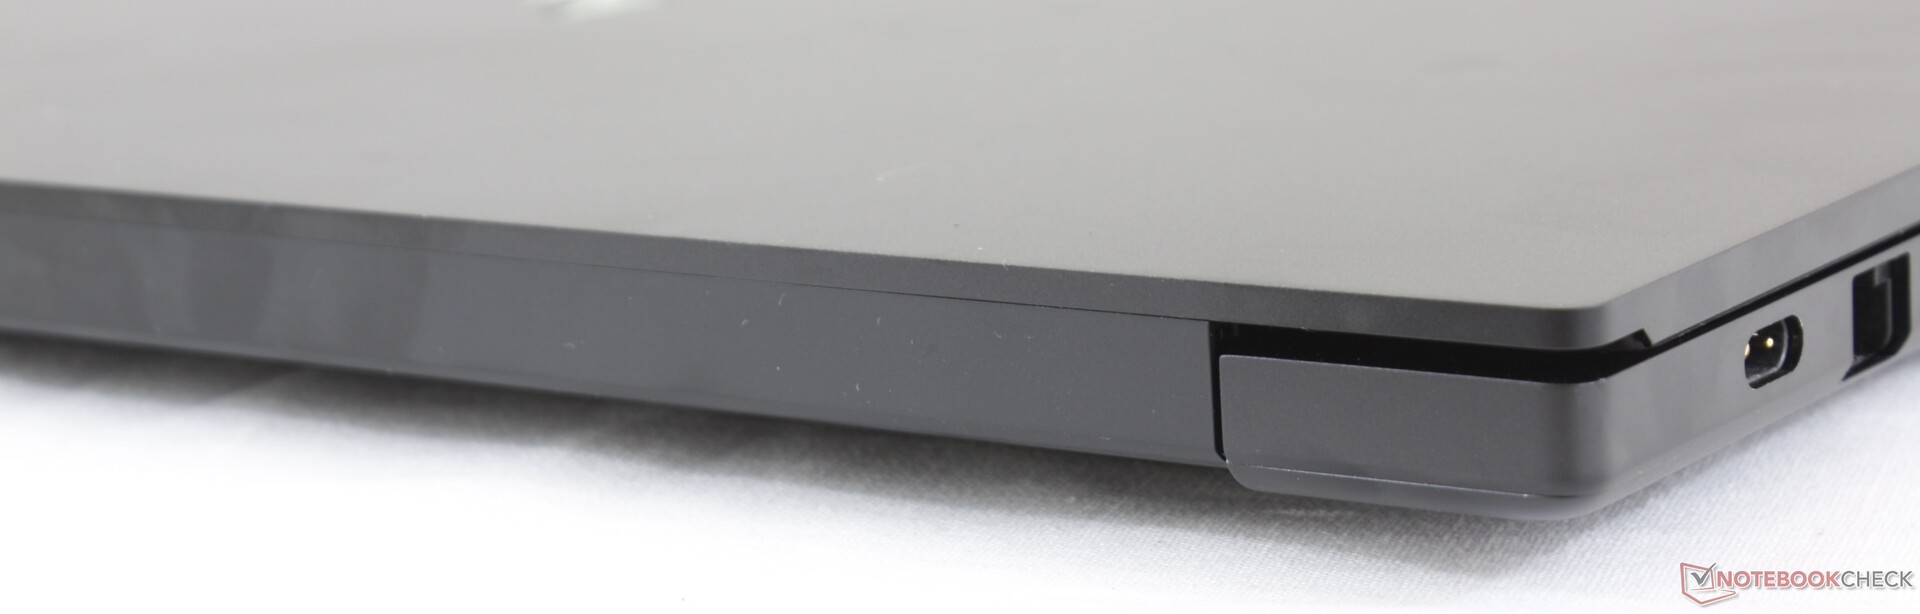
Existem vários aspectos que achamos que poderiam tornar o Blade Pro 17 ainda melhor. Teclas do teclado mais firmes e profundas, como as teclas SteelSeries em portáteis MSI, melhorariam a o tato, enquanto o teclado esponjoso poderia certamente tirar algumas dicas do MacBook Pro. O ruído do ventilador em Alto Desempenho é mais silencioso que no Blade Pro 2017, mas ainda é alto em mais de 50 dB(A). Teclas macro para alternar entre os modos Balanceado e Alto Desempenho tornariam muito mais rápido e fácil do que ter que abrir e clicar no Synapse cada vez. A integração de um subwoofer dedicado poderia melhorar a qualidade do áudio sem precisar da certificação THX em primeiro lugar. Enquanto isso, o cabo do adaptador de CA é muito grosso e pode ser mais fino e flexível para facilitar o transporte. Essas desvantagens não são suficientes para derrubar o que, de outra forma, é um excelente portátil para jogos, por seu tamanho de tela e categoria ultrafina.
O preço provavelmente será um ponto de contenção que fará com que os gamers duvidem em pular para dentro. Por $2.500 USD, os usuários podem comprar um Lenovo Legion Y740-17ICH com a mesma Core i7-9750H e GPU RTX 2080 Max-Q que o nosso Blade Pro 17 de $3200. Se o preço premium vale ou não o design do chassi objetivamente mais forte e possivelmente mais luxuoso do Razer é algo que só você pode responder por si mesmo. Para o nosso dinheiro, no entanto, definitivamente vale a pena considerar agora mais do que nunca por causa de todos os refinamentos significativos sobre o Blade Pro 2017.
A Razer simplificou sua série Blade Pro para uma experiência de jogo mais forte em geral. Se você está no mercado à procura de um portátil para jogos fino de 17 polegadas, pule o Blade Pro 2017 inchado e considere o mais enxuto Blade Pro 17. Vai custar um pouco mais do que alguns concorrentes, mas vai se sentir e se desempenhar um pouco melhor também.
Razer Blade Pro 17 RTX 2080 Max-Q
- 09/20/2019 v7 (old)
Allen Ngo
Price comparison
