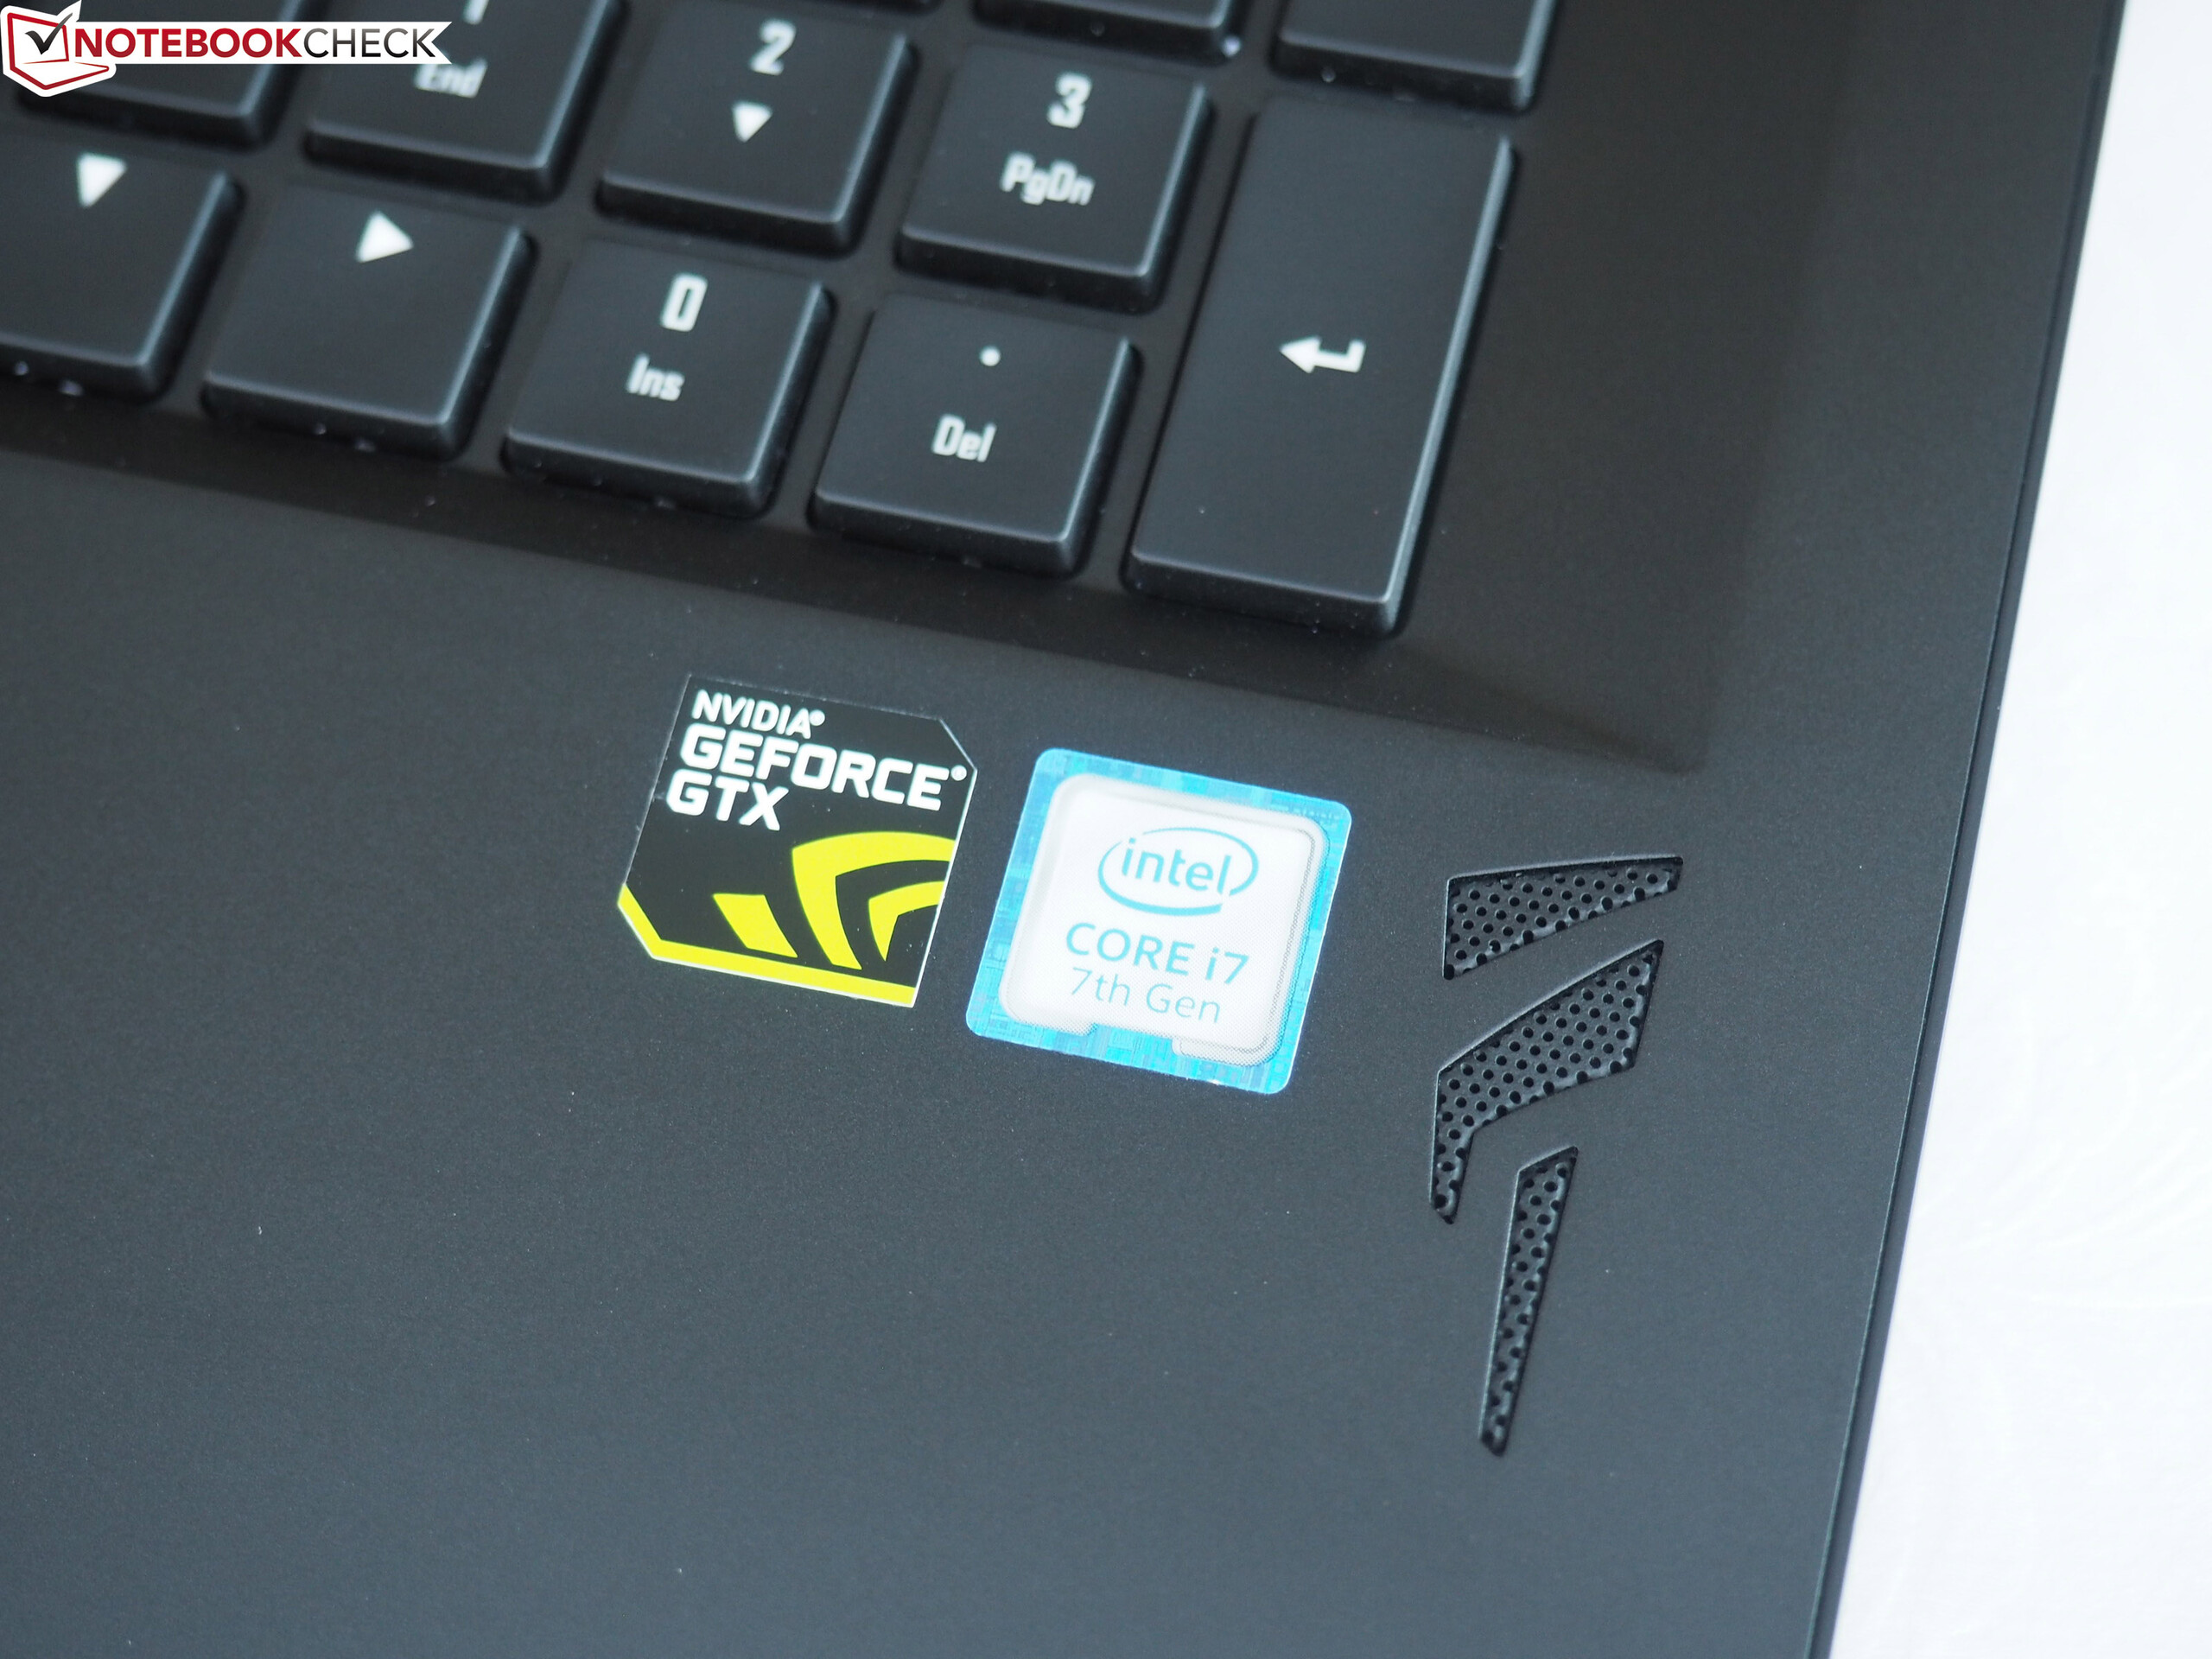
Breve Análise do Portátil Aorus X9 (i7-7820HK, GTX 1070 SLI, QHD)
| SD Card Reader | |
| average JPG Copy Test (av. of 3 runs) | |
| Aorus X9 (Toshiba Exceria Pro SDXC 64 GB UHS-II) | |
| MSI GT75VR 7RF-012 Titan Pro (Toshiba Exceria Pro SDXC 64 GB UHS-II) | |
| Acer Predator 17 G9-793-70PJ (Toshiba Exceria Pro SDXC 64 GB UHS-II) | |
| Asus G752VS-BA338T (Toshiba Exceria Pro SDXC 64 GB UHS-II) | |
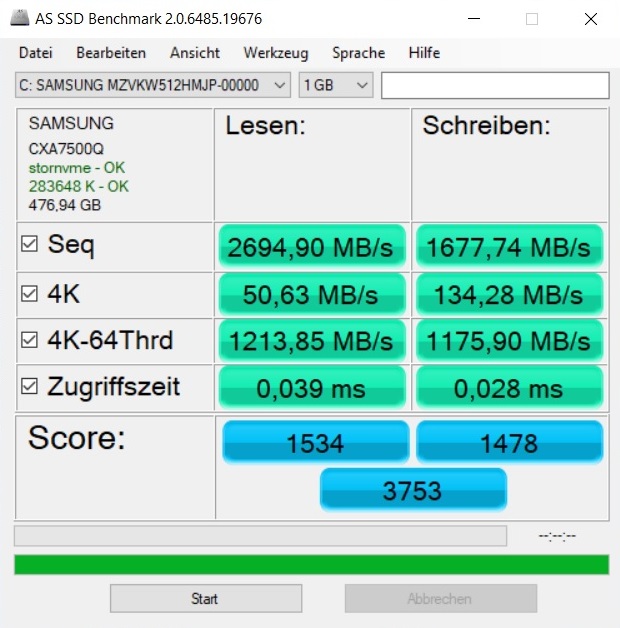
| maximum AS SSD Seq Read Test (1GB) | |
| Aorus X9 (Toshiba Exceria Pro SDXC 64 GB UHS-II) | |
| Acer Predator 17 G9-793-70PJ (Toshiba Exceria Pro SDXC 64 GB UHS-II) | |
| Asus G752VS-BA338T (Toshiba Exceria Pro SDXC 64 GB UHS-II) | |
| MSI GT75VR 7RF-012 Titan Pro (Toshiba Exceria Pro SDXC 64 GB UHS-II) | |
| Networking | |
| iperf3 transmit AX12 | |
| Acer Predator 17 G9-793-70PJ | |
| Alienware 17 R4 | |
| MSI GT75VR 7RF-012 Titan Pro | |
| Aorus X9 | |
| Asus G752VS-BA338T | |
| iperf3 receive AX12 | |
| MSI GT75VR 7RF-012 Titan Pro | |
| Acer Predator 17 G9-793-70PJ | |
| Asus G752VS-BA338T | |
| Alienware 17 R4 | |
| Aorus X9 | |
| |||||||||||||||||||||||||
iluminação: 88 %
iluminação com acumulador: 346 cd/m²
Contraste: 641:1 (Preto: 0.54 cd/m²)
ΔE ColorChecker Calman: 5.98 | ∀{0.5-29.43 Ø4.71}
ΔE Greyscale Calman: 5.47 | ∀{0.09-98 Ø4.96}
84% sRGB (Argyll 1.6.3 3D)
55% AdobeRGB 1998 (Argyll 1.6.3 3D)
61.1% AdobeRGB 1998 (Argyll 3D)
84% sRGB (Argyll 3D)
60.6% Display P3 (Argyll 3D)
Gamma: 2.21
CCT: 7721 K
| Aorus X9 AUO B173QTN01.3 (AUO1396), 2560x1440, 17.3" | Alienware 17 R4 2560x1440, 17.3" | MSI GT75VR 7RF-012 Titan Pro CMN N173HHE-G32 (CMN1747), 1920x1080, 17.3" | Asus G752VS-BA338T AU Optronics B173HAN01.1 (AUO119D), 1920x1080, 17.3" | Acer Predator 17 G9-793-70PJ AU Optronics B173ZAN01.0 (AUO109B), 3840x2160, 17.3" | |
|---|---|---|---|---|---|
| Display | -0% | 37% | 4% | 41% | |
| Display P3 Coverage (%) | 60.6 | 61.2 1% | 90.3 49% | 61.6 2% | 86.4 43% |
| sRGB Coverage (%) | 84 | 82.9 -1% | 99.6 19% | 90.3 8% | 99.9 19% |
| AdobeRGB 1998 Coverage (%) | 61.1 | 60.5 -1% | 86.8 42% | 62.8 3% | 99.1 62% |
| Response Times | -67% | 22% | -181% | -210% | |
| Response Time Grey 50% / Grey 80% * (ms) | 21.6 ? | 30 ? -39% | 11.6 ? 46% | 36 ? -67% | 50 ? -131% |
| Response Time Black / White * (ms) | 6.6 ? | 12.8 ? -94% | 6.8 ? -3% | 26 ? -294% | 25.6 ? -288% |
| PWM Frequency (Hz) | 25000 ? | ||||
| Screen | 3% | 36% | 5% | 29% | |
| Brightness middle (cd/m²) | 346 | 402.3 16% | 274 -21% | 307 -11% | 343 -1% |
| Brightness (cd/m²) | 326 | 372 14% | 262 -20% | 300 -8% | 328 1% |
| Brightness Distribution (%) | 88 | 86 -2% | 87 -1% | 88 0% | 84 -5% |
| Black Level * (cd/m²) | 0.54 | 0.62 -15% | 0.26 52% | 0.32 41% | 0.29 46% |
| Contrast (:1) | 641 | 649 1% | 1054 64% | 959 50% | 1183 85% |
| Colorchecker dE 2000 * | 5.98 | 5.6 6% | 1.36 77% | 5.53 8% | 4.01 33% |
| Colorchecker dE 2000 max. * | 9.77 | 9.8 -0% | 4.1 58% | 11.54 -18% | 6.03 38% |
| Greyscale dE 2000 * | 5.47 | 4.7 14% | 0.64 88% | 7 -28% | 4.7 14% |
| Gamma | 2.21 100% | 2.14 103% | 2.19 100% | 2.48 89% | 2.4 92% |
| CCT | 7721 84% | 7519 86% | 6551 99% | 8103 80% | 6451 101% |
| Color Space (Percent of AdobeRGB 1998) (%) | 55 | 53.7 -2% | 77 40% | 58 5% | 88 60% |
| Color Space (Percent of sRGB) (%) | 84 | 82.2 -2% | 100 19% | 90 7% | 100 19% |
| Média Total (Programa/Configurações) | -21% /
-7% | 32% /
34% | -57% /
-20% | -47% /
-0% |
* ... menor é melhor
Exibir tempos de resposta
| ↔ Tempo de resposta preto para branco | ||
|---|---|---|
| 6.6 ms ... ascensão ↗ e queda ↘ combinadas | ↗ 4.6 ms ascensão | 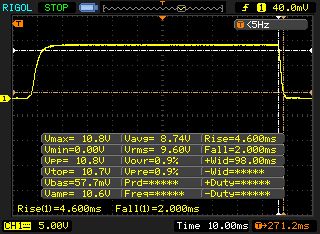 |
| ↘ 2 ms queda | ||
| A tela mostra taxas de resposta muito rápidas em nossos testes e deve ser muito adequada para jogos em ritmo acelerado. Em comparação, todos os dispositivos testados variam de 0.1 (mínimo) a 240 (máximo) ms. » 21 % de todos os dispositivos são melhores. Isso significa que o tempo de resposta medido é melhor que a média de todos os dispositivos testados (19.8 ms). | ||
| ↔ Tempo de resposta 50% cinza a 80% cinza | ||
| 21.6 ms ... ascensão ↗ e queda ↘ combinadas | ↗ 11.6 ms ascensão | 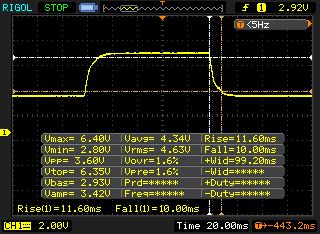 |
| ↘ 10 ms queda | ||
| A tela mostra boas taxas de resposta em nossos testes, mas pode ser muito lenta para jogadores competitivos. Em comparação, todos os dispositivos testados variam de 0.165 (mínimo) a 636 (máximo) ms. » 33 % de todos os dispositivos são melhores. Isso significa que o tempo de resposta medido é melhor que a média de todos os dispositivos testados (31 ms). | ||
Cintilação da tela / PWM (modulação por largura de pulso)
| Tela tremeluzindo / PWM não detectado | 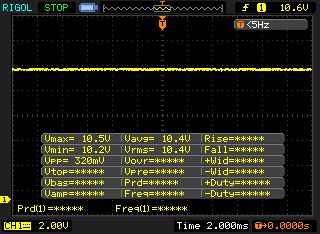 | ||
[pwm_comparison] Em comparação: 52 % de todos os dispositivos testados não usam PWM para escurecer a tela. Se PWM foi detectado, uma média de 7757 (mínimo: 5 - máximo: 343500) Hz foi medida. | |||
| PCMark 8 | |
| Home Score Accelerated v2 | |
| MSI GT75VR 7RF-012 Titan Pro | |
| Asus G752VS-BA338T | |
| Alienware 17 R4 | |
| Aorus X9 | |
| Acer Predator 17 G9-793-70PJ | |
| Work Score Accelerated v2 | |
| MSI GT75VR 7RF-012 Titan Pro | |
| Asus G752VS-BA338T | |
| Aorus X9 | |
| Alienware 17 R4 | |
| Acer Predator 17 G9-793-70PJ | |
| PCMark 10 - Score | |
| Aorus X9 | |
| MSI GT75VR 7RF-012 Titan Pro | |
| PCMark 8 Home Score Accelerated v2 | 5020 pontos | |
| PCMark 8 Work Score Accelerated v2 | 5240 pontos | |
| PCMark 10 Score | 5611 pontos | |
Ajuda | ||
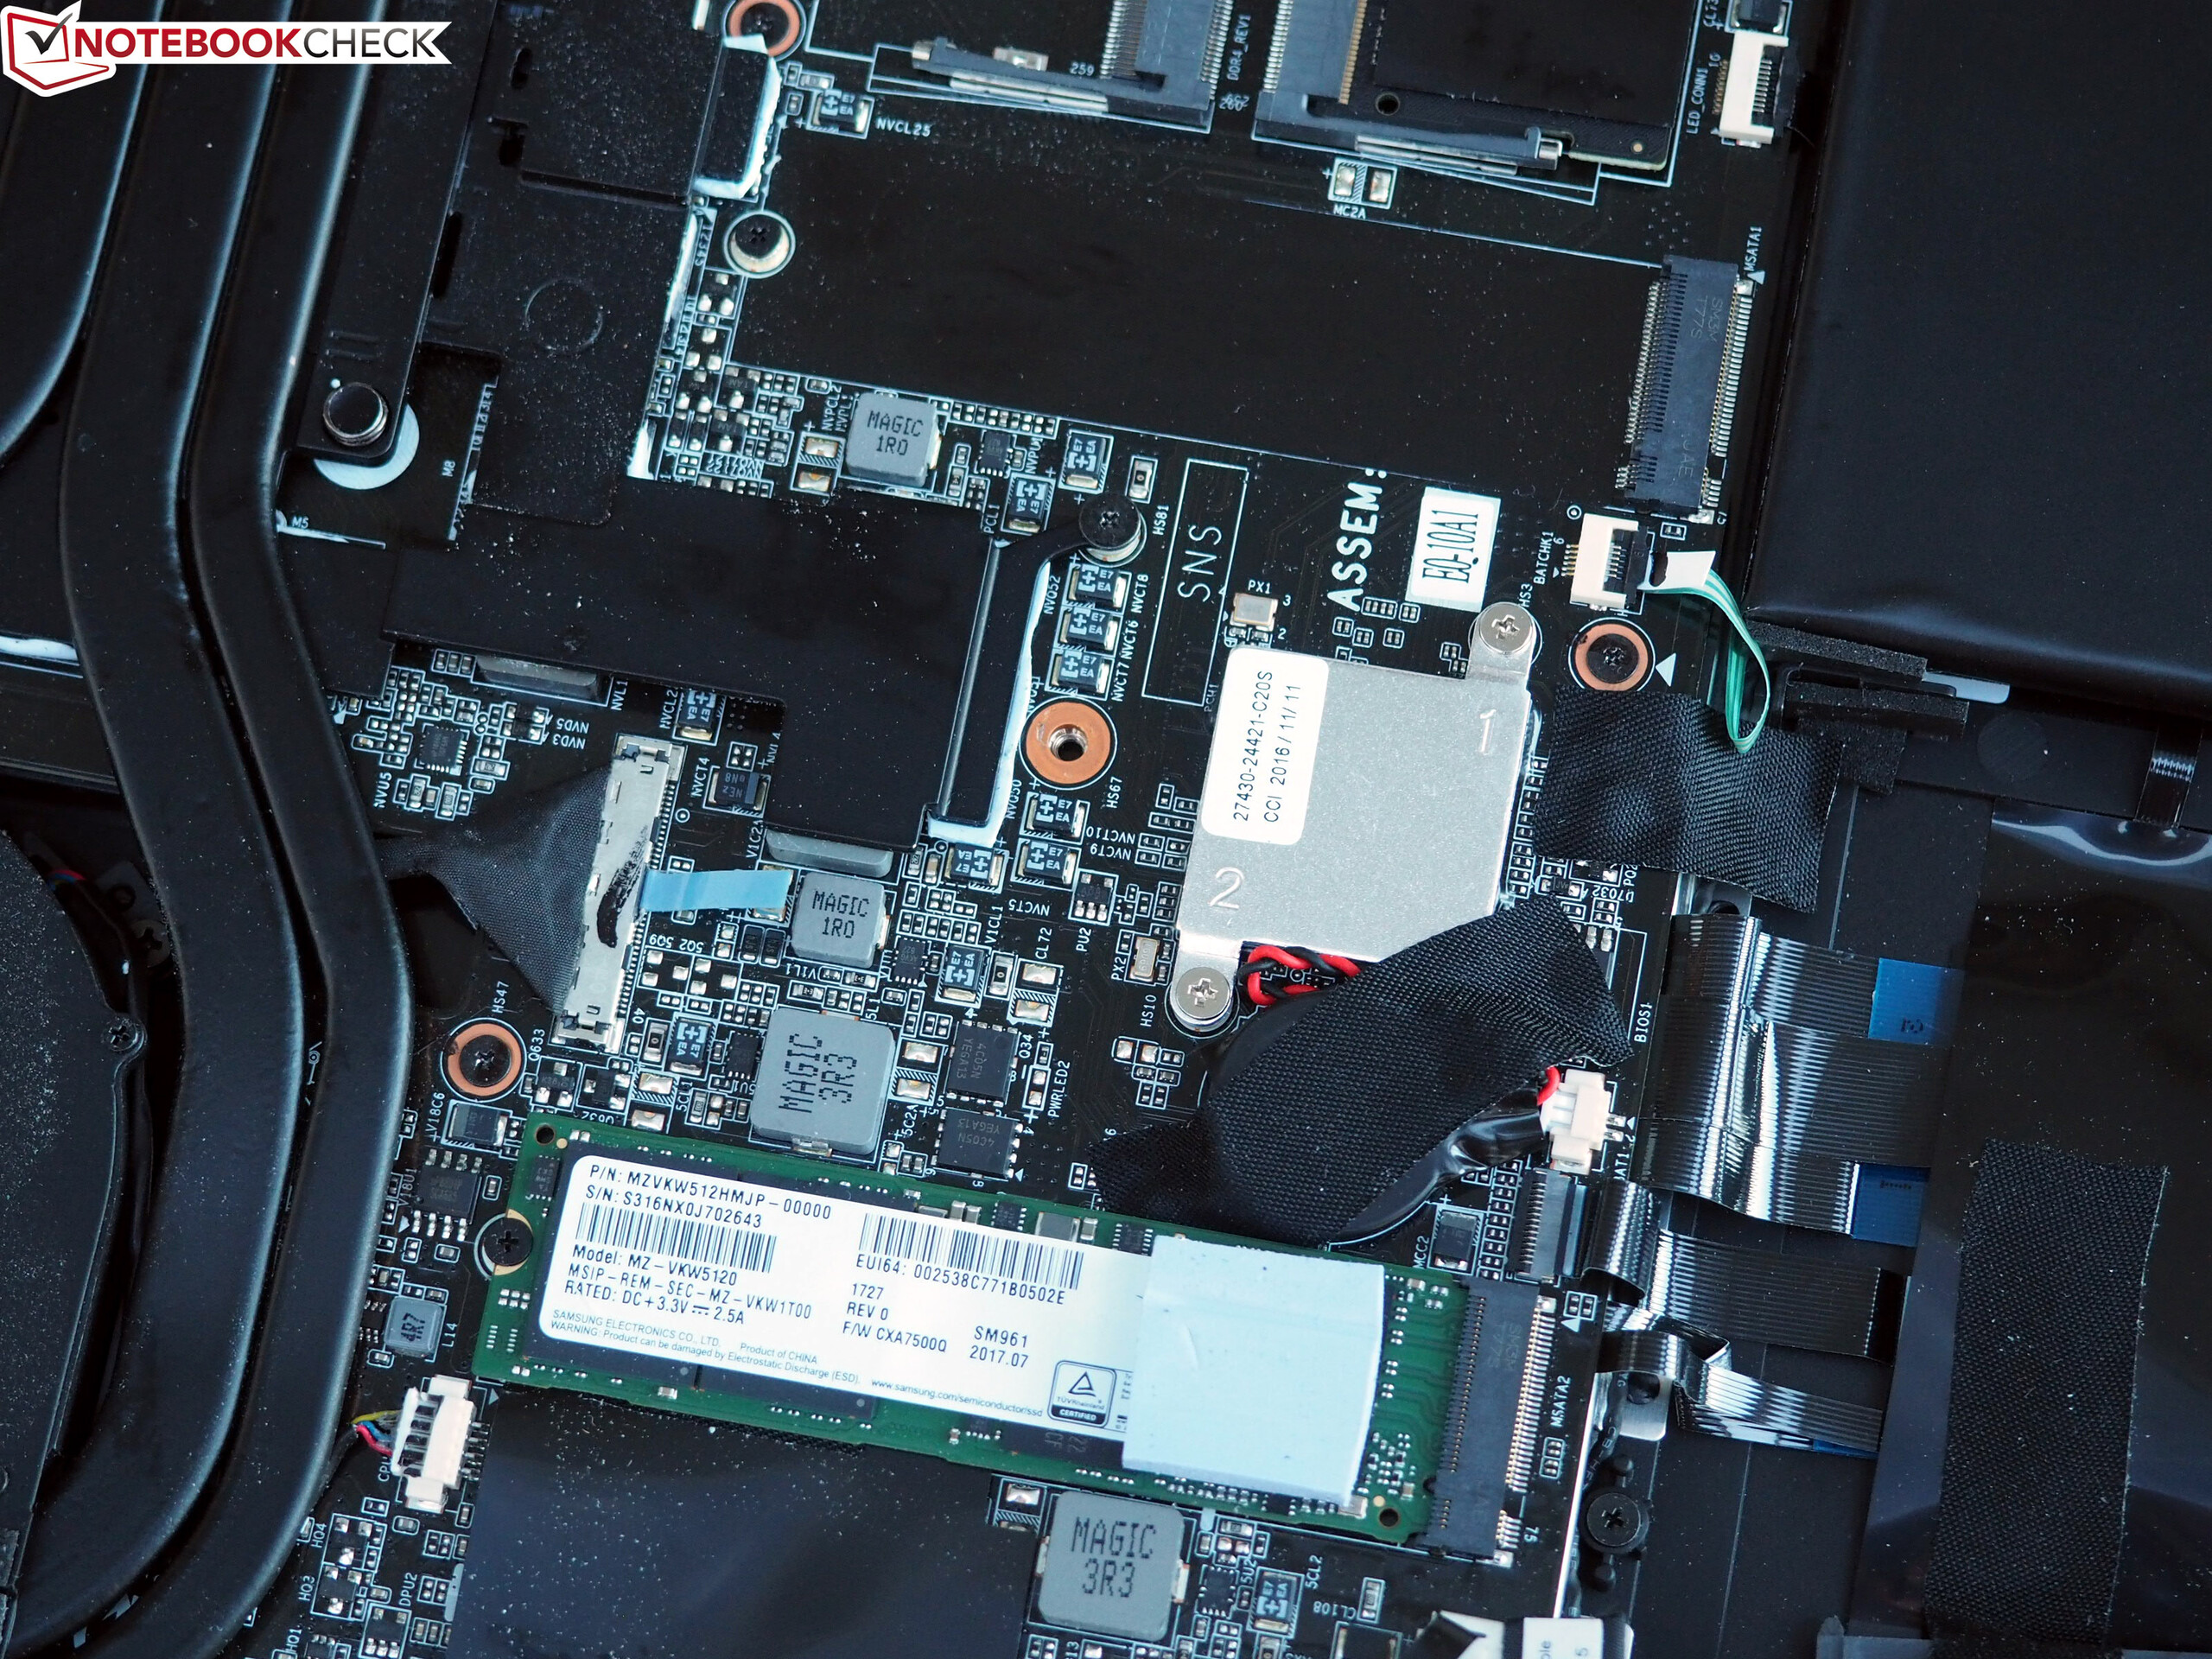
| Aorus X9 Samsung SM961 MZVKW512HMJP m.2 PCI-e | Alienware 17 R4 SK Hynix PC300 NVMe 512 GB | MSI GT75VR 7RF-012 Titan Pro 2x Samsung SM961 MZVPW256HEGL NVMe (RAID 0) | Asus G752VS-BA338T Samsung SM961 MZVKW512HMJP m.2 PCI-e | Acer Predator 17 G9-793-70PJ Toshiba NVMe THNSN5512GPU7 | |
|---|---|---|---|---|---|
| AS SSD | -72% | 1% | -11% | -26% | |
| Seq Read (MB/s) | 2695 | 1752 -35% | 3137 16% | 2824 5% | 2237 -17% |
| Seq Write (MB/s) | 1678 | 735 -56% | 2352 40% | 1554 -7% | 1230 -27% |
| 4K Read (MB/s) | 50.6 | 35.61 -30% | 50.1 -1% | 49.71 -2% | 37.51 -26% |
| 4K Write (MB/s) | 134.3 | 113.4 -16% | 128.8 -4% | 138.9 3% | 120.8 -10% |
| 4K-64 Read (MB/s) | 1214 | 620 -49% | 1048 -14% | 744 -39% | 851 -30% |
| 4K-64 Write (MB/s) | 1176 | 671 -43% | 925 -21% | 1185 1% | 646 -45% |
| Access Time Read * (ms) | 0.039 | 0.042 -8% | 0.041 -5% | 0.058 -49% | 0.052 -33% |
| Access Time Write * (ms) | 0.028 | 0.123 -339% | 0.029 -4% | 0.027 4% | 0.033 -18% |
* ... menor é melhor

| 3DMark | |
| 2560x1440 Time Spy Graphics | |
| Aorus X9 | |
| MSI GT75VR 7RF-012 Titan Pro | |
| Asus G752VS-BA338T | |
| Acer Predator 17 G9-793-70PJ | |
| 1920x1080 Fire Strike Graphics | |
| Aorus X9 | |
| Alienware 17 R4 | |
| MSI GT75VR 7RF-012 Titan Pro | |
| Asus G752VS-BA338T | |
| Acer Predator 17 G9-793-70PJ | |
| 3DMark 11 - 1280x720 Performance GPU | |
| Aorus X9 | |
| MSI GT75VR 7RF-012 Titan Pro | |
| Alienware 17 R4 | |
| Asus G752VS-BA338T | |
| Acer Predator 17 G9-793-70PJ | |
| 3DMark 11 Performance | 23326 pontos | |
| 3DMark Ice Storm Standard Score | 166876 pontos | |
| 3DMark Cloud Gate Standard Score | 32510 pontos | |
| 3DMark Fire Strike Score | 20379 pontos | |
| 3DMark Time Spy Score | 8931 pontos | |
Ajuda | ||
| The Witcher 3 - 3840x2160 High Graphics & Postprocessing (Nvidia HairWorks Off) | |
| Aorus X9 | |
| Guru Mars K | |
| Schenker XMG U727 2017 | |
| Battlefield 1 - 3840x2160 High Preset AA:T | |
| Aorus X9 | |
| Schenker XMG U727 2017 | |
| Asus G752VS | |
| Titanfall 2 - 3840x2160 High / Enabled AA:TS AF:8x | |
| Aorus X9 | |
| Schenker XMG U727 2017 | |
| Asus G752VS | |
| Call of Duty Infinite Warfare - 3840x2160 High / On AA:FX | |
| Schenker XMG U727 2017 | |
| Aorus X9 | |
| Asus G752VS | |
| Dishonored 2 - 3840x2160 High Preset AA:TX | |
| Aorus X9 | |
| Schenker XMG U727 2017 | |
| Asus G752VS | |
| Watch Dogs 2 - 3840x2160 High Preset | |
| Aorus X9 | |
| Schenker XMG U727 2017 | |
| Asus G752VS | |
| Resident Evil 7 - 3840x2160 High / On AA:FXAA+T | |
| Schenker XMG U727 2017 | |
| Asus G752VS | |
| Aorus X9 | |
| For Honor - 3840x2160 High Preset AA:T AF:8x | |
| Aorus X9 | |
| Schenker XMG U727 2017 | |
| Asus G752VS | |
| Ghost Recon Wildlands - 3840x2160 Very High Preset AA:T AF:8x | |
| Aorus X9 | |
| Guru Mars K | |
| Asus G752VS | |
| Prey - 3840x2160 High Preset AA:2TX SM AF:8x | |
| Aorus X9 | |
| Guru Mars K | |
| Asus G752VS | |
| Rocket League - 3840x2160 High Quality AA:High FX | |
| Aorus X9 | |
| Guru Mars K | |
| Asus G752VS | |
| F1 2017 - 3840x2160 Ultra High Preset AA:T AF:16x | |
| Guru Mars K | |
| Asus G752VS | |
| Aorus X9 | |
| Ark Survival Evolved - 3840x2160 Epic Preset (100 % Resolution Scale) | |
| Aorus X9 | |
| Guru Mars K | |
| Asus G752VS | |
| FIFA 18 - 3840x2160 Ultra Preset | |
| Guru Mars K | |
| Aorus X9 | |
| Asus G752VS | |
| baixo | média | alto | ultra | 4K | |
|---|---|---|---|---|---|
| The Witcher 3 (2015) | 167 | 99.9 | 69.3 | ||
| Battlefield 1 (2016) | 143 | 129 | 74.1 | ||
| Titanfall 2 (2016) | 143 | 141 | 68.4 | ||
| Call of Duty Infinite Warfare (2016) | 122 | 111 | 58.6 | ||
| Dishonored 2 (2016) | 92.4 | 78.6 | 60 | ||
| Watch Dogs 2 (2016) | 111 | 90.9 | 59 | ||
| Resident Evil 7 (2017) | 146 | 123 | 42 | ||
| For Honor (2017) | 177 | 163 | 83.9 | ||
| Ghost Recon Wildlands (2017) | 112 | 68.8 | 53.1 | ||
| Prey (2017) | 140 | 137 | 79.1 | ||
| Rocket League (2017) | 219 | 141 | |||
| Dirt 4 (2017) | 115 | 70.4 | |||
| Playerunknown's Battlegrounds (PUBG) (2017) | 102 | 93.3 | 37.1 | ||
| F1 2017 (2017) | 132 | 89 | 42 | ||
| Ark Survival Evolved (2017) | 88.6 | 53 | 25.8 | ||
| FIFA 18 (2017) | 330 | 310 | 187 |
Barulho
| Ocioso |
| 35 / 37 / 43 dB |
| Carga |
| 49 / 60 dB |
 | ||
30 dB silencioso 40 dB(A) audível 50 dB(A) ruidosamente alto |
||
min: | ||
| Aorus X9 GeForce GTX 1070 SLI (Laptop), i7-7820HK | Alienware 17 R4 GeForce GTX 1080 Mobile, i7-7820HK | MSI GT75VR 7RF-012 Titan Pro GeForce GTX 1080 Mobile, i7-7820HK | Asus G752VS-BA338T GeForce GTX 1070 Mobile, i7-7700HQ | Acer Predator 17 G9-793-70PJ GeForce GTX 1070 Mobile, i7-7700HQ | |
|---|---|---|---|---|---|
| Noise | 7% | 5% | 14% | 11% | |
| desligado / ambiente * (dB) | 30 | 28.2 6% | 30 -0% | 30 -0% | 31 -3% |
| Idle Minimum * (dB) | 35 | 35.6 -2% | 33 6% | 30 14% | 32 9% |
| Idle Average * (dB) | 37 | 35.6 4% | 34 8% | 32 14% | 35 5% |
| Idle Maximum * (dB) | 43 | 35.7 17% | 38 12% | 36 16% | 38 12% |
| Load Average * (dB) | 49 | 50.2 -2% | 44 10% | 43 12% | 42 14% |
| Witcher 3 ultra * (dB) | 56 | 50.2 10% | 56 -0% | 43 23% | 44 21% |
| Load Maximum * (dB) | 60 | 50.2 16% | 62 -3% | 49 18% | 50 17% |
* ... menor é melhor
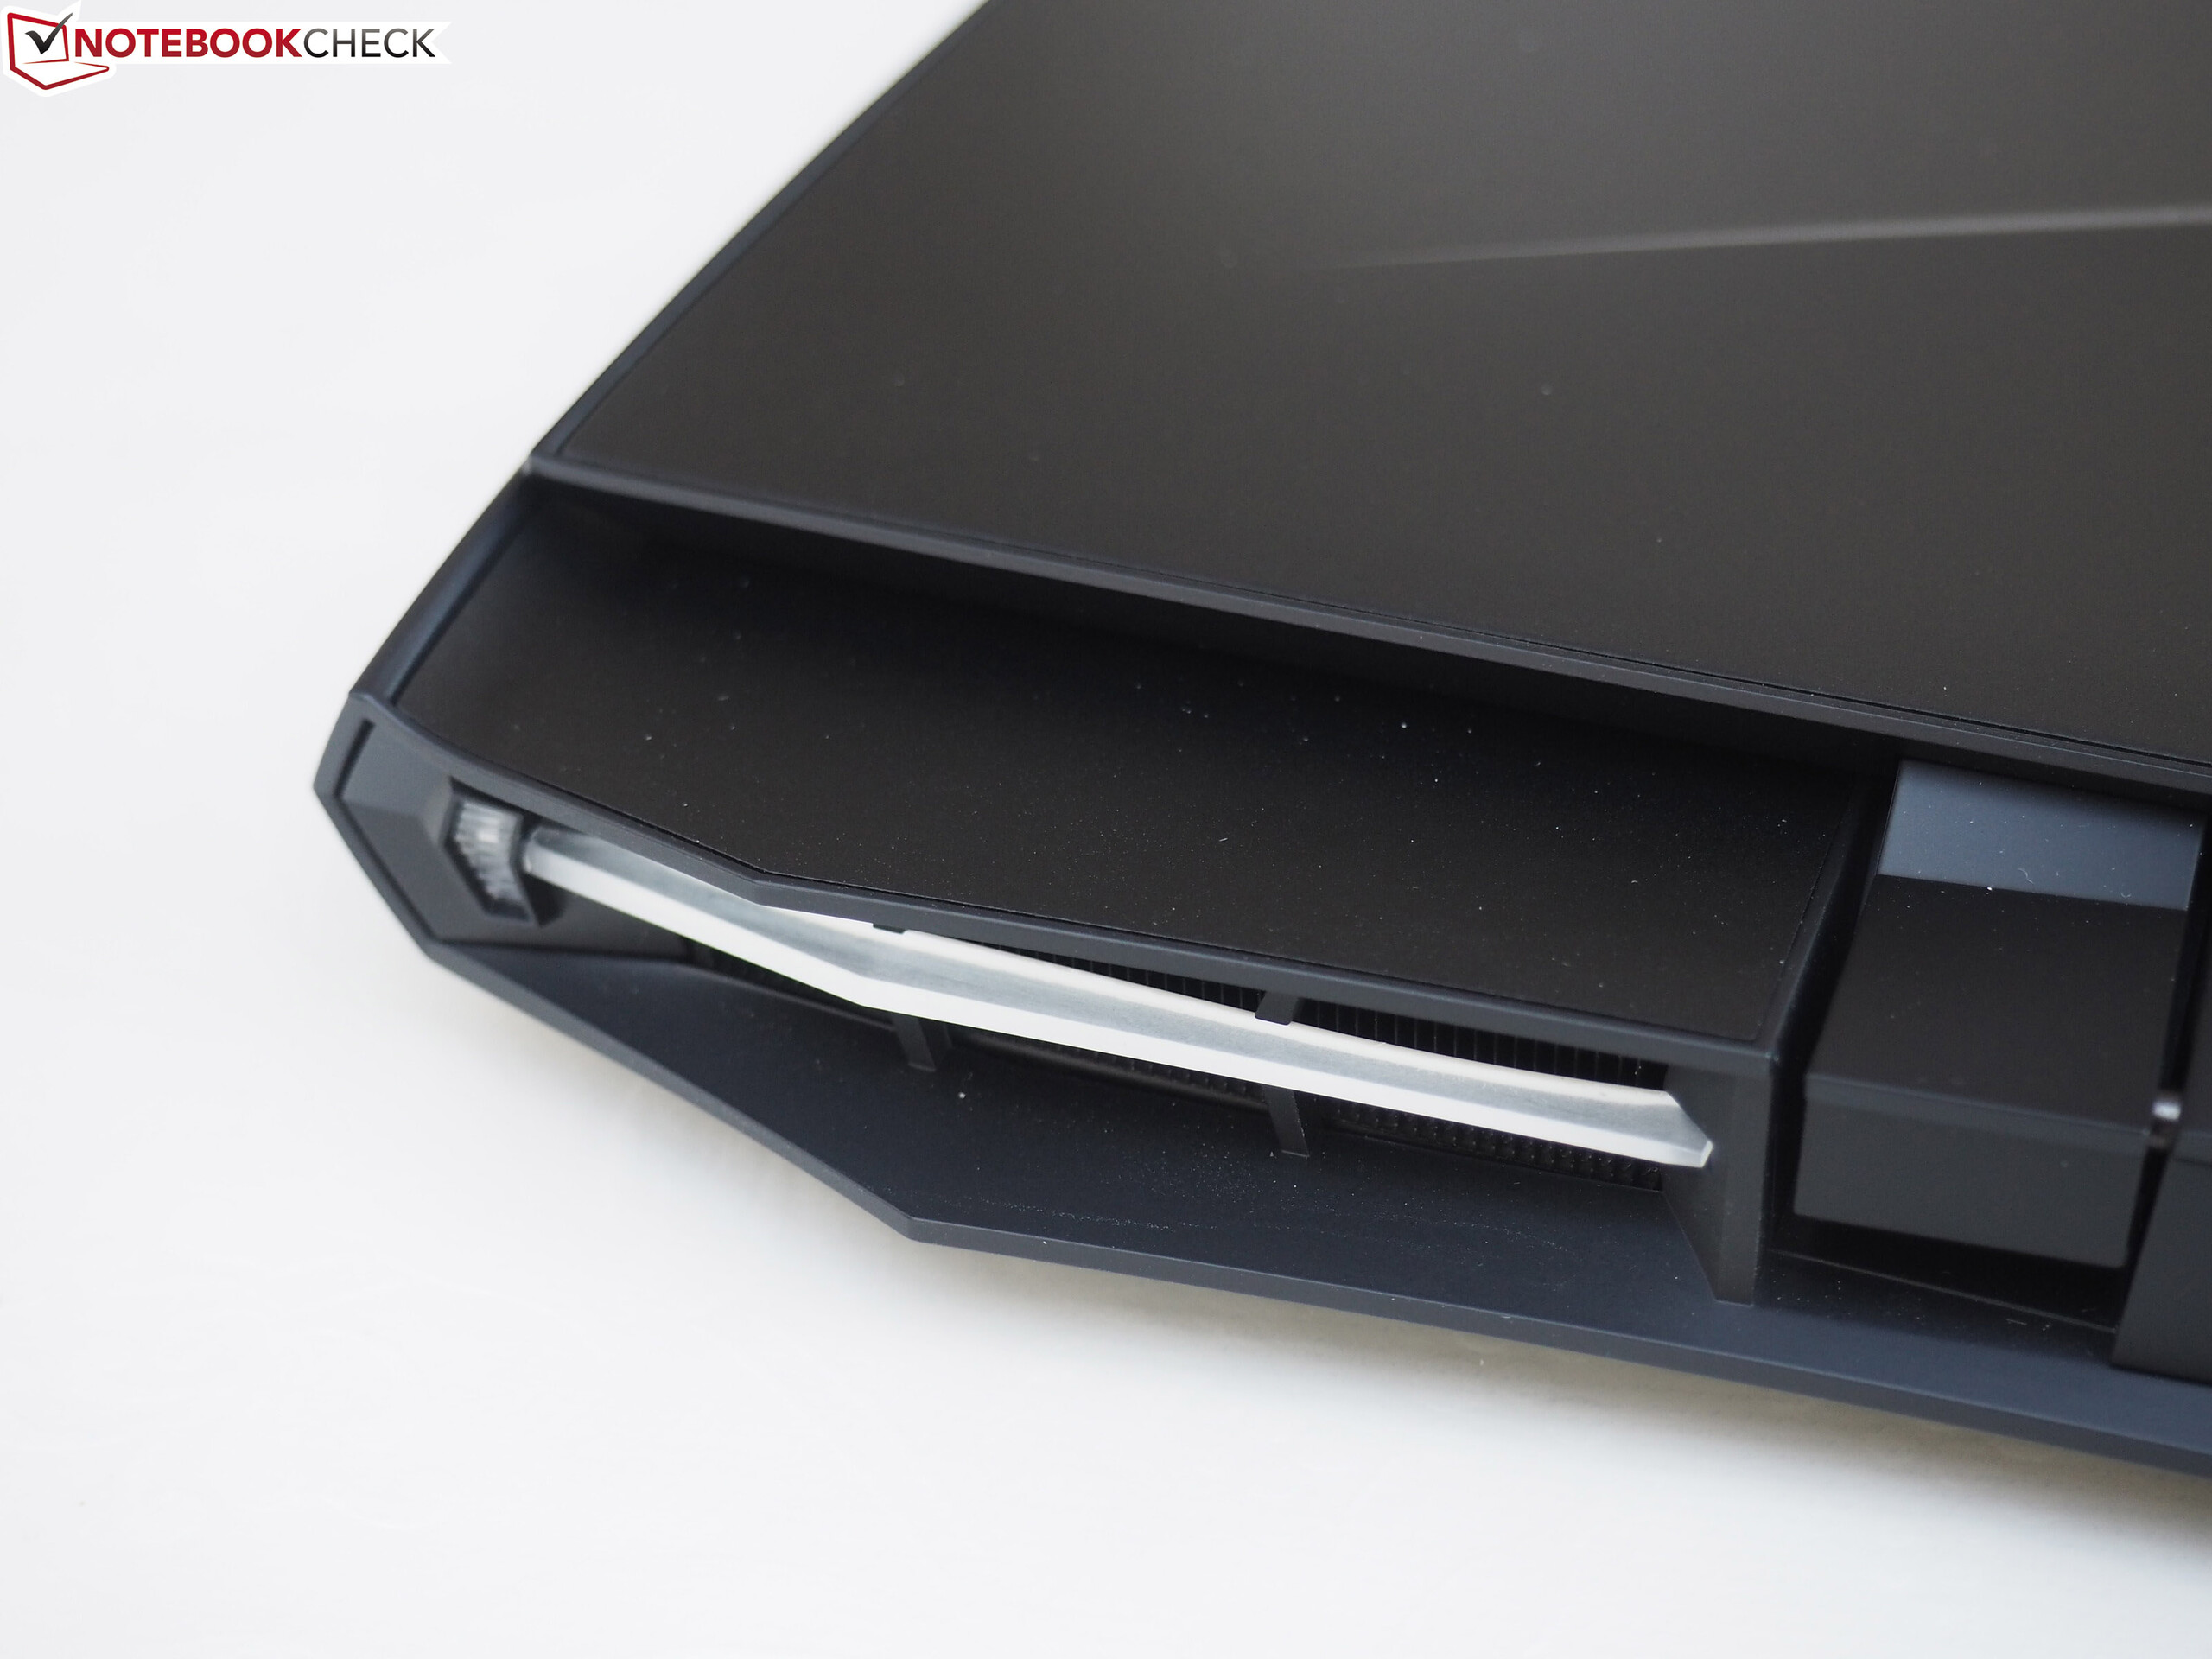
(-) A temperatura máxima no lado superior é 47 °C / 117 F, em comparação com a média de 40.4 °C / 105 F , variando de 21.2 a 68.8 °C para a classe Gaming.
(-) A parte inferior aquece até um máximo de 62 °C / 144 F, em comparação com a média de 43.2 °C / 110 F
(+) Em uso inativo, a temperatura média para o lado superior é 27.3 °C / 81 F, em comparação com a média do dispositivo de 33.9 °C / ### class_avg_f### F.
(-) Jogando The Witcher 3, a temperatura média para o lado superior é 42.1 °C / 108 F, em comparação com a média do dispositivo de 33.9 °C / ## #class_avg_f### F.
(-) Os apoios para as mãos e o touchpad podem ficar muito quentes ao toque, com um máximo de 44 °C / 111.2 F.
(-) A temperatura média da área do apoio para as mãos de dispositivos semelhantes foi 28.8 °C / 83.8 F (-15.2 °C / -27.4 F).
| Aorus X9 GeForce GTX 1070 SLI (Laptop), i7-7820HK | Alienware 17 R4 GeForce GTX 1080 Mobile, i7-7820HK | MSI GT75VR 7RF-012 Titan Pro GeForce GTX 1080 Mobile, i7-7820HK | Asus G752VS-BA338T GeForce GTX 1070 Mobile, i7-7700HQ | Acer Predator 17 G9-793-70PJ GeForce GTX 1070 Mobile, i7-7700HQ | |
|---|---|---|---|---|---|
| Heat | 2% | -5% | 16% | 17% | |
| Maximum Upper Side * (°C) | 47 | 49.6 -6% | 46 2% | 41 13% | 39.1 17% |
| Maximum Bottom * (°C) | 62 | 56 10% | 57 8% | 39.3 37% | 42.1 32% |
| Idle Upper Side * (°C) | 30 | 29.6 1% | 34 -13% | 28.8 4% | 27.9 7% |
| Idle Bottom * (°C) | 30 | 29.2 3% | 35 -17% | 27.3 9% | 26.1 13% |
* ... menor é melhor
Aorus X9 análise de áudio
(±) | o volume do alto-falante é médio, mas bom (###valor### dB)
Graves 100 - 315Hz
(±) | graves reduzidos - em média 13% menor que a mediana
(±) | a linearidade dos graves é média (9.9% delta para a frequência anterior)
Médios 400 - 2.000 Hz
(+) | médios equilibrados - apenas 2.6% longe da mediana
(+) | médios são lineares (4.5% delta para frequência anterior)
Altos 2 - 16 kHz
(+) | agudos equilibrados - apenas 4.3% longe da mediana
(+) | os máximos são lineares (6.5% delta da frequência anterior)
Geral 100 - 16.000 Hz
(+) | o som geral é linear (14.2% diferença em relação à mediana)
Comparado com a mesma classe
» 25% de todos os dispositivos testados nesta classe foram melhores, 7% semelhantes, 68% piores
» O melhor teve um delta de 6%, a média foi 18%, o pior foi 132%
Comparado com todos os dispositivos testados
» 17% de todos os dispositivos testados foram melhores, 4% semelhantes, 79% piores
» O melhor teve um delta de 4%, a média foi 23%, o pior foi 134%
Alienware 17 R4 análise de áudio
(±) | o volume do alto-falante é médio, mas bom (###valor### dB)
Graves 100 - 315Hz
(-) | quase nenhum baixo - em média 15.3% menor que a mediana
(±) | a linearidade dos graves é média (9.6% delta para a frequência anterior)
Médios 400 - 2.000 Hz
(±) | médios mais altos - em média 5.5% maior que a mediana
(±) | a linearidade dos médios é média (8.9% delta para frequência anterior)
Altos 2 - 16 kHz
(±) | máximos mais altos - em média 5.1% maior que a mediana
(±) | a linearidade dos máximos é média (9.7% delta para frequência anterior)
Geral 100 - 16.000 Hz
(±) | a linearidade do som geral é média (22.4% diferença em relação à mediana)
Comparado com a mesma classe
» 80% de todos os dispositivos testados nesta classe foram melhores, 6% semelhantes, 14% piores
» O melhor teve um delta de 6%, a média foi 18%, o pior foi 132%
Comparado com todos os dispositivos testados
» 66% de todos os dispositivos testados foram melhores, 6% semelhantes, 29% piores
» O melhor teve um delta de 4%, a média foi 23%, o pior foi 134%
| desligado | |
| Ocioso | |
| Carga |
|
Key:
min: | |
| Aorus X9 GeForce GTX 1070 SLI (Laptop), i7-7820HK | Alienware 17 R4 GeForce GTX 1080 Mobile, i7-7820HK | MSI GT75VR 7RF-012 Titan Pro GeForce GTX 1080 Mobile, i7-7820HK | Asus G752VS-BA338T GeForce GTX 1070 Mobile, i7-7700HQ | Acer Predator 17 G9-793-70PJ GeForce GTX 1070 Mobile, i7-7700HQ | |
|---|---|---|---|---|---|
| Power Consumption | 7% | -2% | 33% | 23% | |
| Idle Minimum * (Watt) | 29 | 37.5 -29% | 34 -17% | 21 28% | 23 21% |
| Idle Average * (Watt) | 35 | 37.6 -7% | 41 -17% | 27 23% | 33 6% |
| Idle Maximum * (Watt) | 42 | 37.6 10% | 50 -19% | 32 24% | 40 5% |
| Load Average * (Watt) | 140 | 122.4 13% | 106 24% | 86 39% | 94 33% |
| Witcher 3 ultra * (Watt) | 295 | 180.3 39% | 257 13% | 165 44% | 177 40% |
| Load Maximum * (Watt) | 334 | 277.4 17% | 320 4% | 206 38% | 228 32% |
* ... menor é melhor
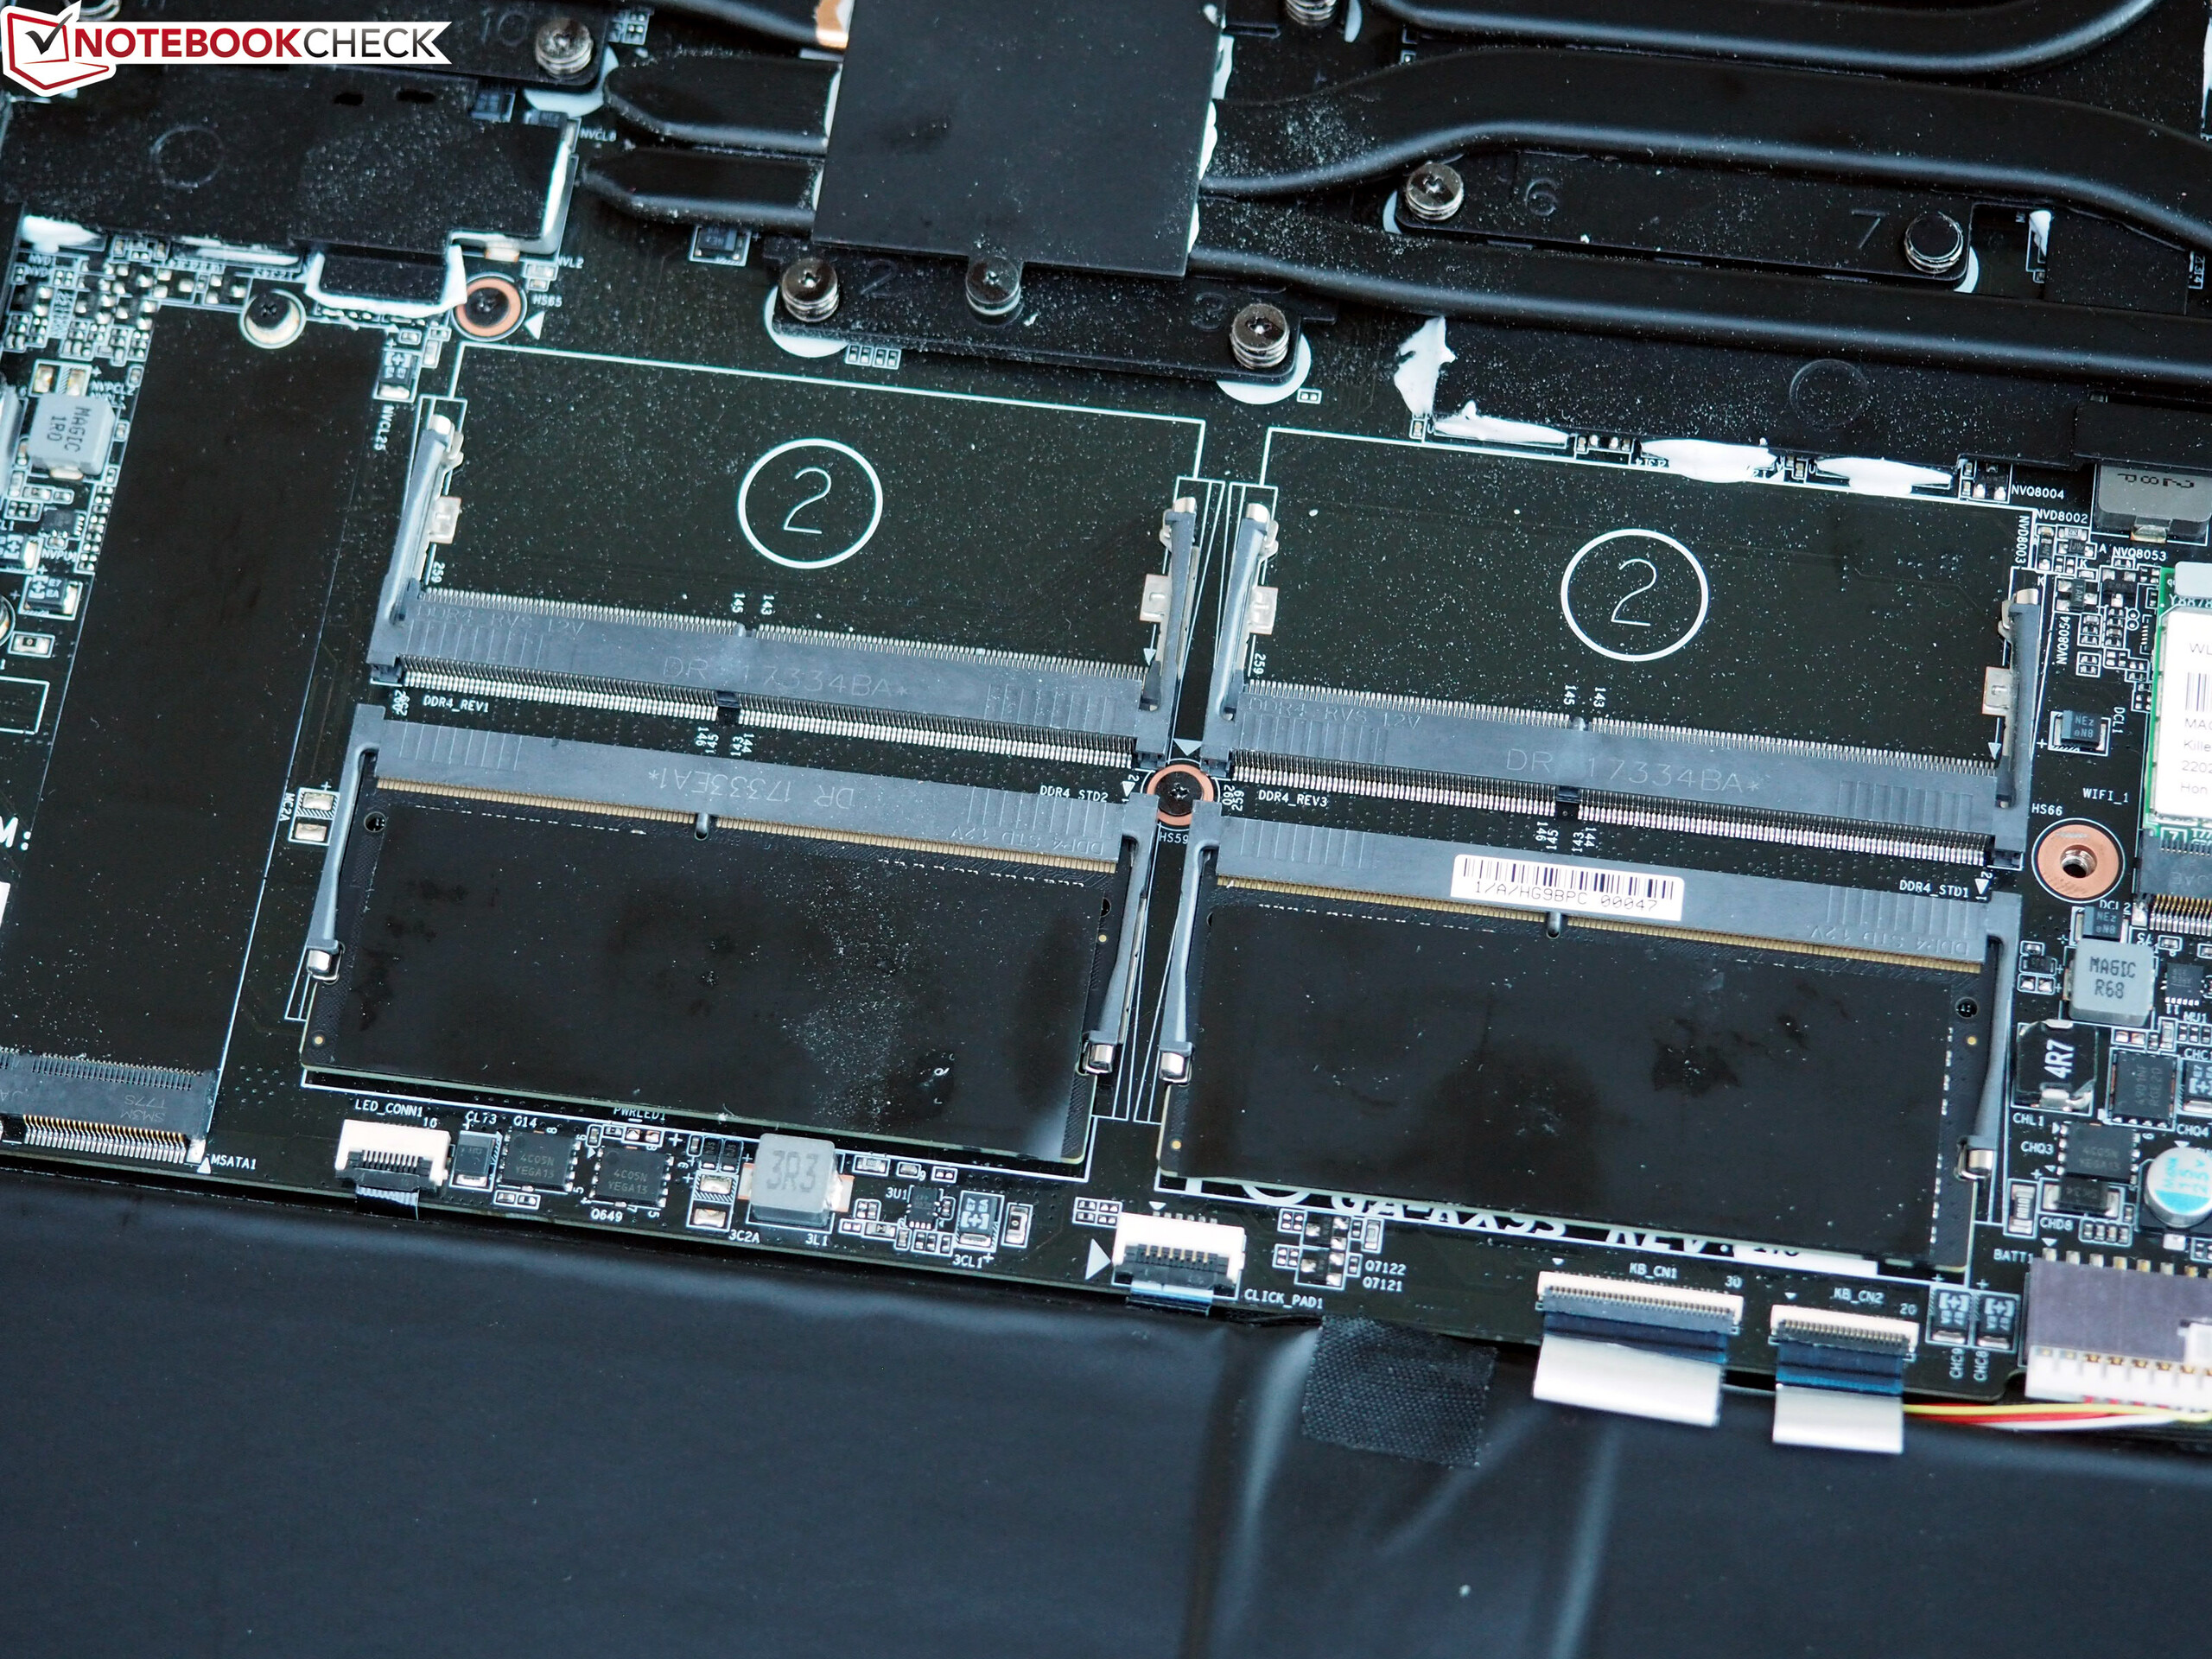
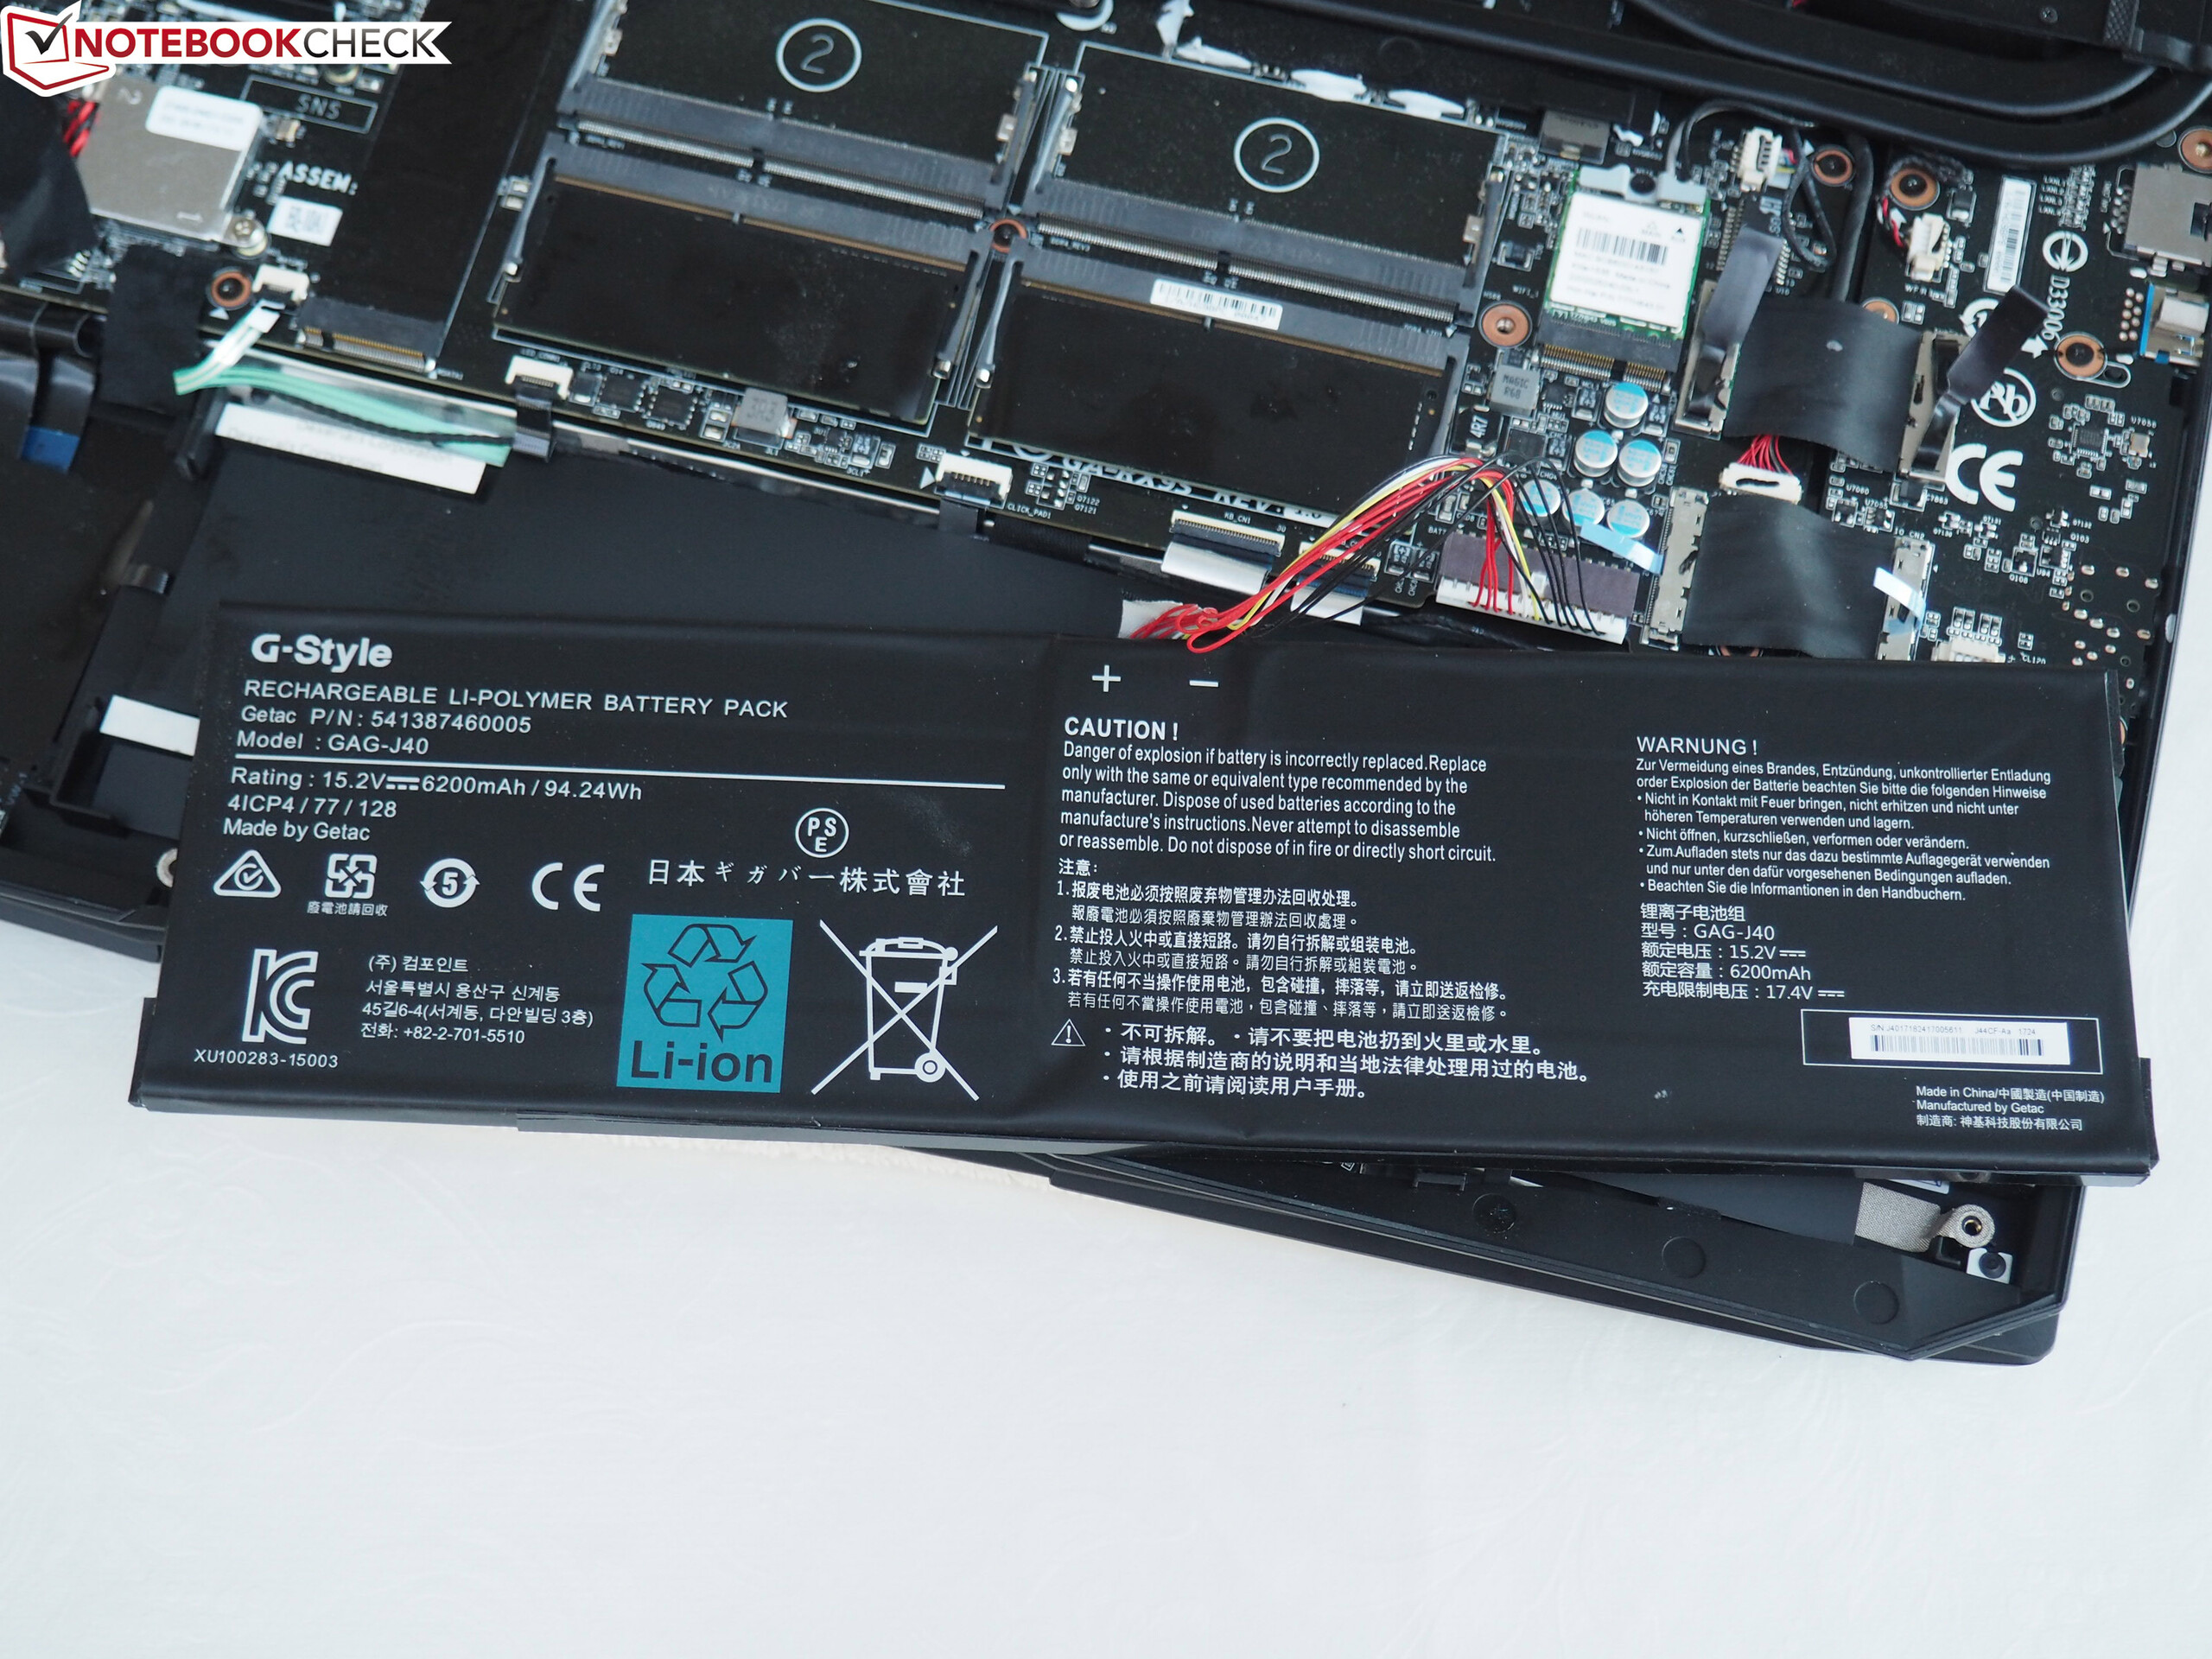
| Aorus X9 i7-7820HK, GeForce GTX 1070 SLI (Laptop), 94.24 Wh | Alienware 17 R4 i7-7820HK, GeForce GTX 1080 Mobile, 99 Wh | MSI GT75VR 7RF-012 Titan Pro i7-7820HK, GeForce GTX 1080 Mobile, 75 Wh | Asus G752VS-BA338T i7-7700HQ, GeForce GTX 1070 Mobile, 90 Wh | Acer Predator 17 G9-793-70PJ i7-7700HQ, GeForce GTX 1070 Mobile, 88 Wh | |
|---|---|---|---|---|---|
| Duração da bateria | 32% | 3% | 100% | 58% | |
| Reader / Idle (h) | 2.9 | 4.6 59% | 3 3% | 7.4 155% | 5.4 86% |
| H.264 (h) | 2.3 | 2.5 9% | 4.3 87% | ||
| WiFi v1.3 (h) | 2.2 | 3 36% | 2.4 9% | 4.9 123% | 3.6 64% |
| Load (h) | 1.2 | 1.2 0% | 1.1 -8% | 1.6 33% | 1.5 25% |
Pro
Contra
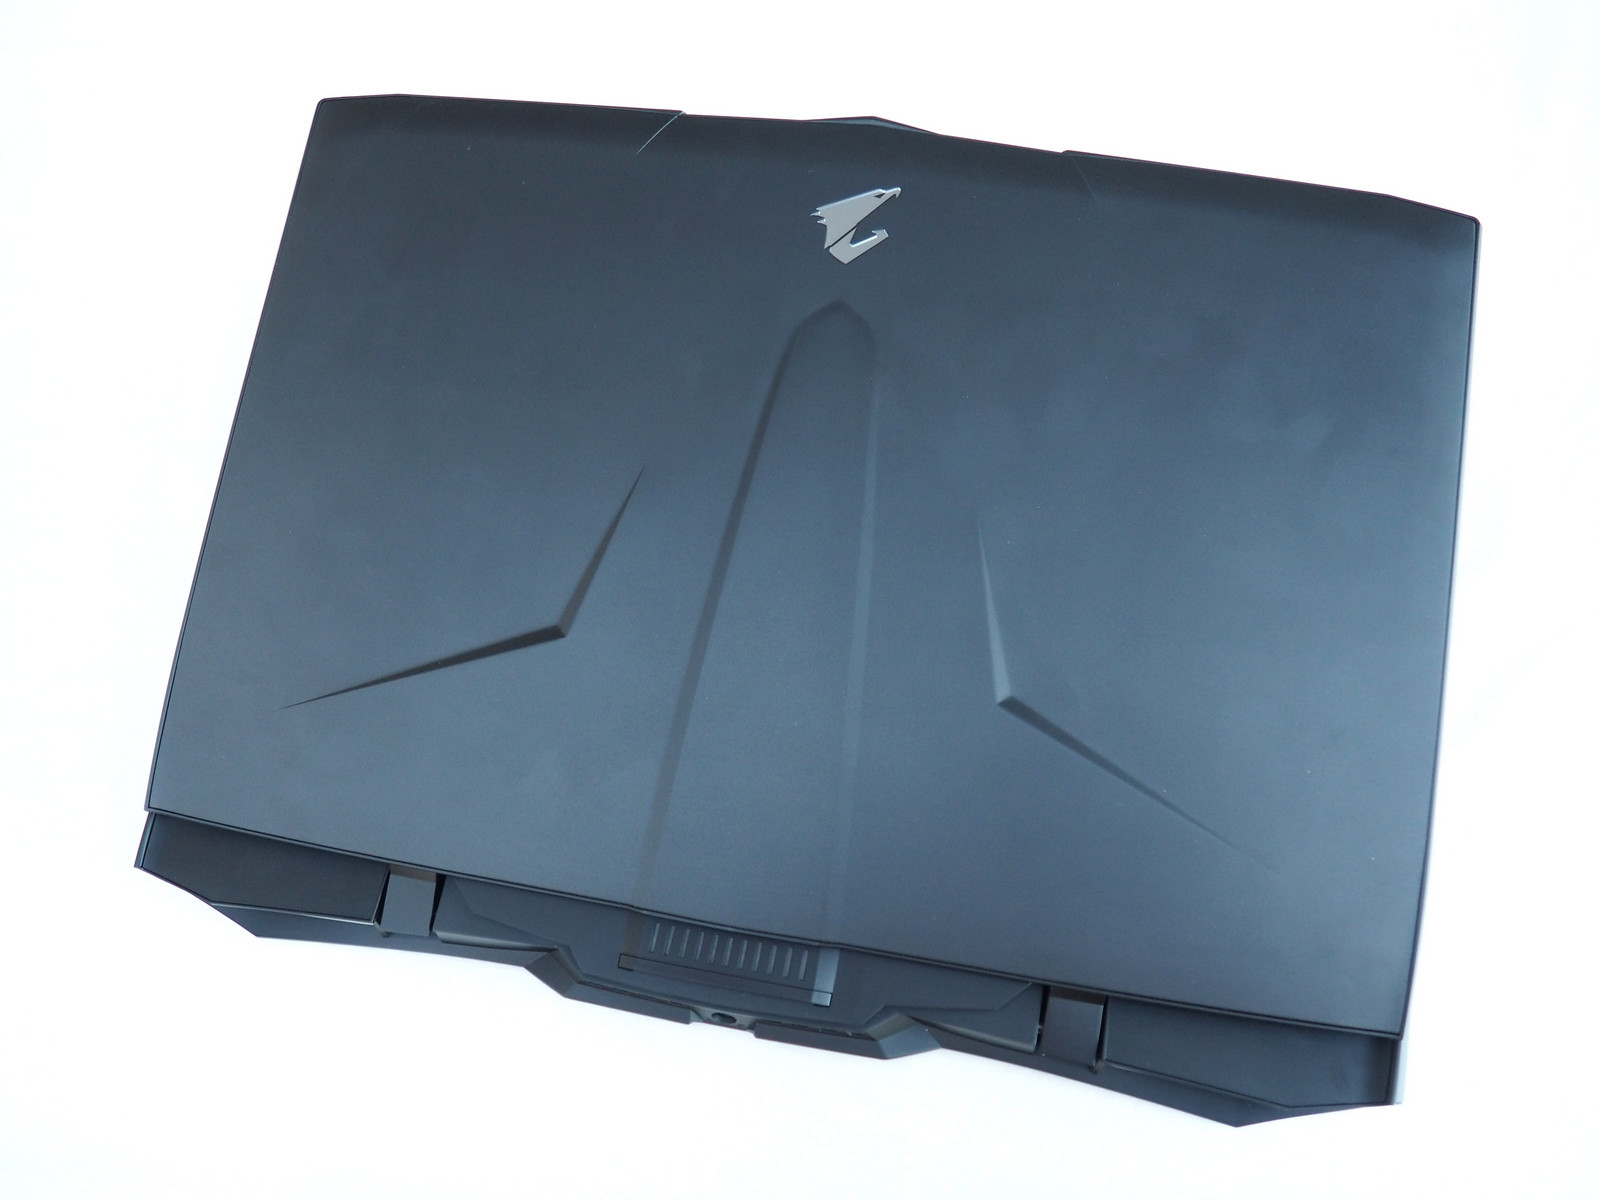
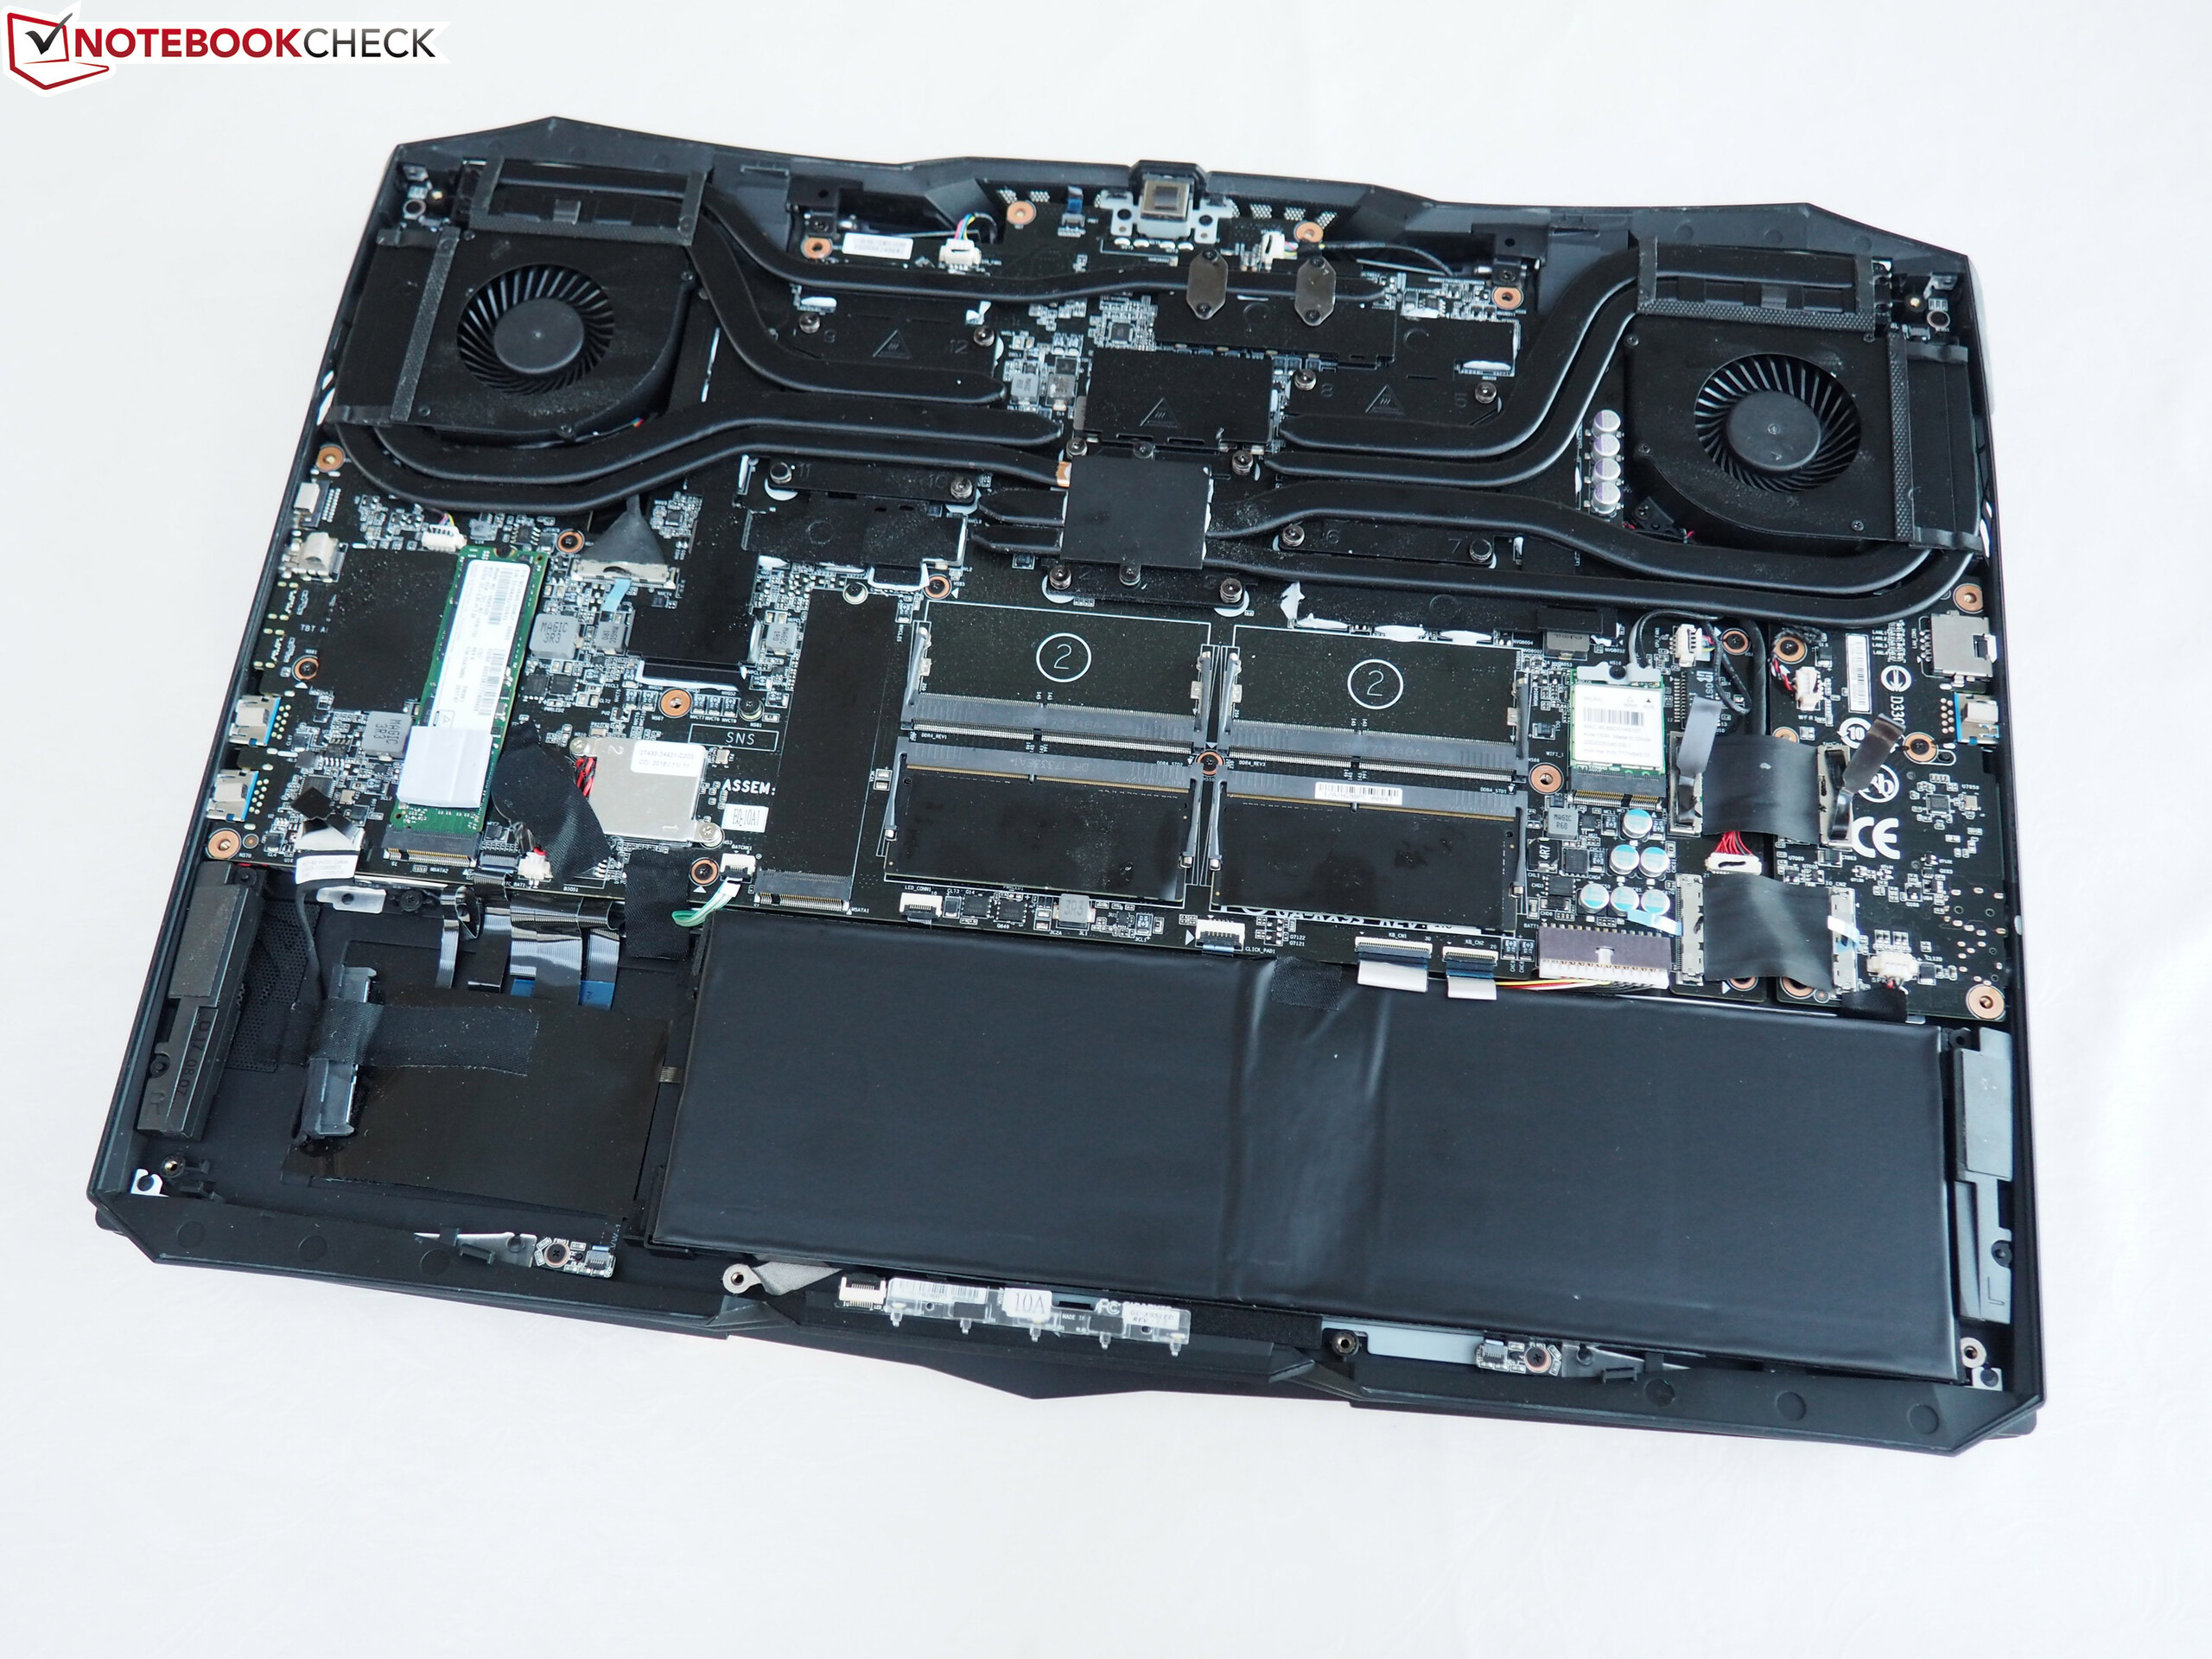
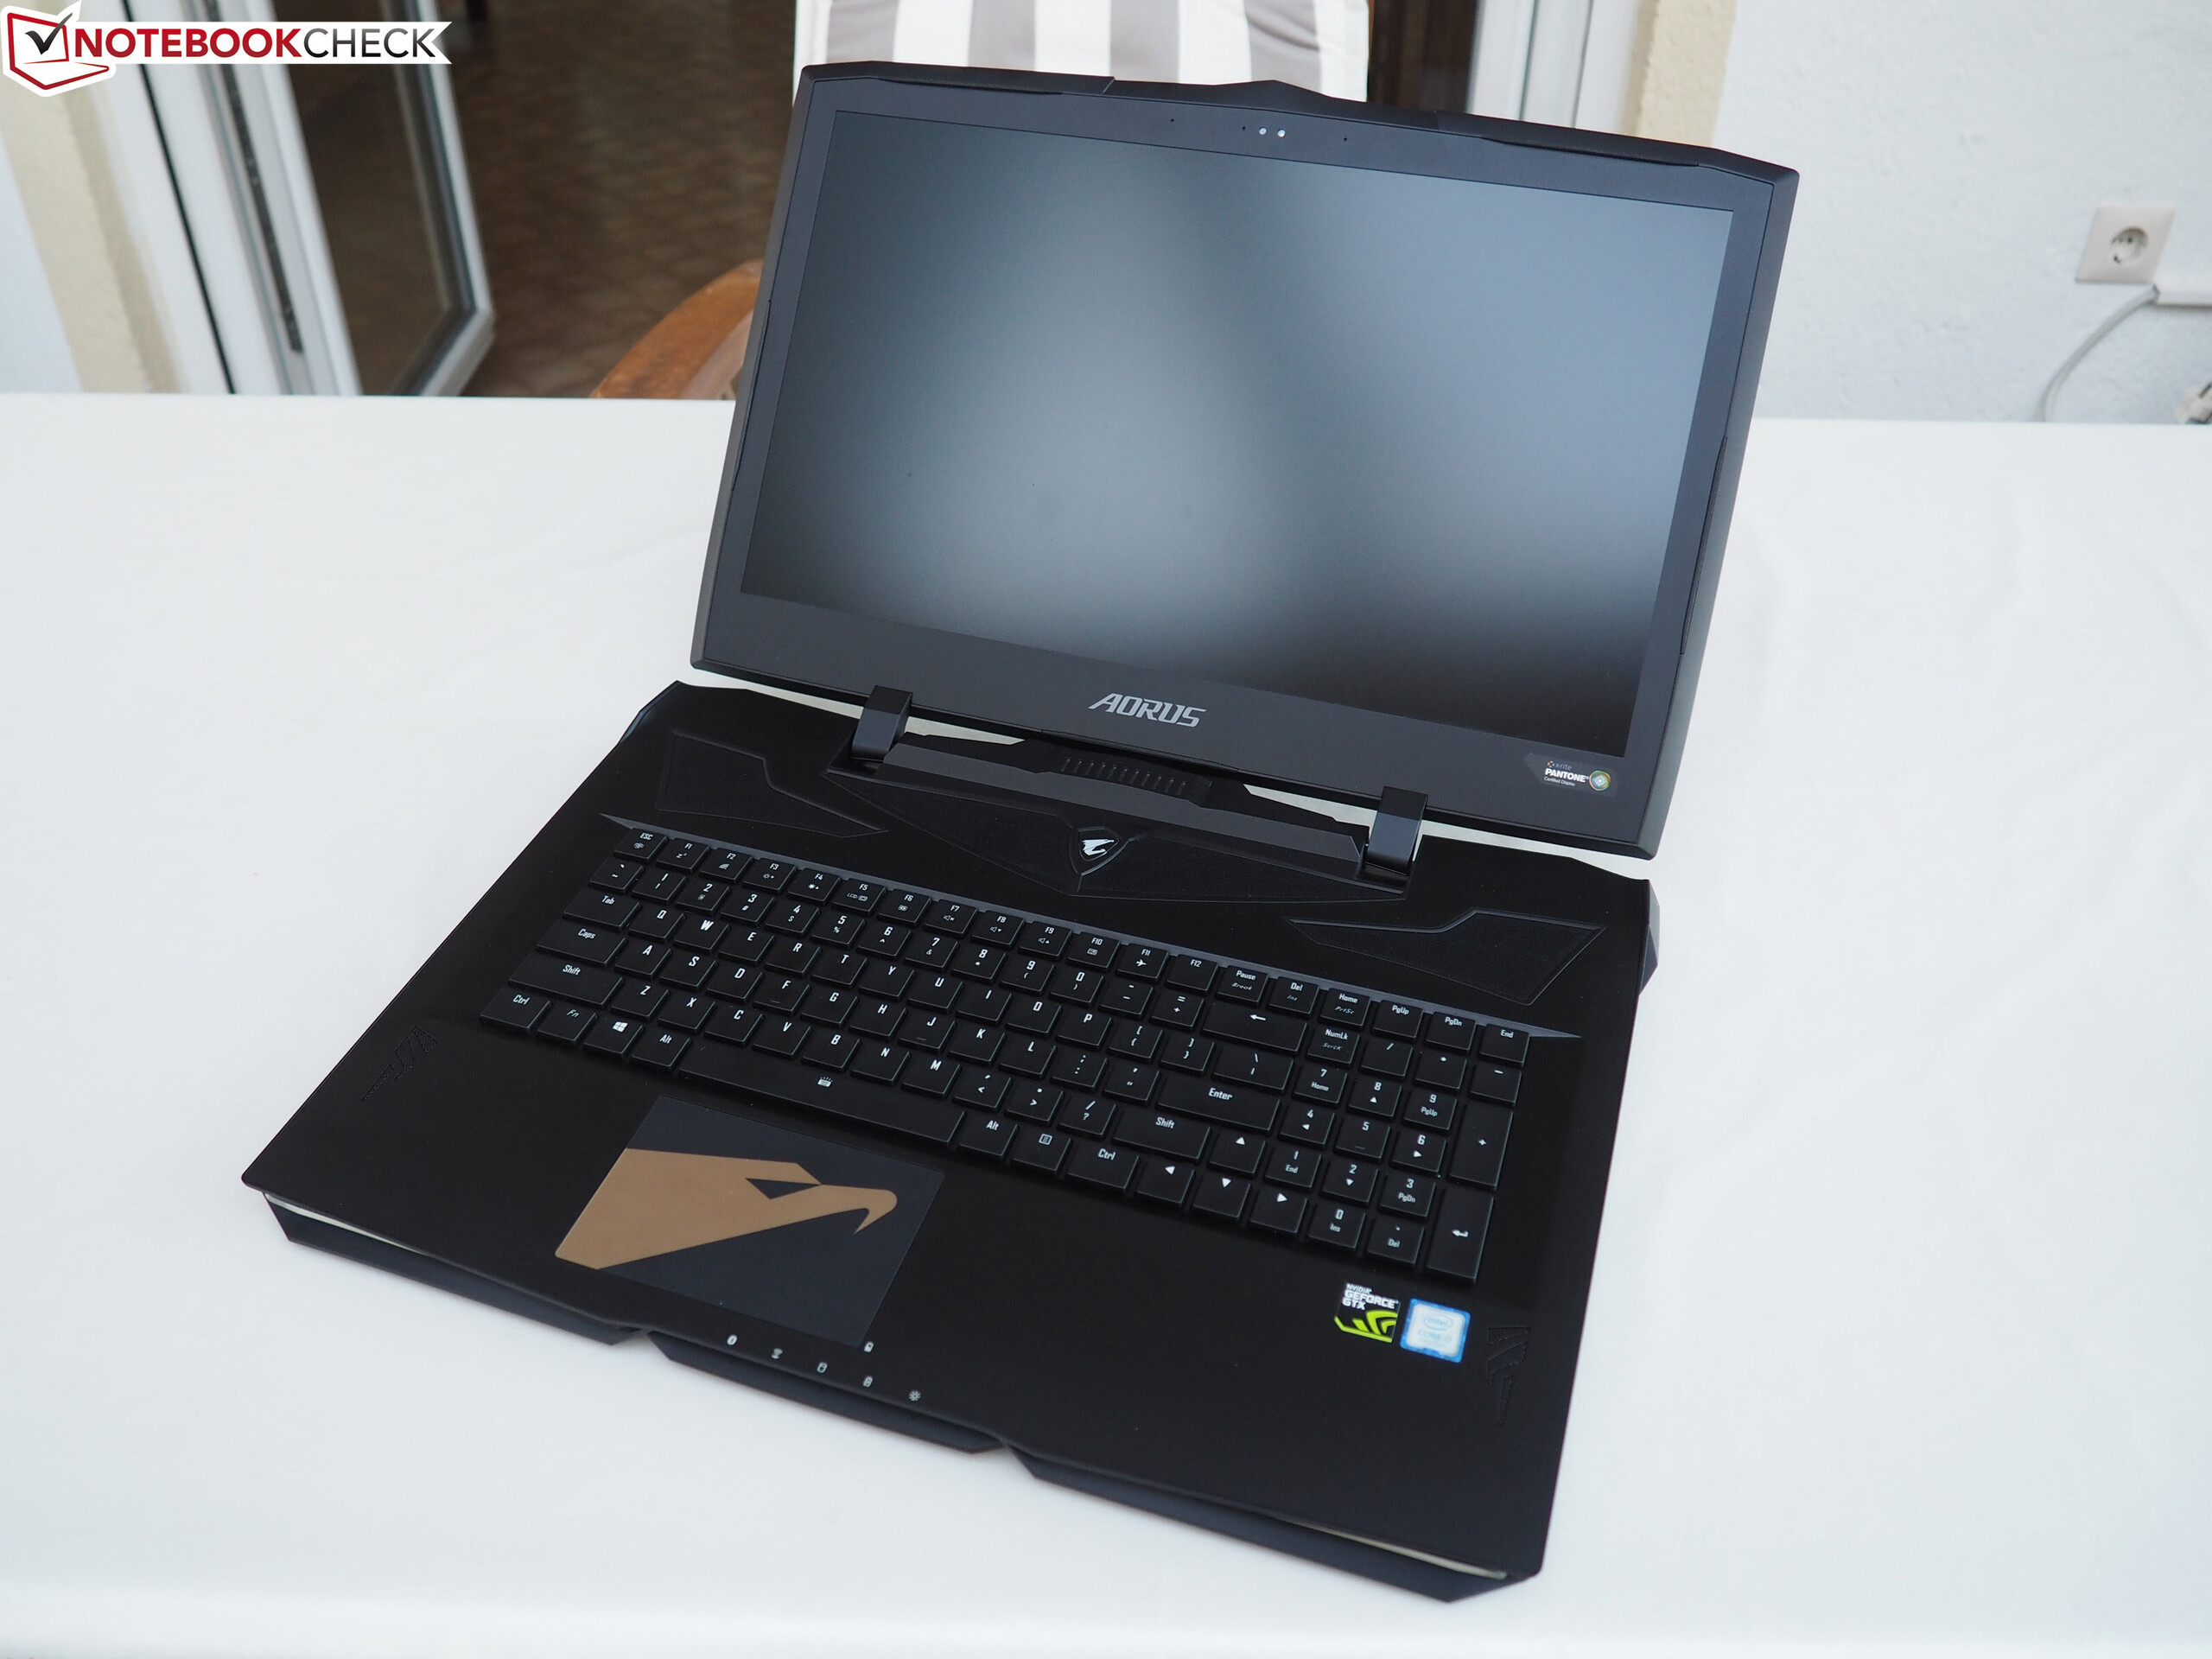
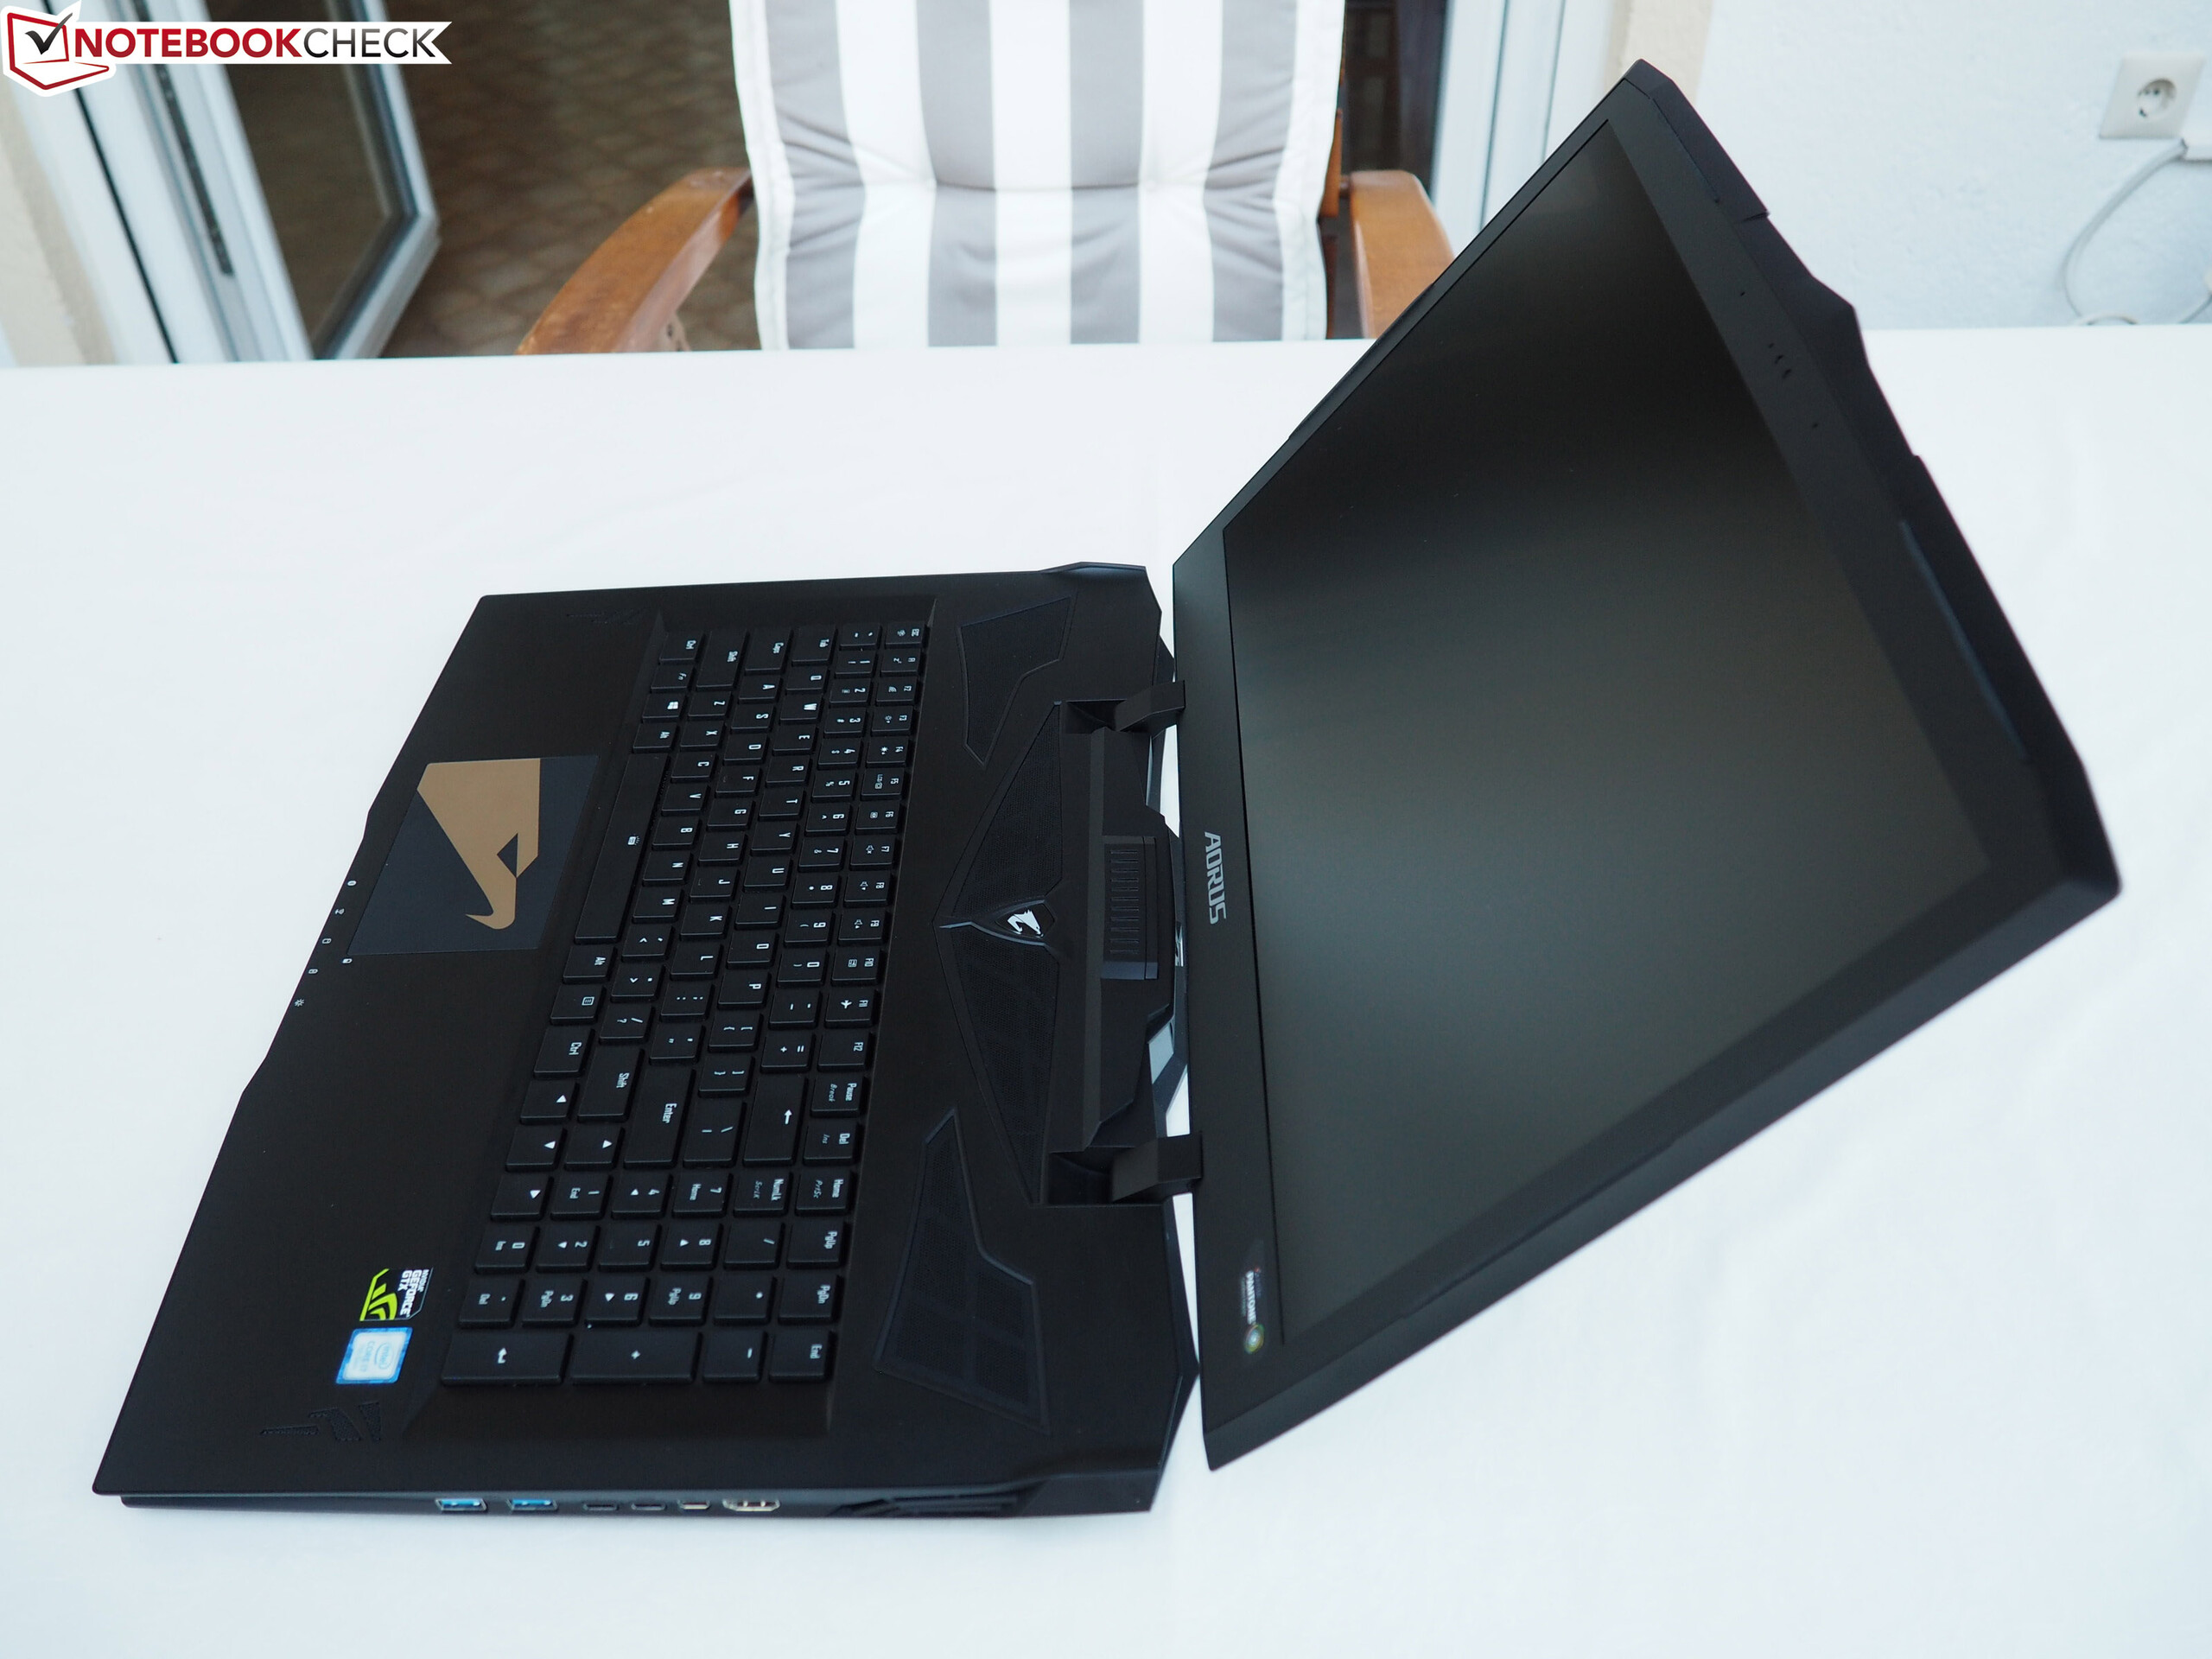
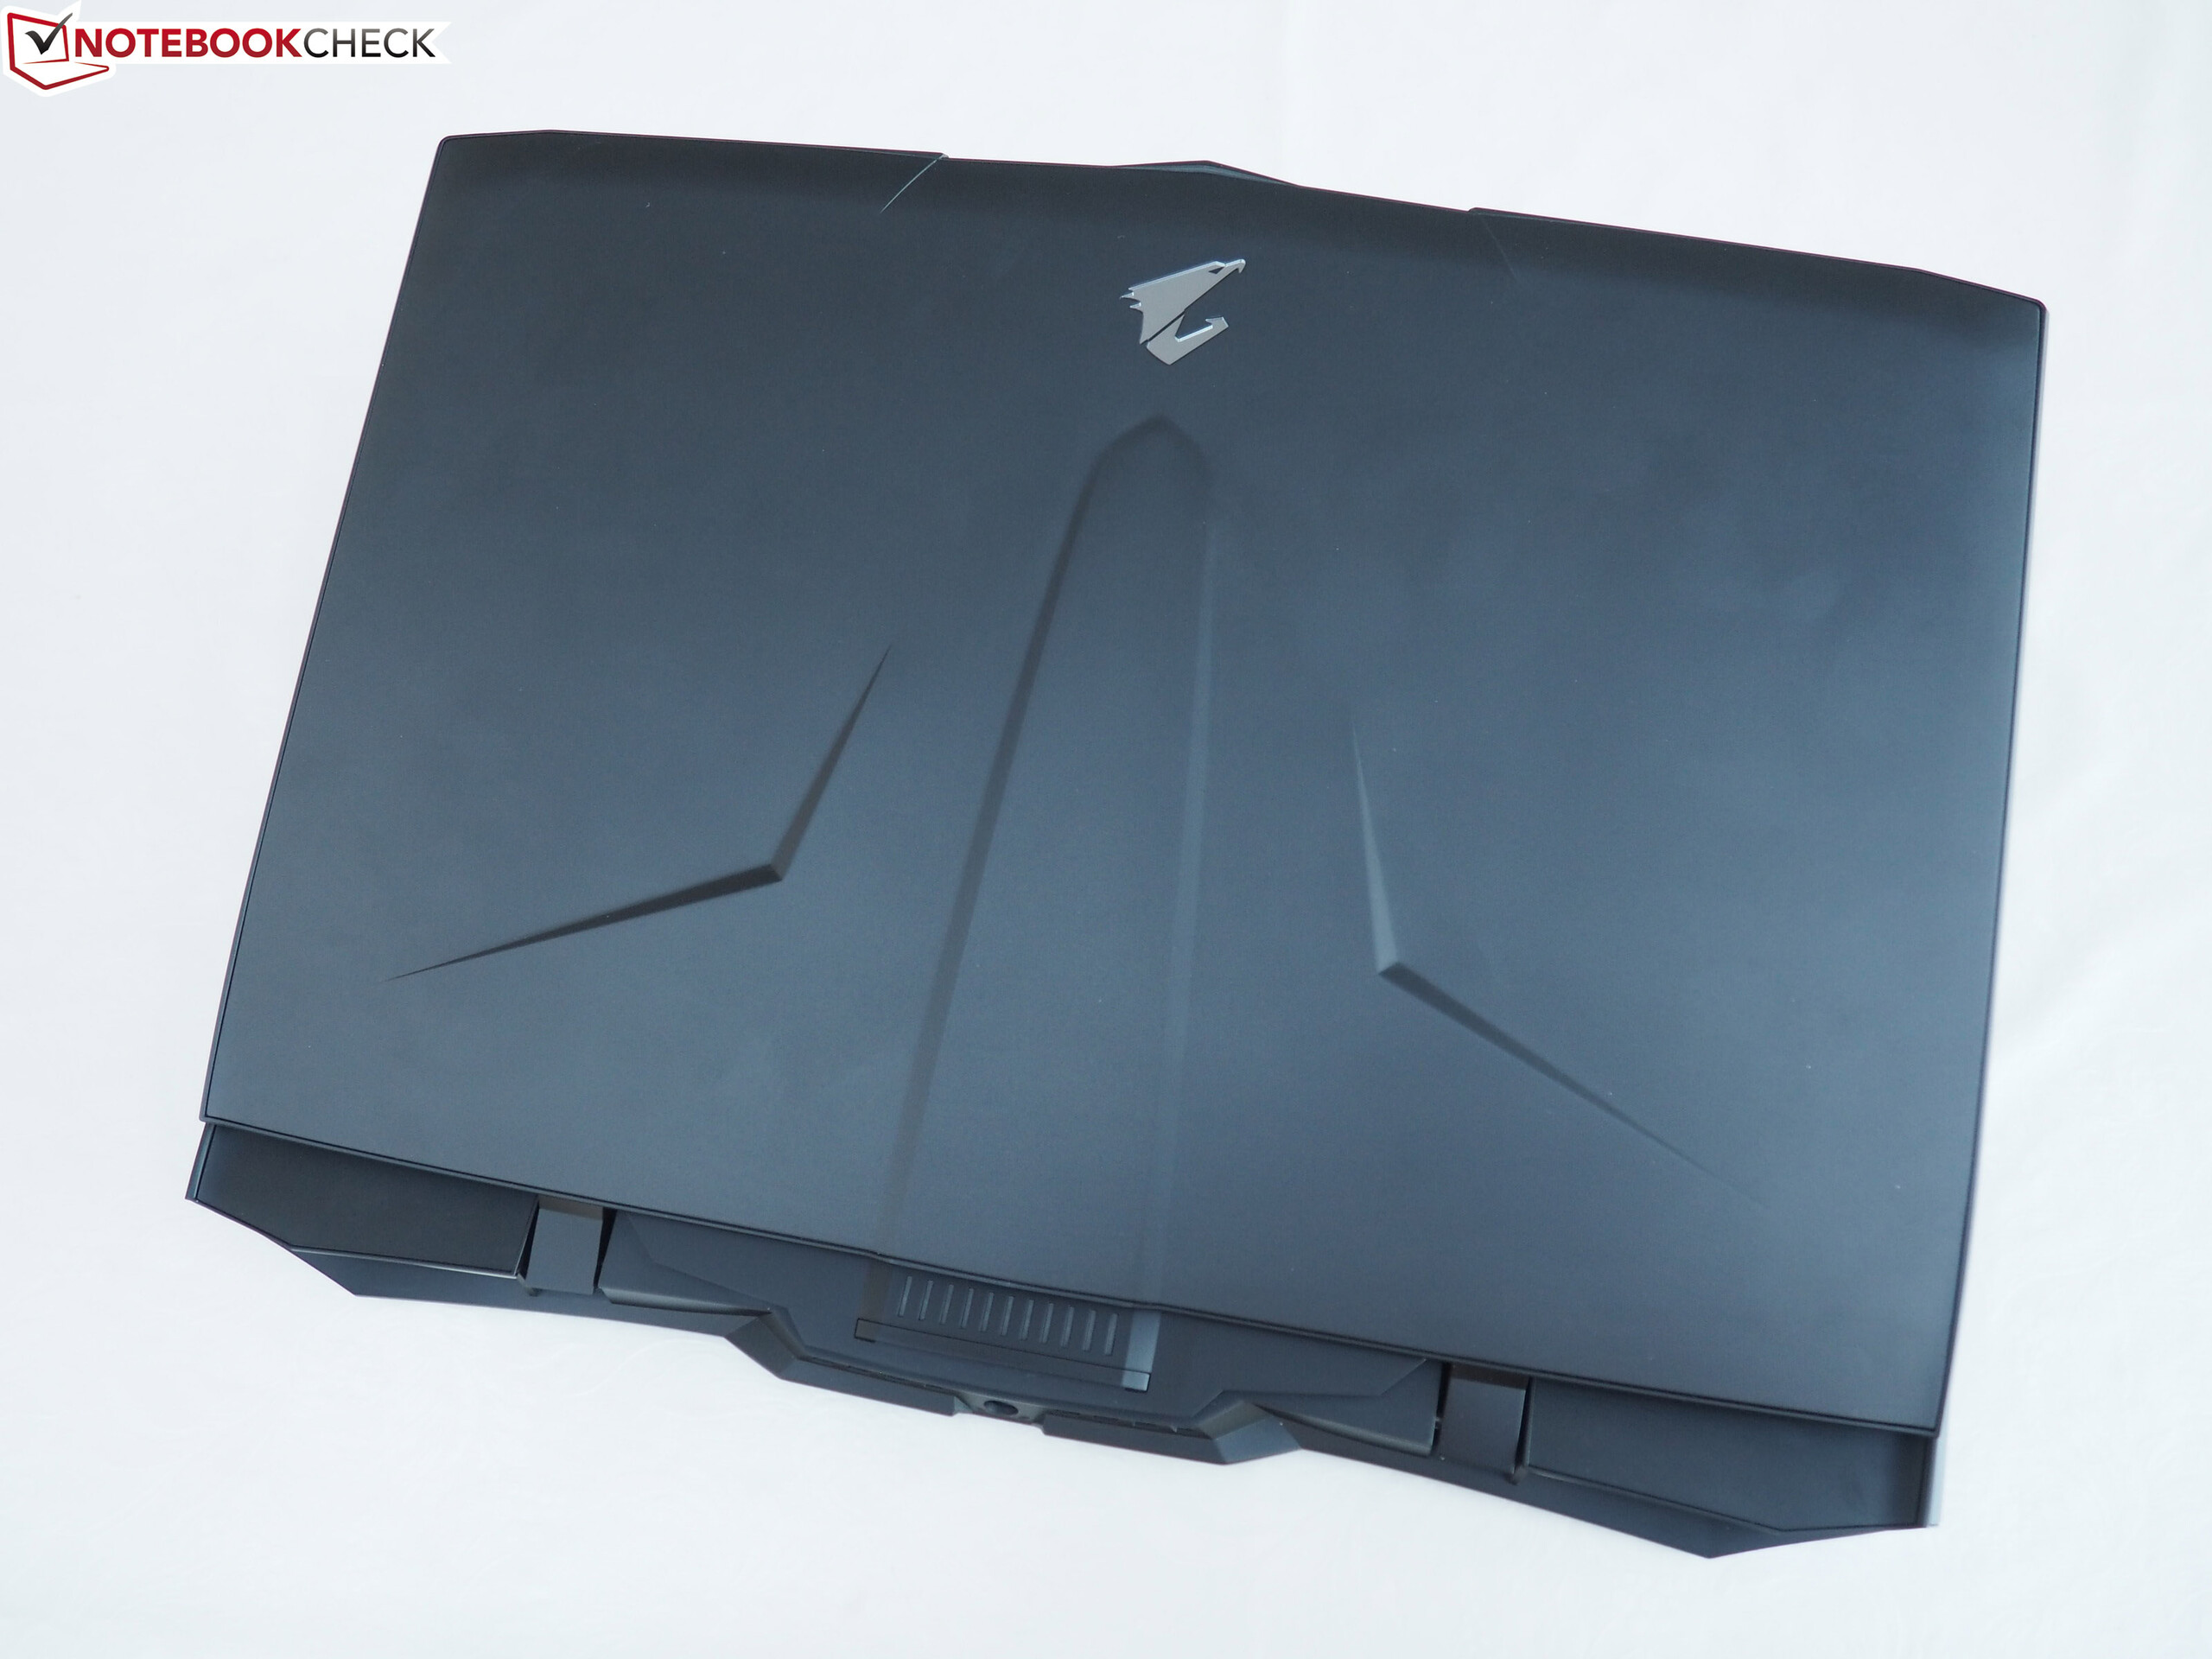
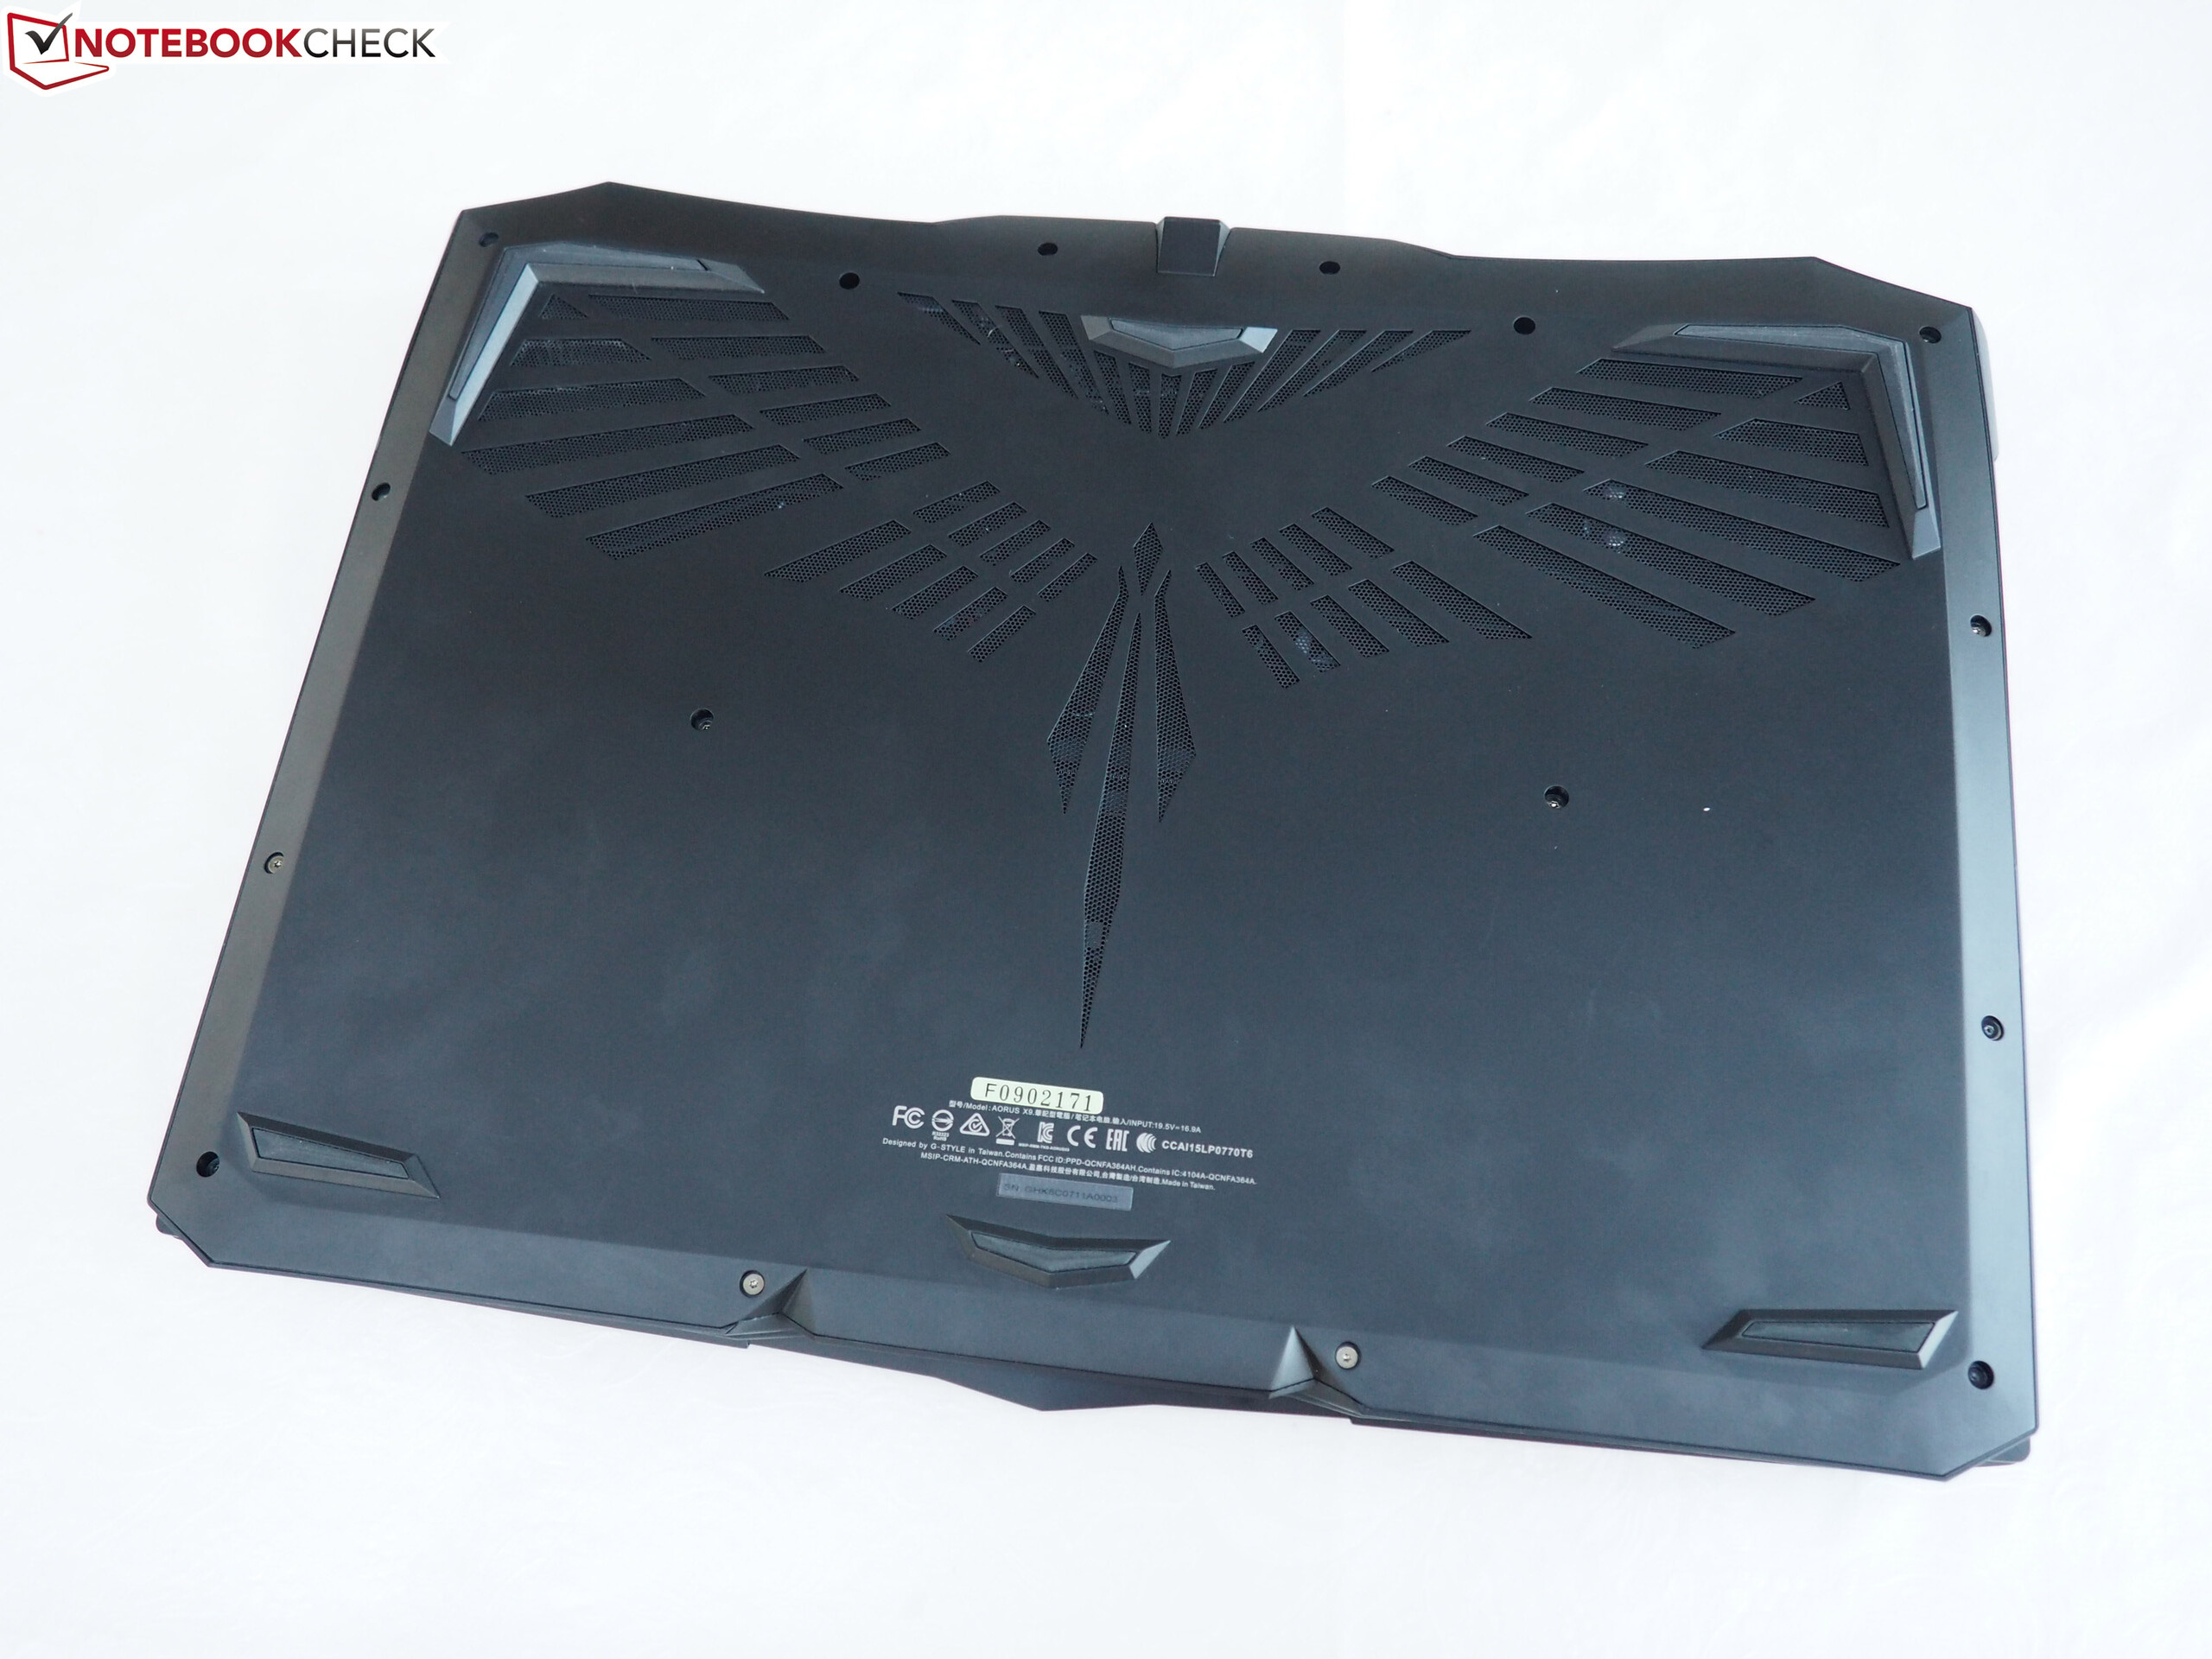
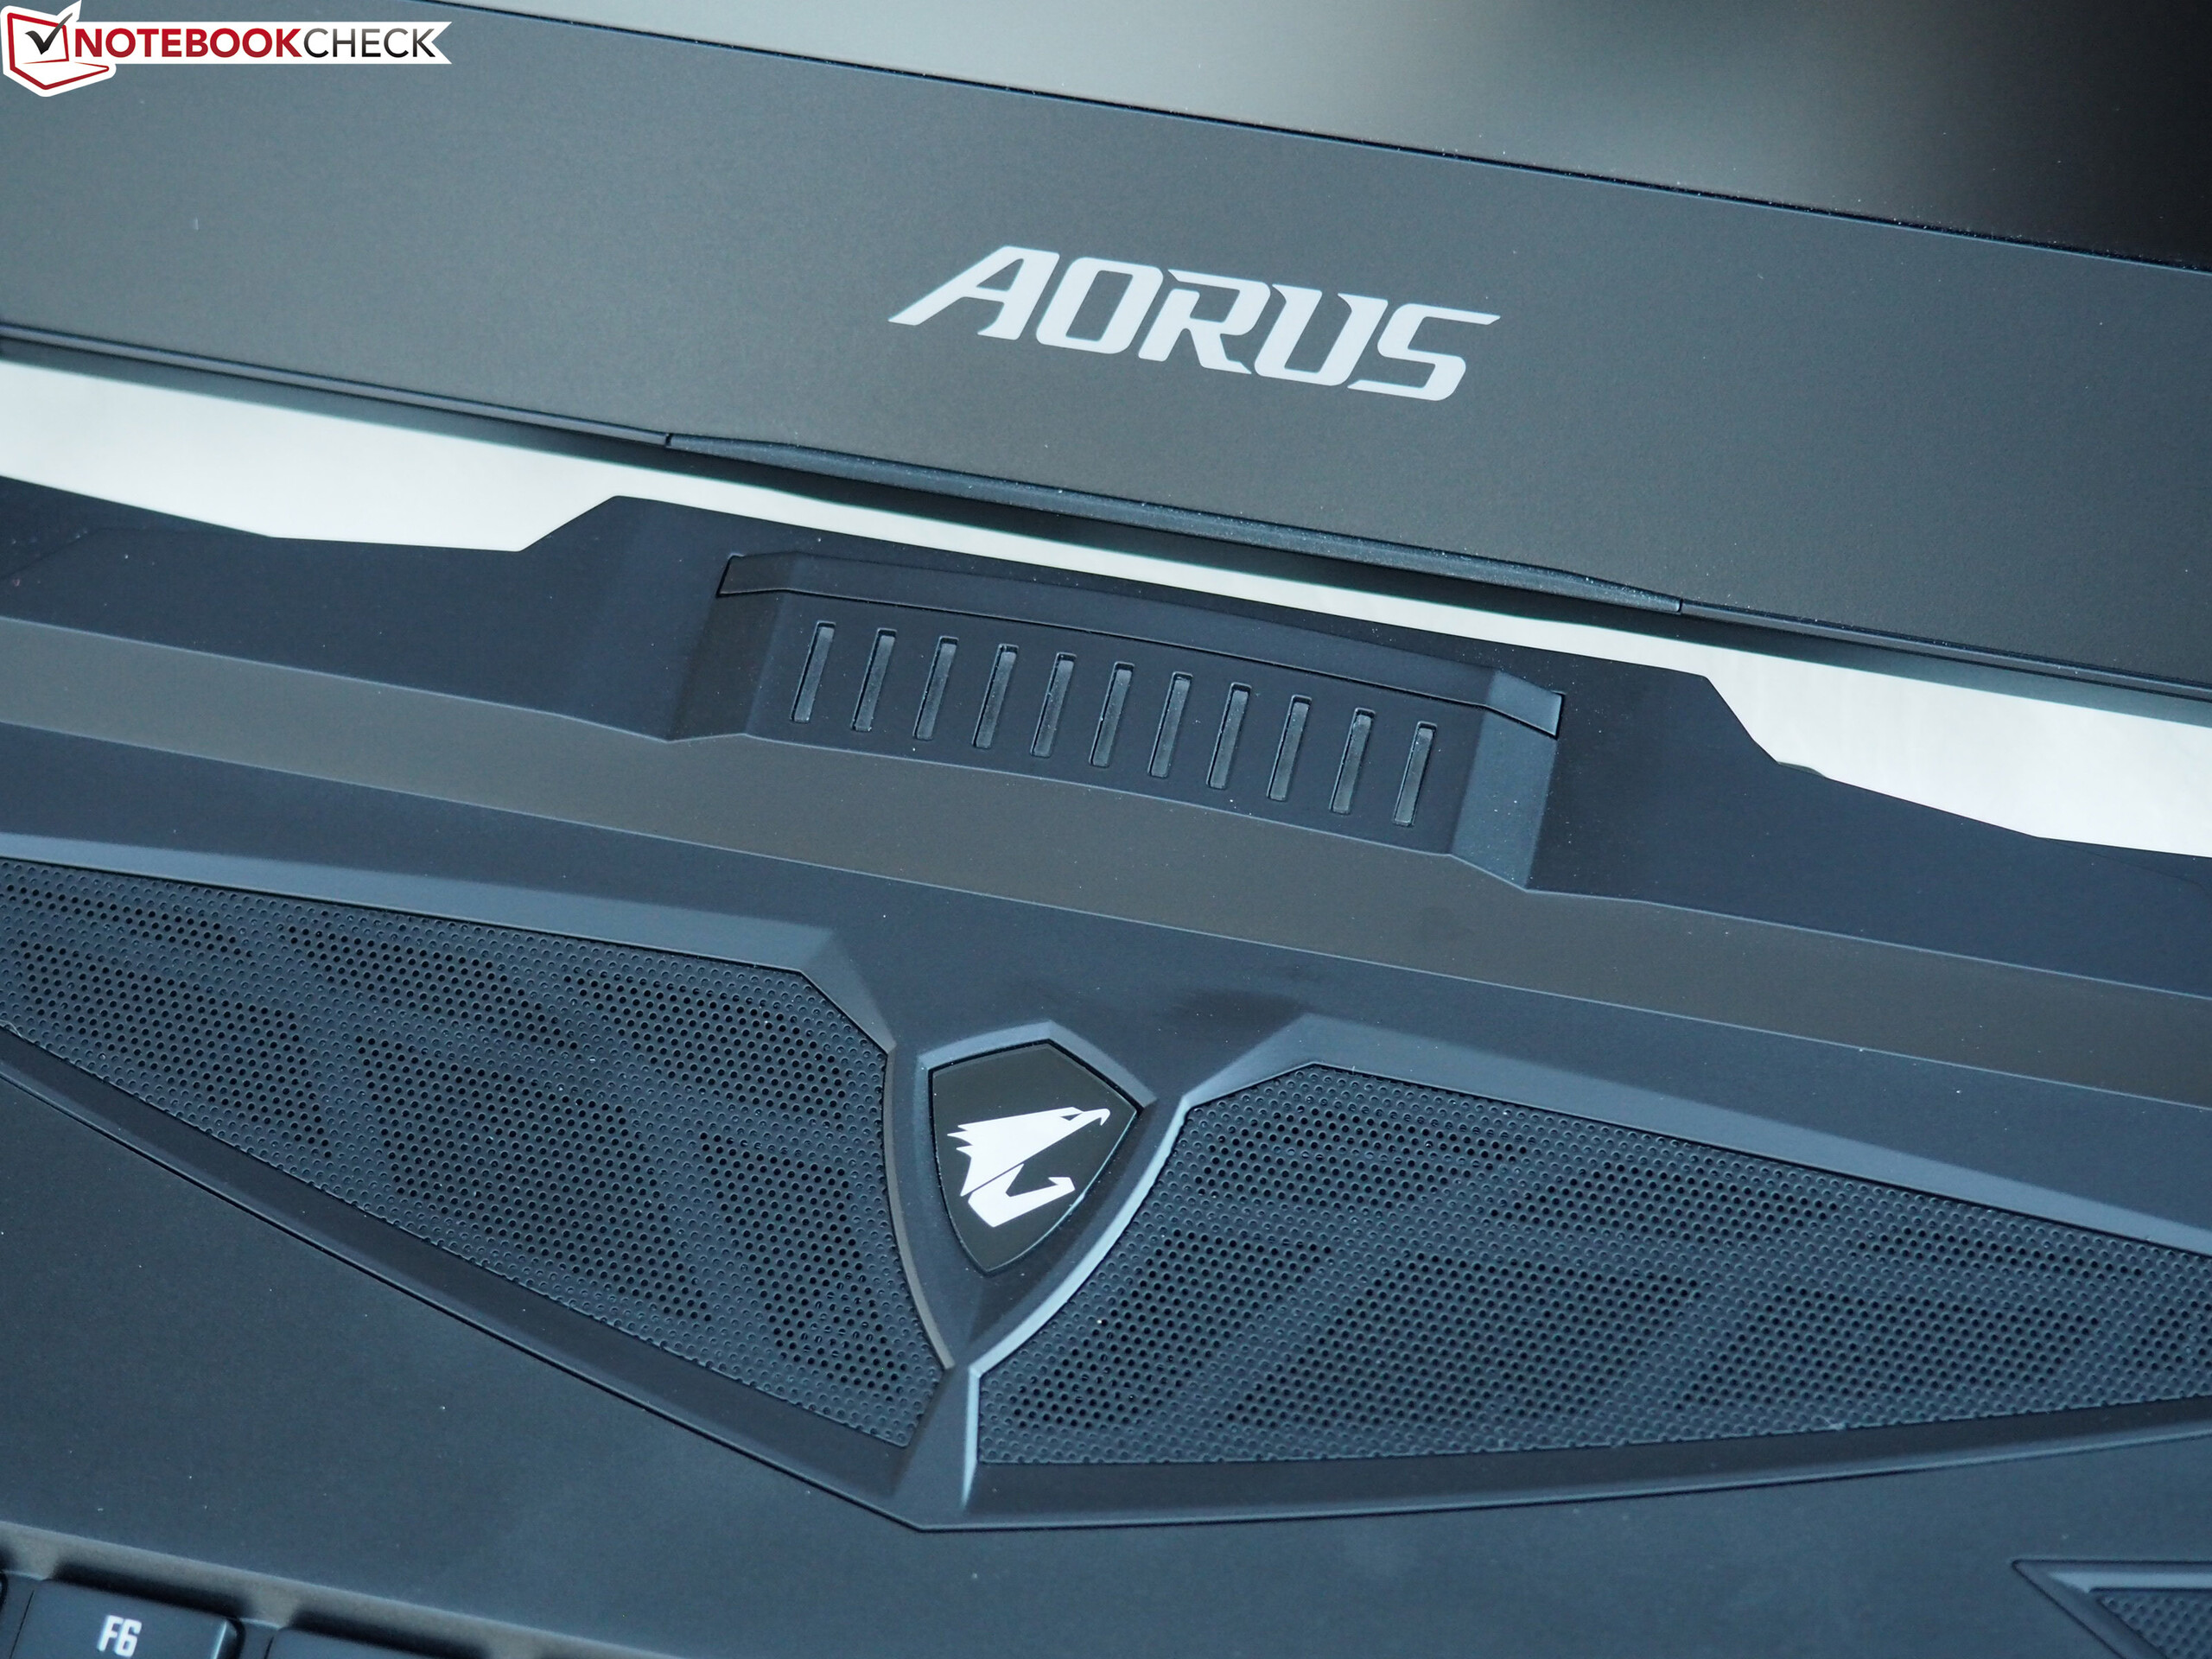
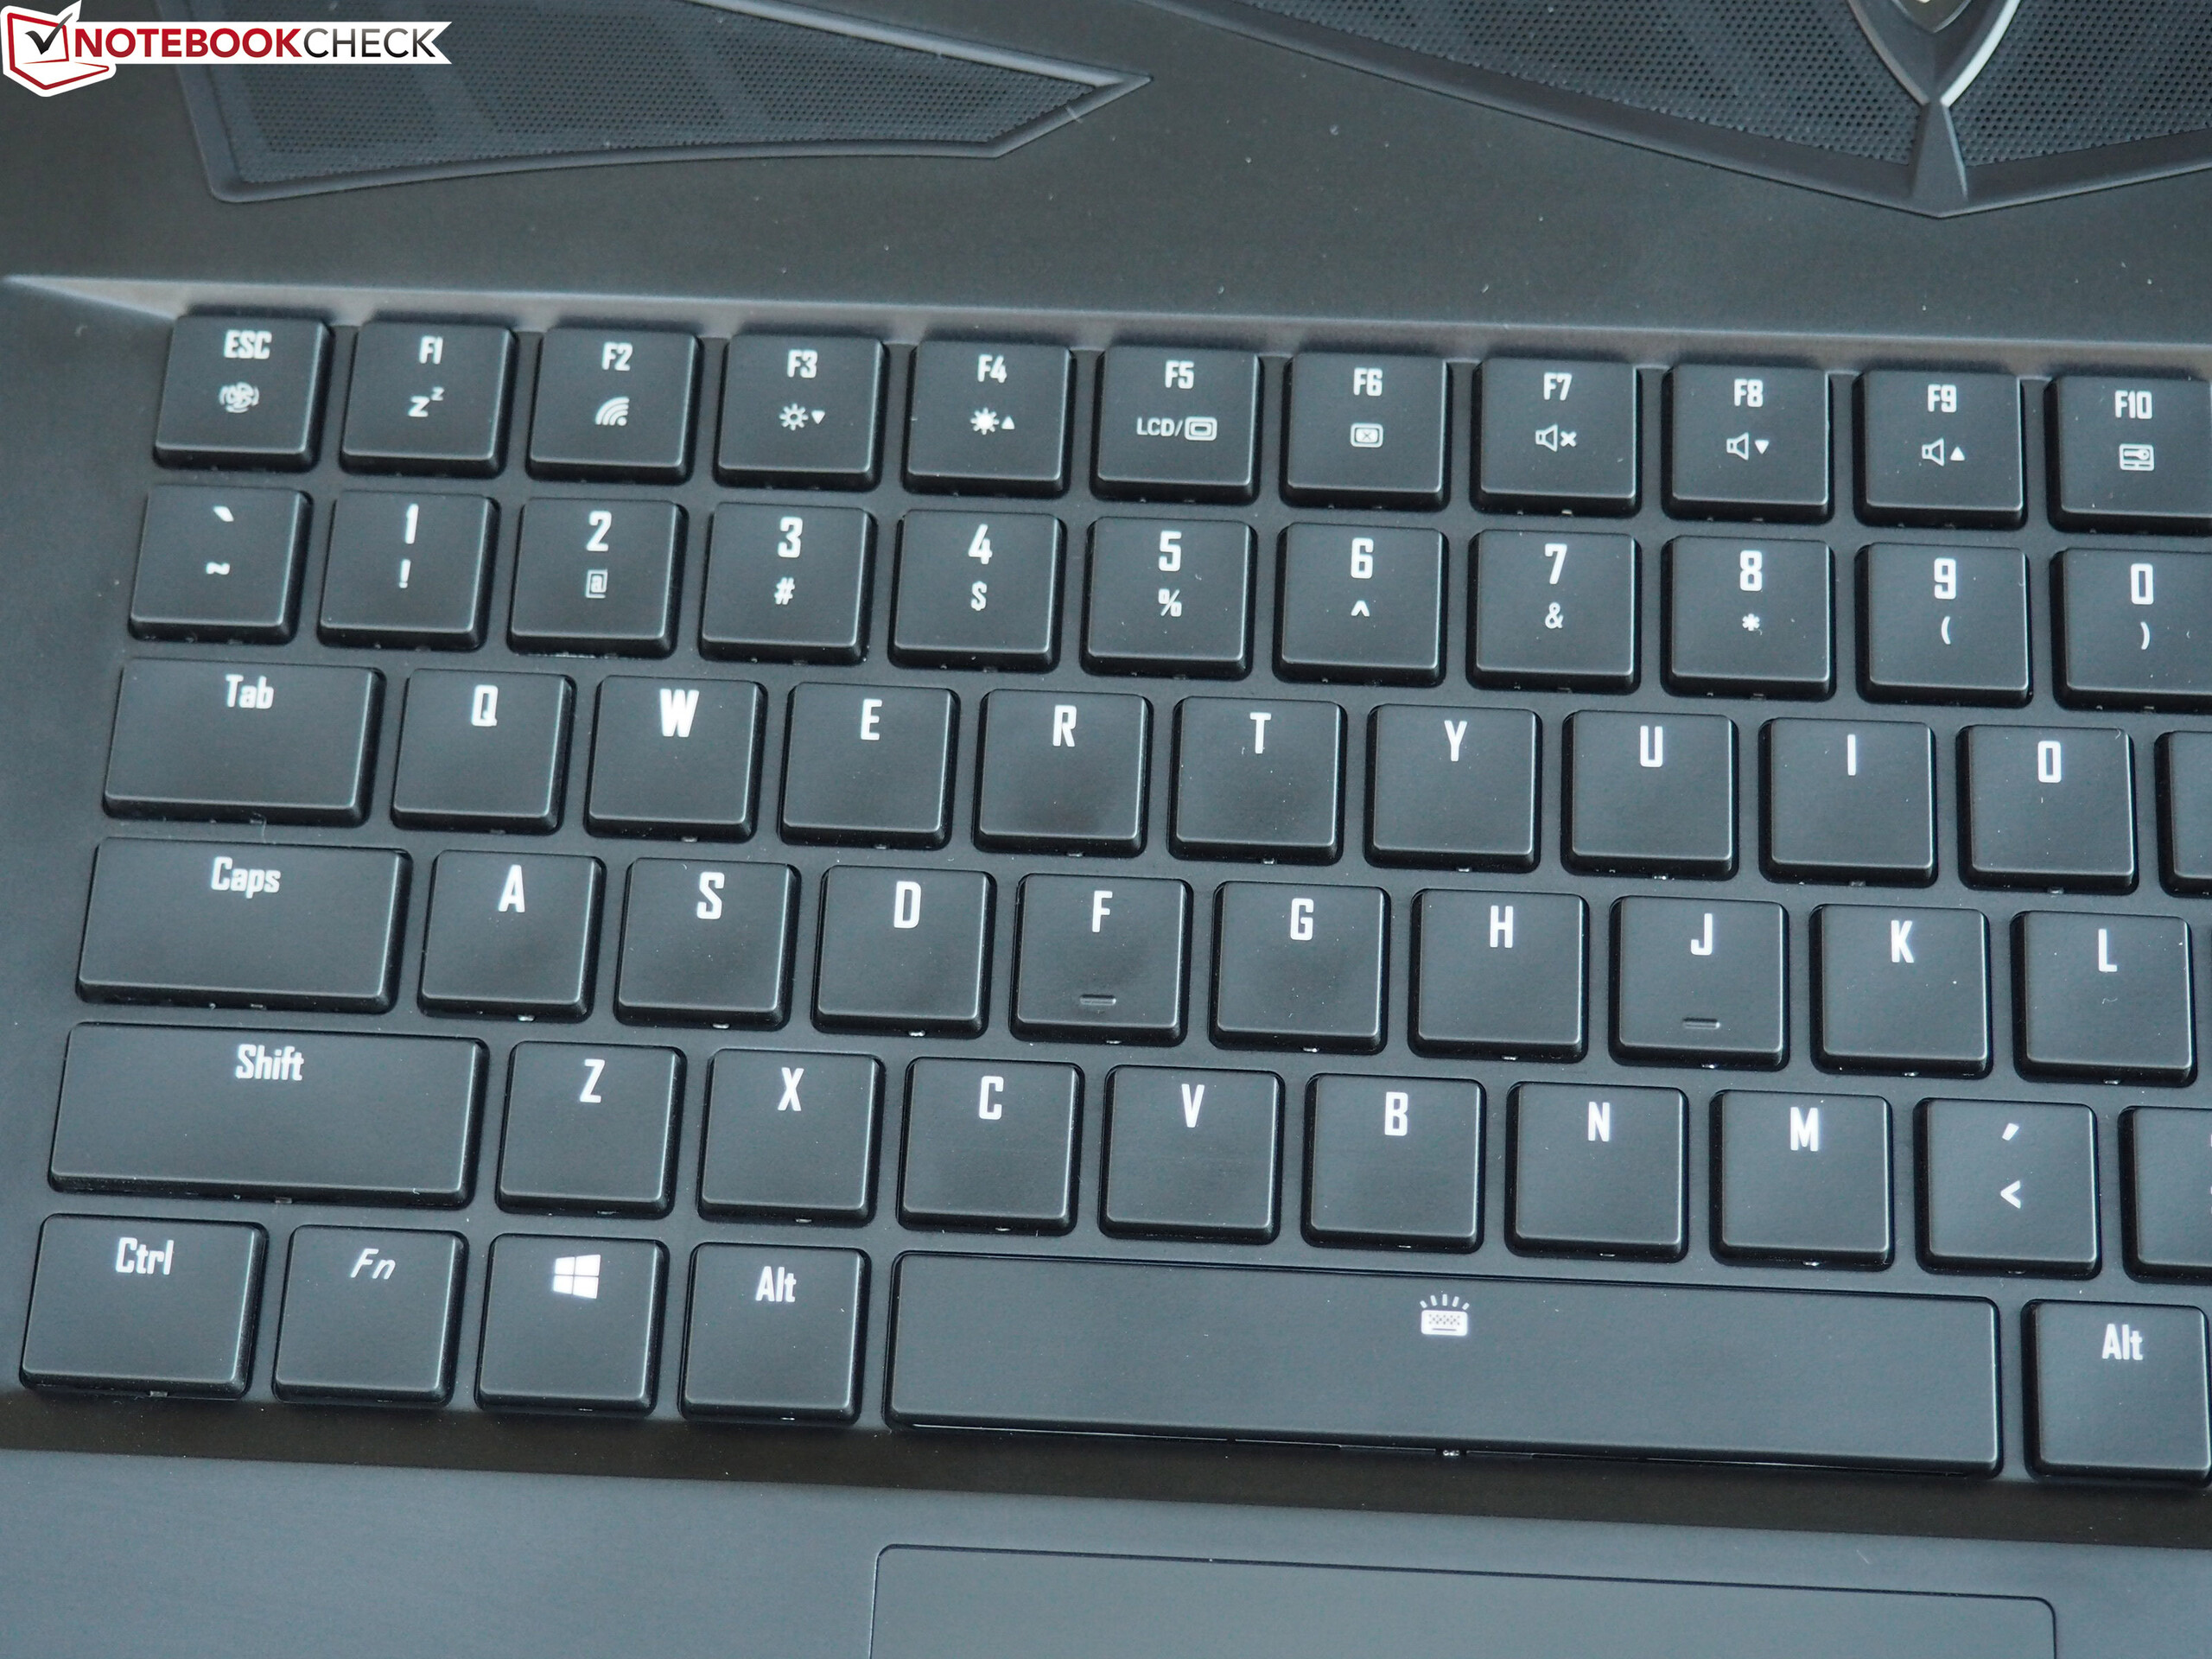
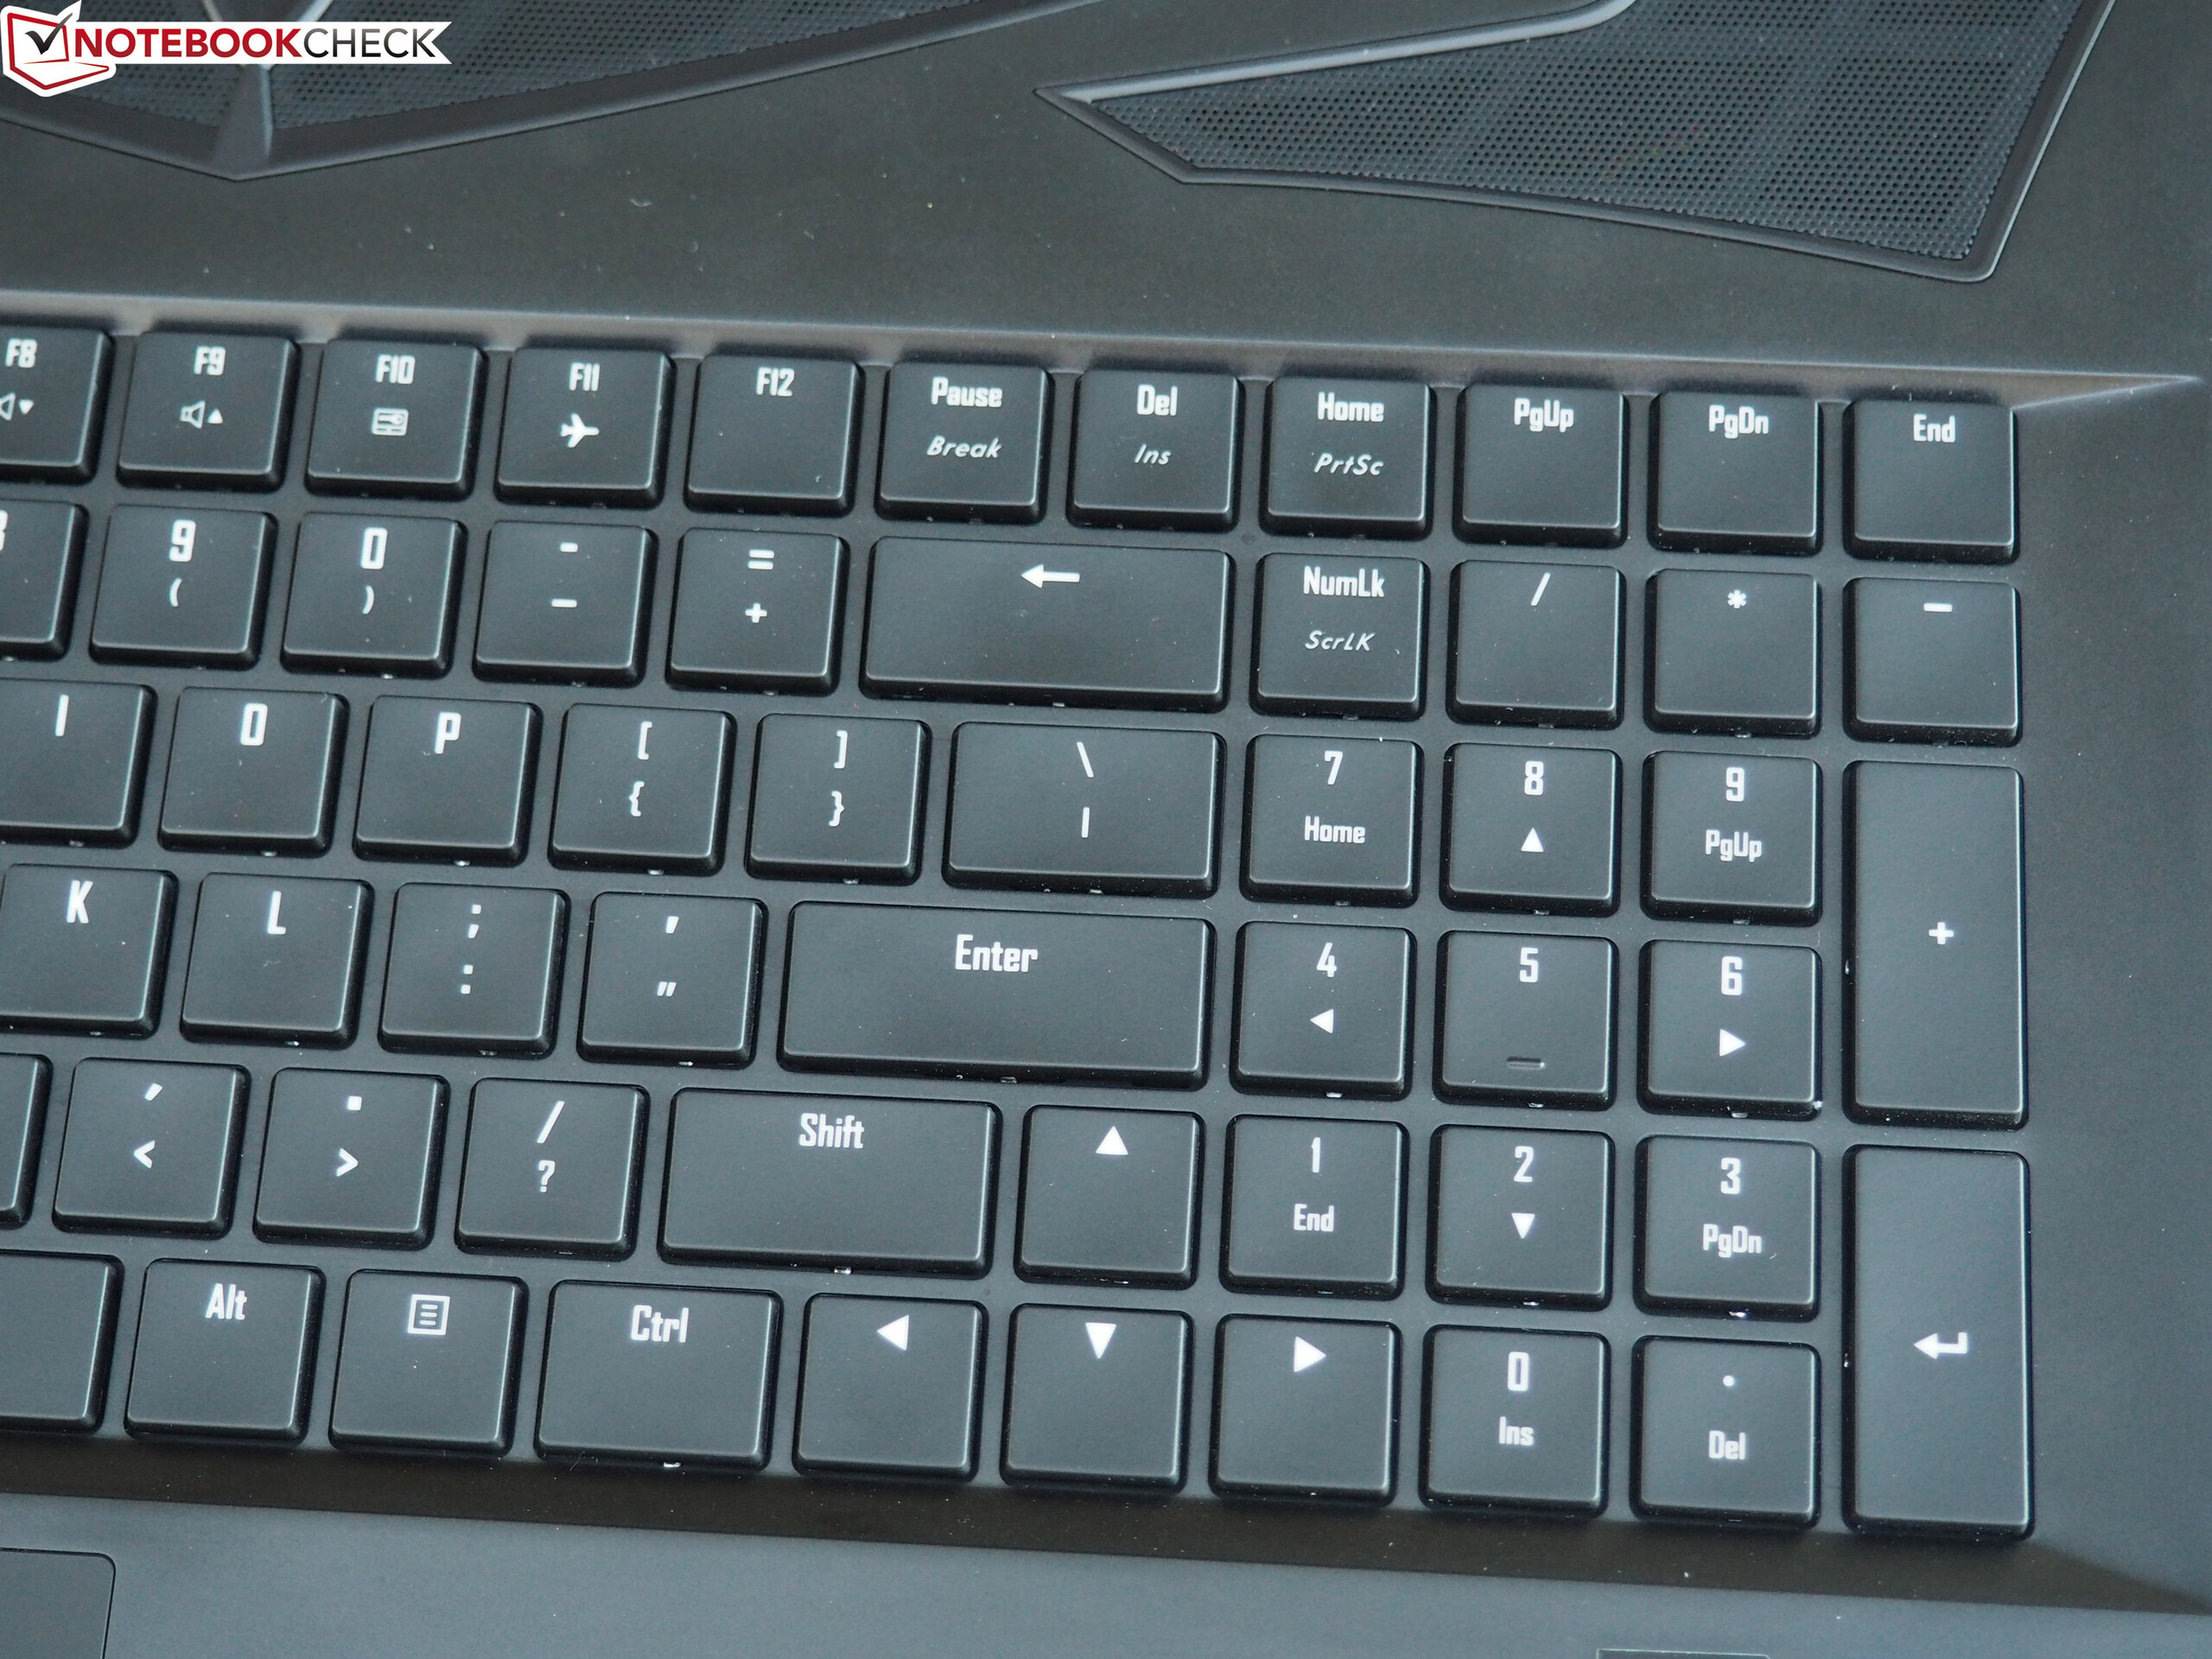
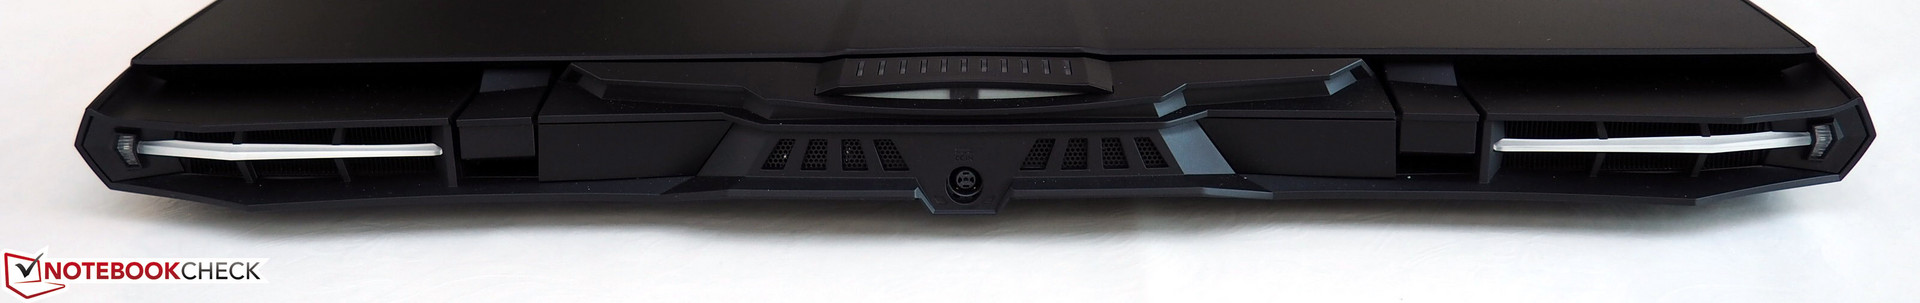
Embora o X9 esteja equipado com duas unidades gráficas, a Gigabyte apresentou um portátil de jogos muito fino e, considerando seu desempenho, muito leve, que pode impressionar com sua carcaça metálica de alta qualidade, design brincalhão (queira ou não) e um teclado mecânico.
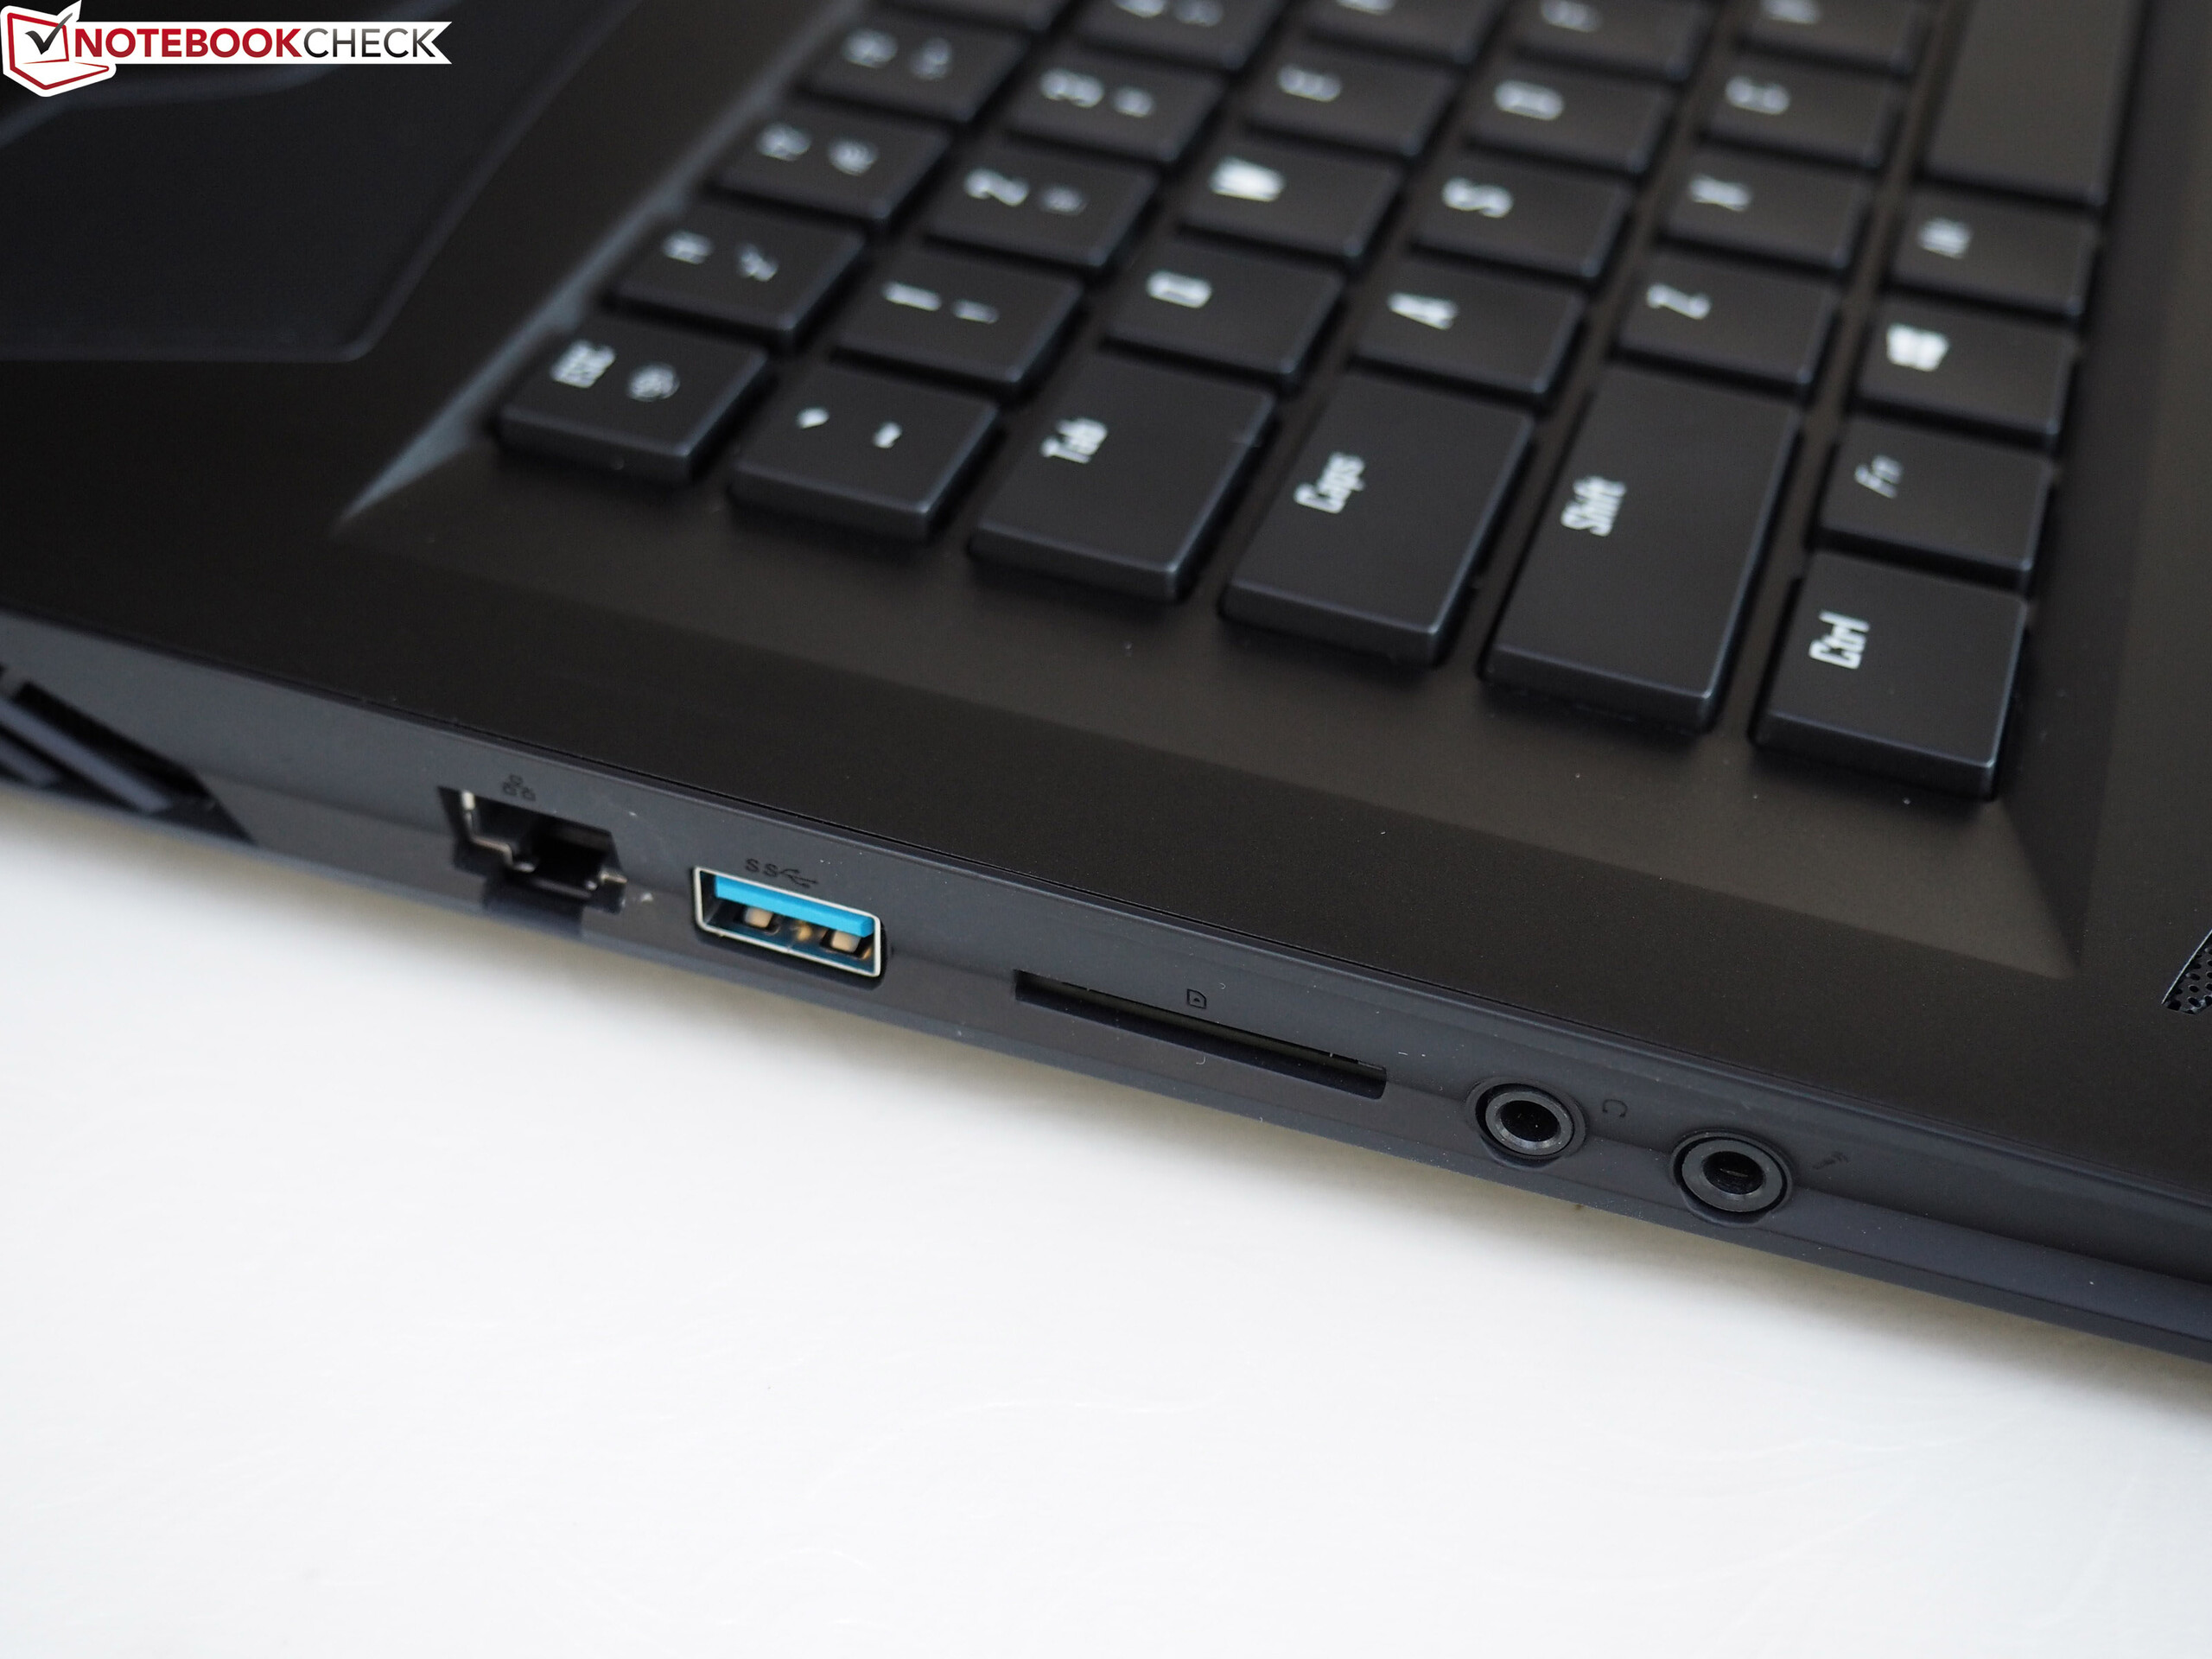
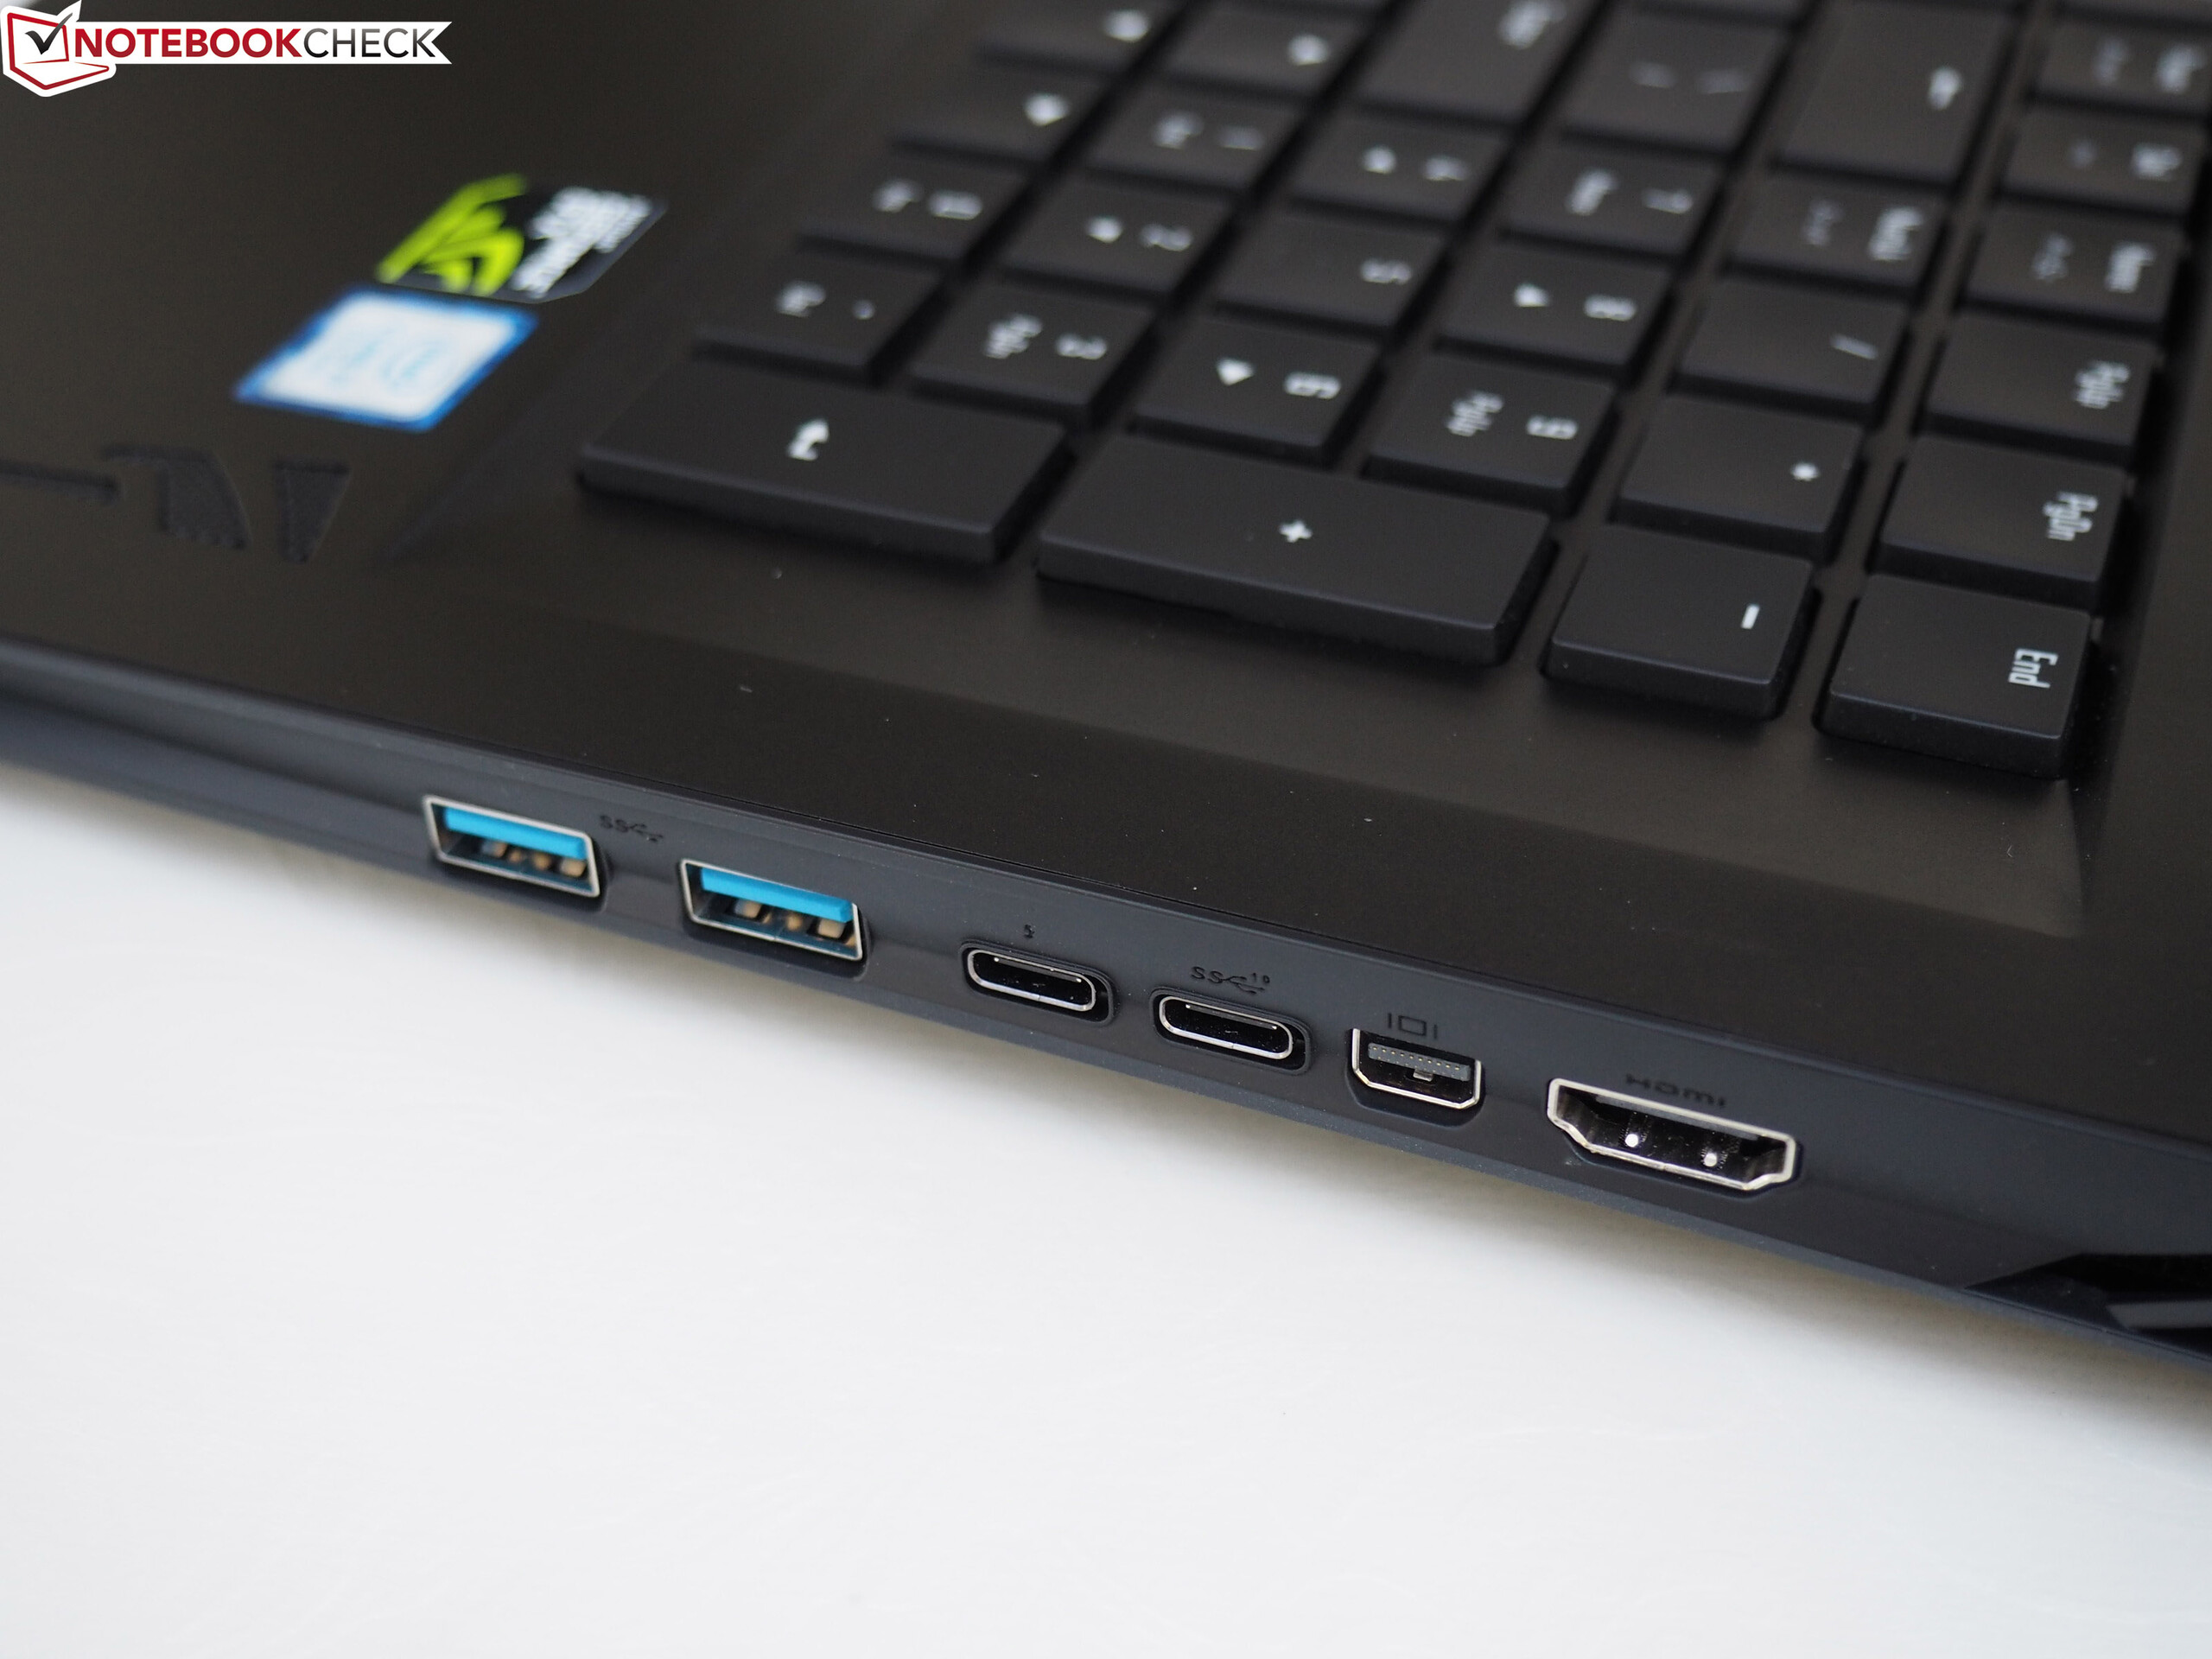
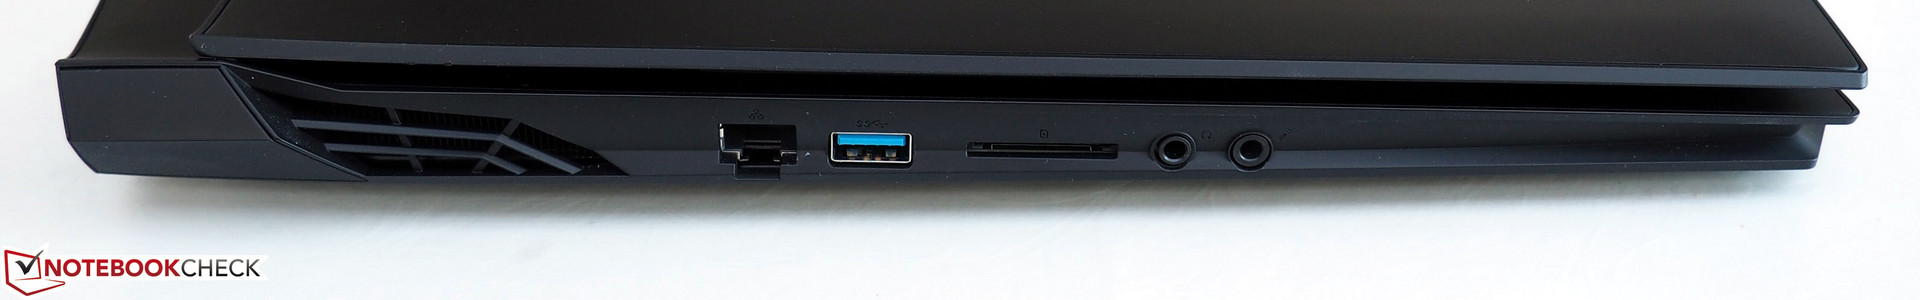
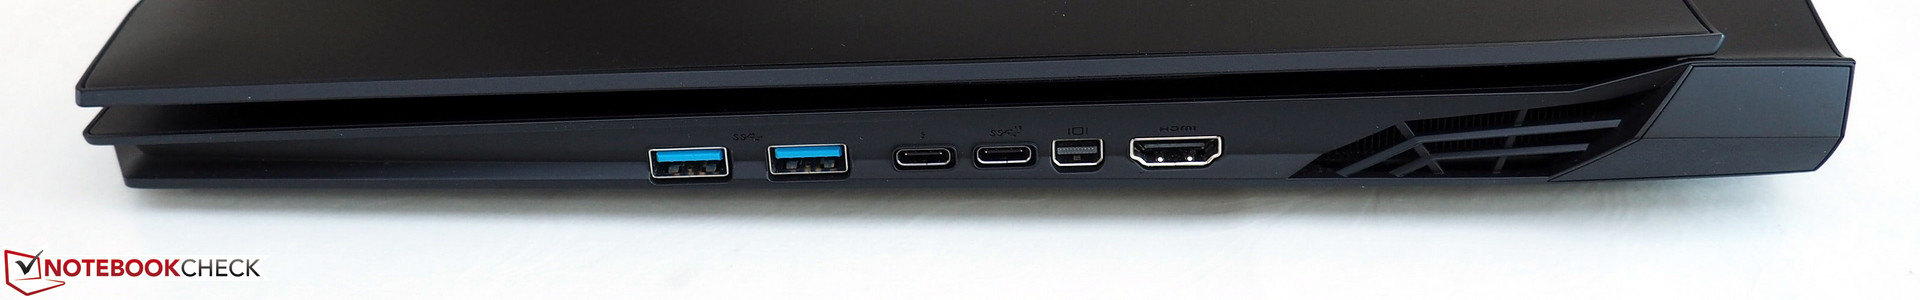
O último é uma notícia particularmente boa e separa o aparelho de 17 polegadas de muitos outros portáteis de gama alta. Também possui boa conectividade que pode acompanhar a concorrência. Por exemplo, o X9 está equipado com uma moderna porta Thunderbolt 3.
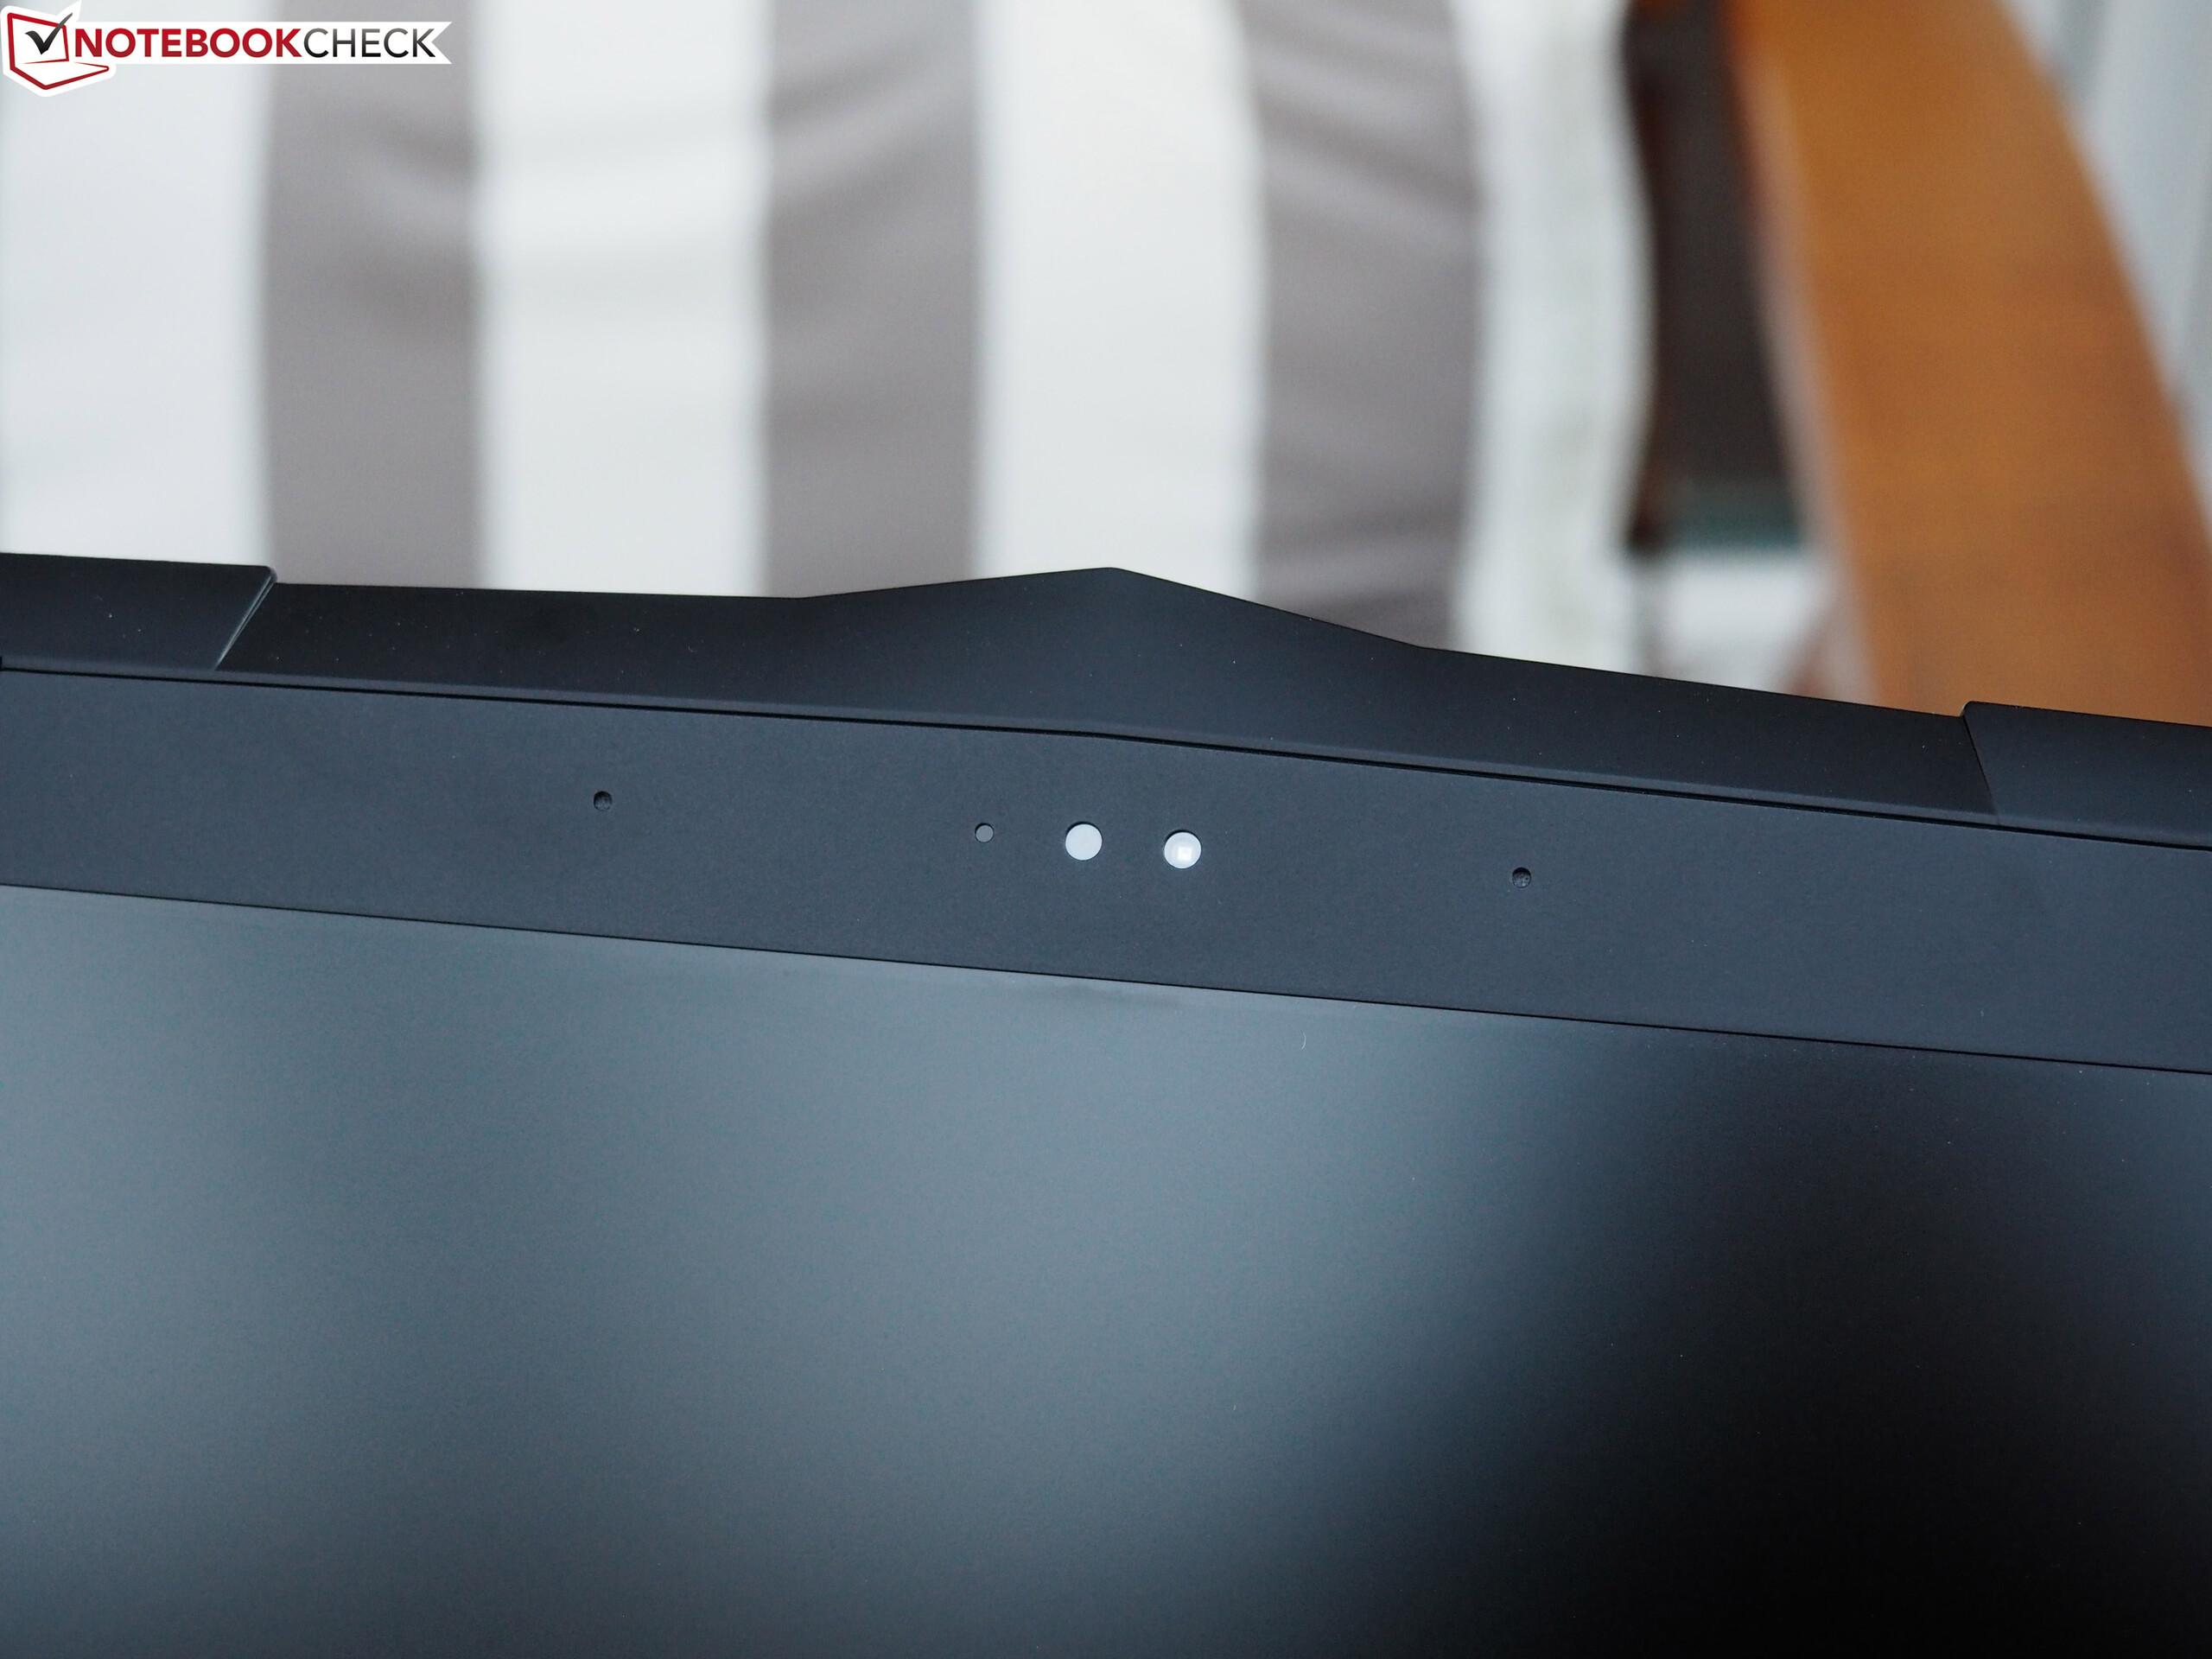
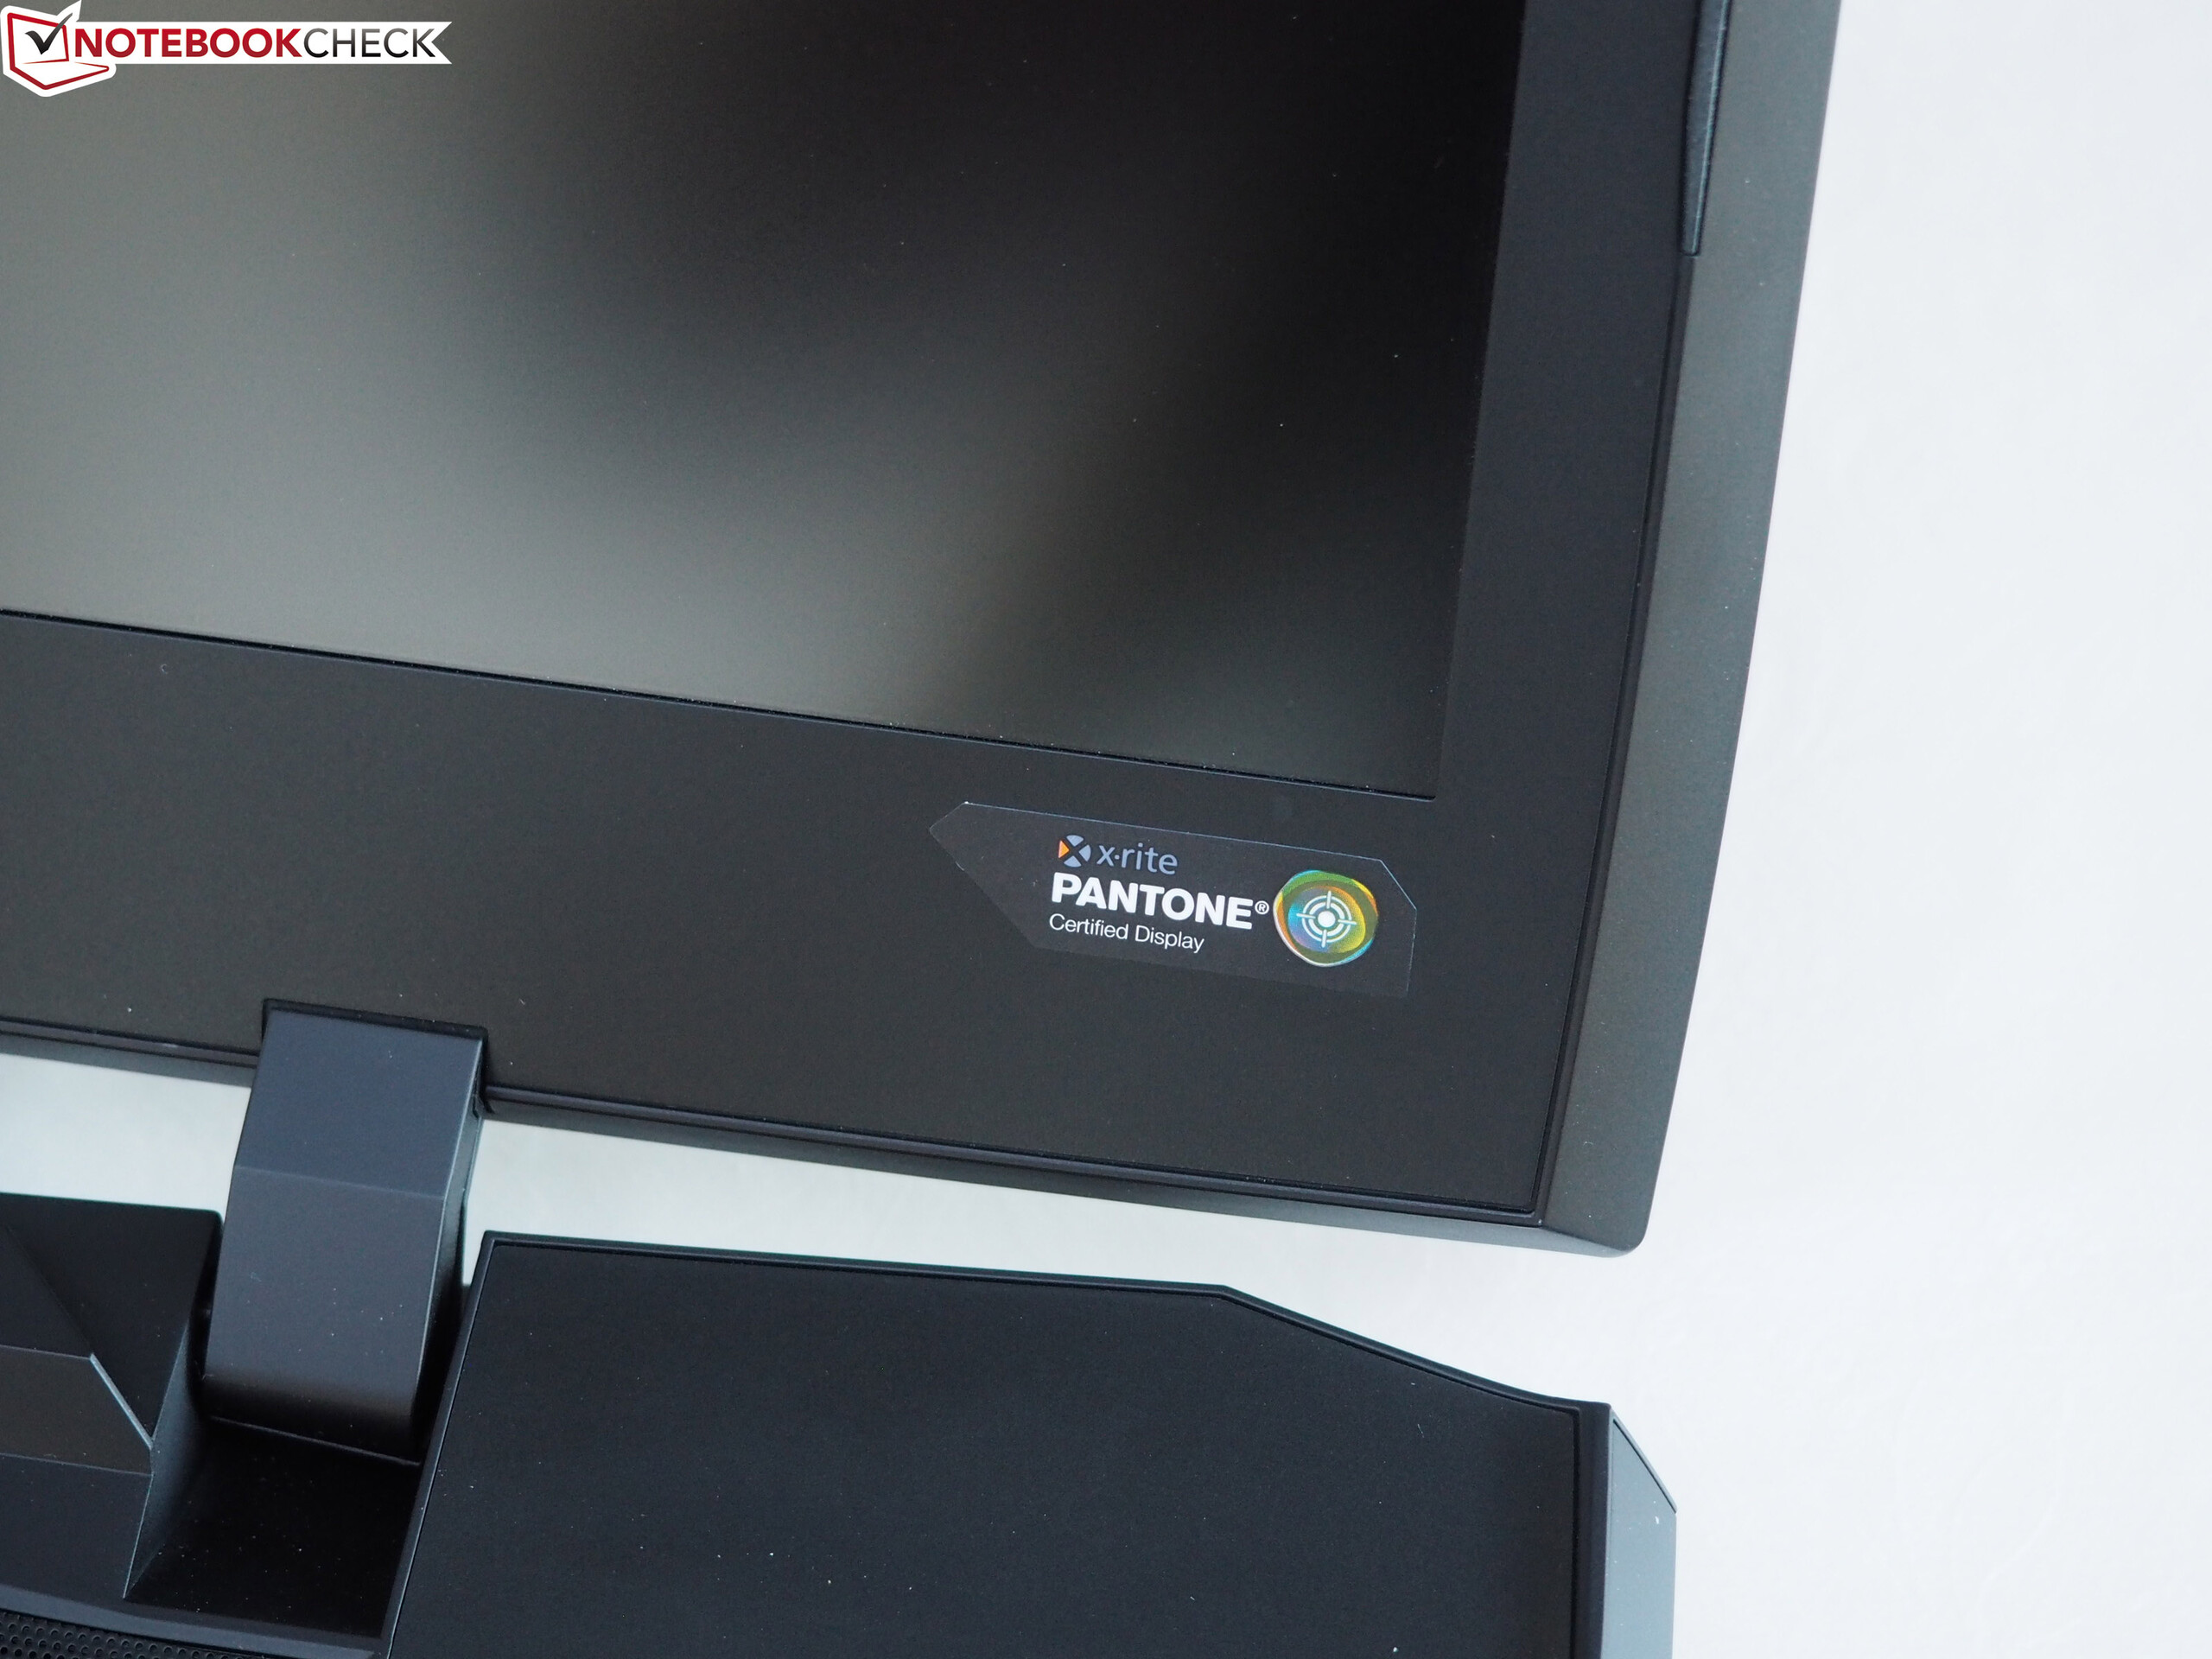
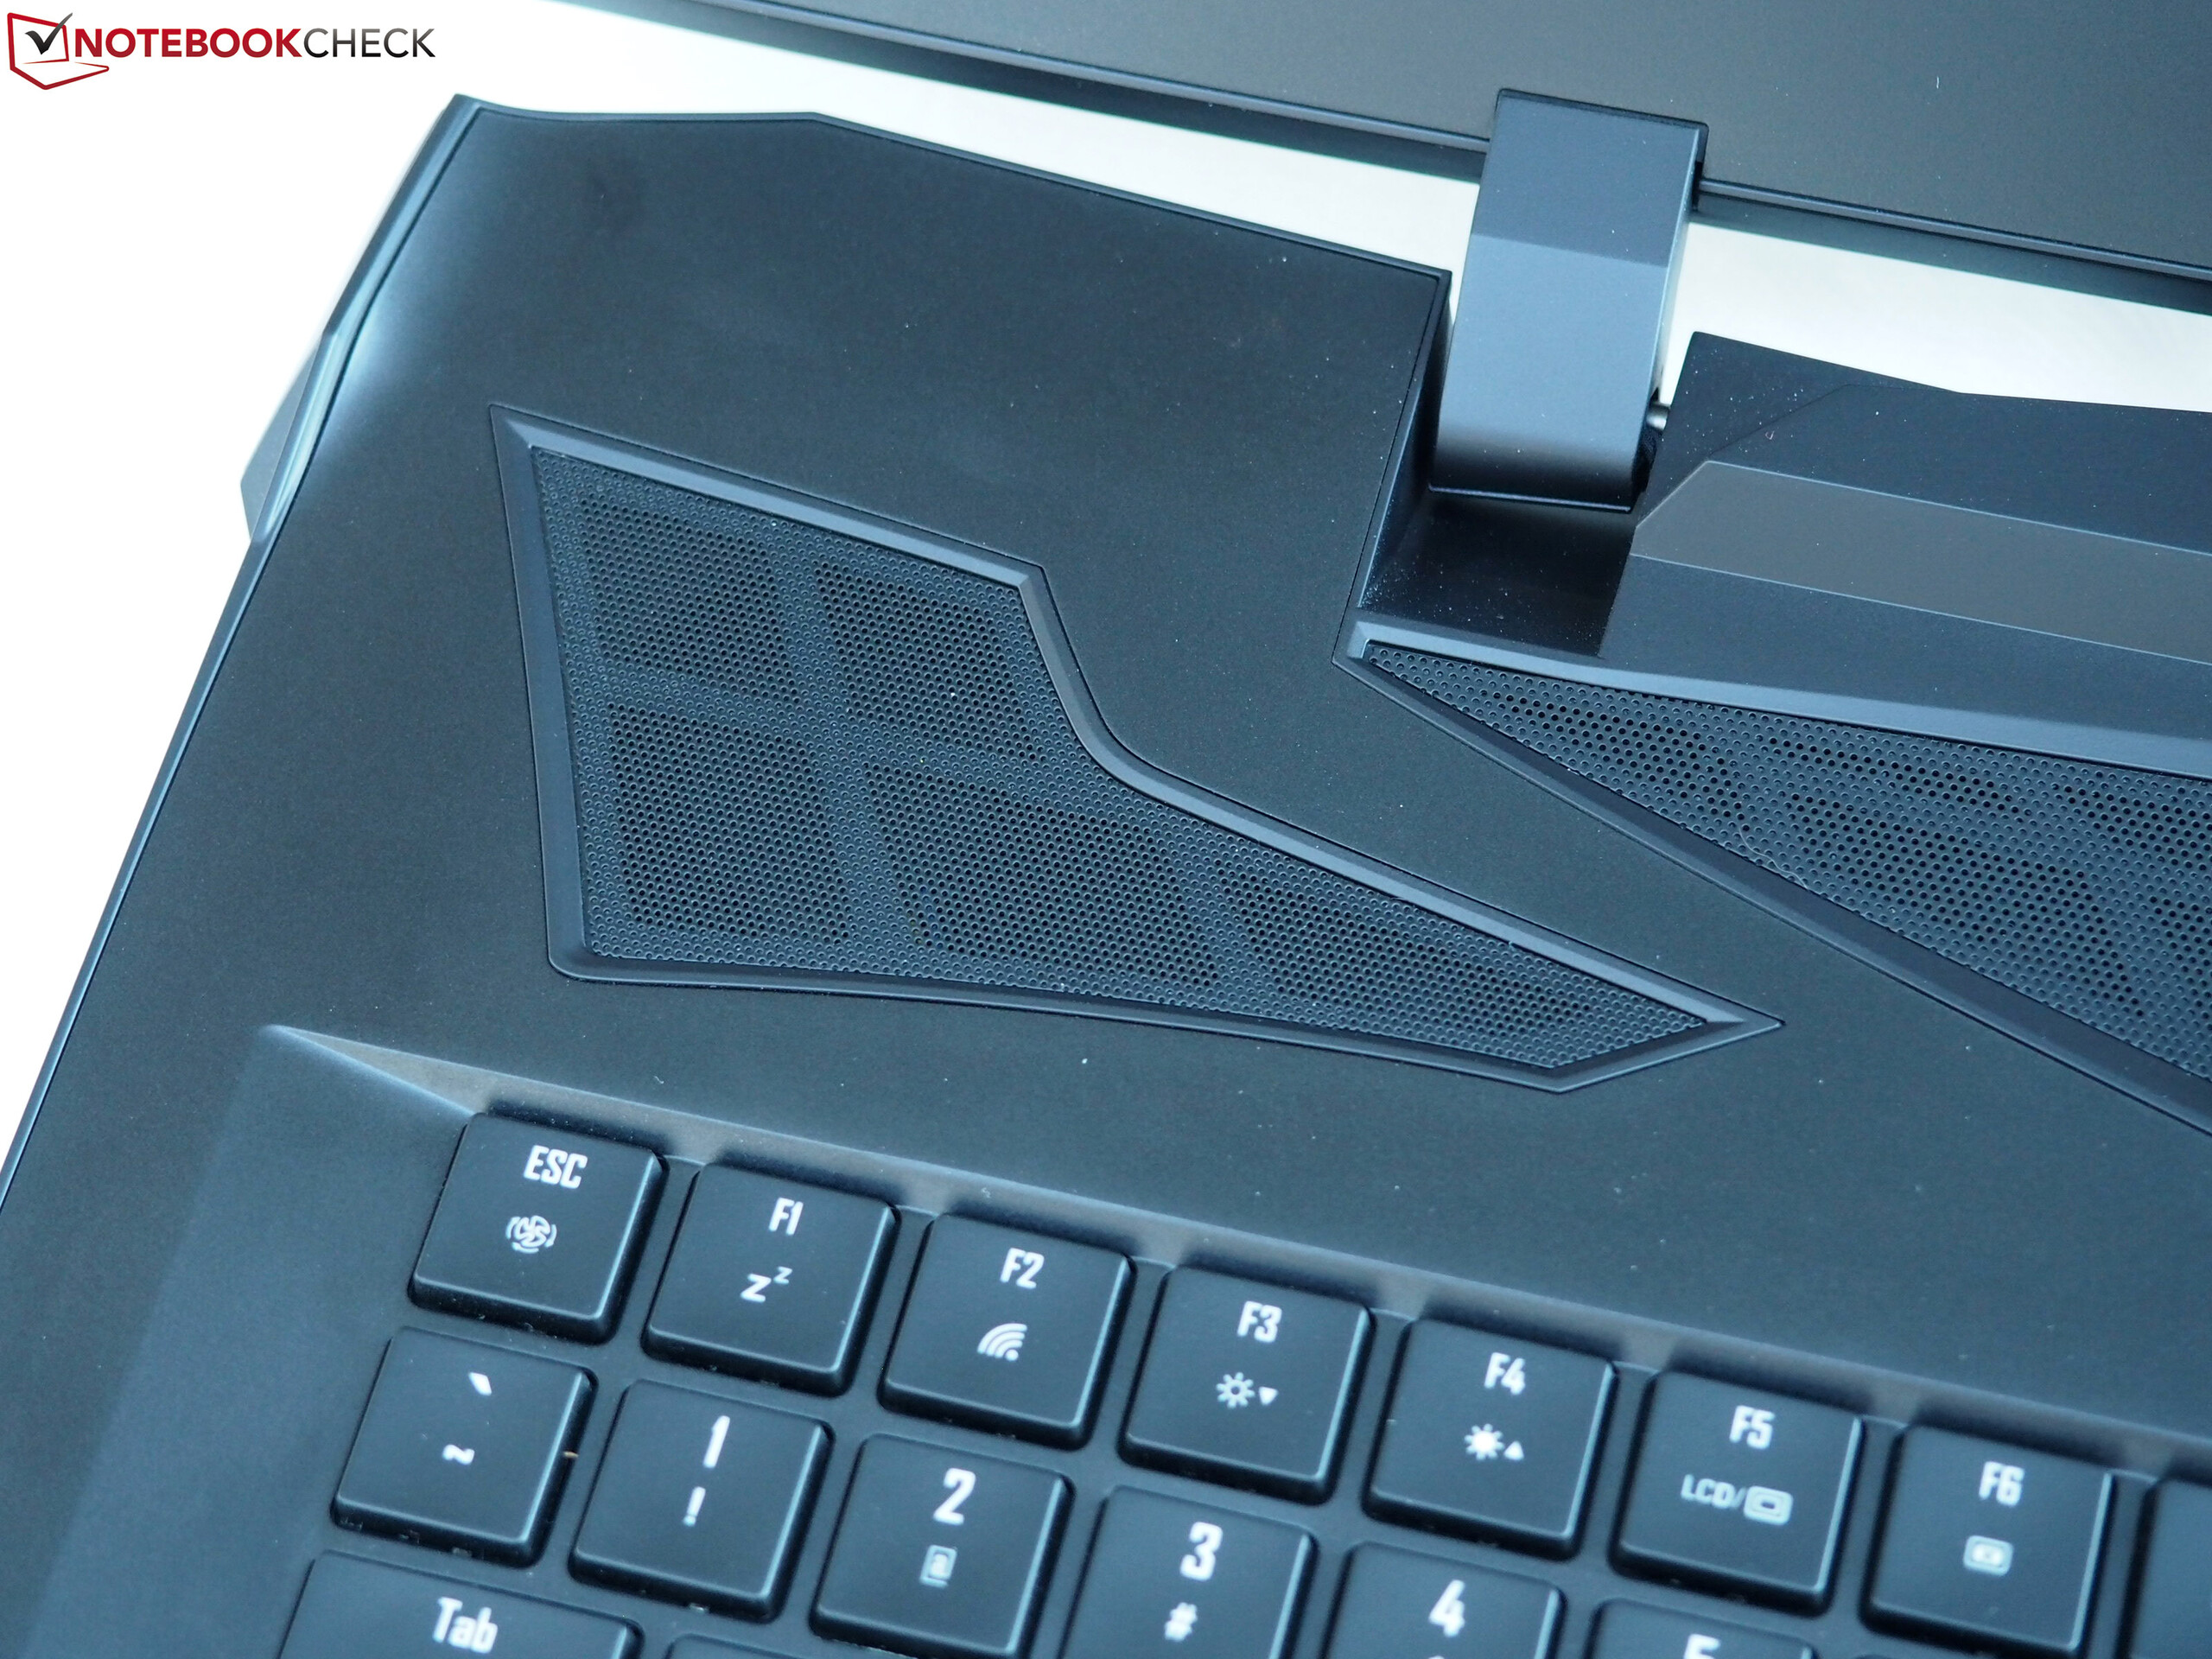
Ficamos menos felizes com a tela QHD, que suporta 120 Hz, tem tempos de resposta curtos e conta com a certificação X-Rite Pantone, mas também tem uma relação de contraste e valor preto fracos, e ângulos de visão instáveis. Também ficamos decepcionados com o tempo de duração da bateria e o ruído do sistema. O aparelho de 17 polegadas simplesmente se torna muito barulhento com aplicativos 3D para nosso gosto. O bom sistema de som não consegue compensar completamente esses problemas.
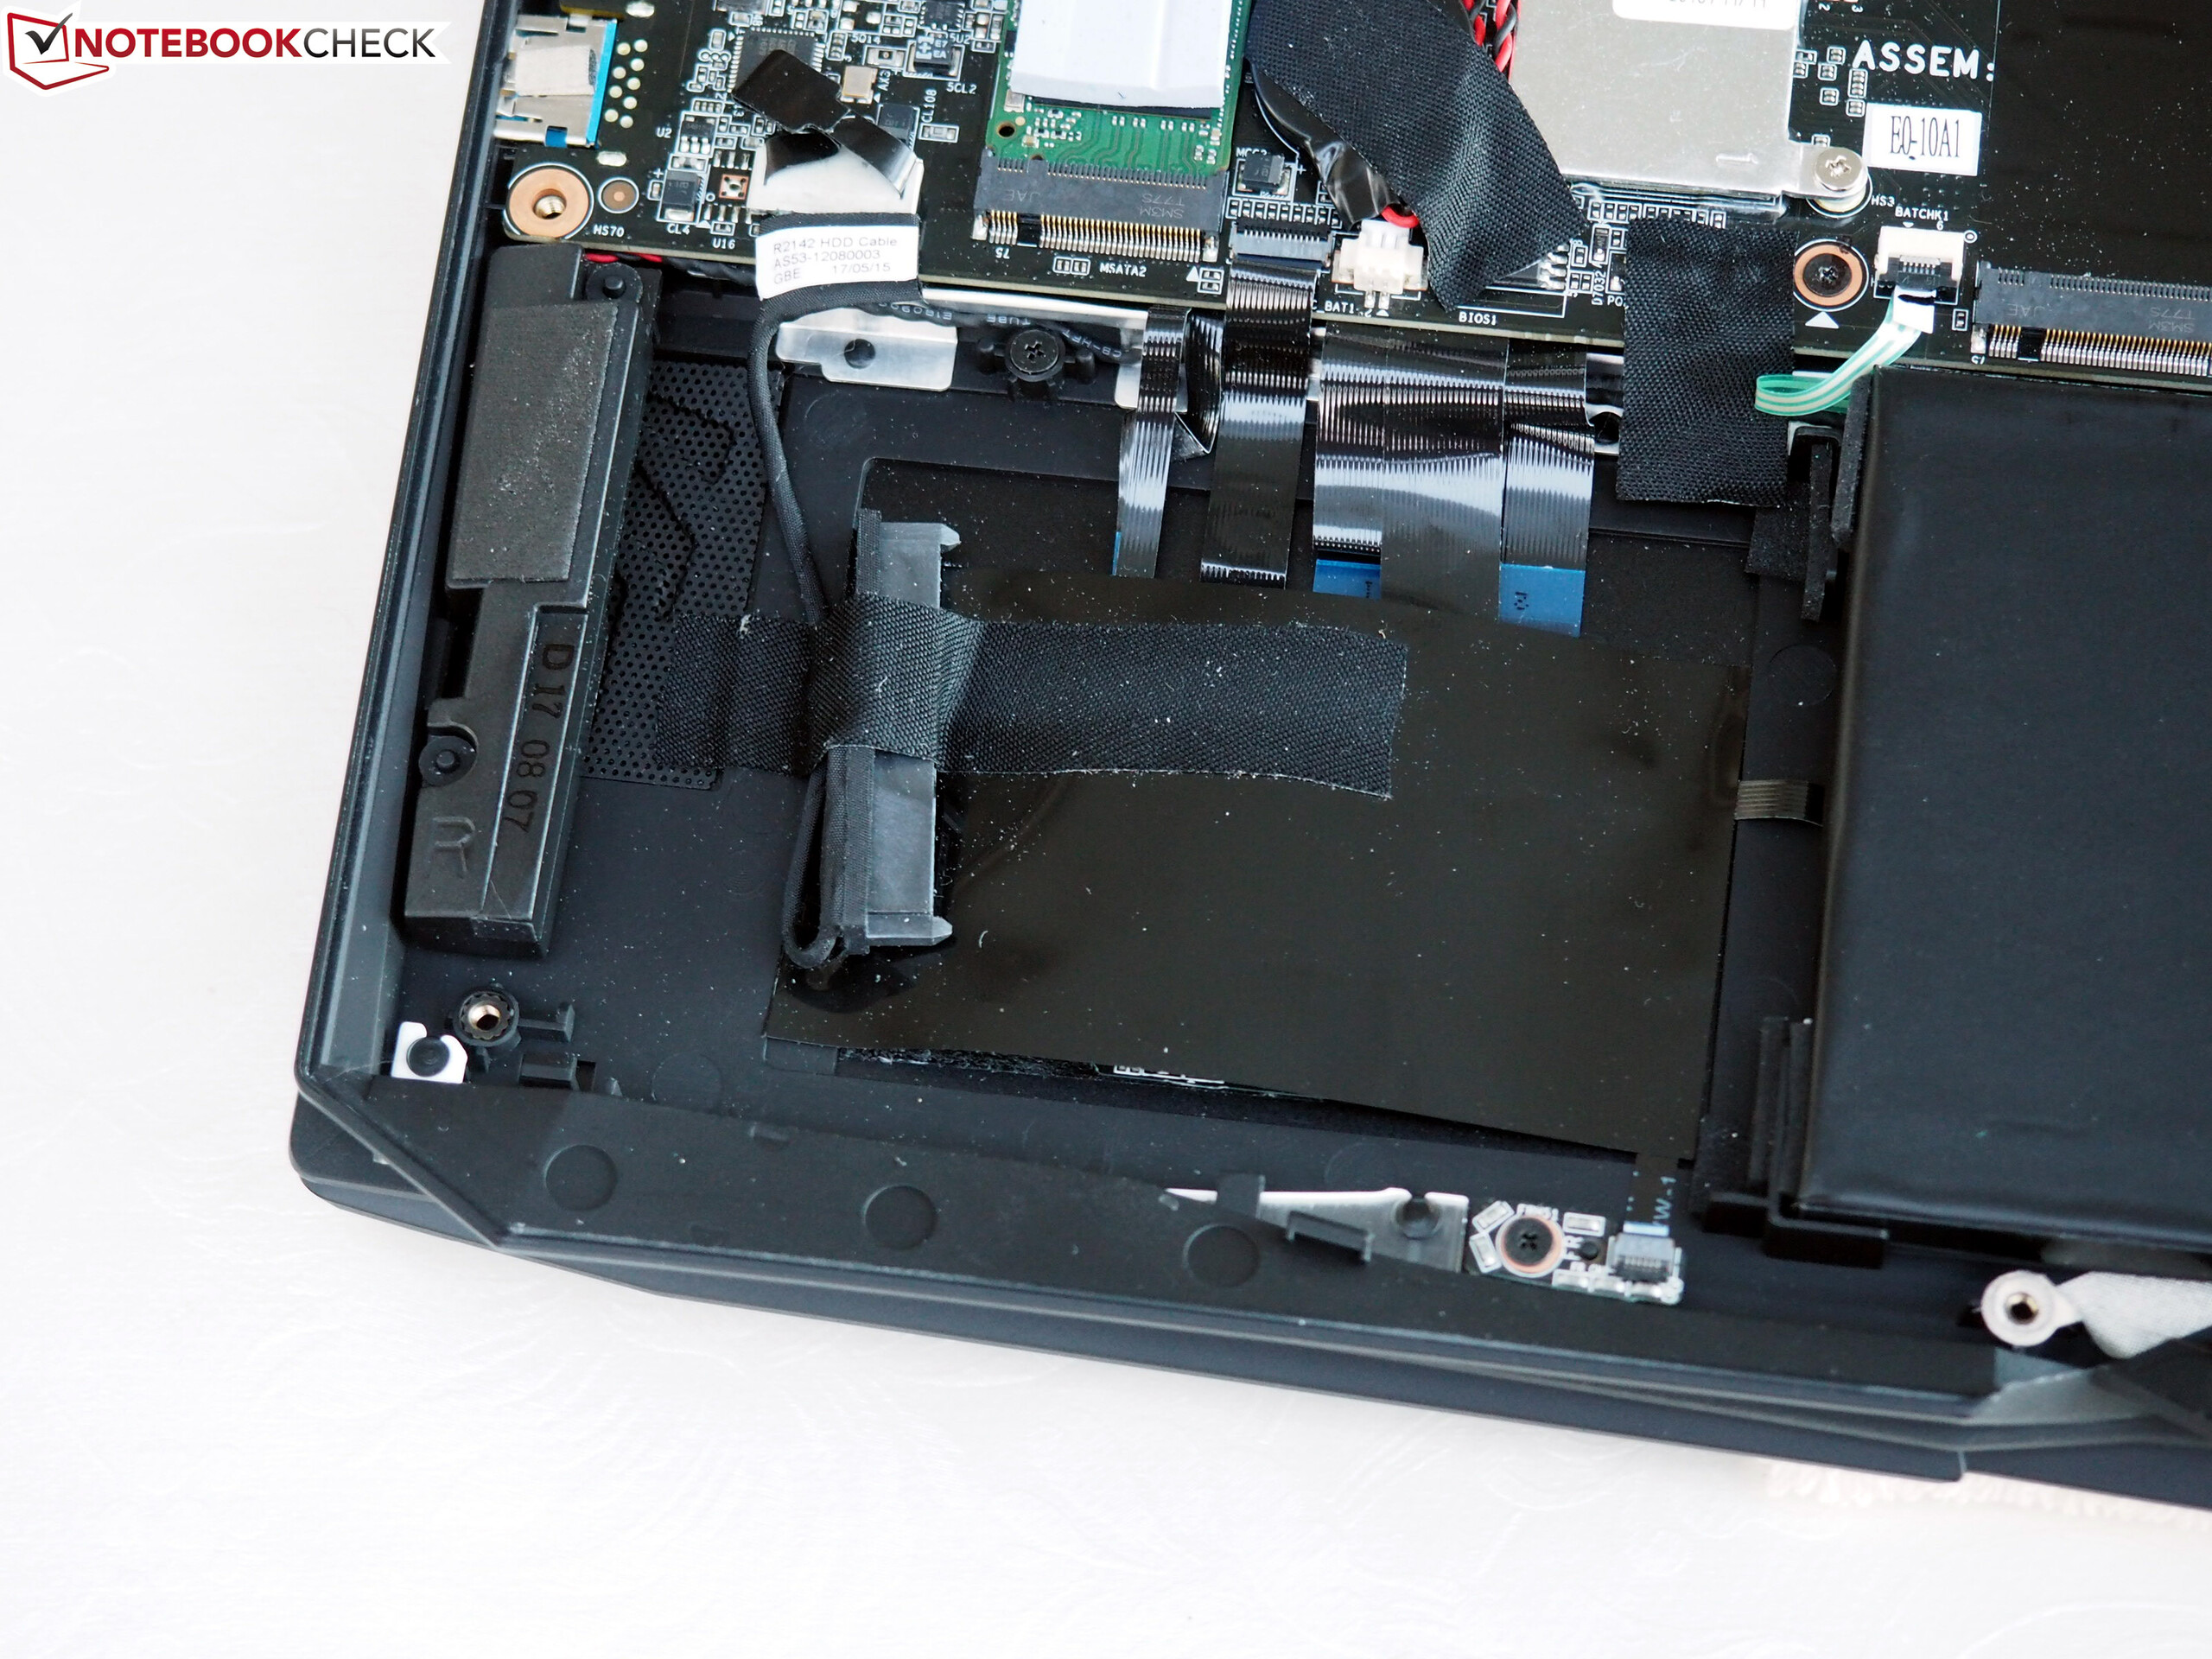
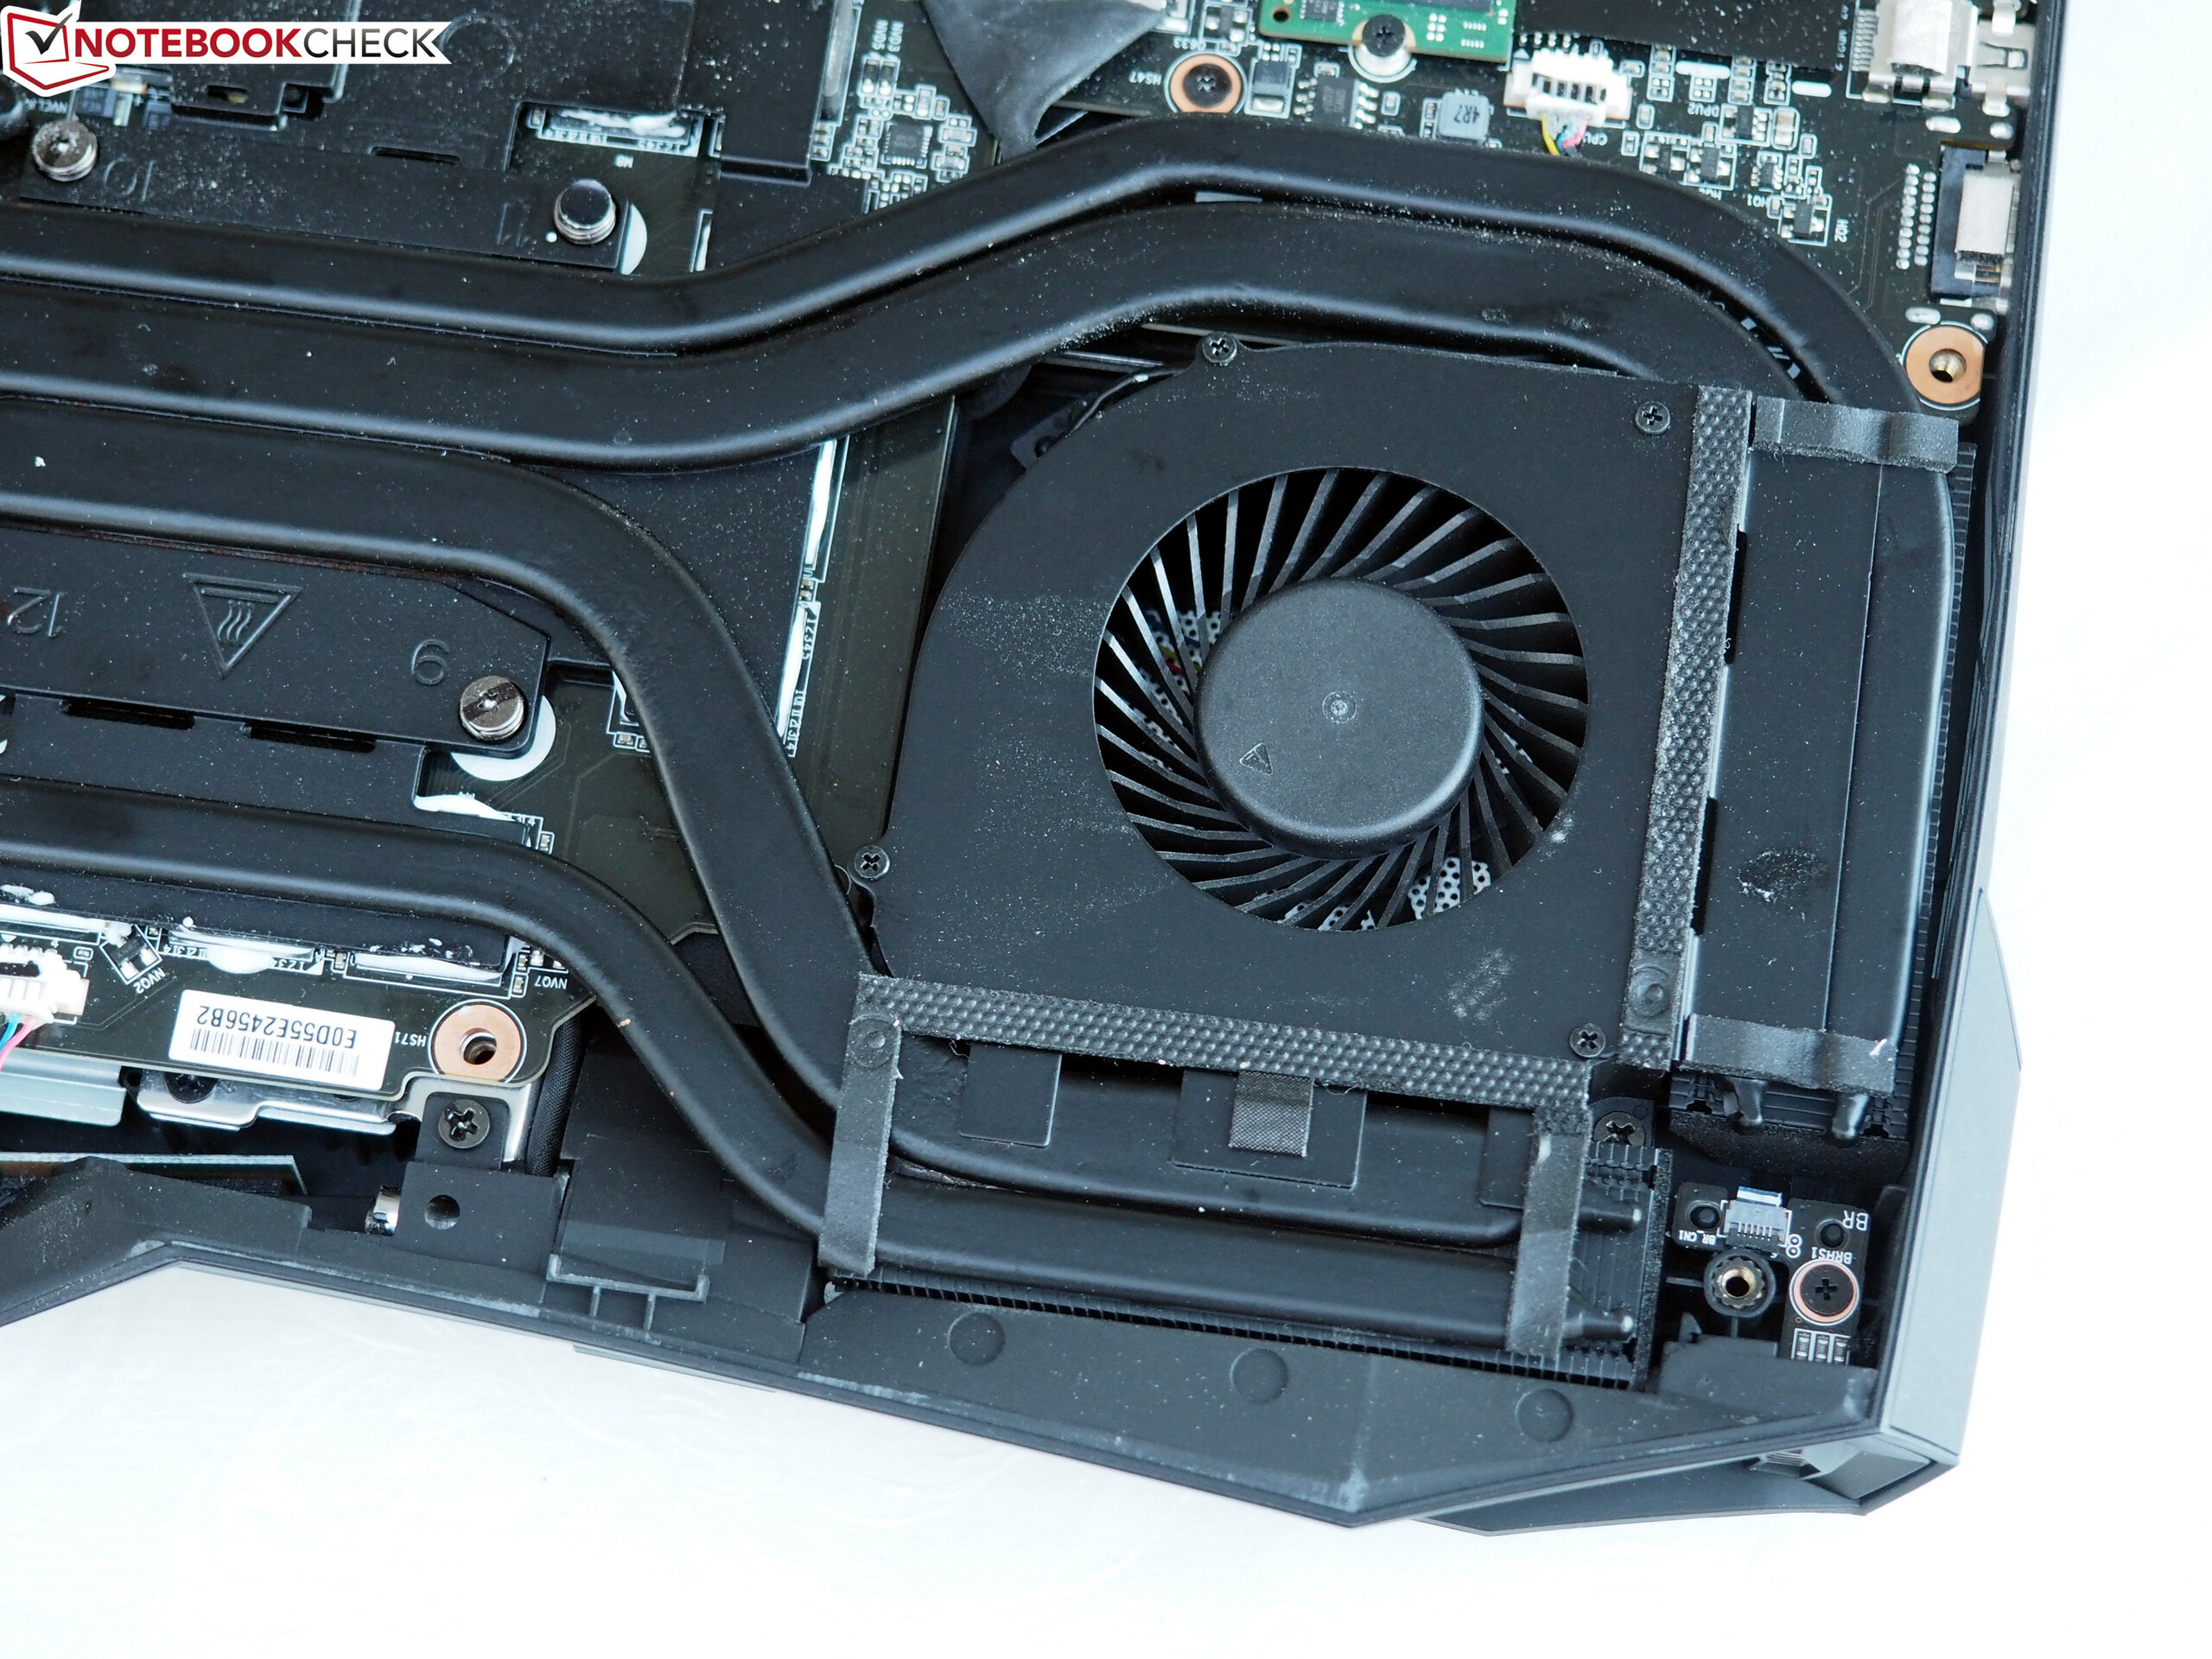
Escolher usar a tecnologia SLI criou vantagens e dificuldades adicionais. Por um lado, o Aorus X9 pode oferecer desempenho superior em programas compatíveis com Dual-GPU, que inclusive coloca portáteis com a GTX 1080 em ridículo. Por outro lado, a segunda GPU - surpresa, surpresa - tem um impacto negativo no resfriamento (temperatura, ruído do sistema, ...), consumo de energia e mobilidade - além do fato de que nem todos os jogos atuais ainda suportam SLI, tornando a segunda GTX 1070 supérflua nesses casos.
Com a alta dependência de controladores e a tendência para as micro intermitências, os sistemas com duas GPUs são feitos para entusiastas reais mais que para jogadores médio. Se você quiser simplesmente ligar o aparelho e jogar, sem ter que se preocupar com as atualizações constantes do controlador esperando ainda um bom desempenho para resoluções acima de 1920x1080, você deve optar por um portátil com uma só GPU (com uma GeForce GTX 1070 ou GTX 1080) . No geral, o Aorus X9 não é suficientemente bom para entrar nos rankings do nosso Top 10 Gamers.
Aorus X9
- 04/14/2018 v6 (old)
Florian Glaser
Price comparison