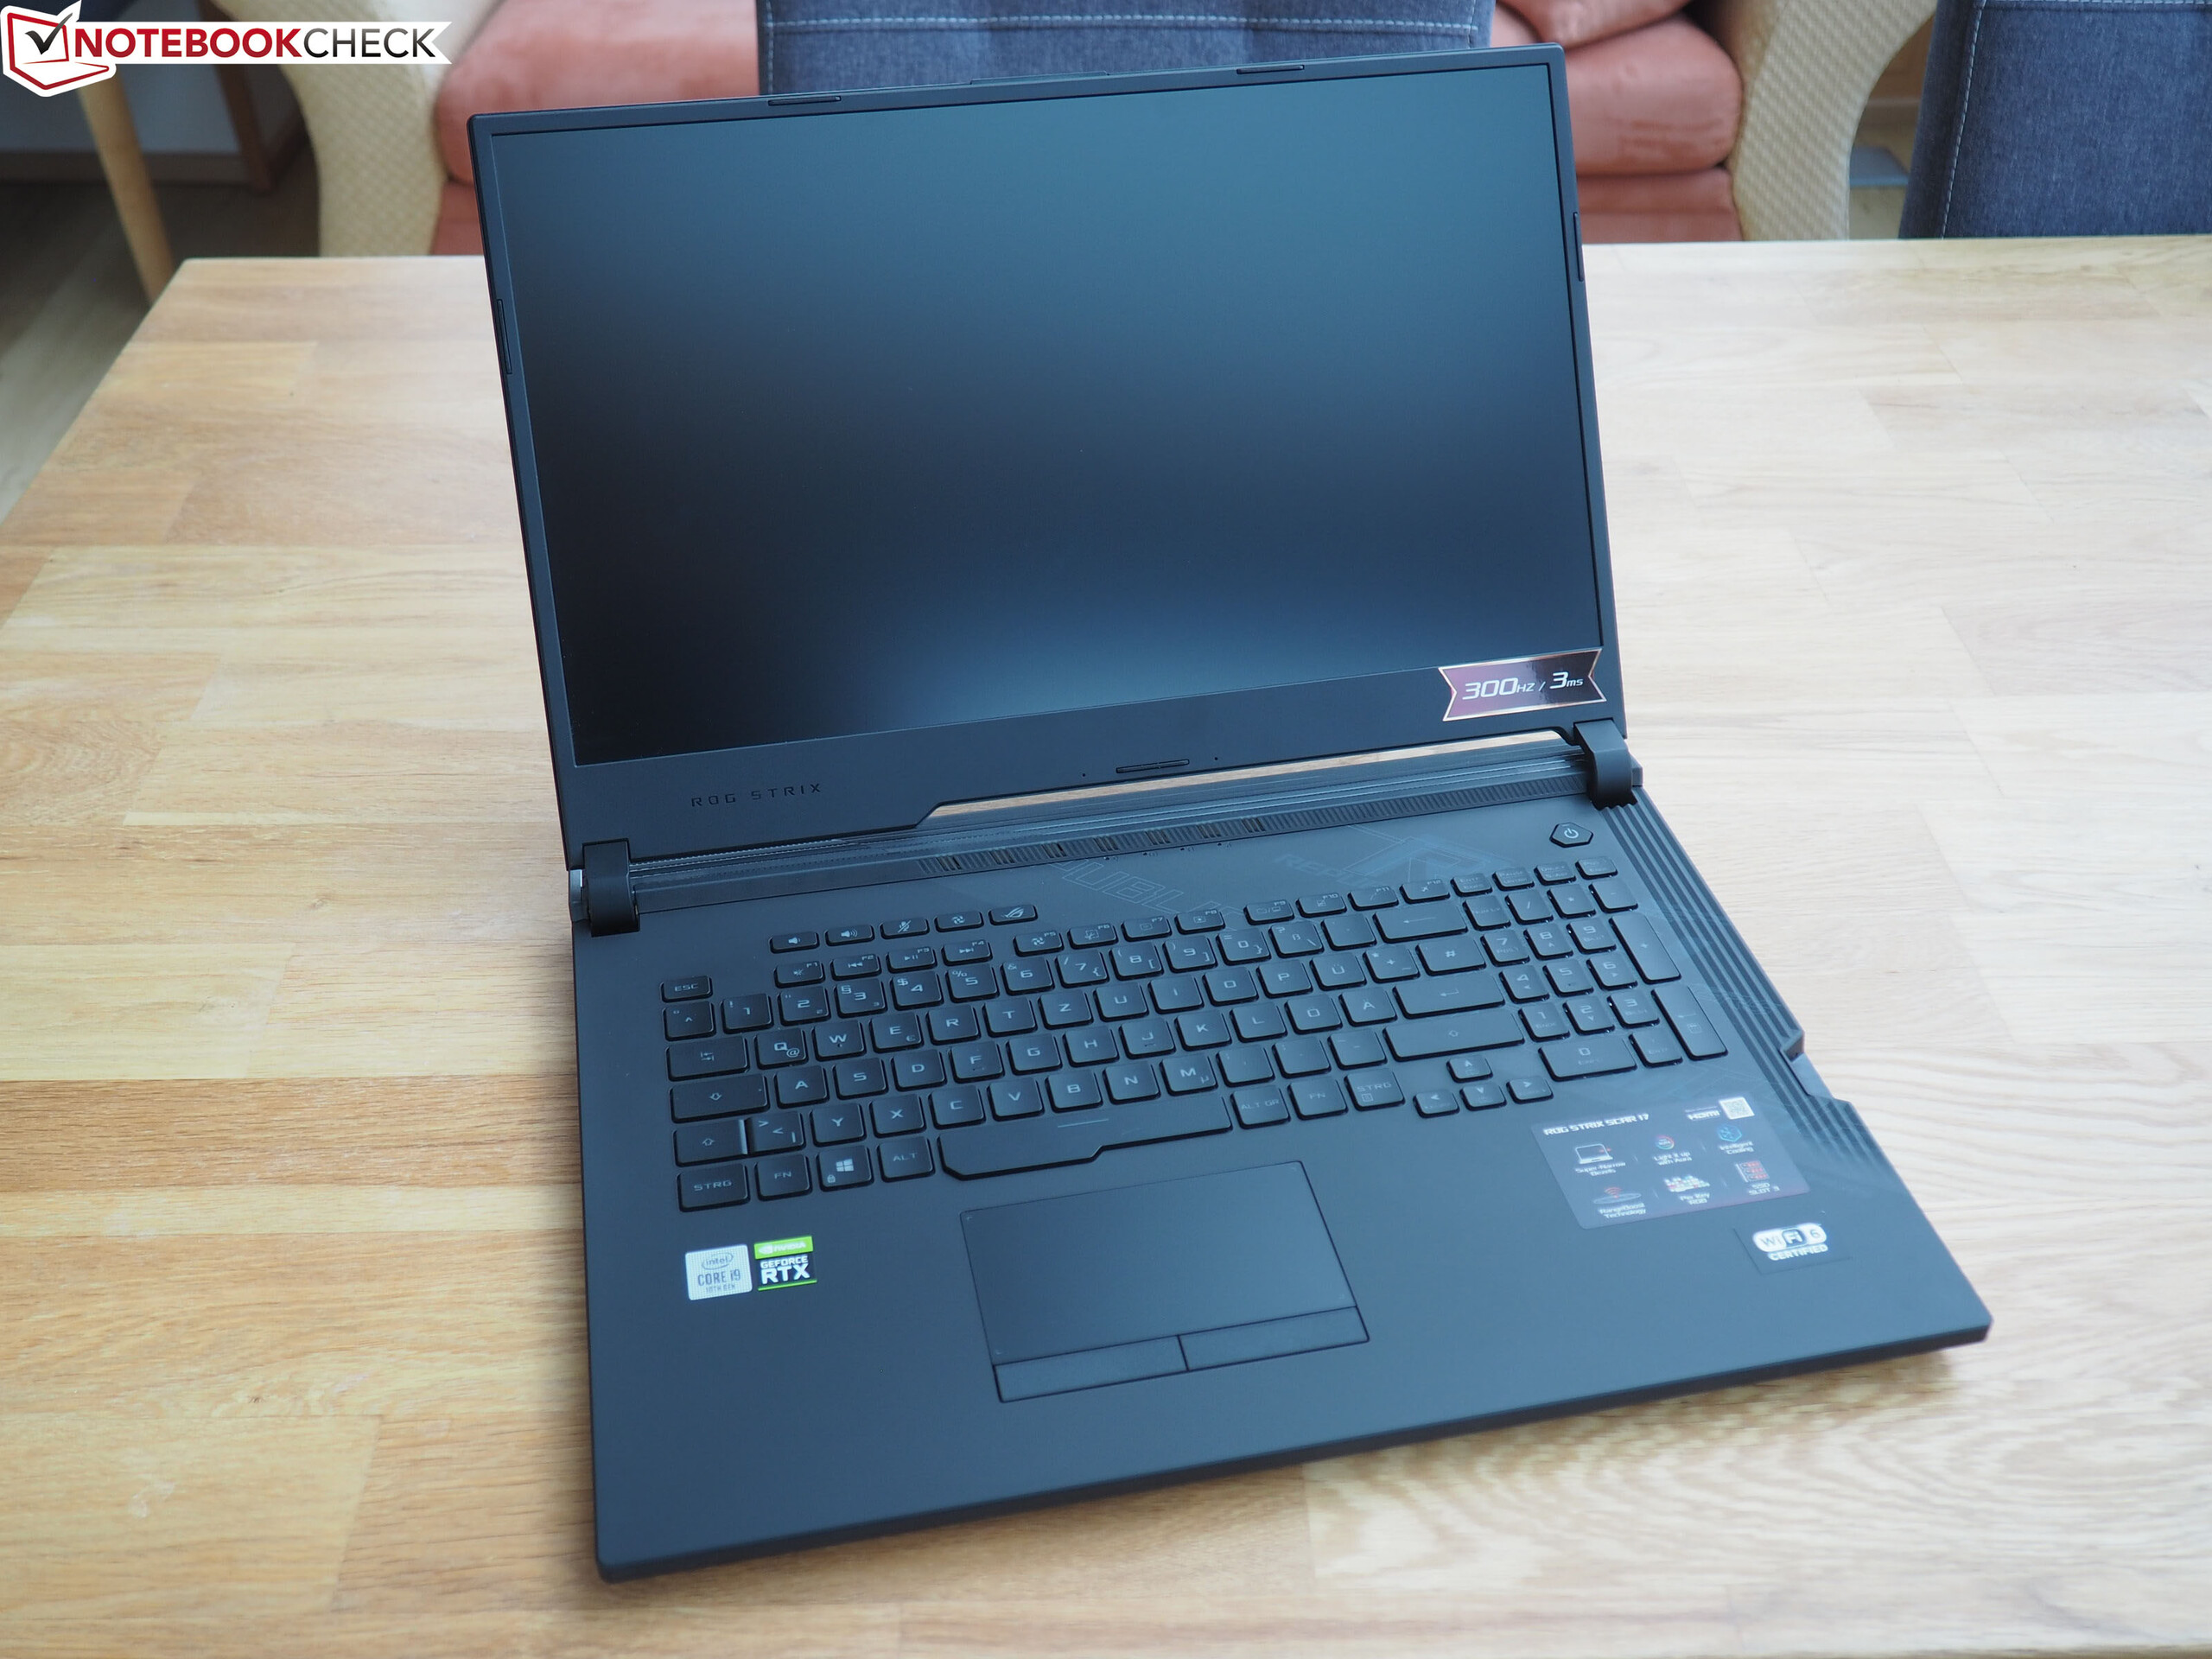
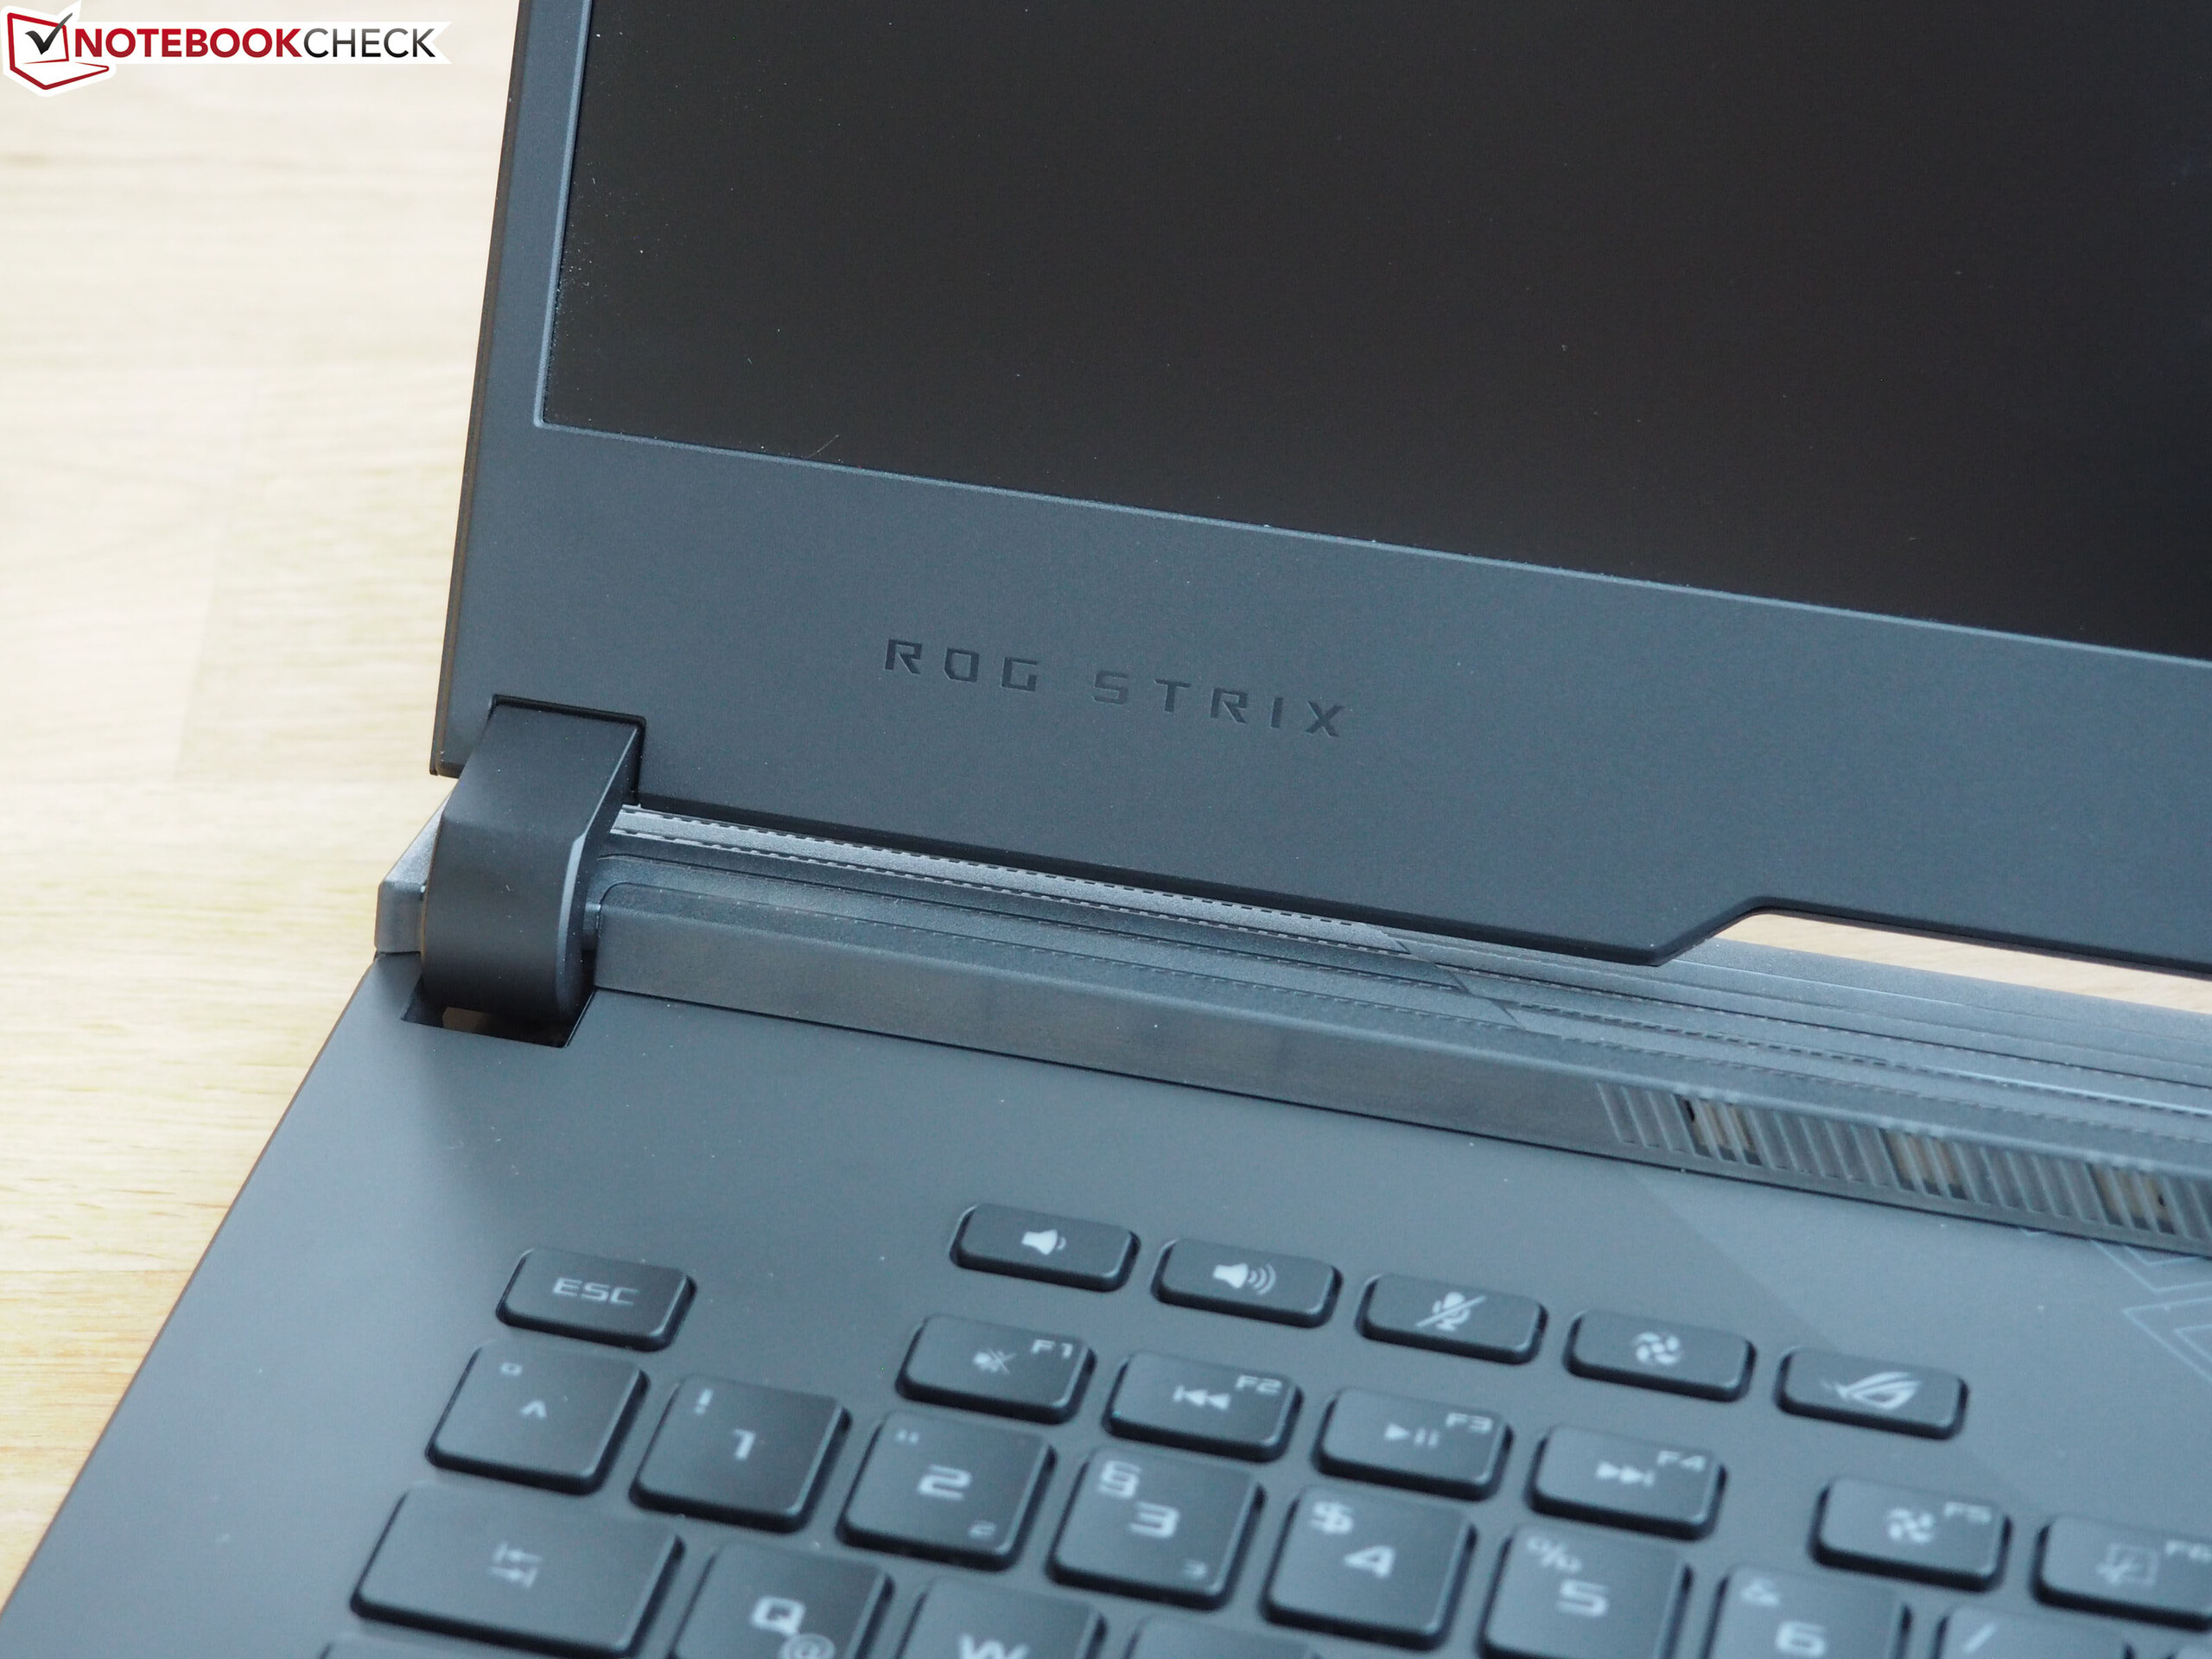
Breve Análise do Portátil Asus ROG Strix Scar 17 G732LXS: Corre no limite
Avaliação | Data | Modelo | Peso | Altura | Size | Resolução | Preço |
|---|---|---|---|---|---|---|---|
| 82.7 % v7 (old) | 07/2020 | Asus Strix Scar 17 G732LXS i9-10980HK, GeForce RTX 2080 Super Mobile | 2.9 kg | 26.5 mm | 17.30" | 1920x1080 | |
| 86.1 % v7 (old) | 05/2019 | MSI GE75 9SG i9-9880H, GeForce RTX 2080 Mobile | 2.7 kg | 27.5 mm | 17.30" | 1920x1080 | |
| 85.1 % v7 (old) | 08/2019 | HP Omen 17-cb0020ng i9-9880H, GeForce RTX 2080 Mobile | 3.3 kg | 27 mm | 17.30" | 1920x1080 | |
| 85.4 % v7 (old) | 07/2019 | Asus ASUS ROG Strix SCAR III G731GW-XB74 i7-9750H, GeForce RTX 2070 Mobile | 2.9 kg | 26.2 mm | 17.30" | 1920x1080 | |
| 87.4 % v6 (old) | 07/2019 | Eurocom Nightsky RX17 i7-9750H, GeForce RTX 2070 Mobile | 2.9 kg | 29.9 mm | 17.30" | 1920x1080 |
| |||||||||||||||||||||||||
iluminação: 82 %
iluminação com acumulador: 310 cd/m²
Contraste: 756:1 (Preto: 0.41 cd/m²)
ΔE ColorChecker Calman: 2.41 | ∀{0.5-29.43 Ø4.71}
calibrated: 1.13
ΔE Greyscale Calman: 4.3 | ∀{0.09-98 Ø4.96}
94% sRGB (Argyll 1.6.3 3D)
72% AdobeRGB 1998 (Argyll 1.6.3 3D)
71.6% AdobeRGB 1998 (Argyll 3D)
99% sRGB (Argyll 3D)
71% Display P3 (Argyll 3D)
Gamma: 2.149
CCT: 7059 K
| Asus Strix Scar 17 G732LXS LQ173M1JW03 (SHP14DC), IPS, 1920x1080 | MSI GE75 9SG Chi Mei N173HCE-G33, AHVA, 1920x1080 | HP Omen 17-cb0020ng CMN175D, IPS, 1920x1080 | Asus ASUS ROG Strix SCAR III G731GW-XB74 AU Optronics AUO409D, IPS, 1920x1080 | Eurocom Nightsky RX17 BOE NV173FHM-N44, IPS, 1920x1080 | |
|---|---|---|---|---|---|
| Display | -10% | -7% | -13% | -6% | |
| Display P3 Coverage (%) | 71 | 61.5 -13% | 63.7 -10% | 61.9 -13% | 66.1 -7% |
| sRGB Coverage (%) | 99 | 92 -7% | 96 -3% | 86.3 -13% | 93.1 -6% |
| AdobeRGB 1998 Coverage (%) | 71.6 | 63.5 -11% | 65.8 -8% | 62.9 -12% | 67.2 -6% |
| Response Times | -2% | -118% | -31% | -104% | |
| Response Time Grey 50% / Grey 80% * (ms) | 5.8 ? | 7.2 ? -24% | 17.6 ? -203% | 7.2 ? -24% | 16.4 ? -183% |
| Response Time Black / White * (ms) | 8.4 ? | 6.6 ? 21% | 11.2 ? -33% | 11.6 ? -38% | 10.4 ? -24% |
| PWM Frequency (Hz) | 26040 ? | 25510 ? | 990 ? | ||
| Screen | 24% | 26% | -26% | -9% | |
| Brightness middle (cd/m²) | 310 | 400.7 29% | 360 16% | 297.4 -4% | 298.4 -4% |
| Brightness (cd/m²) | 311 | 372 20% | 342 10% | 306 -2% | 287 -8% |
| Brightness Distribution (%) | 82 | 89 9% | 91 11% | 80 -2% | 90 10% |
| Black Level * (cd/m²) | 0.41 | 0.34 17% | 0.26 37% | 0.31 24% | 0.3 27% |
| Contrast (:1) | 756 | 1179 56% | 1385 83% | 959 27% | 995 32% |
| Colorchecker dE 2000 * | 2.41 | 1.33 45% | 1.91 21% | 4.08 -69% | 3.58 -49% |
| Colorchecker dE 2000 max. * | 8.59 | 3.51 59% | 4.08 53% | 6.88 20% | 6.29 27% |
| Colorchecker dE 2000 calibrated * | 1.13 | 1.39 -23% | 0.78 31% | 4 -254% | 2.82 -150% |
| Greyscale dE 2000 * | 4.3 | 1.3 70% | 2.72 37% | 4 7% | 3.1 28% |
| Gamma | 2.149 102% | 2.24 98% | 2.37 93% | 2.259 97% | 2.24 98% |
| CCT | 7059 92% | 6735 97% | 6692 97% | 7205 90% | 7064 92% |
| Color Space (Percent of AdobeRGB 1998) (%) | 72 | 58.2 -19% | 60 -17% | 56 -22% | 60.2 -16% |
| Color Space (Percent of sRGB) (%) | 94 | 92.1 -2% | 96 2% | 86 -9% | 92.7 -1% |
| Média Total (Programa/Configurações) | 4% /
14% | -33% /
2% | -23% /
-24% | -40% /
-21% |
* ... menor é melhor
Exibir tempos de resposta
| ↔ Tempo de resposta preto para branco | ||
|---|---|---|
| 8.4 ms ... ascensão ↗ e queda ↘ combinadas | ↗ 4.4 ms ascensão | 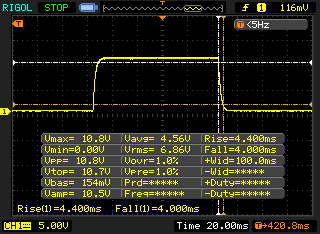 |
| ↘ 4 ms queda | ||
| A tela mostra taxas de resposta rápidas em nossos testes e deve ser adequada para jogos. Em comparação, todos os dispositivos testados variam de 0.1 (mínimo) a 240 (máximo) ms. » 24 % de todos os dispositivos são melhores. Isso significa que o tempo de resposta medido é melhor que a média de todos os dispositivos testados (19.8 ms). | ||
| ↔ Tempo de resposta 50% cinza a 80% cinza | ||
| 5.8 ms ... ascensão ↗ e queda ↘ combinadas | ↗ 2.4 ms ascensão | 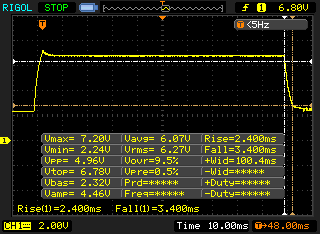 |
| ↘ 3.4 ms queda | ||
| A tela mostra taxas de resposta muito rápidas em nossos testes e deve ser muito adequada para jogos em ritmo acelerado. Em comparação, todos os dispositivos testados variam de 0.165 (mínimo) a 636 (máximo) ms. » 19 % de todos os dispositivos são melhores. Isso significa que o tempo de resposta medido é melhor que a média de todos os dispositivos testados (31 ms). | ||
Cintilação da tela / PWM (modulação por largura de pulso)
| Tela tremeluzindo / PWM não detectado | 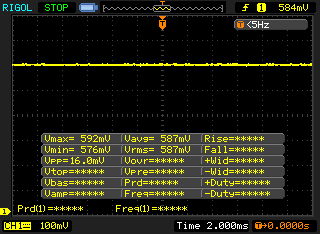 | ||
[pwm_comparison] Em comparação: 52 % de todos os dispositivos testados não usam PWM para escurecer a tela. Se PWM foi detectado, uma média de 7751 (mínimo: 5 - máximo: 343500) Hz foi medida. | |||
| Blender - v2.79 BMW27 CPU | |
| MSI GE75 9SG | |
| Asus Strix Scar 17 G732LXS | |
| Média da turma Gaming (79 - 330, n=105, últimos 2 anos) | |
| Geekbench 5.5 | |
| Single-Core | |
| Média da turma Gaming (986 - 2474, n=106, últimos 2 anos) | |
| Asus Strix Scar 17 G732LXS | |
| Multi-Core | |
| Média da turma Gaming (6460 - 28263, n=106, últimos 2 anos) | |
| Asus Strix Scar 17 G732LXS | |
| HWBOT x265 Benchmark v2.2 - 4k Preset | |
| Média da turma Gaming (11.5 - 44.4, n=106, últimos 2 anos) | |
| Asus Strix Scar 17 G732LXS | |
| MSI GE75 9SG | |
| LibreOffice - 20 Documents To PDF | |
| Asus Strix Scar 17 G732LXS | |
| Média da turma Gaming (33.2 - 88.8, n=106, últimos 2 anos) | |
| R Benchmark 2.5 - Overall mean | |
| Asus Strix Scar 17 G732LXS | |
| Média da turma Gaming (0.3439 - 0.759, n=107, últimos 2 anos) | |
* ... menor é melhor
| DPC Latencies / LatencyMon - interrupt to process latency (max), Web, Youtube, Prime95 | |
| Asus Strix Scar 17 G732LXS | |
* ... menor é melhor
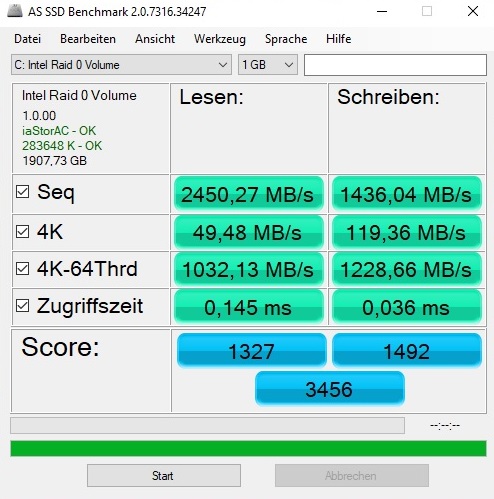
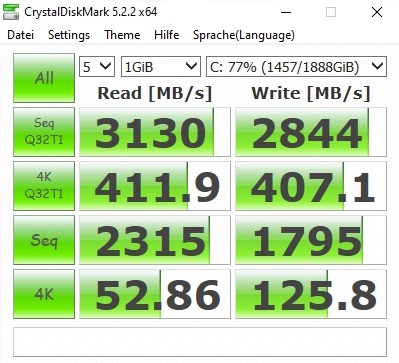
| Asus Strix Scar 17 G732LXS 2x Intel SSD 660p 1TB SSDPEKNW010T8 (RAID 0) | MSI GE75 9SG Samsung SSD PM981 MZVLB1T0HALR | HP Omen 17-cb0020ng 2x Samsung SSD PM981 MZVLB512HAJQ (RAID 0) | Asus ASUS ROG Strix SCAR III G731GW-XB74 Intel SSD 660p 1TB SSDPEKNW010T8 | Eurocom Nightsky RX17 2x Samsung SSD 970 Pro 512GB (RAID 0) | |
|---|---|---|---|---|---|
| CrystalDiskMark 5.2 / 6 | -7% | 11% | -4% | 31% | |
| Write 4K (MB/s) | 125.8 | 116.1 -8% | 103.8 -17% | 130.1 3% | 133 6% |
| Read 4K (MB/s) | 52.9 | 44.98 -15% | 41.67 -21% | 56 6% | 61.6 16% |
| Write Seq (MB/s) | 1795 | 2370 32% | 2639 47% | 2935 64% | |
| Read Seq (MB/s) | 2315 | 1465 -37% | 2702 17% | 3118 35% | |
| Write 4K Q32T1 (MB/s) | 407.1 | 337.5 -17% | 487.3 20% | 465.7 14% | 571 40% |
| Read 4K Q32T1 (MB/s) | 411.9 | 453.6 10% | 555 35% | 547 33% | 654 59% |
| Write Seq Q32T1 (MB/s) | 2844 | 2399 -16% | 2967 4% | 1766 -38% | 3296 16% |
| Read Seq Q32T1 (MB/s) | 3130 | 3087 -1% | 3102 -1% | 1922 -39% | 3560 14% |

Continuous load read: DiskSpd Read Loop, Queue Depth 8
| 3DMark 06 Standard Score | 41873 pontos | |
| 3DMark Vantage P Result | 69838 pontos | |
| 3DMark 11 Performance | 27065 pontos | |
| 3DMark Cloud Gate Standard Score | 49644 pontos | |
| 3DMark Fire Strike Score | 20902 pontos | |
| 3DMark Time Spy Score | 9629 pontos | |
Ajuda | ||
| The Witcher 3 - 1920x1080 Ultra Graphics & Postprocessing (HBAO+) | |
| Média da turma Gaming (104.7 - 240, n=7, últimos 2 anos) | |
| MSI GE75 9SG | |
| Asus Strix Scar 17 G732LXS | |
| HP Omen 17-cb0020ng | |
| Eurocom Nightsky RX17 | |
| Asus ASUS ROG Strix SCAR III G731GW-XB74 | |
| baixo | média | alto | ultra | QHD | 4K | |
|---|---|---|---|---|---|---|
| GTA V (2015) | 185 | 178 | 164 | 92.8 | ||
| The Witcher 3 (2015) | 280 | 178 | 93.4 | 66.4 | ||
| Dota 2 Reborn (2015) | 168 | 154 | 148 | 134 | ||
| Fortnite (2018) | 178 | 171 | 136 | 104 | 52 | |
| Final Fantasy XV Benchmark (2018) | 124 | 95.7 | 42 | |||
| Kingdom Come: Deliverance (2018) | 144 | 107 | 75.3 | 56.1 | 33.1 | |
| X-Plane 11.11 (2018) | 123 | 105 | 88.4 | |||
| Monster Hunter World (2018) | 131 | 119 | 102 | 69.1 | 36 | |
| Shadow of the Tomb Raider (2018) | 136 | 127 | 121 | 84 | 45 | |
| Assassin´s Creed Odyssey (2018) | 98 | 85 | 62 | 57 | 38 | |
| Hitman 2 (2018) | 104 | 87.8 | 80 | 77.7 | 48.4 | |
| Battlefield V (2018) | 169 | 153 | 142 | 115 | 68.7 | |
| Darksiders III (2018) | 168 | 143 | 132 | 97.2 | 50.5 | |
| Just Cause 4 (2018) | 157 | 120 | 113 | 81.2 | 46 | |
| Apex Legends (2019) | 144 | 144 | 144 | 131 | 75.4 | |
| Far Cry New Dawn (2019) | 116 | 113 | 100 | 90 | 55 | |
| Metro Exodus (2019) | 116 | 90.2 | 71 | 55.4 | 34.9 | |
| Dirt Rally 2.0 (2019) | 178 | 158 | 91.6 | 74.1 | ||
| The Division 2 (2019) | 147 | 131 | 102 | 69 | 36 | |
| Anno 1800 (2019) | 122 | 91.7 | 50.6 | 45.3 | 27.1 | |
| Rage 2 (2019) | 148 | 127 | 127 | 81.9 | 40.3 | |
| F1 2019 (2019) | 224 | 174 | 167 | 130 | 80 | |
| Control (2019) | 113 | 87.6 | 58.9 | 29.8 | ||
| Borderlands 3 (2019) | 131 | 98 | 88 | 64.6 | 35.2 | |
| FIFA 20 (2019) | 281 | 267 | 262 | 258 | 227 | |
| Ghost Recon Breakpoint (2019) | 109 | 99 | 74 | 57 | 34 | |
| GRID 2019 (2019) | 164 | 120 | 88.7 | 72.5 | 48.8 | |
| Call of Duty Modern Warfare 2019 (2019) | 145 | 136 | 115 | 83.6 | 48.3 | |
| Need for Speed Heat (2019) | 104 | 91 | 79.4 | 75.3 | 51.3 | |
| Star Wars Jedi Fallen Order (2019) | 121 | 117 | 107 | 86.4 | 49 | |
| Red Dead Redemption 2 (2019) | 117 | 79.8 | 52.9 | 42.5 | 27.6 | |
| Escape from Tarkov (2020) | 121 | 121 | 121 | 102 | 49.5 | |
| Hunt Showdown (2020) | 151 | 120 | 83.1 | 38.4 | ||
| Doom Eternal (2020) | 216 | 193 | 191 | 147 | 80.8 | |
| Gears Tactics (2020) | 226 | 144 | 106 | 70.3 | 38.4 | |
| F1 2020 (2020) | 235 | 175 | 146 | 119 | 72 |
Barulho
| Ocioso |
| 33 / 38 / 45 dB |
| Carga |
| 54 / 55 dB |
 | ||
30 dB silencioso 40 dB(A) audível 50 dB(A) ruidosamente alto |
||
min: | ||
| Asus Strix Scar 17 G732LXS i9-10980HK, GeForce RTX 2080 Super Mobile | MSI GE75 9SG i9-9880H, GeForce RTX 2080 Mobile | HP Omen 17-cb0020ng i9-9880H, GeForce RTX 2080 Mobile | Asus ASUS ROG Strix SCAR III G731GW-XB74 i7-9750H, GeForce RTX 2070 Mobile | Eurocom Nightsky RX17 i7-9750H, GeForce RTX 2070 Mobile | Média da turma Gaming | |
|---|---|---|---|---|---|---|
| Noise | 9% | 3% | 8% | 10% | 18% | |
| desligado / ambiente * (dB) | 25 | 28.2 -13% | 30 -20% | 28.2 -13% | 28 -12% | 24.1 ? 4% |
| Idle Minimum * (dB) | 33 | 30.4 8% | 34 -3% | 28.2 15% | 28 15% | 26 ? 21% |
| Idle Average * (dB) | 38 | 30.4 20% | 35 8% | 28.5 25% | 28.4 25% | 27.4 ? 28% |
| Idle Maximum * (dB) | 45 | 33.4 26% | 36 20% | 30 33% | 32.9 27% | 30.1 ? 33% |
| Load Average * (dB) | 54 | 37.1 31% | 51 6% | 51.5 5% | 45 17% | 43.6 ? 19% |
| Witcher 3 ultra * (dB) | 50 | 54.2 -8% | 47 6% | 55.3 -11% | 53.2 -6% | |
| Load Maximum * (dB) | 55 | 56.4 -3% | 51 7% | 55.3 -1% | 53.2 3% | 54.2 ? 1% |
* ... menor é melhor
(-) A temperatura máxima no lado superior é 59 °C / 138 F, em comparação com a média de 40.4 °C / 105 F , variando de 21.2 a 68.8 °C para a classe Gaming.
(-) A parte inferior aquece até um máximo de 52 °C / 126 F, em comparação com a média de 43.2 °C / 110 F
(+) Em uso inativo, a temperatura média para o lado superior é 28.6 °C / 83 F, em comparação com a média do dispositivo de 33.9 °C / ### class_avg_f### F.
(-) Jogando The Witcher 3, a temperatura média para o lado superior é 48.6 °C / 119 F, em comparação com a média do dispositivo de 33.9 °C / ## #class_avg_f### F.
(-) Os apoios para as mãos e o touchpad podem ficar muito quentes ao toque, com um máximo de 40 °C / 104 F.
(-) A temperatura média da área do apoio para as mãos de dispositivos semelhantes foi 28.8 °C / 83.8 F (-11.2 °C / -20.2 F).
| Asus Strix Scar 17 G732LXS i9-10980HK, GeForce RTX 2080 Super Mobile | MSI GE75 9SG i9-9880H, GeForce RTX 2080 Mobile | HP Omen 17-cb0020ng i9-9880H, GeForce RTX 2080 Mobile | Asus ASUS ROG Strix SCAR III G731GW-XB74 i7-9750H, GeForce RTX 2070 Mobile | Eurocom Nightsky RX17 i7-9750H, GeForce RTX 2070 Mobile | Média da turma Gaming | |
|---|---|---|---|---|---|---|
| Heat | -14% | 2% | -5% | -5% | 2% | |
| Maximum Upper Side * (°C) | 59 | 48.8 17% | 47 20% | 45.2 23% | 48.6 18% | 45.2 ? 23% |
| Maximum Bottom * (°C) | 52 | 52 -0% | 54 -4% | 52 -0% | 46.8 10% | 48.2 ? 7% |
| Idle Upper Side * (°C) | 30 | 36.2 -21% | 32 -7% | 33 -10% | 35.4 -18% | 31 ? -3% |
| Idle Bottom * (°C) | 29 | 44.4 -53% | 30 -3% | 38 -31% | 38 -31% | 34.2 ? -18% |
* ... menor é melhor
Asus Strix Scar 17 G732LXS análise de áudio
(±) | o volume do alto-falante é médio, mas bom (###valor### dB)
Graves 100 - 315Hz
(±) | graves reduzidos - em média 7.1% menor que a mediana
(±) | a linearidade dos graves é média (12.6% delta para a frequência anterior)
Médios 400 - 2.000 Hz
(±) | médios mais altos - em média 5.5% maior que a mediana
(+) | médios são lineares (5.1% delta para frequência anterior)
Altos 2 - 16 kHz
(+) | agudos equilibrados - apenas 2.8% longe da mediana
(+) | os máximos são lineares (5.6% delta da frequência anterior)
Geral 100 - 16.000 Hz
(+) | o som geral é linear (12.1% diferença em relação à mediana)
Comparado com a mesma classe
» 12% de todos os dispositivos testados nesta classe foram melhores, 4% semelhantes, 84% piores
» O melhor teve um delta de 6%, a média foi 18%, o pior foi 132%
Comparado com todos os dispositivos testados
» 10% de todos os dispositivos testados foram melhores, 2% semelhantes, 88% piores
» O melhor teve um delta de 4%, a média foi 23%, o pior foi 134%
MSI GE75 9SG análise de áudio
(+) | os alto-falantes podem tocar relativamente alto (###valor### dB)
Graves 100 - 315Hz
(±) | graves reduzidos - em média 12.2% menor que a mediana
(±) | a linearidade dos graves é média (8.7% delta para a frequência anterior)
Médios 400 - 2.000 Hz
(±) | médios mais altos - em média 6.7% maior que a mediana
(±) | a linearidade dos médios é média (11.5% delta para frequência anterior)
Altos 2 - 16 kHz
(+) | agudos equilibrados - apenas 2.9% longe da mediana
(±) | a linearidade dos máximos é média (7.6% delta para frequência anterior)
Geral 100 - 16.000 Hz
(±) | a linearidade do som geral é média (16.5% diferença em relação à mediana)
Comparado com a mesma classe
» 42% de todos os dispositivos testados nesta classe foram melhores, 7% semelhantes, 51% piores
» O melhor teve um delta de 6%, a média foi 18%, o pior foi 132%
Comparado com todos os dispositivos testados
» 28% de todos os dispositivos testados foram melhores, 6% semelhantes, 66% piores
» O melhor teve um delta de 4%, a média foi 23%, o pior foi 134%
| desligado | |
| Ocioso | |
| Carga |
|
Key:
min: | |
| Asus Strix Scar 17 G732LXS i9-10980HK, GeForce RTX 2080 Super Mobile | MSI GE75 9SG i9-9880H, GeForce RTX 2080 Mobile | HP Omen 17-cb0020ng i9-9880H, GeForce RTX 2080 Mobile | Asus ASUS ROG Strix SCAR III G731GW-XB74 i7-9750H, GeForce RTX 2070 Mobile | Eurocom Nightsky RX17 i7-9750H, GeForce RTX 2070 Mobile | Média da turma Gaming | |
|---|---|---|---|---|---|---|
| Power Consumption | 17% | -8% | 9% | 18% | 23% | |
| Idle Minimum * (Watt) | 16 | 13.9 13% | 26 -63% | 18.2 -14% | 18.6 -16% | 13 ? 19% |
| Idle Average * (Watt) | 25 | 18.8 25% | 29 -16% | 23 8% | 22.6 10% | 19 ? 24% |
| Idle Maximum * (Watt) | 35 | 23.1 34% | 38 -9% | 33.1 5% | 23 34% | 24.6 ? 30% |
| Load Average * (Watt) | 177 | 112.3 37% | 106 40% | 124.8 29% | 93.4 47% | 110.7 ? 37% |
| Witcher 3 ultra * (Watt) | 227 | 231 -2% | 228 -0% | 180.8 20% | 186.4 18% | |
| Load Maximum * (Watt) | 280 | 291.5 -4% | 287 -2% | 263 6% | 233.6 17% | 259 ? 7% |
* ... menor é melhor
| Asus Strix Scar 17 G732LXS i9-10980HK, GeForce RTX 2080 Super Mobile, 66 Wh | MSI GE75 9SG i9-9880H, GeForce RTX 2080 Mobile, 65 Wh | HP Omen 17-cb0020ng i9-9880H, GeForce RTX 2080 Mobile, 70 Wh | Asus ASUS ROG Strix SCAR III G731GW-XB74 i7-9750H, GeForce RTX 2070 Mobile, 66 Wh | Eurocom Nightsky RX17 i7-9750H, GeForce RTX 2070 Mobile, 62 Wh | Média da turma Gaming | |
|---|---|---|---|---|---|---|
| Duração da bateria | -17% | -43% | -33% | -48% | 1% | |
| Reader / Idle (h) | 10 | 4.2 -58% | 4.2 -58% | 4.2 -58% | 8.27 ? -17% | |
| WiFi v1.3 (h) | 5.9 | 4.9 -17% | 3.3 -44% | 3.9 -34% | 2 -66% | 7.11 ? 21% |
| Load (h) | 1.5 | 1.1 -27% | 1.4 -7% | 1.2 -20% | 1.502 ? 0% |
Pro
Contra
Com o Strix Scar 17 G732LXS, a Asus vende um portátil de gama alta extremamente poderoso, que infelizmente sofre com as fraquezas típicas dessa categoria.
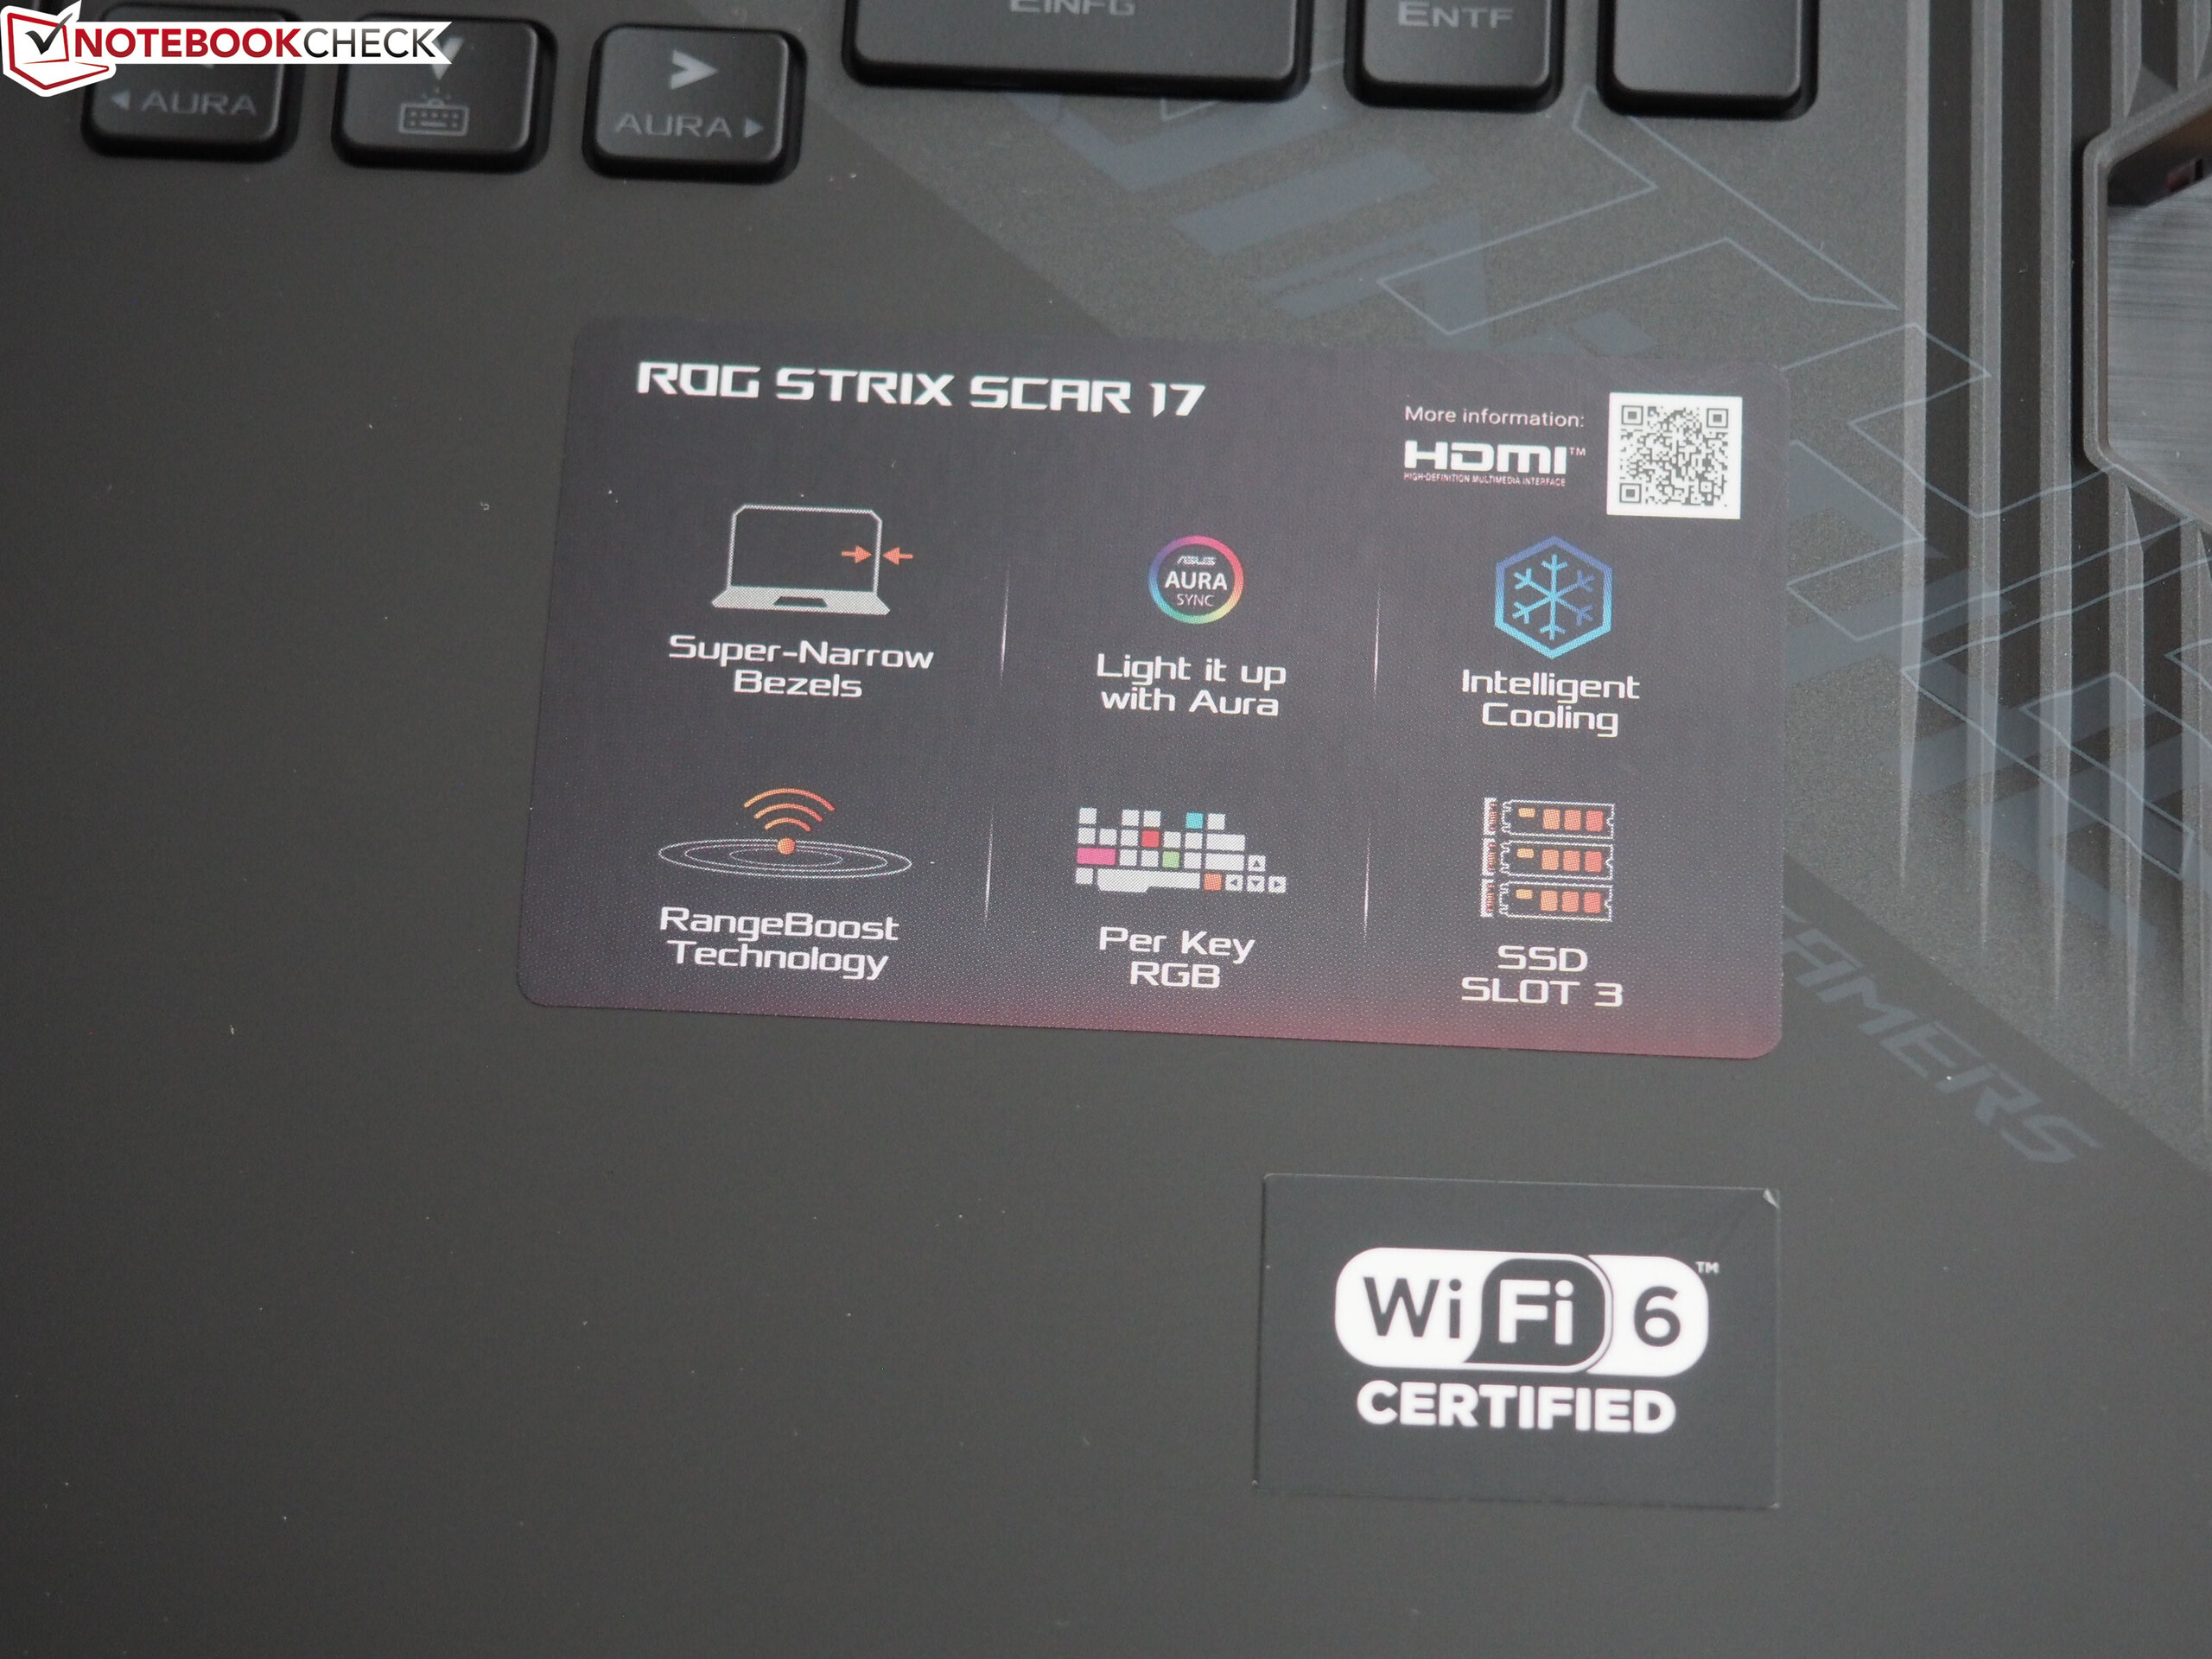
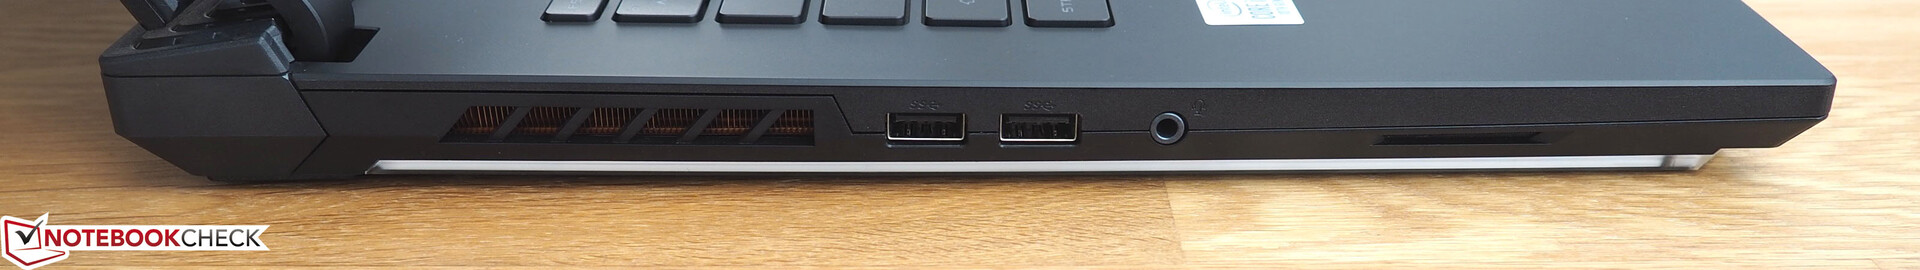
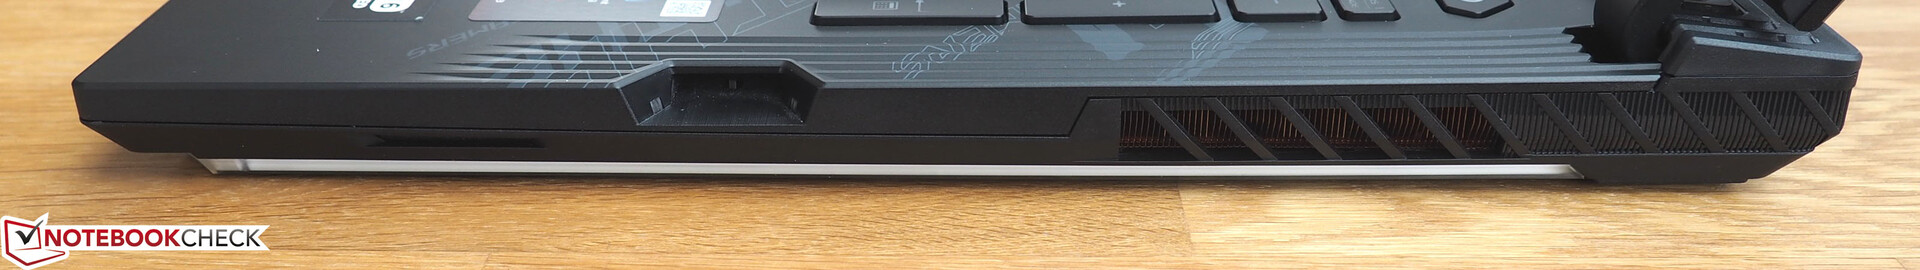
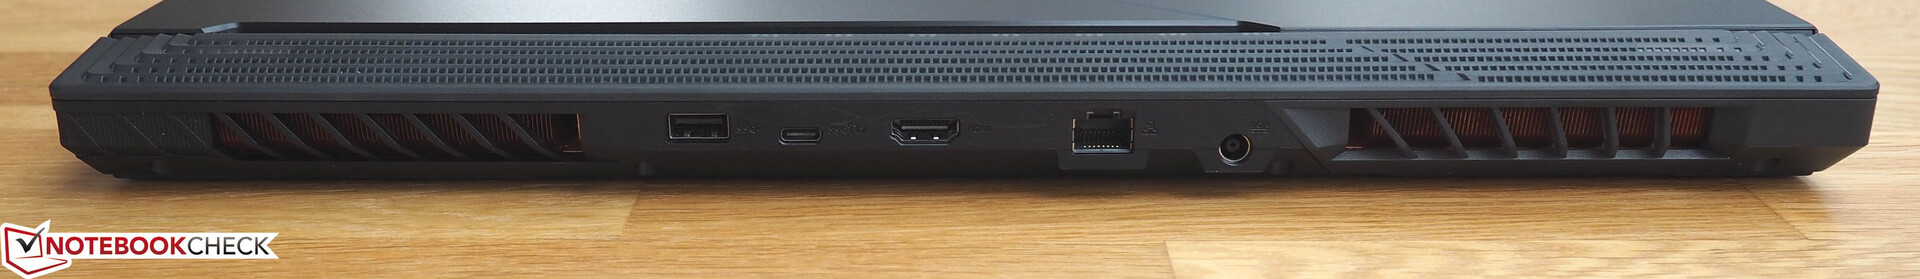
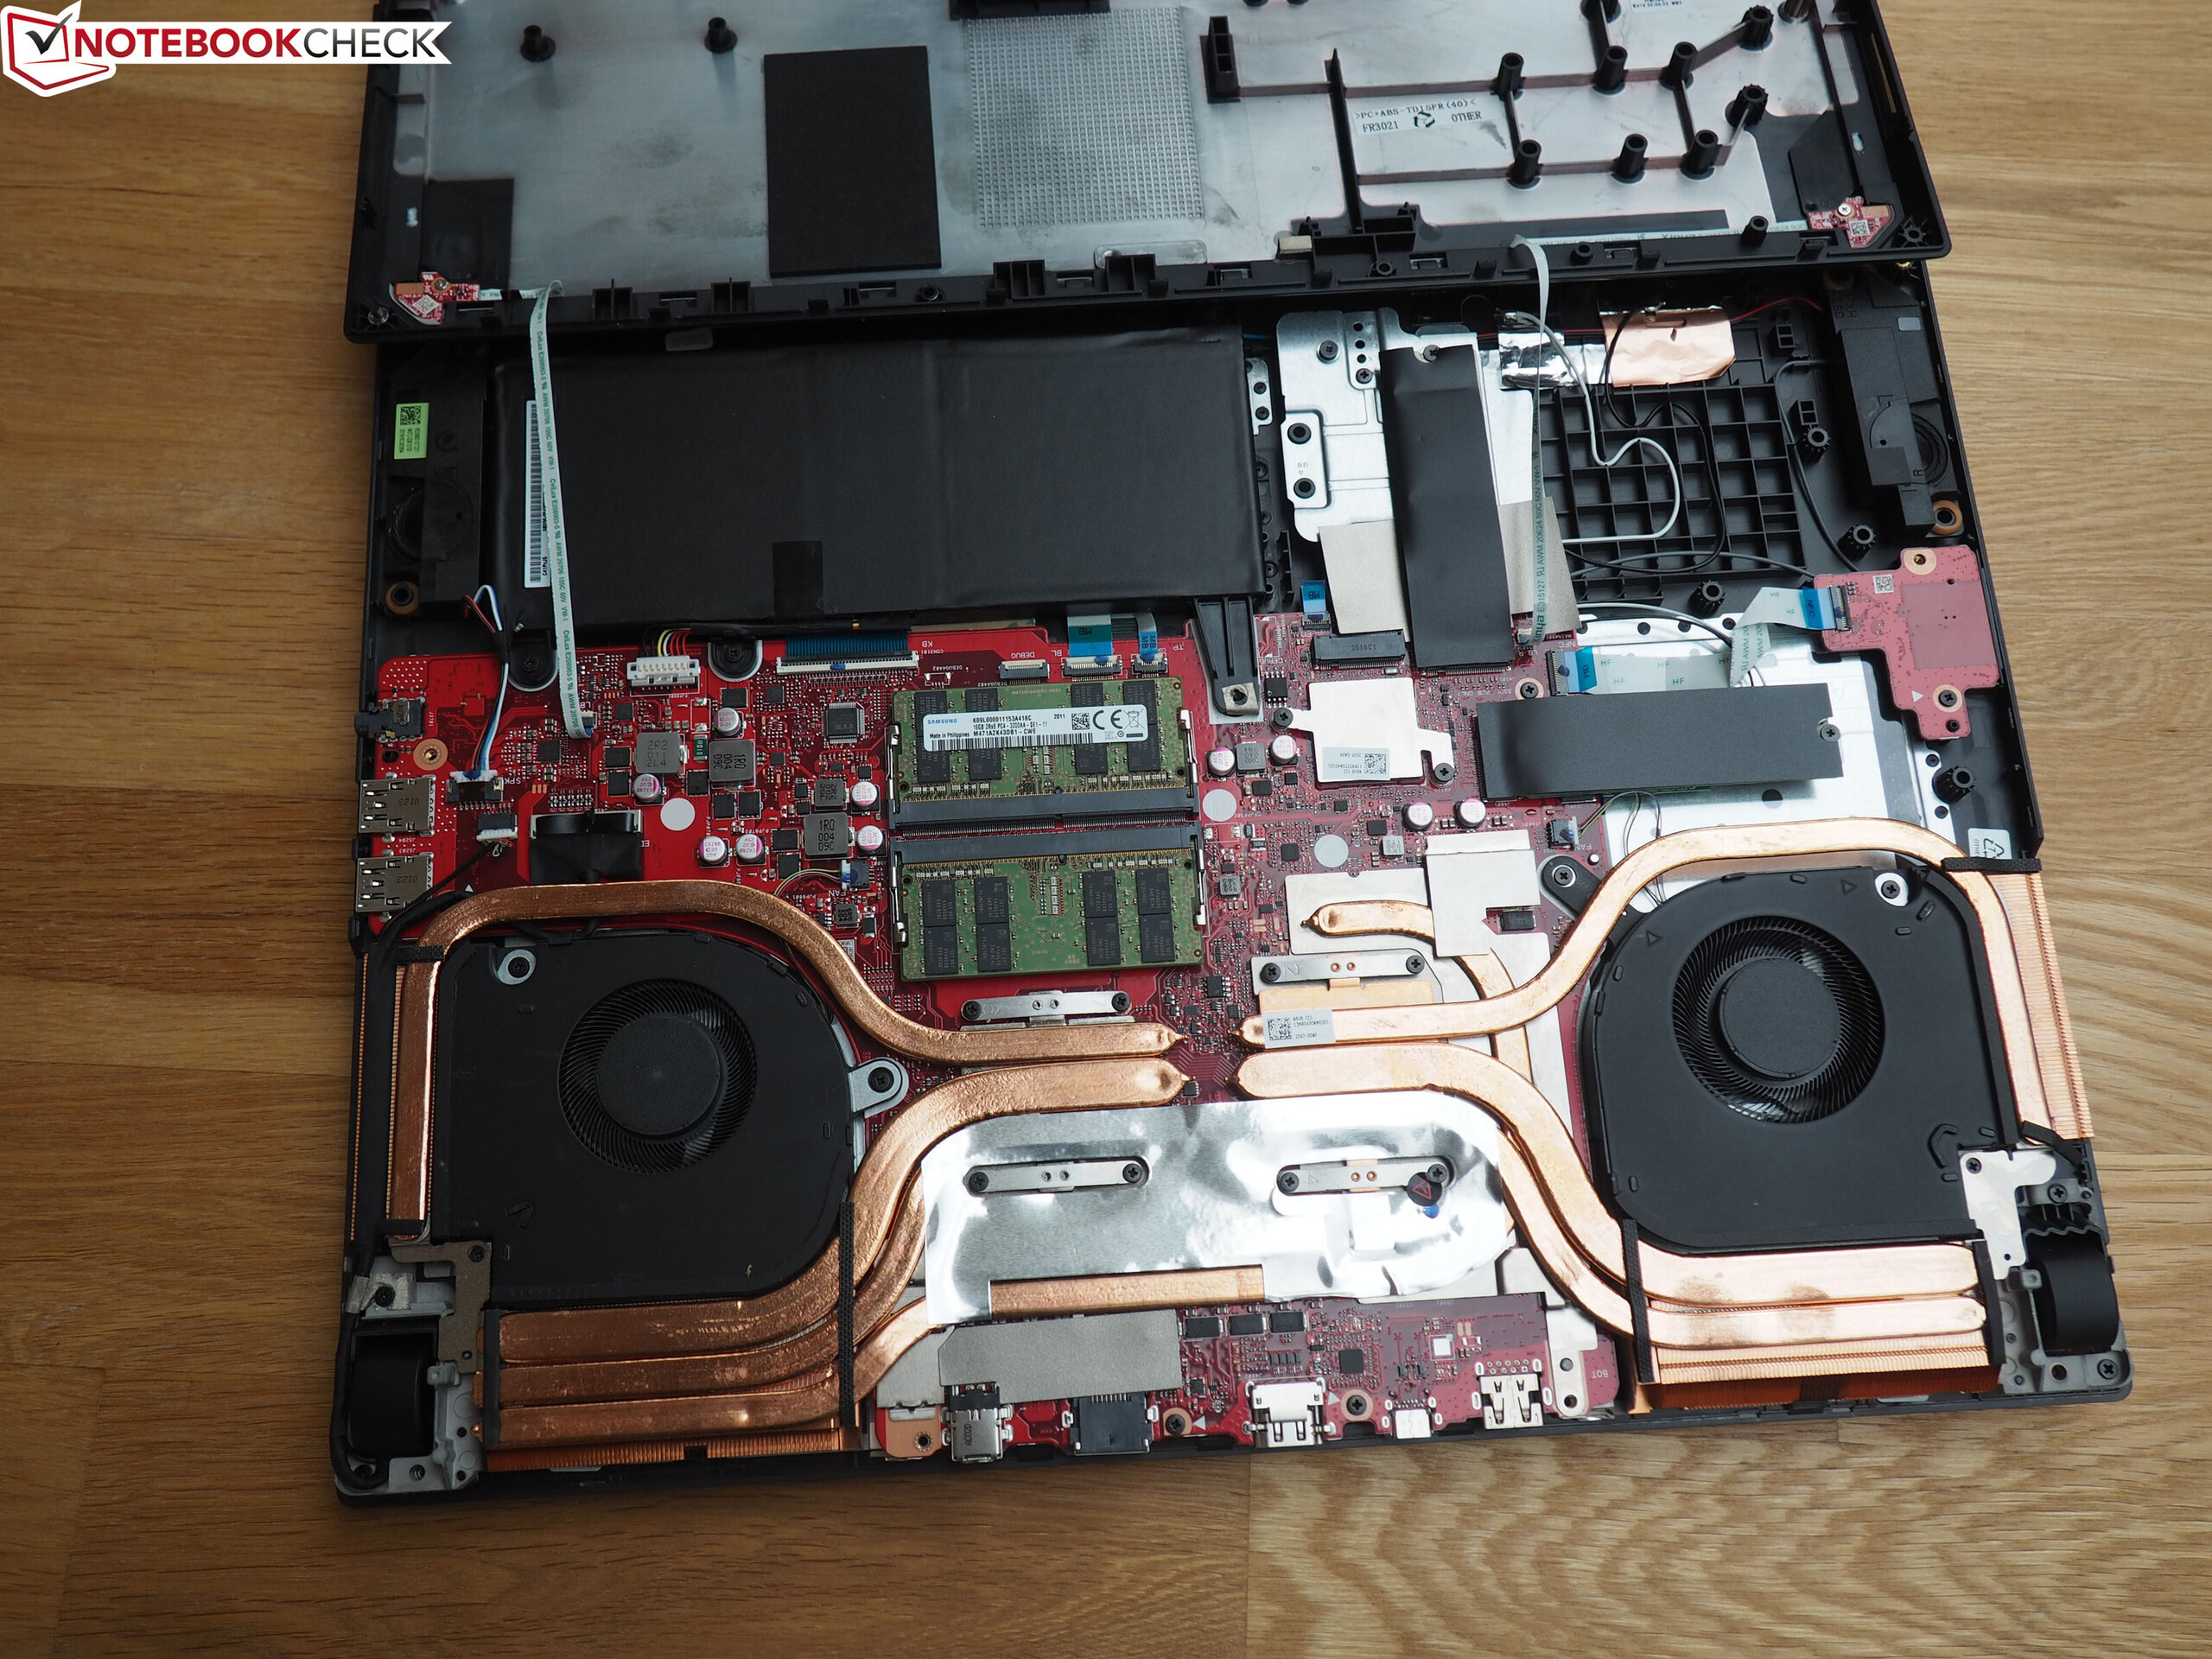
Além da geração de calor, o nível de ruído na operação 3D também é muito alto. Além disso, a placa de vídeo ganhou apenas a designação "Super" em uma extensão limitada ao comparar o desempenho com outros portáteis RTX 2080 (palavra-chave TGP). A Asus também pode melhorar a conectividade (sem leitor de cartão, sem Thunderbolt 3).
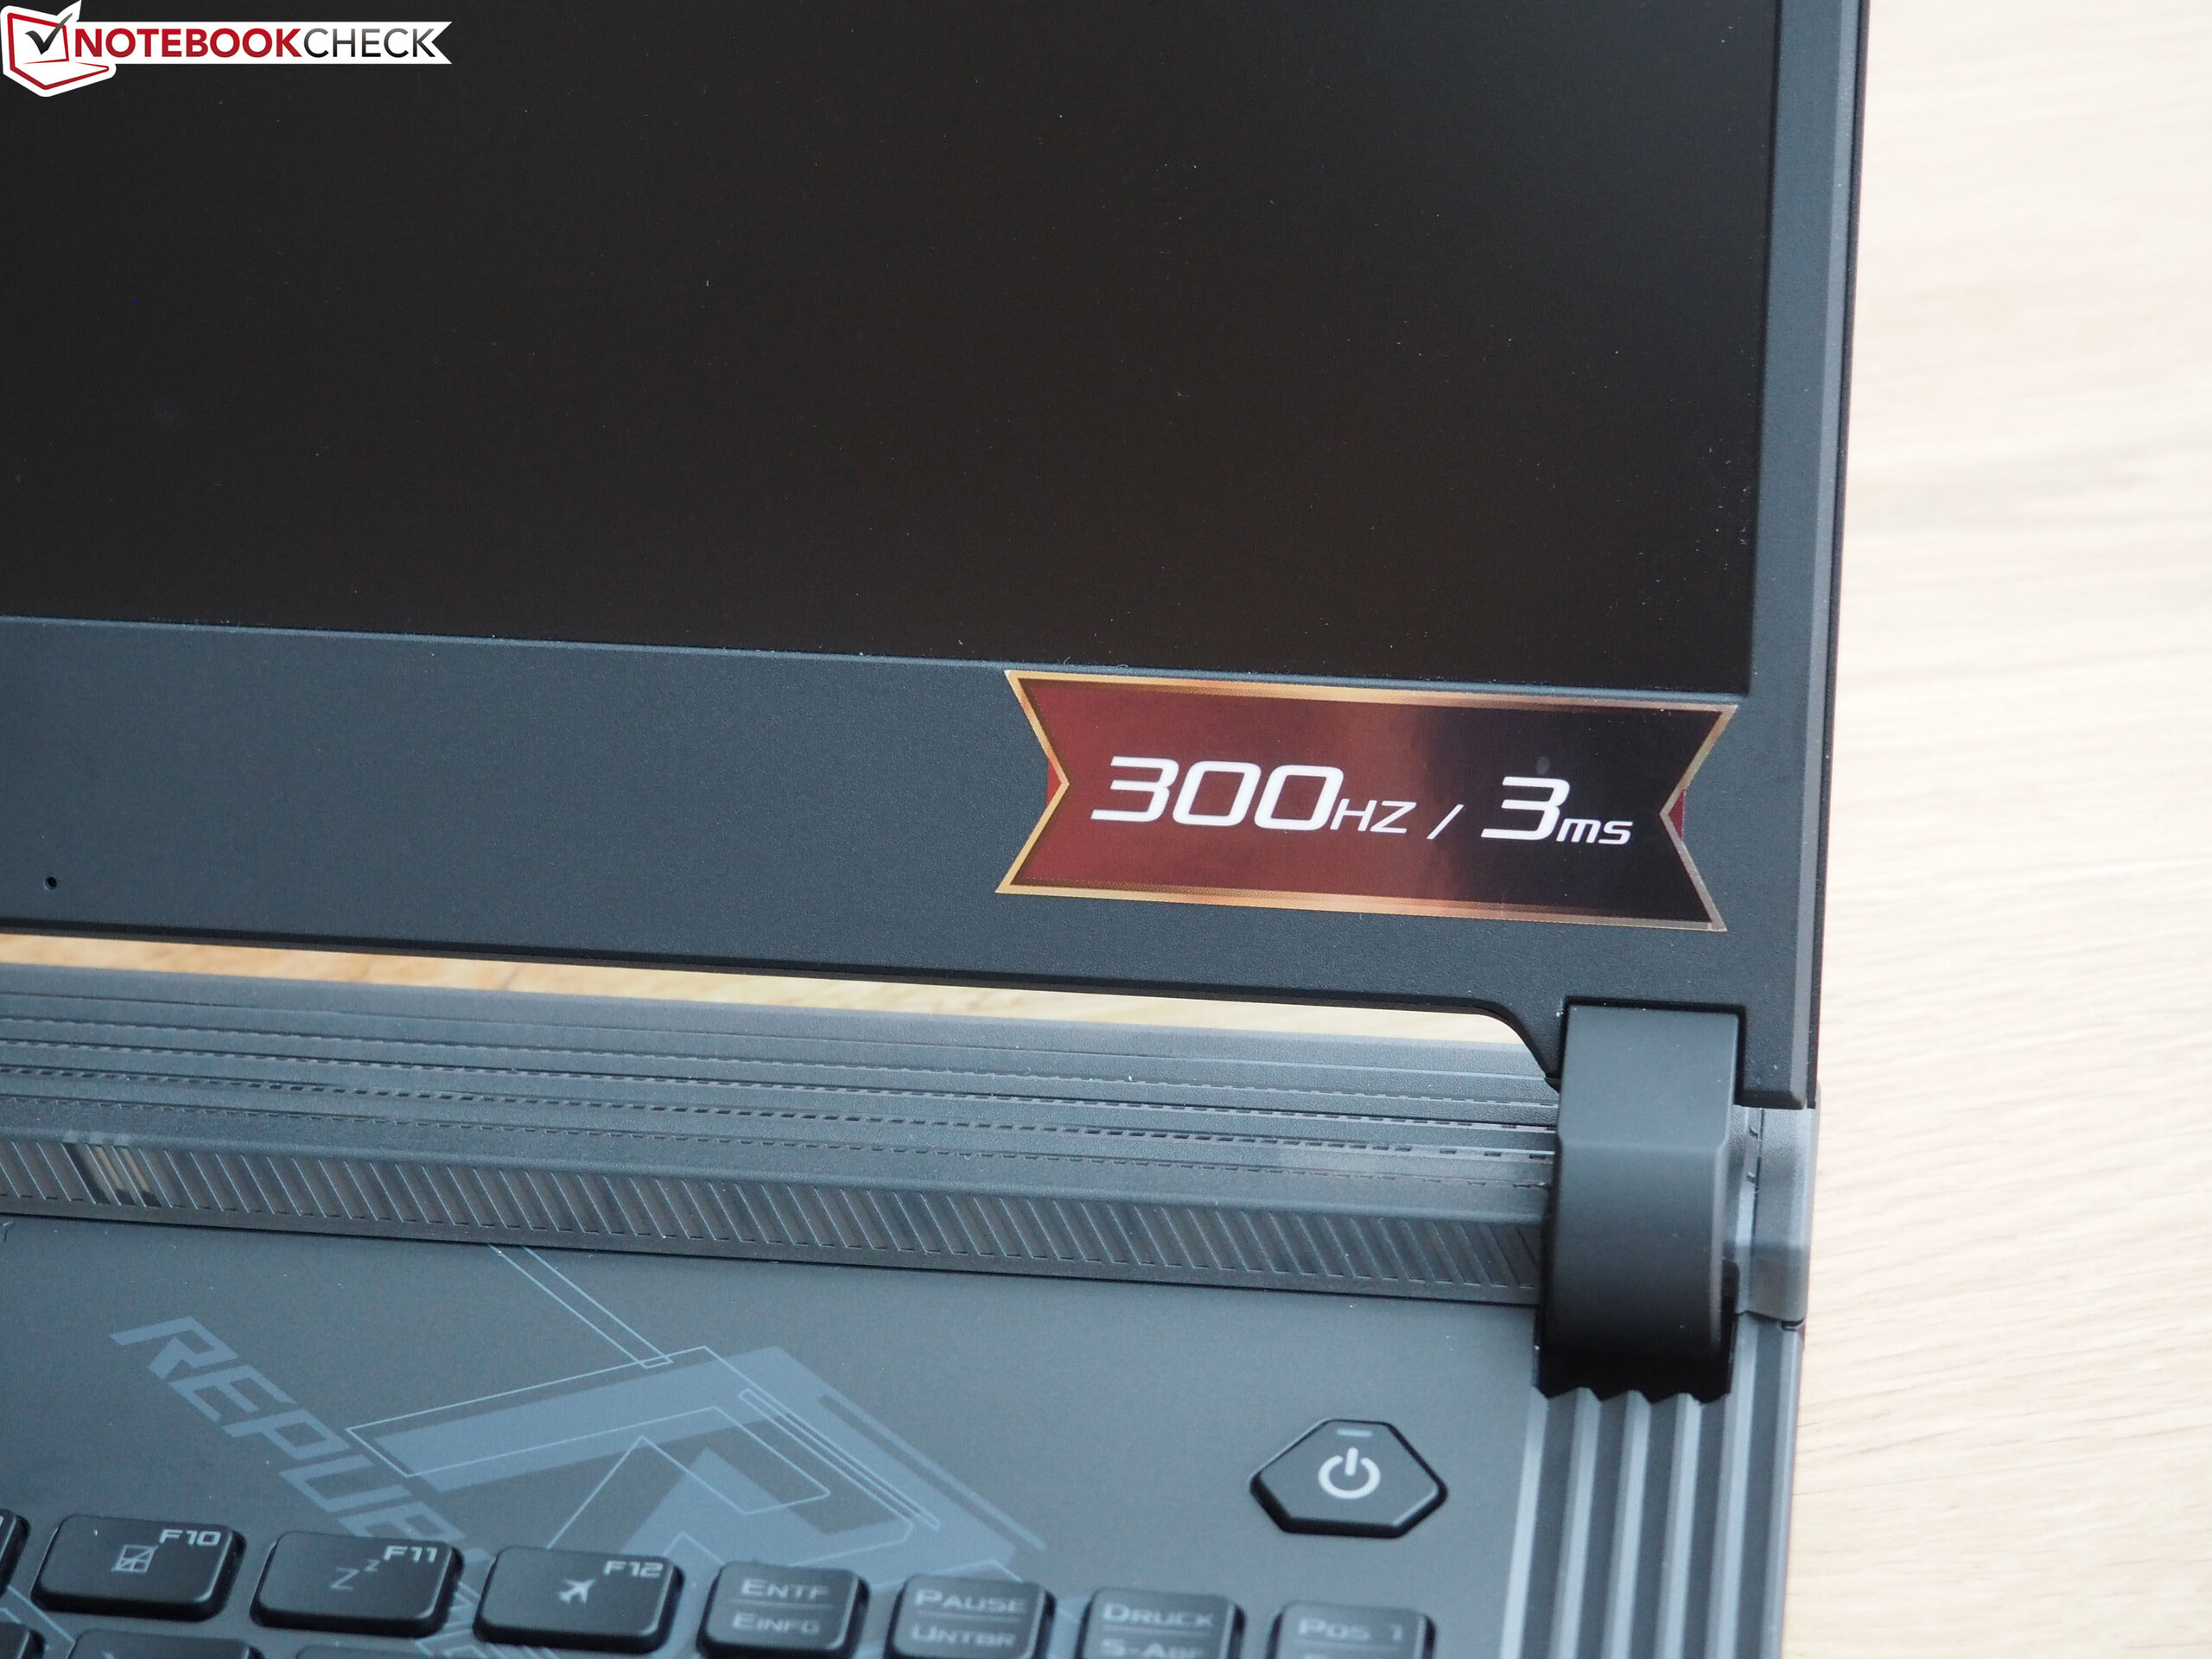
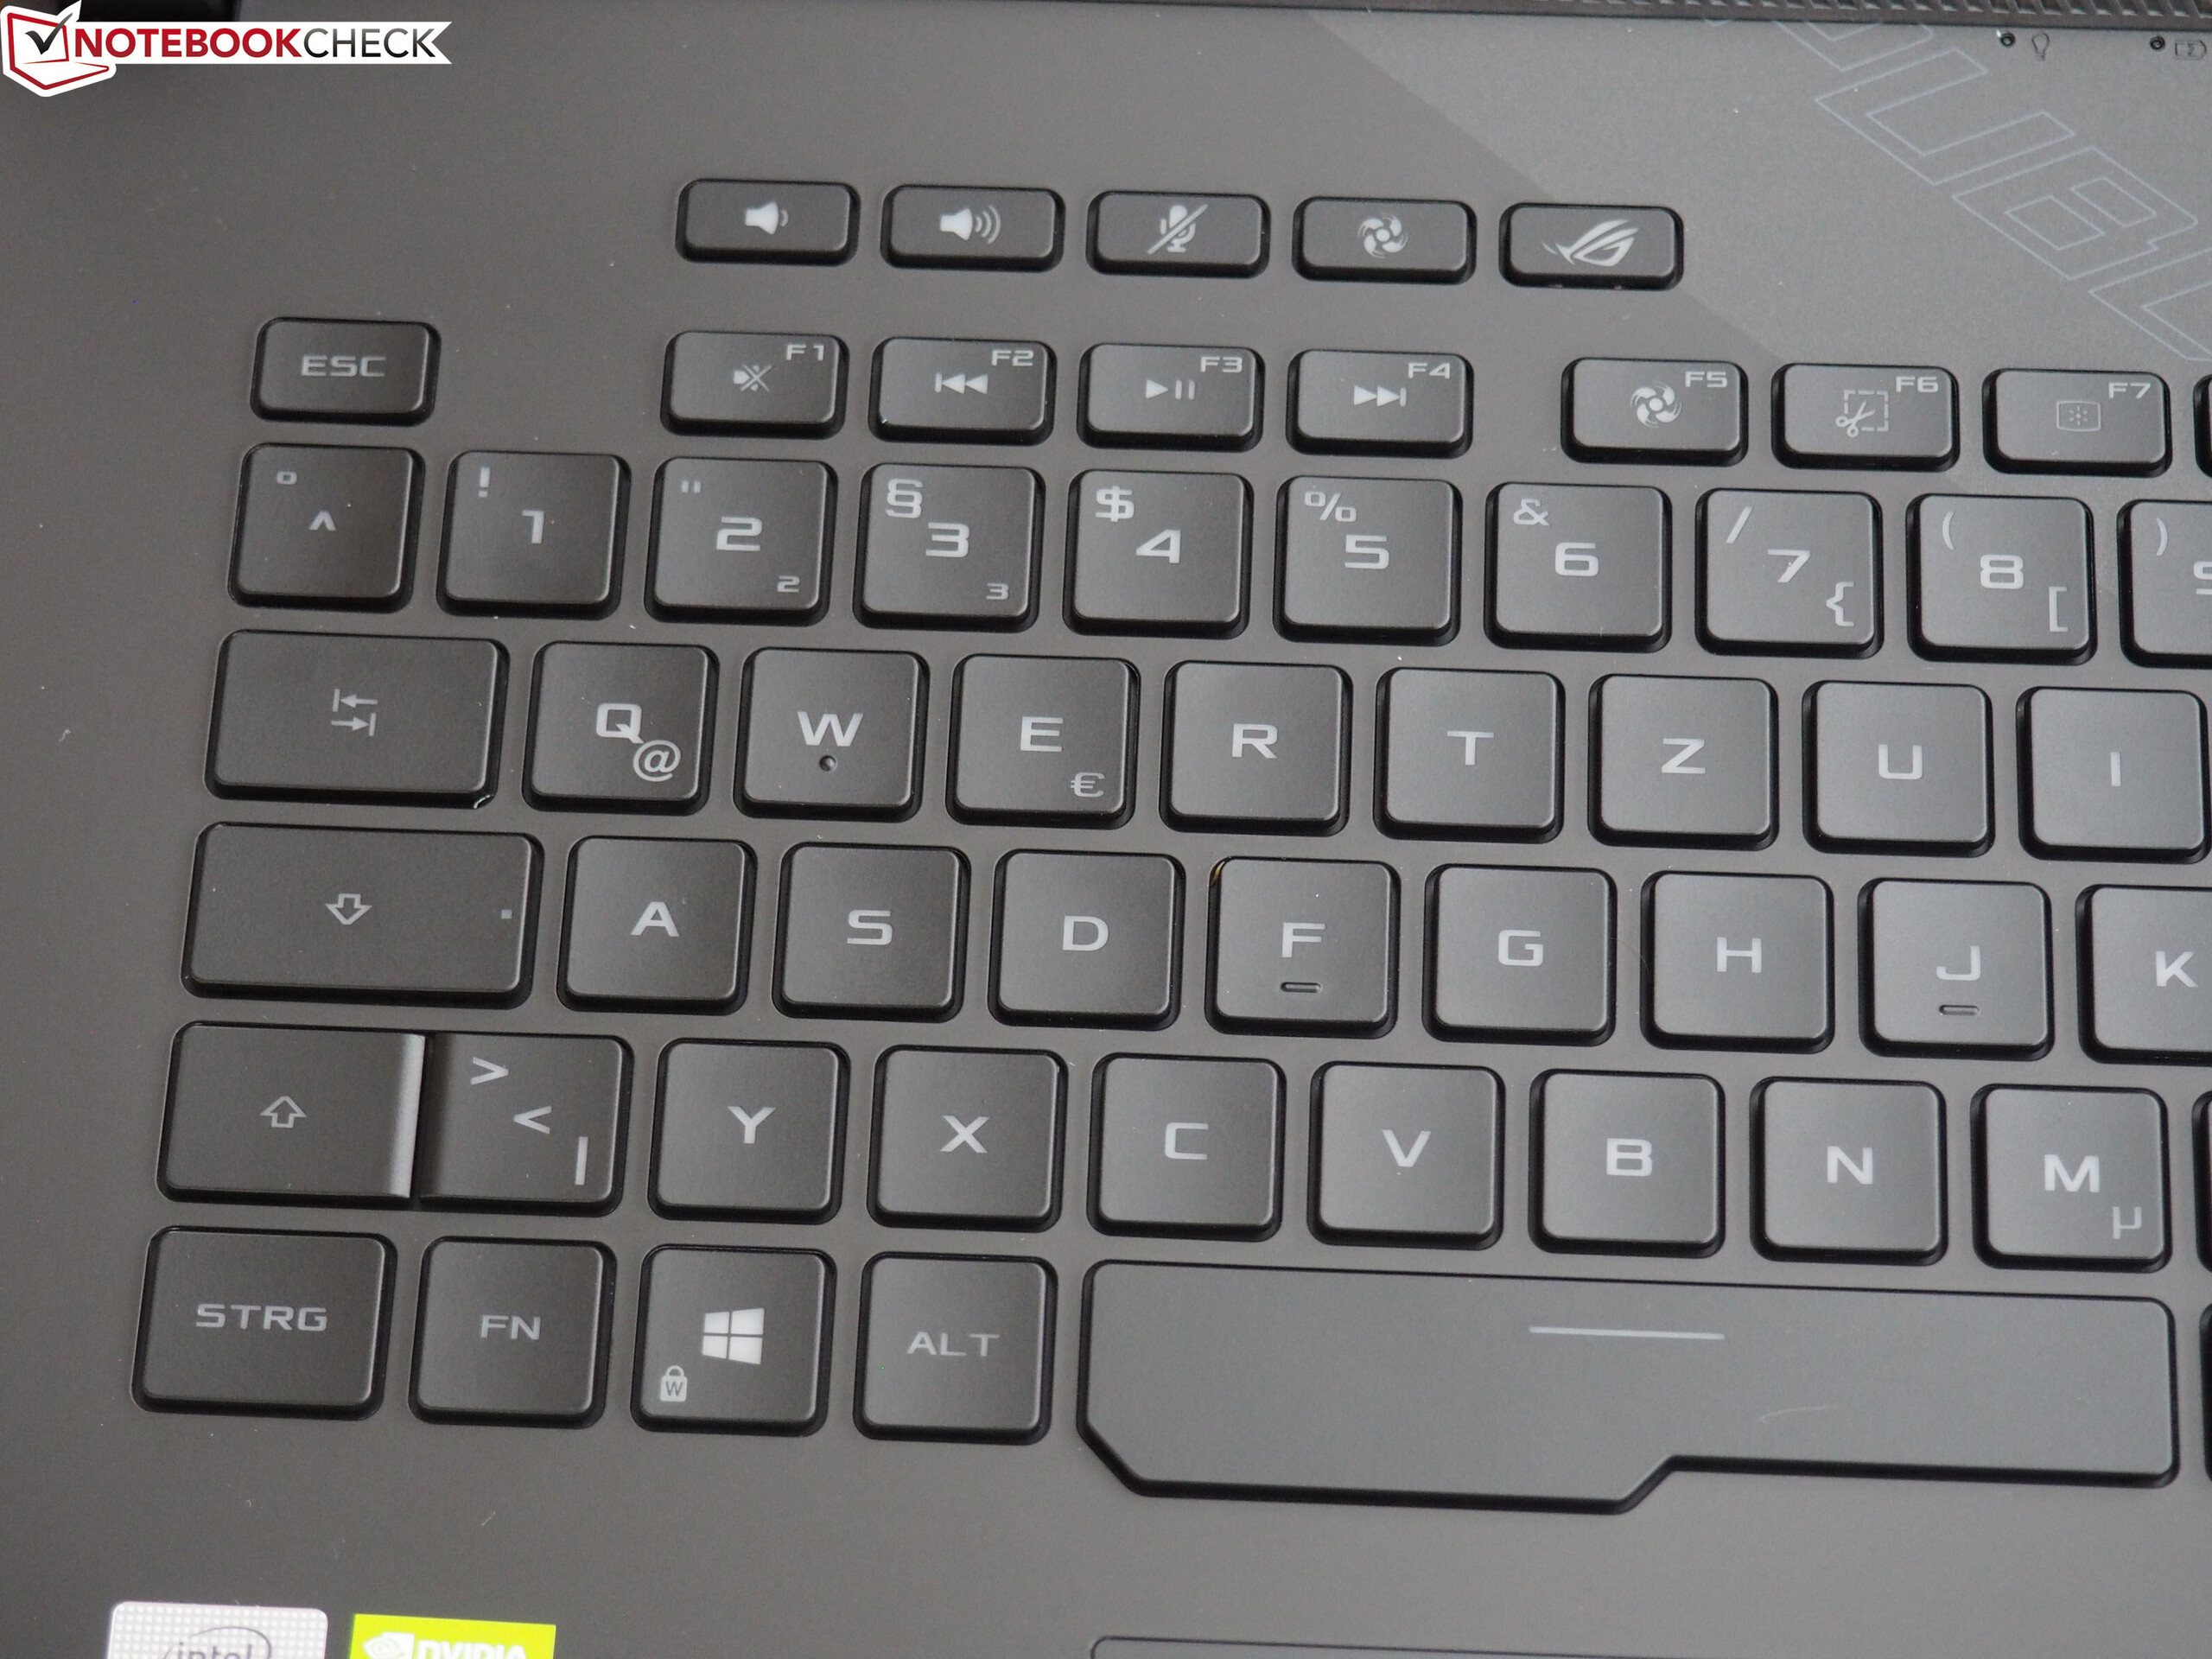
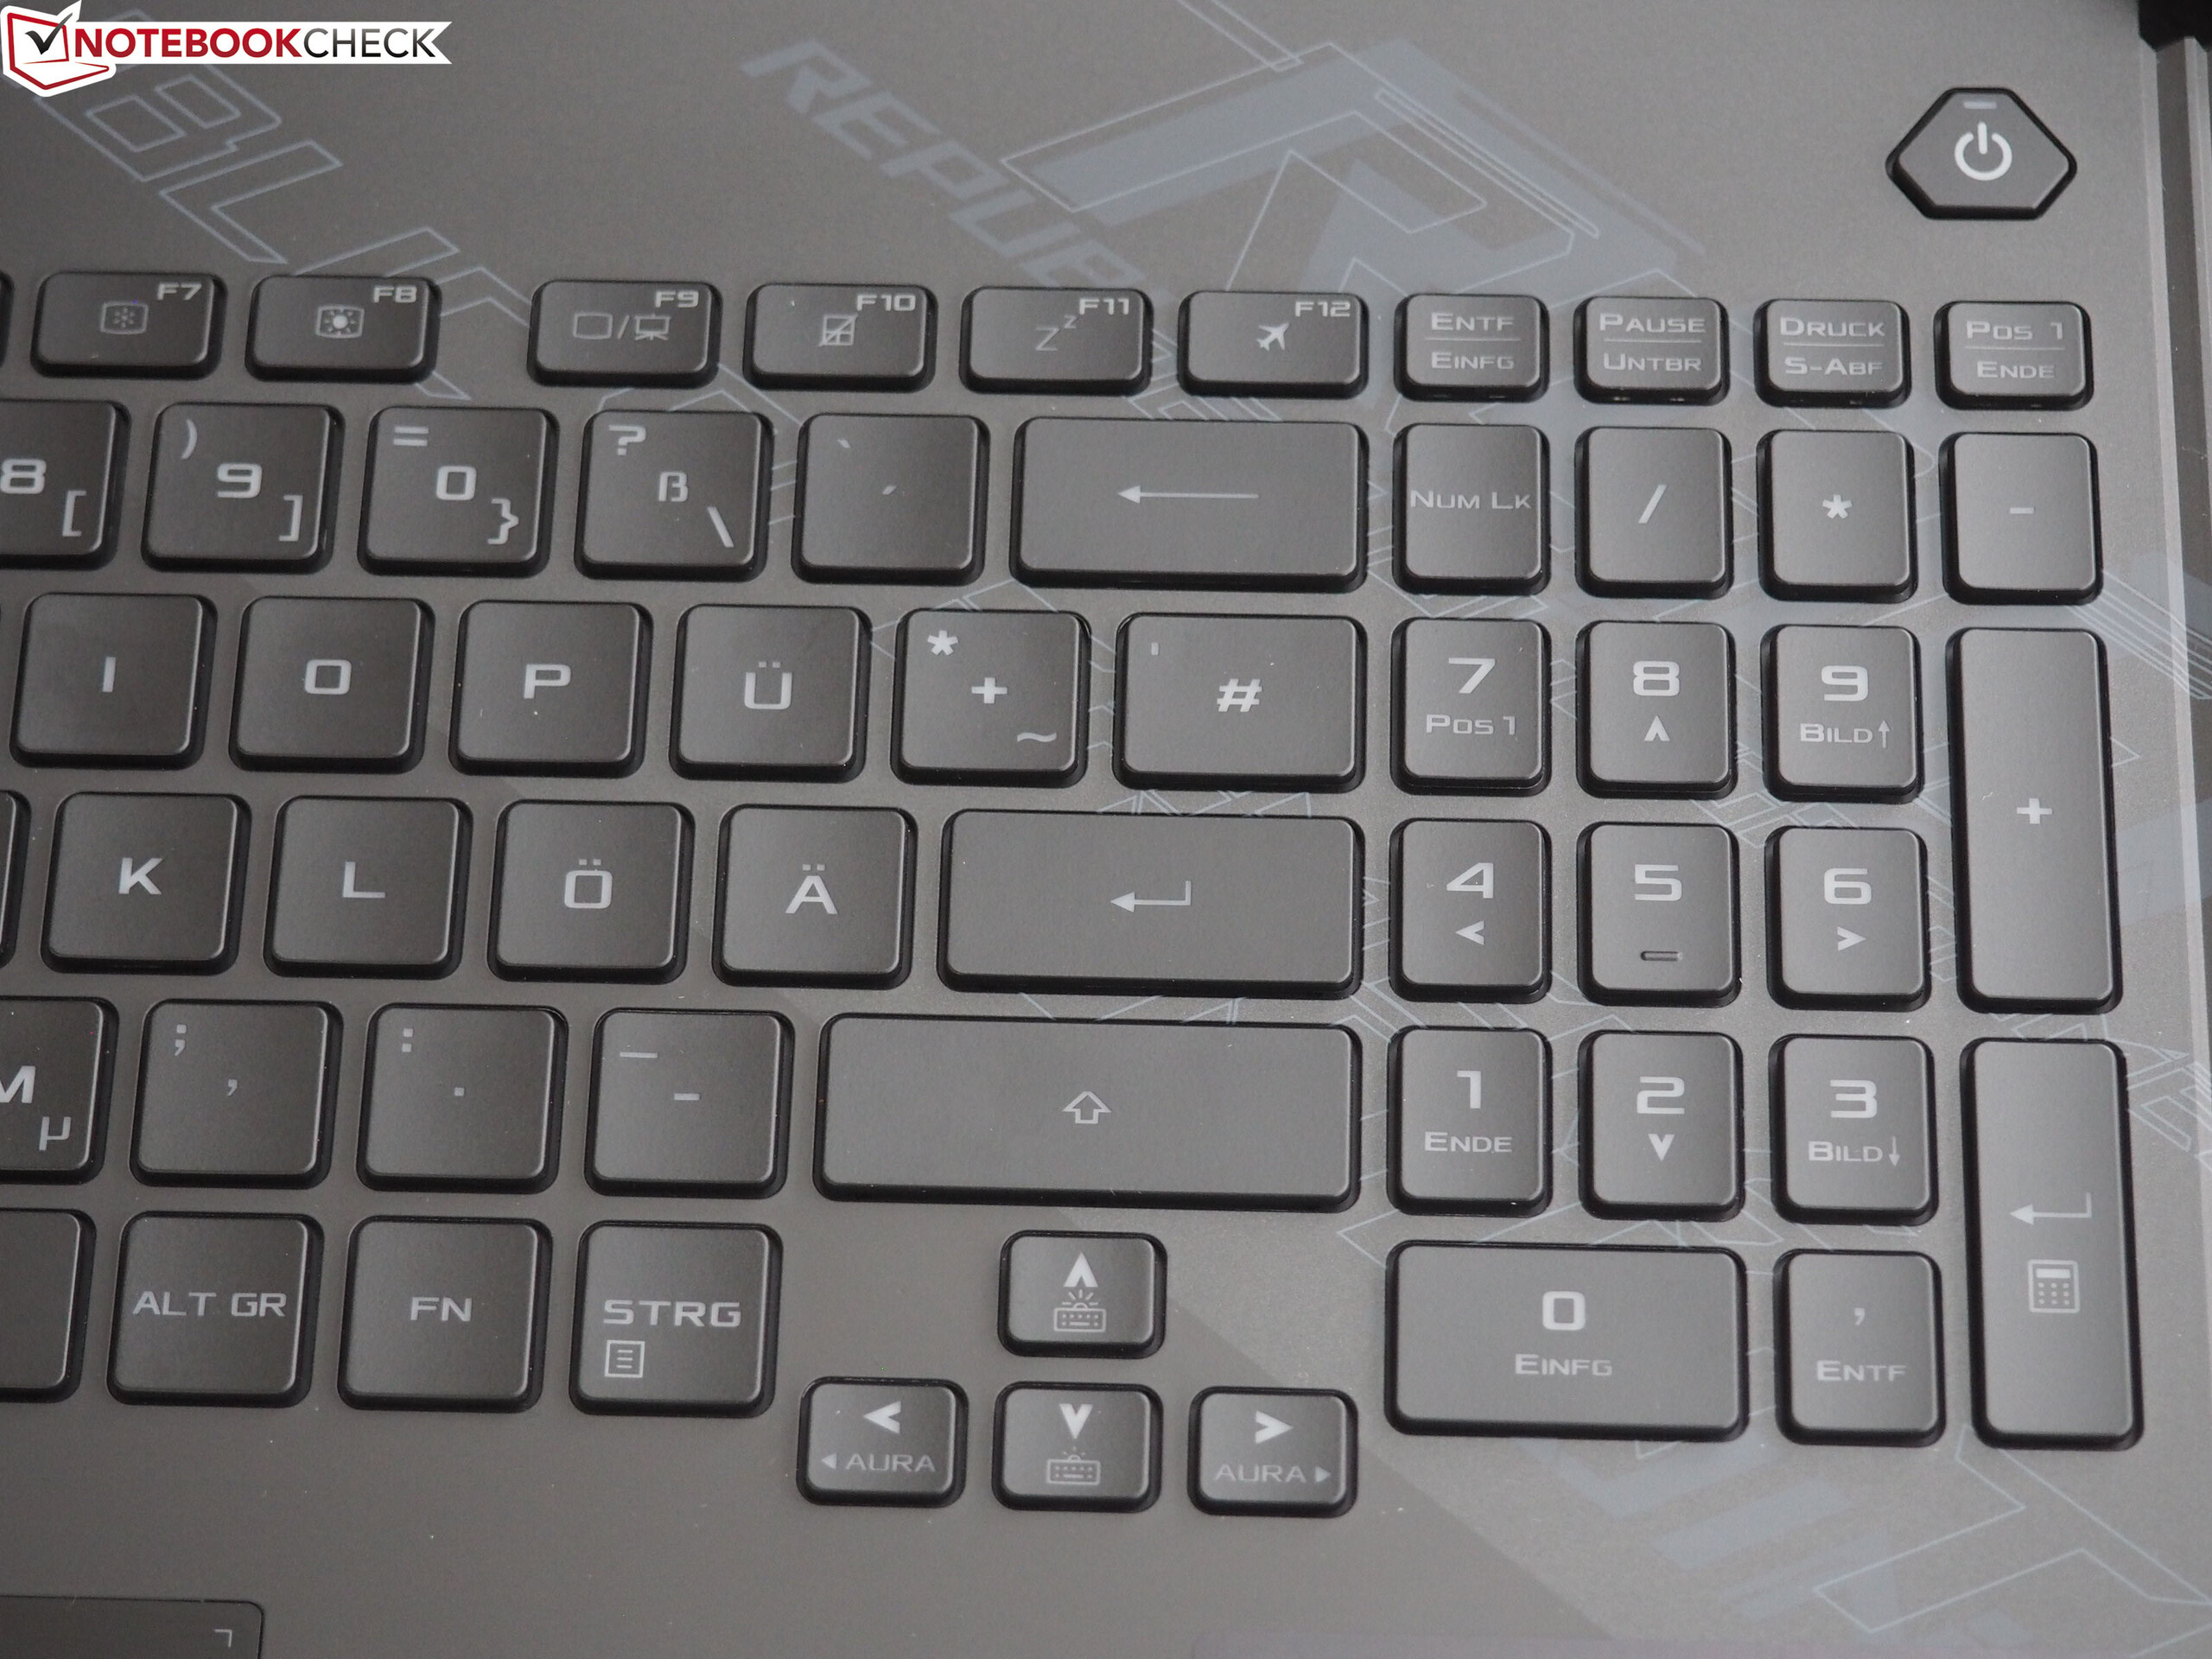
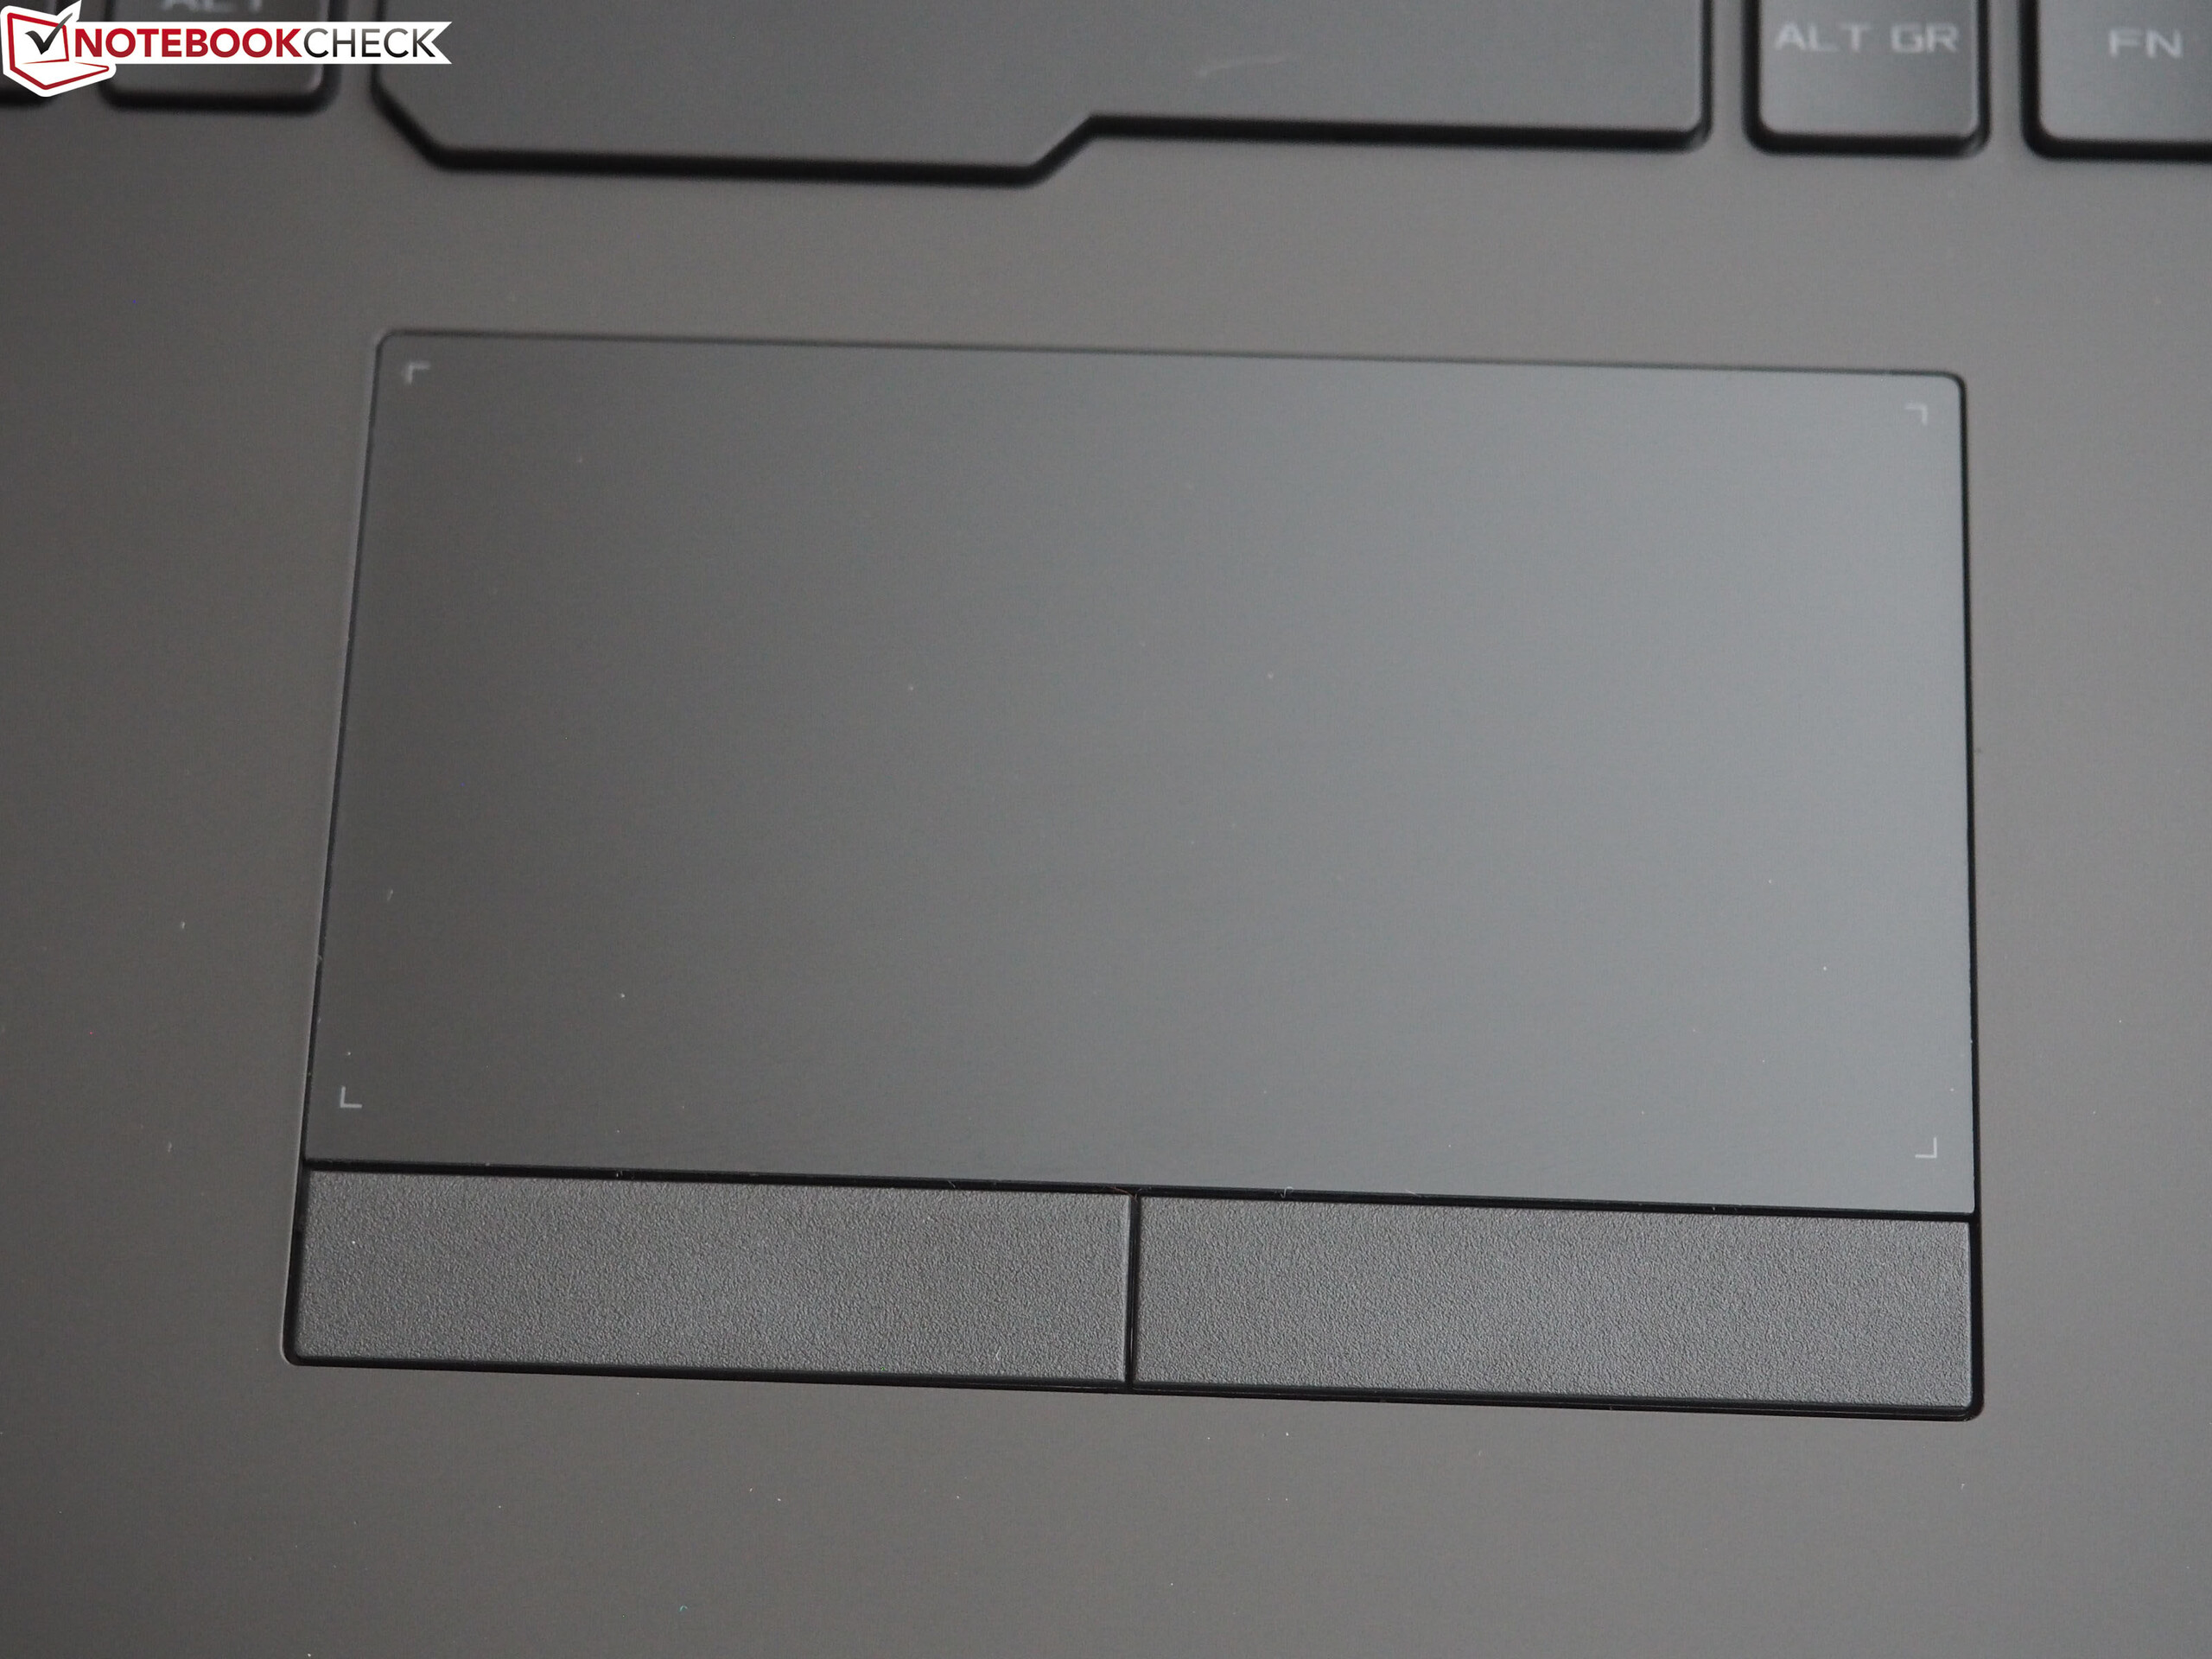
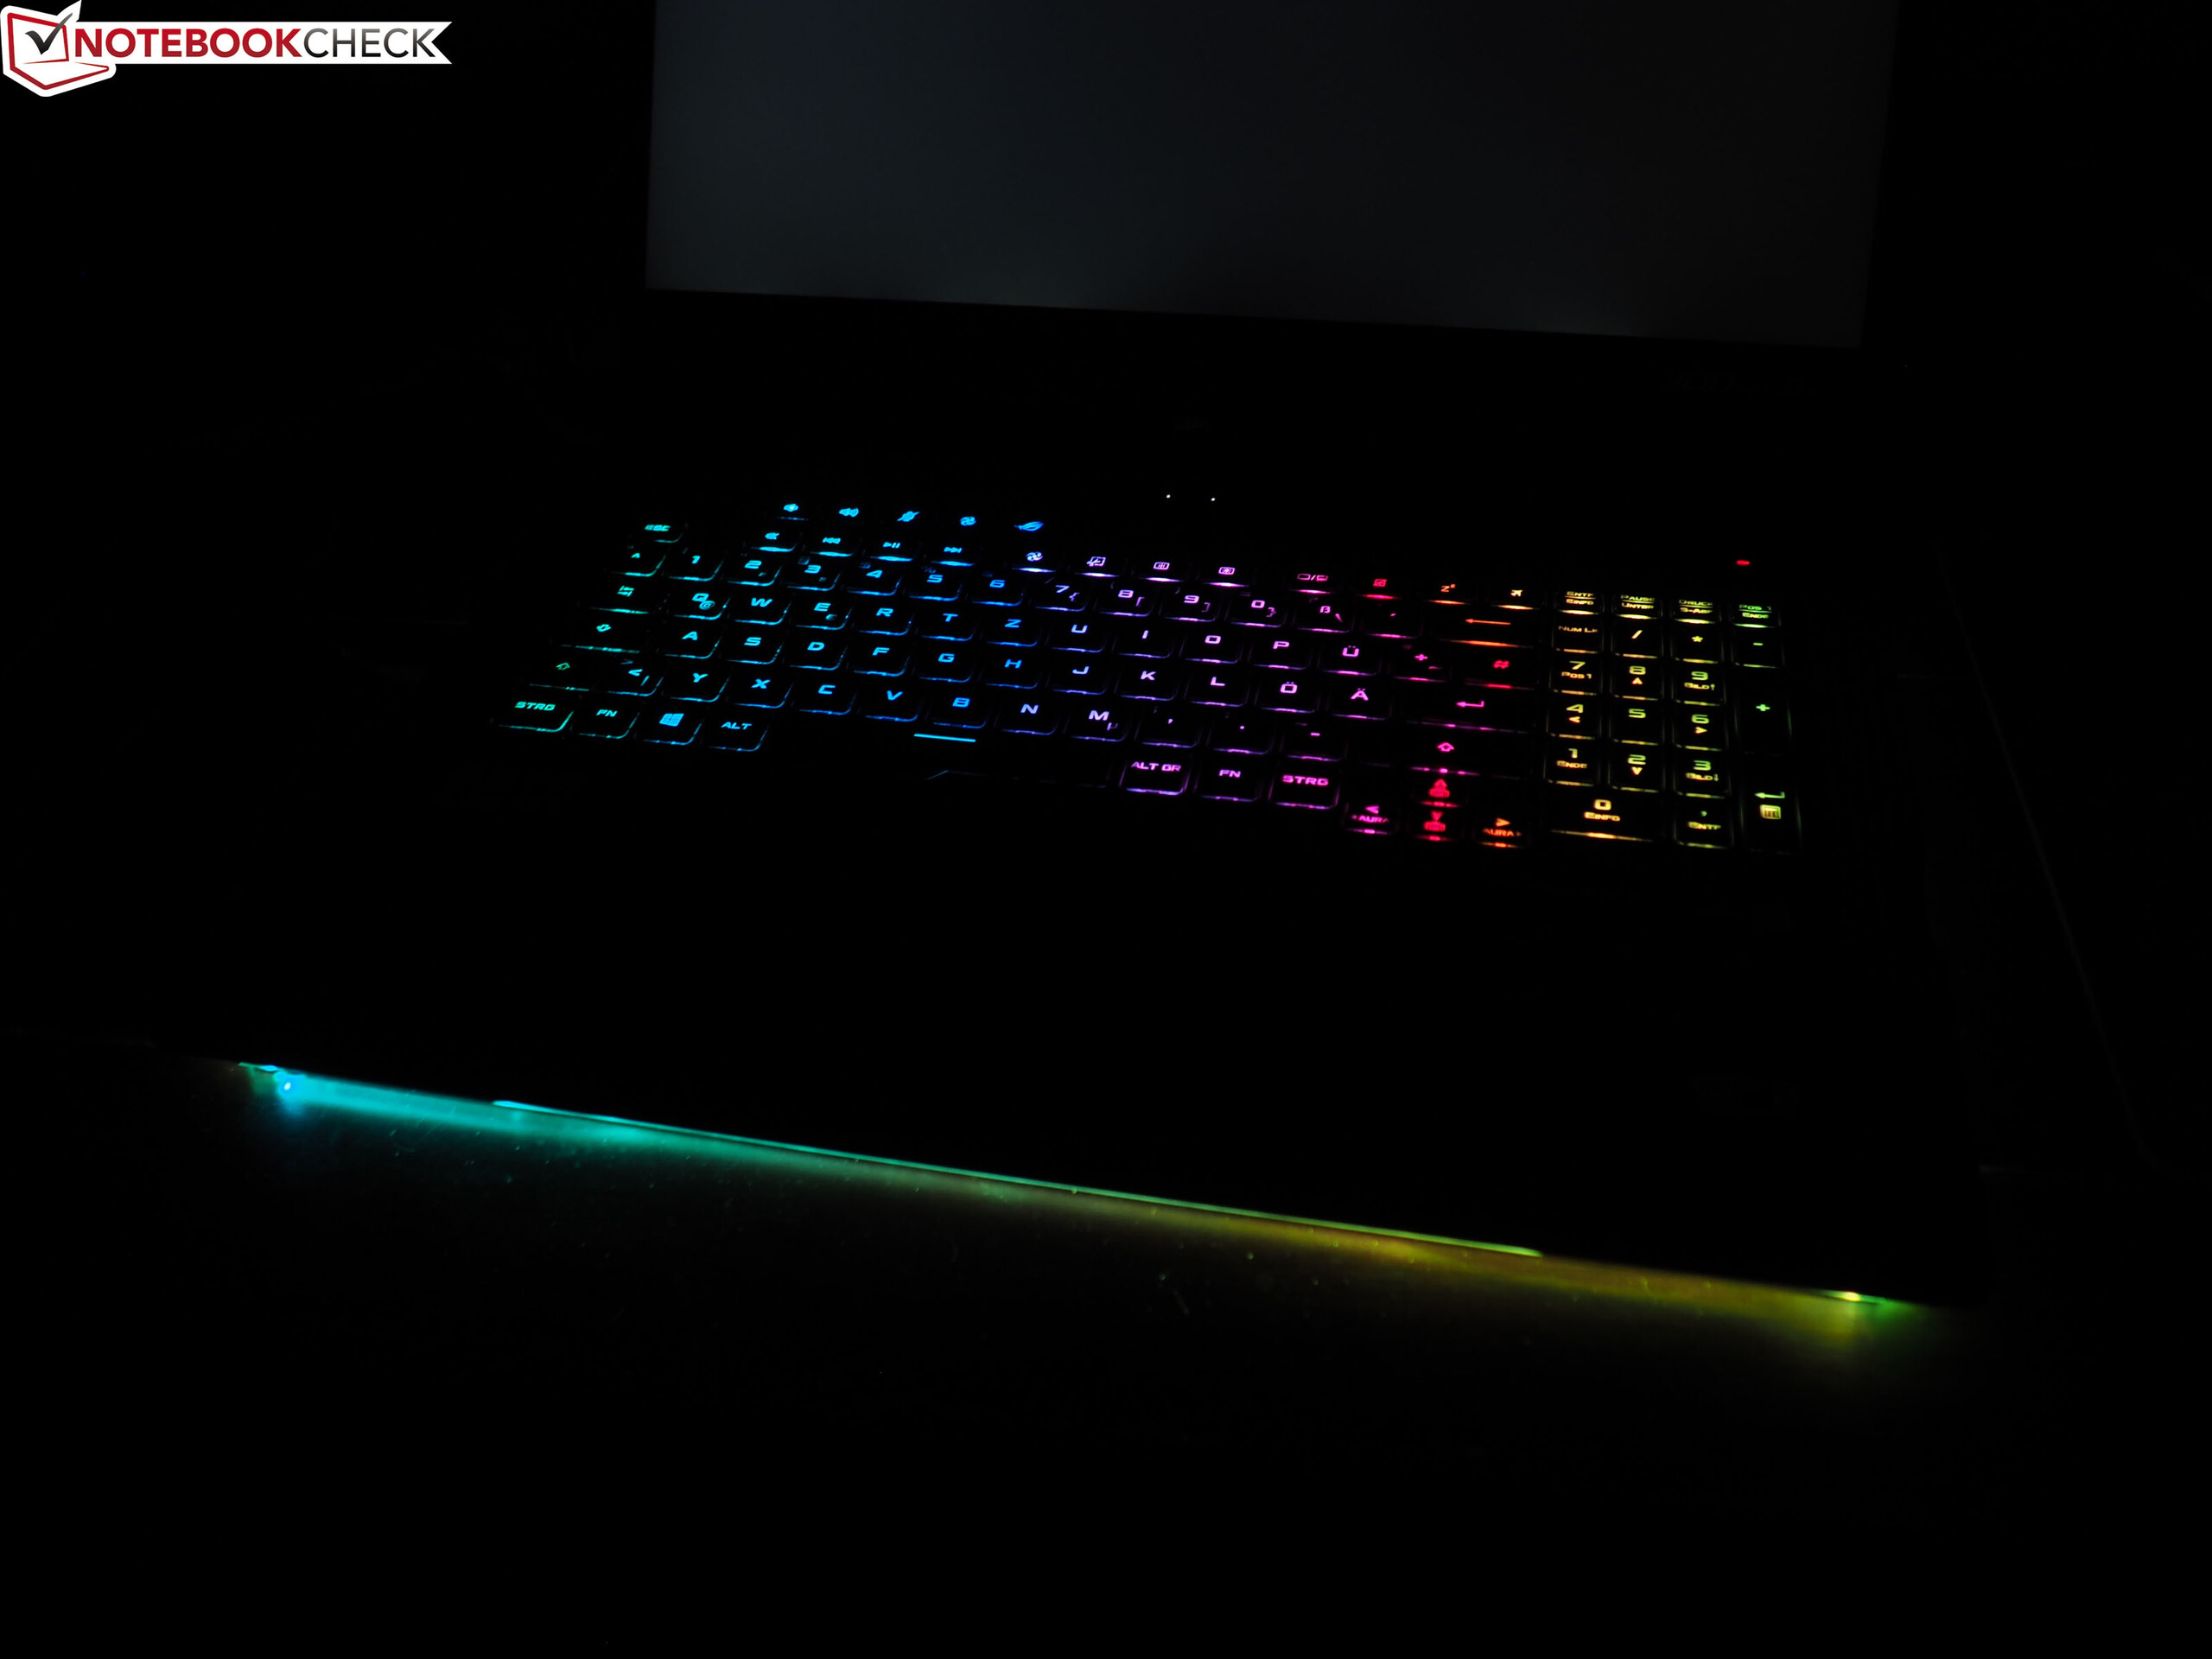
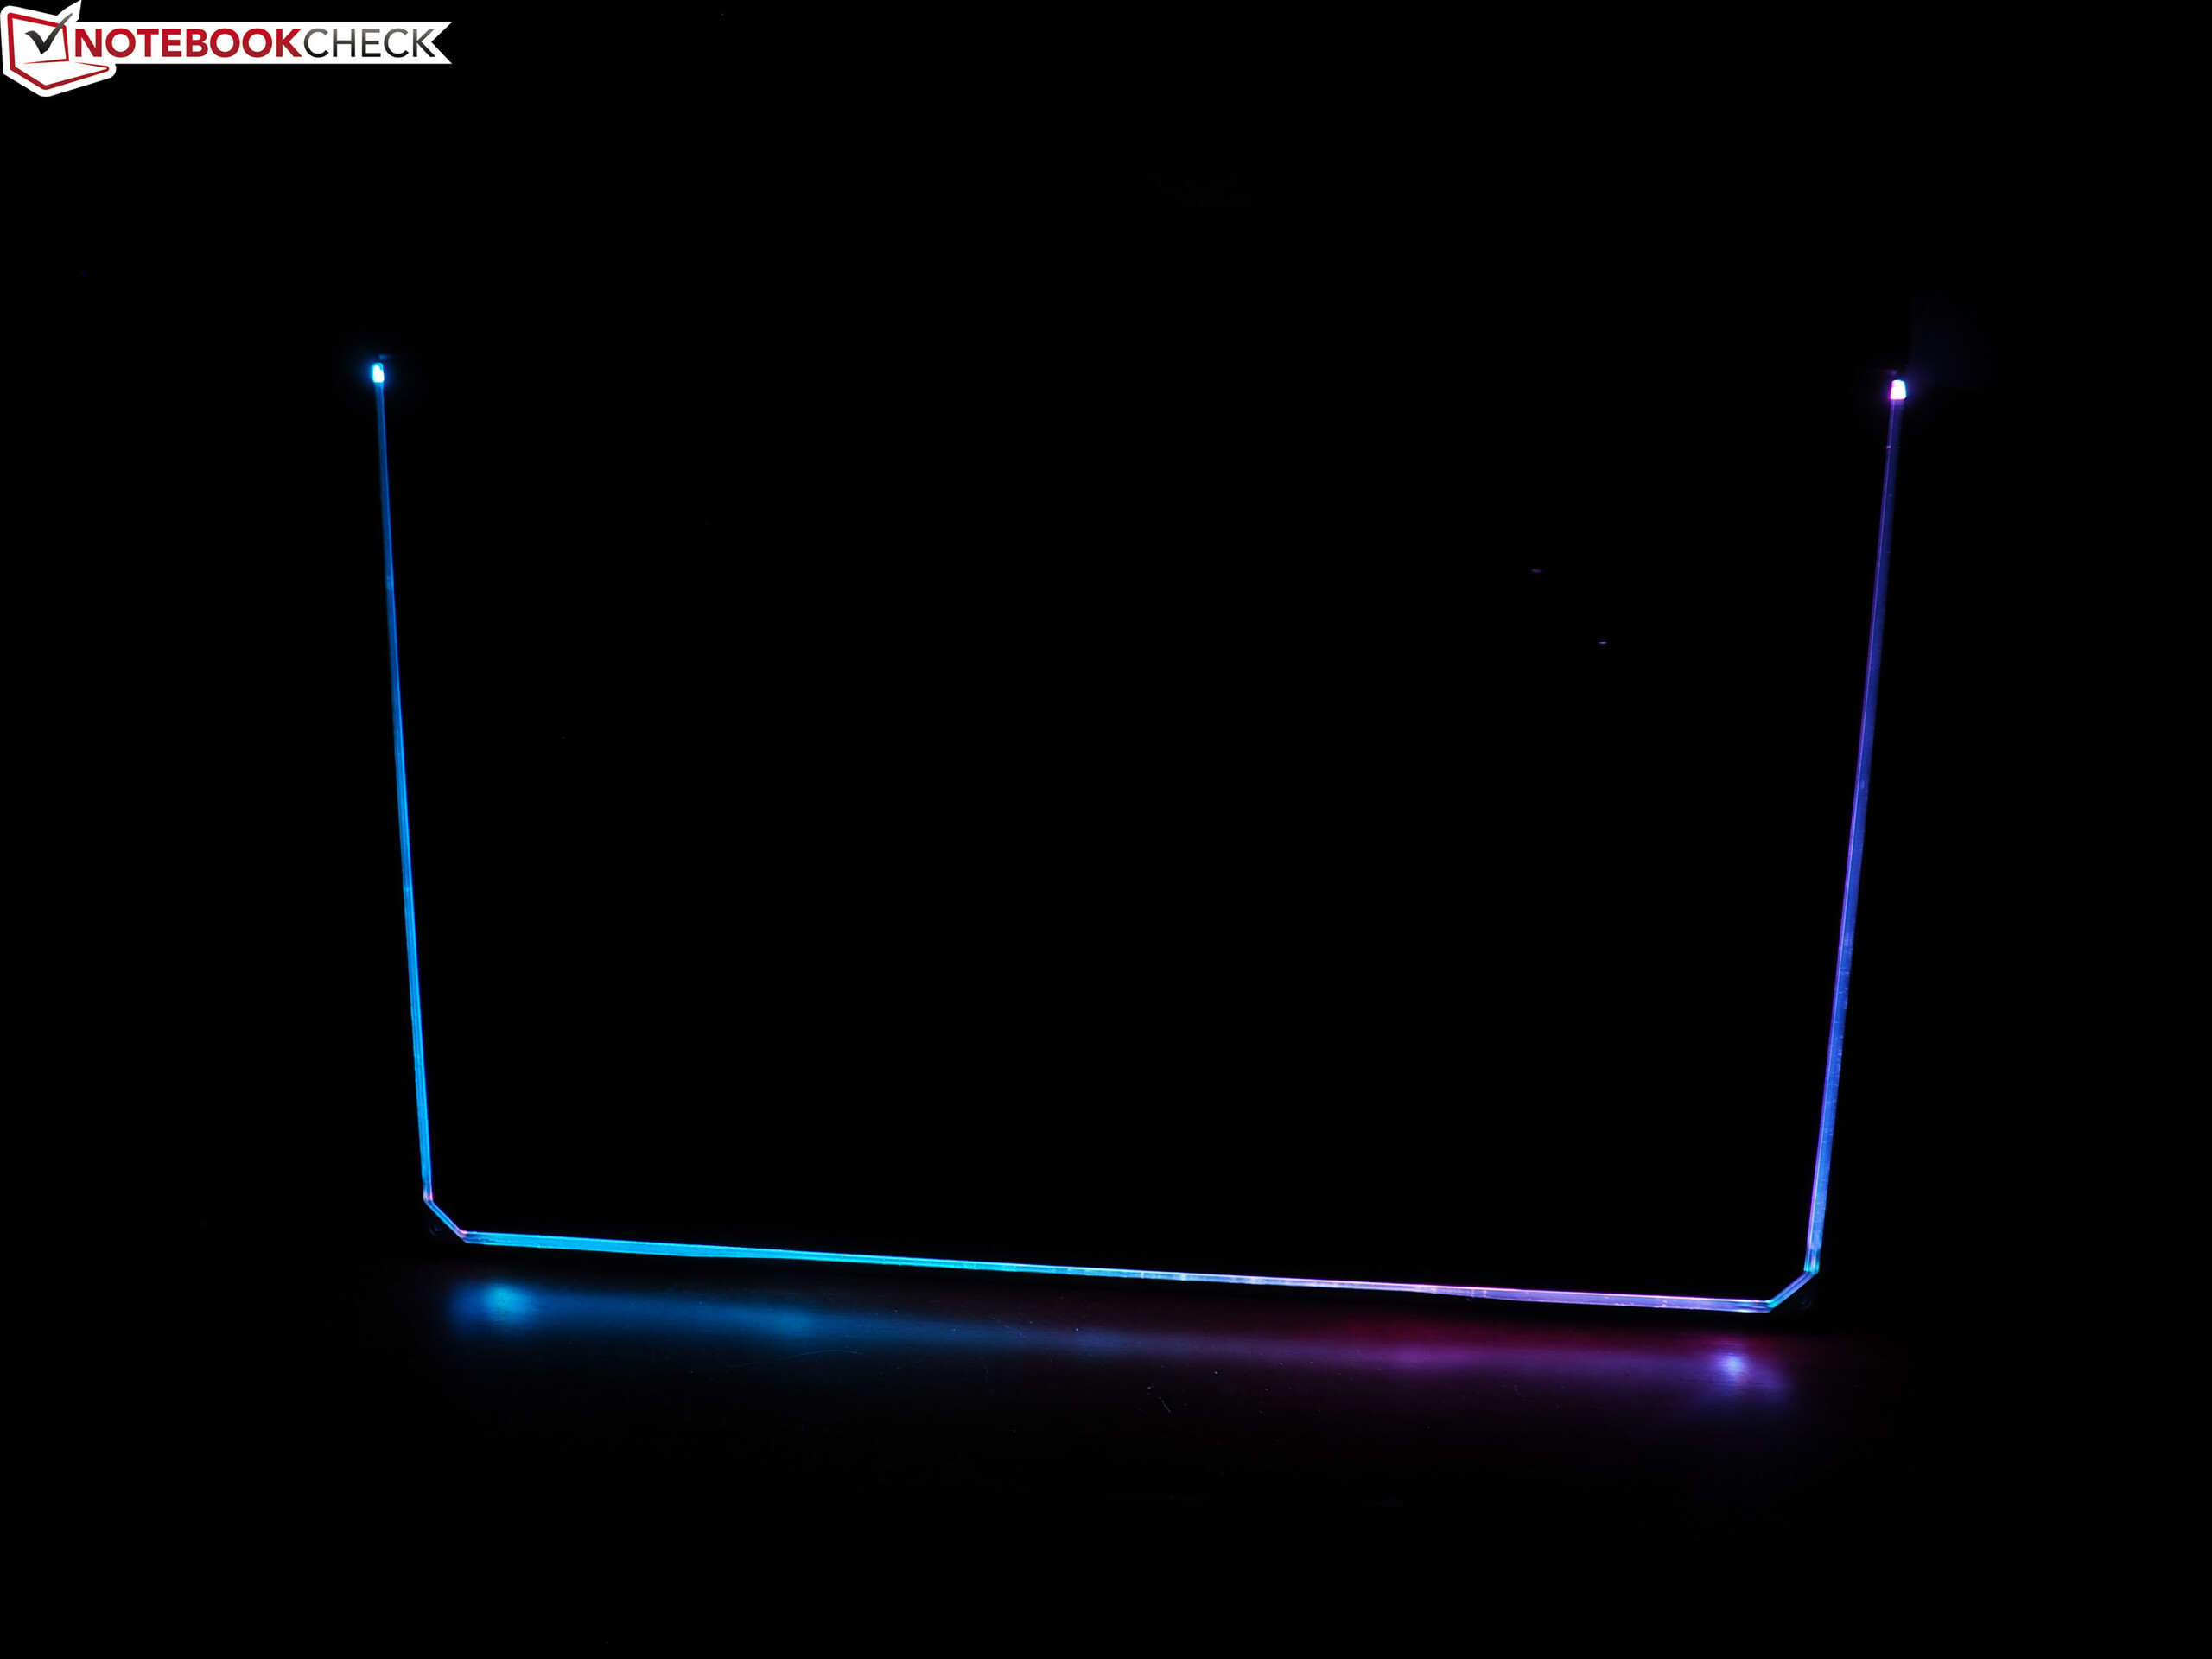
Fora isso, gostamos muito do dispositivo de 17 polegadas. O Scar 17 está à frente da maioria dos concorrentes em termos de tela (300 Hz!), Dispositivos de entrada, som e duração da bateria. No entanto, em vista da relação preço-desempenho, recomendamos um modelo mais barato com um Core i7-10875H e GeForce RTX 2070 (Super), que provavelmente também será mais frio e silencioso.
Asus Strix Scar 17 G732LXS
- 07/12/2020 v7 (old)
Florian Glaser
Price comparison