Breve Análise do Asus ROG Strix Hero III G731GW - um portátil colorido com compromissos

| |||||||||||||||||||||||||
iluminação: 80 %
iluminação com acumulador: 297.4 cd/m²
Contraste: 959:1 (Preto: 0.31 cd/m²)
ΔE ColorChecker Calman: 4.08 | ∀{0.5-29.43 Ø4.73}
calibrated: 4
ΔE Greyscale Calman: 4 | ∀{0.09-98 Ø4.97}
86% sRGB (Argyll 1.6.3 3D)
56% AdobeRGB 1998 (Argyll 1.6.3 3D)
62.9% AdobeRGB 1998 (Argyll 3D)
86.3% sRGB (Argyll 3D)
61.9% Display P3 (Argyll 3D)
Gamma: 2.259
CCT: 7205 K
| Asus ASUS ROG Strix SCAR III G731GW-XB74 AU Optronics AUO409D, IPS, 17.3", 1920x1080 | Acer Predator Triton 500 AU Optronics B156HAN08.2 (AUO82ED), IPS, 15.6", 1920x1080 | Alienware m17 P37E AU Optronics B173ZAN01.0, IPS, 17.3", 3840x2160 | HP Omen 15-dc1303ng LG Philips LGD05C0, IPS, 15.6", 1920x1080 | Aorus 15 X9 LG Philips LP156WFG-SPB2, IPS, 15.6", 1920x1080 | MSI GE75 8SF Chi Mei N173HCE-G33, IPS, 17.3", 1920x1080 | Eurocom Nightsky RX17 BOE NV173FHM-N44, IPS, 17.3", 1920x1080 | |
|---|---|---|---|---|---|---|---|
| Display | 5% | 38% | 5% | 7% | 5% | 7% | |
| Display P3 Coverage (%) | 61.9 | 64.2 4% | 86.4 40% | 63.8 3% | 64.9 5% | 63.1 2% | 66.1 7% |
| sRGB Coverage (%) | 86.3 | 92.6 7% | 99.9 16% | 93.4 8% | 95.6 11% | 94.4 9% | 93.1 8% |
| AdobeRGB 1998 Coverage (%) | 62.9 | 65.7 4% | 99.1 58% | 65 3% | 66.3 5% | 65.2 4% | 67.2 7% |
| Response Times | -4% | -268% | -45% | -59% | -12% | -59% | |
| Response Time Grey 50% / Grey 80% * (ms) | 7.2 ? | 8 ? -11% | 35.6 ? -394% | 14 ? -94% | 15.2 ? -111% | 9.6 ? -33% | 16.4 ? -128% |
| Response Time Black / White * (ms) | 11.6 ? | 11.2 ? 3% | 28 ? -141% | 11 ? 5% | 12.4 ? -7% | 10.4 ? 10% | 10.4 ? 10% |
| PWM Frequency (Hz) | 25770 ? | 990 ? | |||||
| Screen | 2% | -4% | 11% | 15% | 33% | 9% | |
| Brightness middle (cd/m²) | 297.4 | 304 2% | 357.9 20% | 316 6% | 305.1 3% | 370.4 25% | 298.4 0% |
| Brightness (cd/m²) | 306 | 299 -2% | 347 13% | 295 -4% | 295 -4% | 348 14% | 287 -6% |
| Brightness Distribution (%) | 80 | 89 11% | 94 18% | 84 5% | 78 -2% | 89 11% | 90 13% |
| Black Level * (cd/m²) | 0.31 | 0.27 13% | 0.33 -6% | 0.42 -35% | 0.33 -6% | 0.29 6% | 0.3 3% |
| Contrast (:1) | 959 | 1126 17% | 1085 13% | 752 -22% | 925 -4% | 1277 33% | 995 4% |
| Colorchecker dE 2000 * | 4.08 | 4.66 -14% | 6.57 -61% | 2.7 34% | 2.58 37% | 1.26 69% | 3.58 12% |
| Colorchecker dE 2000 max. * | 6.88 | 9.65 -40% | 9.86 -43% | 5.65 18% | 4.32 37% | 3.02 56% | 6.29 9% |
| Colorchecker dE 2000 calibrated * | 4 | 1.72 57% | 6.74 -69% | 1.58 60% | 1.33 67% | 1.21 70% | 2.82 29% |
| Greyscale dE 2000 * | 4 | 5.53 -38% | 4.3 -8% | 2.35 41% | 3.4 15% | 1.4 65% | 3.1 22% |
| Gamma | 2.259 97% | 2.5 88% | 2.6 85% | 2.41 91% | 2.28 96% | 2.2 100% | 2.24 98% |
| CCT | 7205 90% | 8028 81% | 6403 102% | 6904 94% | 6374 102% | 6747 96% | 7064 92% |
| Color Space (Percent of AdobeRGB 1998) (%) | 56 | 60 7% | 88.4 58% | 60 7% | 60.7 8% | 59.7 7% | 60.2 8% |
| Color Space (Percent of sRGB) (%) | 86 | 93 8% | 100 16% | 93 8% | 95.2 11% | 94.4 10% | 92.7 8% |
| Média Total (Programa/Configurações) | 1% /
2% | -78% /
-29% | -10% /
3% | -12% /
4% | 9% /
22% | -14% /
0% |
* ... menor é melhor
Exibir tempos de resposta
| ↔ Tempo de resposta preto para branco | ||
|---|---|---|
| 11.6 ms ... ascensão ↗ e queda ↘ combinadas | ↗ 6.4 ms ascensão | 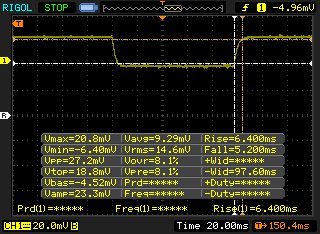 |
| ↘ 5.2 ms queda | ||
| A tela mostra boas taxas de resposta em nossos testes, mas pode ser muito lenta para jogadores competitivos. Em comparação, todos os dispositivos testados variam de 0.1 (mínimo) a 240 (máximo) ms. » 31 % de todos os dispositivos são melhores. Isso significa que o tempo de resposta medido é melhor que a média de todos os dispositivos testados (19.9 ms). | ||
| ↔ Tempo de resposta 50% cinza a 80% cinza | ||
| 7.2 ms ... ascensão ↗ e queda ↘ combinadas | ↗ 3.6 ms ascensão | 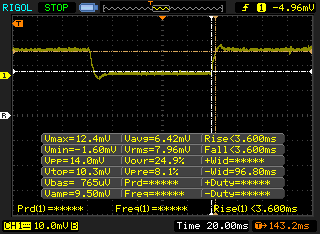 |
| ↘ 3.6 ms queda | ||
| A tela mostra taxas de resposta muito rápidas em nossos testes e deve ser muito adequada para jogos em ritmo acelerado. Em comparação, todos os dispositivos testados variam de 0.165 (mínimo) a 636 (máximo) ms. » 20 % de todos os dispositivos são melhores. Isso significa que o tempo de resposta medido é melhor que a média de todos os dispositivos testados (31.1 ms). | ||
Cintilação da tela / PWM (modulação por largura de pulso)
| Tela tremeluzindo / PWM não detectado | 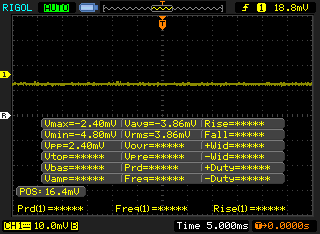 | ||
[pwm_comparison] Em comparação: 52 % de todos os dispositivos testados não usam PWM para escurecer a tela. Se PWM foi detectado, uma média de 7791 (mínimo: 5 - máximo: 343500) Hz foi medida. | |||
| Cinebench R10 | |
| Rendering Multiple CPUs 32Bit | |
| Média da turma Gaming (42932 - 81339, n=8, últimos 2 anos) | |
| Dell G5 15 5590 | |
| Média Intel Core i7-9750H (28251 - 36304, n=13) | |
| Asus TUF FX705DY-AU072 | |
| Rendering Single 32Bit | |
| Média da turma Gaming (7457 - 11779, n=8, últimos 2 anos) | |
| Asus TUF FX705DY-AU072 | |
| Média Intel Core i7-9750H (6659 - 7214, n=13) | |
| Dell G5 15 5590 | |
| PCMark 8 Home Score Accelerated v2 | 4460 pontos | |
| PCMark 8 Work Score Accelerated v2 | 5764 pontos | |
| PCMark 10 Score | 5834 pontos | |
Ajuda | ||
| Asus ASUS ROG Strix SCAR III G731GW-XB74 Intel SSD 660p 1TB SSDPEKNW010T8 | Acer Predator Triton 500 2x WDC PC SN720 SDAPNTW-256G-1014 (RAID 0) | Alienware m17 P37E SK Hynix PC401 512GB M.2 (HFS512GD9TNG) | HP Omen 15-dc1303ng Samsung SSD PM981 MZVLB256HAHQ | Aorus 15 X9 Intel SSD 760p SSDPEKKW512G8 | MSI GE75 8SF Kingston RBUSNS8154P3256GJ1 | Eurocom Nightsky RX17 2x Samsung SSD 970 Pro 512GB (RAID 0) | Média Intel SSD 660p 1TB SSDPEKNW010T8 | |
|---|---|---|---|---|---|---|---|---|
| AS SSD | 67% | 1% | 48% | 23% | -27% | 67% | 9% | |
| Seq Read (MB/s) | 1427 | 2913 104% | 1835 29% | 2485 74% | 1912 34% | 949 -33% | 2297 61% | 1456 ? 2% |
| Seq Write (MB/s) | 1610 | 2492 55% | 1121 -30% | 1575 -2% | 1553 -4% | 823 -49% | 2860 78% | 1404 ? -13% |
| 4K Read (MB/s) | 25.63 | 38.7 51% | 23.98 -6% | 53.4 108% | 56.5 120% | 25.36 -1% | 52.2 104% | 48.7 ? 90% |
| 4K Write (MB/s) | 84.2 | 107.2 27% | 100 19% | 113.5 35% | 119.6 42% | 67.1 -20% | 125.8 49% | 131.6 ? 56% |
| 4K-64 Read (MB/s) | 588 | 1228 109% | 687 17% | 725 23% | 869 48% | 748 27% | 1412 140% | 586 ? 0% |
| 4K-64 Write (MB/s) | 732 | 1079 47% | 776 6% | 1371 87% | 584 -20% | 650 -11% | 1228 68% | 788 ? 8% |
| Access Time Read * (ms) | 0.054 | 0.047 13% | 0.059 -9% | 0.049 9% | 0.173 -220% | 0.04 26% | 0.07236 ? -34% | |
| Access Time Write * (ms) | 0.071 | 0.035 51% | 0.053 25% | 0.032 55% | 0.031 56% | 0.059 17% | 0.09 -27% | 0.07731 ? -9% |
| Score Read (Points) | 756 | 1558 106% | 895 18% | 1027 36% | 1116 48% | 869 15% | 1694 124% | 780 ? 3% |
| Score Write (Points) | 978 | 1435 47% | 988 1% | 1642 68% | 859 -12% | 799 -18% | 1640 68% | 1060 ? 8% |
| Score Total (Points) | 2134 | 3770 77% | 2306 8% | 3163 48% | 2544 19% | 2109 -1% | 4235 98% | 2252 ? 6% |
| Copy ISO MB/s (MB/s) | 1489 | 773 -48% | 1329 -11% | 1121 -25% | 2514 69% | 1469 ? -1% | ||
| Copy Program MB/s (MB/s) | 514 | 493 -4% | 404.3 -21% | 532 4% | 592 15% | 484 ? -6% | ||
| Copy Game MB/s (MB/s) | 893 | 647 -28% | 1071 20% | 380.5 -57% | 1494 67% | 997 ? 12% | ||
| CrystalDiskMark 5.2 / 6 | 3% | -6% | -6% | 16% | -39% | 38% | -4% | |
| Write 4K (MB/s) | 130.1 | 93.6 -28% | 120.2 -8% | 50.2 -61% | 147.2 13% | 73.3 -44% | 133 2% | 144.5 ? 11% |
| Read 4K (MB/s) | 56 | 38.82 -31% | 44.3 -21% | 35.32 -37% | 63.7 14% | 33.35 -40% | 61.6 10% | 54.1 ? -3% |
| Write Seq (MB/s) | 2455 | 1278 | 991 | 1573 | 849 | 2935 | 1445 ? | |
| Read Seq (MB/s) | 2107 | 1389 | 1526 | 2602 | 964 | 3118 | 1446 ? | |
| Write 4K Q32T1 (MB/s) | 465.7 | 298.7 -36% | 436.2 -6% | 445.1 -4% | 531 14% | 236.2 -49% | 571 23% | 427 ? -8% |
| Read 4K Q32T1 (MB/s) | 547 | 338.7 -38% | 515 -6% | 526 -4% | 598 9% | 384.7 -30% | 654 20% | 456 ? -17% |
| Write Seq Q32T1 (MB/s) | 1766 | 2902 64% | 1157 -34% | 1647 -7% | 1592 -10% | 867 -51% | 3296 87% | 1650 ? -7% |
| Read Seq Q32T1 (MB/s) | 1922 | 3536 84% | 2671 39% | 3427 78% | 2981 55% | 1586 -17% | 3560 85% | 1728 ? -10% |
| Write 4K Q8T8 (MB/s) | 860 | 880 ? 2% | ||||||
| Read 4K Q8T8 (MB/s) | 628 | 629 ? 0% | ||||||
| Média Total (Programa/Configurações) | 35% /
43% | -3% /
-1% | 21% /
29% | 20% /
21% | -33% /
-30% | 53% /
58% | 3% /
4% |
* ... menor é melhor

| 3DMark 11 | |
| 1280x720 Performance GPU | |
| Média da turma Gaming (21841 - 80022, n=106, últimos 2 anos) | |
| Razer Blade Pro 17 RTX 2080 Max-Q | |
| Média NVIDIA GeForce RTX 2070 Mobile (23335 - 27298, n=21) | |
| Asus ASUS ROG Strix SCAR III G731GW-XB74 | |
| MSI WS75 9TL-636 | |
| Medion Erazer X15805 | |
| MSI GE65 Raider 9SE | |
| Asus ROG Strix G GL731GU-RB74 | |
| Apple MacBook Pro 15 2018 (2.9 GHz, Vega 20) | |
| Asus TUF FX705DY-AU072 | |
| 1280x720 Performance Combined | |
| Média da turma Gaming (10258 - 30851, n=106, últimos 2 anos) | |
| MSI WS75 9TL-636 | |
| Asus ROG Strix G GL731GU-RB74 | |
| Medion Erazer X15805 | |
| Média NVIDIA GeForce RTX 2070 Mobile (8716 - 16364, n=21) | |
| Razer Blade Pro 17 RTX 2080 Max-Q | |
| MSI GE65 Raider 9SE | |
| Asus ASUS ROG Strix SCAR III G731GW-XB74 | |
| Apple MacBook Pro 15 2018 (2.9 GHz, Vega 20) | |
| Asus TUF FX705DY-AU072 | |
| 3DMark 11 Performance | 19495 pontos | |
| 3DMark Ice Storm Standard Score | 118130 pontos | |
| 3DMark Cloud Gate Standard Score | 34236 pontos | |
| 3DMark Fire Strike Score | 16924 pontos | |
| 3DMark Fire Strike Extreme Score | 8686 pontos | |
| 3DMark Time Spy Score | 7261 pontos | |
Ajuda | ||
| The Witcher 3 - 1920x1080 Ultra Graphics & Postprocessing (HBAO+) | |
| Média da turma Gaming (95 - 240, n=8, últimos 2 anos) | |
| Acer Predator Triton 500 | |
| Alienware m17 P37E | |
| Média NVIDIA GeForce RTX 2070 Mobile (64 - 82.1, n=21) | |
| Eurocom Nightsky RX17 | |
| Aorus 15 X9 | |
| MSI GE75 8SF | |
| Asus ASUS ROG Strix SCAR III G731GW-XB74 | |
| baixo | média | alto | ultra | |
|---|---|---|---|---|
| The Witcher 3 (2015) | 64 | |||
| Fortnite (2018) | 236 | 190 | 140 | 132 |
| Final Fantasy XV Benchmark (2018) | 158 | 100 | 77 | |
| Shadow of the Tomb Raider (2018) | 105 | 97 | 93 | 85 |
| F1 2019 (2019) | 198 | 168 | 139 | 95 |
| Asus ASUS ROG Strix SCAR III G731GW-XB74 GeForce RTX 2070 Mobile, i7-9750H, Intel SSD 660p 1TB SSDPEKNW010T8 | Acer Predator Triton 500 GeForce RTX 2080 Max-Q, i7-8750H, 2x WDC PC SN720 SDAPNTW-256G-1014 (RAID 0) | Alienware m17 P37E GeForce RTX 2080 Max-Q, i9-8950HK, SK Hynix PC401 512GB M.2 (HFS512GD9TNG) | HP Omen 15-dc1303ng GeForce RTX 2070 Max-Q, i7-8750H, Samsung SSD PM981 MZVLB256HAHQ | Aorus 15 X9 GeForce RTX 2070 Mobile, i7-8750H, Intel SSD 760p SSDPEKKW512G8 | MSI GE75 8SF GeForce RTX 2070 Mobile, i7-8750H, Kingston RBUSNS8154P3256GJ1 | Eurocom Nightsky RX17 GeForce RTX 2070 Mobile, i7-9750H, 2x Samsung SSD 970 Pro 512GB (RAID 0) | |
|---|---|---|---|---|---|---|---|
| Noise | 2% | 2% | -3% | -4% | -3% | 2% | |
| desligado / ambiente * (dB) | 28.2 | 29 -3% | 28.2 -0% | 30.5 -8% | 28.2 -0% | 28.3 -0% | 28 1% |
| Idle Minimum * (dB) | 28.2 | 30 -6% | 28.2 -0% | 32.8 -16% | 32.6 -16% | 33.5 -19% | 28 1% |
| Idle Average * (dB) | 28.5 | 32 -12% | 28.2 1% | 32.8 -15% | 32.7 -15% | 33.6 -18% | 28.4 -0% |
| Idle Maximum * (dB) | 30 | 34 -13% | 31 -3% | 32.8 -9% | 32.7 -9% | 35 -17% | 32.9 -10% |
| Load Average * (dB) | 51.5 | 44 15% | 50.8 1% | 42.5 17% | 38.9 24% | 38 26% | 45 13% |
| Witcher 3 ultra * (dB) | 55.3 | 46 17% | 50.8 8% | 51.8 6% | 50 10% | 53.2 4% | |
| Load Maximum * (dB) | 55.3 | 47 15% | 50.8 8% | 47.5 14% | 64.1 -16% | 56.9 -3% | 53.2 4% |
* ... menor é melhor
Barulho
| Ocioso |
| 28.2 / 28.5 / 30 dB |
| Carga |
| 51.5 / 55.3 dB |
 | ||
30 dB silencioso 40 dB(A) audível 50 dB(A) ruidosamente alto |
||
min: | ||
(-) A temperatura máxima no lado superior é 45.2 °C / 113 F, em comparação com a média de 40.4 °C / 105 F , variando de 21.2 a 68.8 °C para a classe Gaming.
(-) A parte inferior aquece até um máximo de 52 °C / 126 F, em comparação com a média de 43.2 °C / 110 F
(+) Em uso inativo, a temperatura média para o lado superior é 29.1 °C / 84 F, em comparação com a média do dispositivo de 33.9 °C / ### class_avg_f### F.
(±) Jogando The Witcher 3, a temperatura média para o lado superior é 32.1 °C / 90 F, em comparação com a média do dispositivo de 33.9 °C / ## #class_avg_f### F.
(+) Os apoios para as mãos e o touchpad são mais frios que a temperatura da pele, com um máximo de 26.8 °C / 80.2 F e, portanto, são frios ao toque.
(±) A temperatura média da área do apoio para as mãos de dispositivos semelhantes foi 28.8 °C / 83.8 F (+2 °C / 3.6 F).
MSI GE75 8SF análise de áudio
(+) | os alto-falantes podem tocar relativamente alto (###valor### dB)
Graves 100 - 315Hz
(±) | graves reduzidos - em média 13.7% menor que a mediana
(+) | o baixo é linear (6.8% delta para a frequência anterior)
Médios 400 - 2.000 Hz
(±) | médios reduzidos - em média 5.1% menor que a mediana
(±) | a linearidade dos médios é média (7.4% delta para frequência anterior)
Altos 2 - 16 kHz
(+) | agudos equilibrados - apenas 3.3% longe da mediana
(+) | os máximos são lineares (6.4% delta da frequência anterior)
Geral 100 - 16.000 Hz
(±) | a linearidade do som geral é média (16.2% diferença em relação à mediana)
Comparado com a mesma classe
» 40% de todos os dispositivos testados nesta classe foram melhores, 7% semelhantes, 54% piores
» O melhor teve um delta de 6%, a média foi 18%, o pior foi 132%
Comparado com todos os dispositivos testados
» 26% de todos os dispositivos testados foram melhores, 6% semelhantes, 68% piores
» O melhor teve um delta de 4%, a média foi 24%, o pior foi 134%
Alienware m17 P37E análise de áudio
(±) | o volume do alto-falante é médio, mas bom (###valor### dB)
Graves 100 - 315Hz
(±) | graves reduzidos - em média 11.4% menor que a mediana
(±) | a linearidade dos graves é média (12.4% delta para a frequência anterior)
Médios 400 - 2.000 Hz
(+) | médios equilibrados - apenas 3% longe da mediana
(+) | médios são lineares (6.1% delta para frequência anterior)
Altos 2 - 16 kHz
(+) | agudos equilibrados - apenas 4.3% longe da mediana
(+) | os máximos são lineares (5.2% delta da frequência anterior)
Geral 100 - 16.000 Hz
(+) | o som geral é linear (13.8% diferença em relação à mediana)
Comparado com a mesma classe
» 21% de todos os dispositivos testados nesta classe foram melhores, 7% semelhantes, 72% piores
» O melhor teve um delta de 6%, a média foi 18%, o pior foi 132%
Comparado com todos os dispositivos testados
» 15% de todos os dispositivos testados foram melhores, 4% semelhantes, 81% piores
» O melhor teve um delta de 4%, a média foi 24%, o pior foi 134%
| desligado | |
| Ocioso | |
| Carga |
|
Key:
min: | |
| Asus ASUS ROG Strix SCAR III G731GW-XB74 i7-9750H, GeForce RTX 2070 Mobile, Intel SSD 660p 1TB SSDPEKNW010T8, IPS, 1920x1080, 17.3" | Acer Predator Triton 500 i7-8750H, GeForce RTX 2080 Max-Q, 2x WDC PC SN720 SDAPNTW-256G-1014 (RAID 0), IPS, 1920x1080, 15.6" | Alienware m17 P37E i9-8950HK, GeForce RTX 2080 Max-Q, SK Hynix PC401 512GB M.2 (HFS512GD9TNG), IPS, 3840x2160, 17.3" | HP Omen 15-dc1303ng i7-8750H, GeForce RTX 2070 Max-Q, Samsung SSD PM981 MZVLB256HAHQ, IPS, 1920x1080, 15.6" | Aorus 15 X9 i7-8750H, GeForce RTX 2070 Mobile, Intel SSD 760p SSDPEKKW512G8, IPS, 1920x1080, 15.6" | MSI GE75 8SF i7-8750H, GeForce RTX 2070 Mobile, Kingston RBUSNS8154P3256GJ1, IPS, 1920x1080, 17.3" | Eurocom Nightsky RX17 i7-9750H, GeForce RTX 2070 Mobile, 2x Samsung SSD 970 Pro 512GB (RAID 0), IPS, 1920x1080, 17.3" | |
|---|---|---|---|---|---|---|---|
| Power Consumption | 17% | -6% | 30% | -7% | 11% | 11% | |
| Idle Minimum * (Watt) | 18.2 | 16 12% | 21.2 -16% | 14.7 19% | 26 -43% | 16.4 10% | 18.6 -2% |
| Idle Average * (Watt) | 23 | 22 4% | 29.6 -29% | 18.6 19% | 30.8 -34% | 21.9 5% | 22.6 2% |
| Idle Maximum * (Watt) | 33.1 | 32 3% | 34 -3% | 22.6 32% | 34.9 -5% | 25.4 23% | 23 31% |
| Load Average * (Watt) | 124.8 | 89 29% | 130.9 -5% | 90 28% | 90.7 27% | 90.7 27% | 93.4 25% |
| Witcher 3 ultra * (Watt) | 180.8 | 147 19% | 177.5 2% | 175 3% | 203.3 -12% | 186.4 -3% | |
| Load Maximum * (Watt) | 263 | 173 34% | 219.7 16% | 120 54% | 241.2 8% | 222.9 15% | 233.6 11% |
* ... menor é melhor
| Asus ASUS ROG Strix SCAR III G731GW-XB74 i7-9750H, GeForce RTX 2070 Mobile, 66 Wh | Acer Predator Triton 500 i7-8750H, GeForce RTX 2080 Max-Q, 82 Wh | Alienware m17 P37E i9-8950HK, GeForce RTX 2080 Max-Q, 90 Wh | HP Omen 15-dc1303ng i7-8750H, GeForce RTX 2070 Max-Q, 70 Wh | Aorus 15 X9 i7-8750H, GeForce RTX 2070 Mobile, 62 Wh | MSI GE75 8SF i7-8750H, GeForce RTX 2070 Mobile, 65 Wh | Eurocom Nightsky RX17 i7-9750H, GeForce RTX 2070 Mobile, 62 Wh | |
|---|---|---|---|---|---|---|---|
| Duração da bateria | 5% | 33% | -3% | -48% | -10% | -21% | |
| Reader / Idle (h) | 4.2 | 5.6 33% | 9.1 117% | 5 19% | 1.8 -57% | 4.2 0% | |
| WiFi v1.3 (h) | 3.9 | 3.2 -18% | 4.9 26% | 3.3 -15% | 1.6 -59% | 3.5 -10% | 2 -49% |
| Load (h) | 1.4 | 1.4 0% | 0.8 -43% | 1.2 -14% | 1 -29% | 1.2 -14% |
Pro
Contra

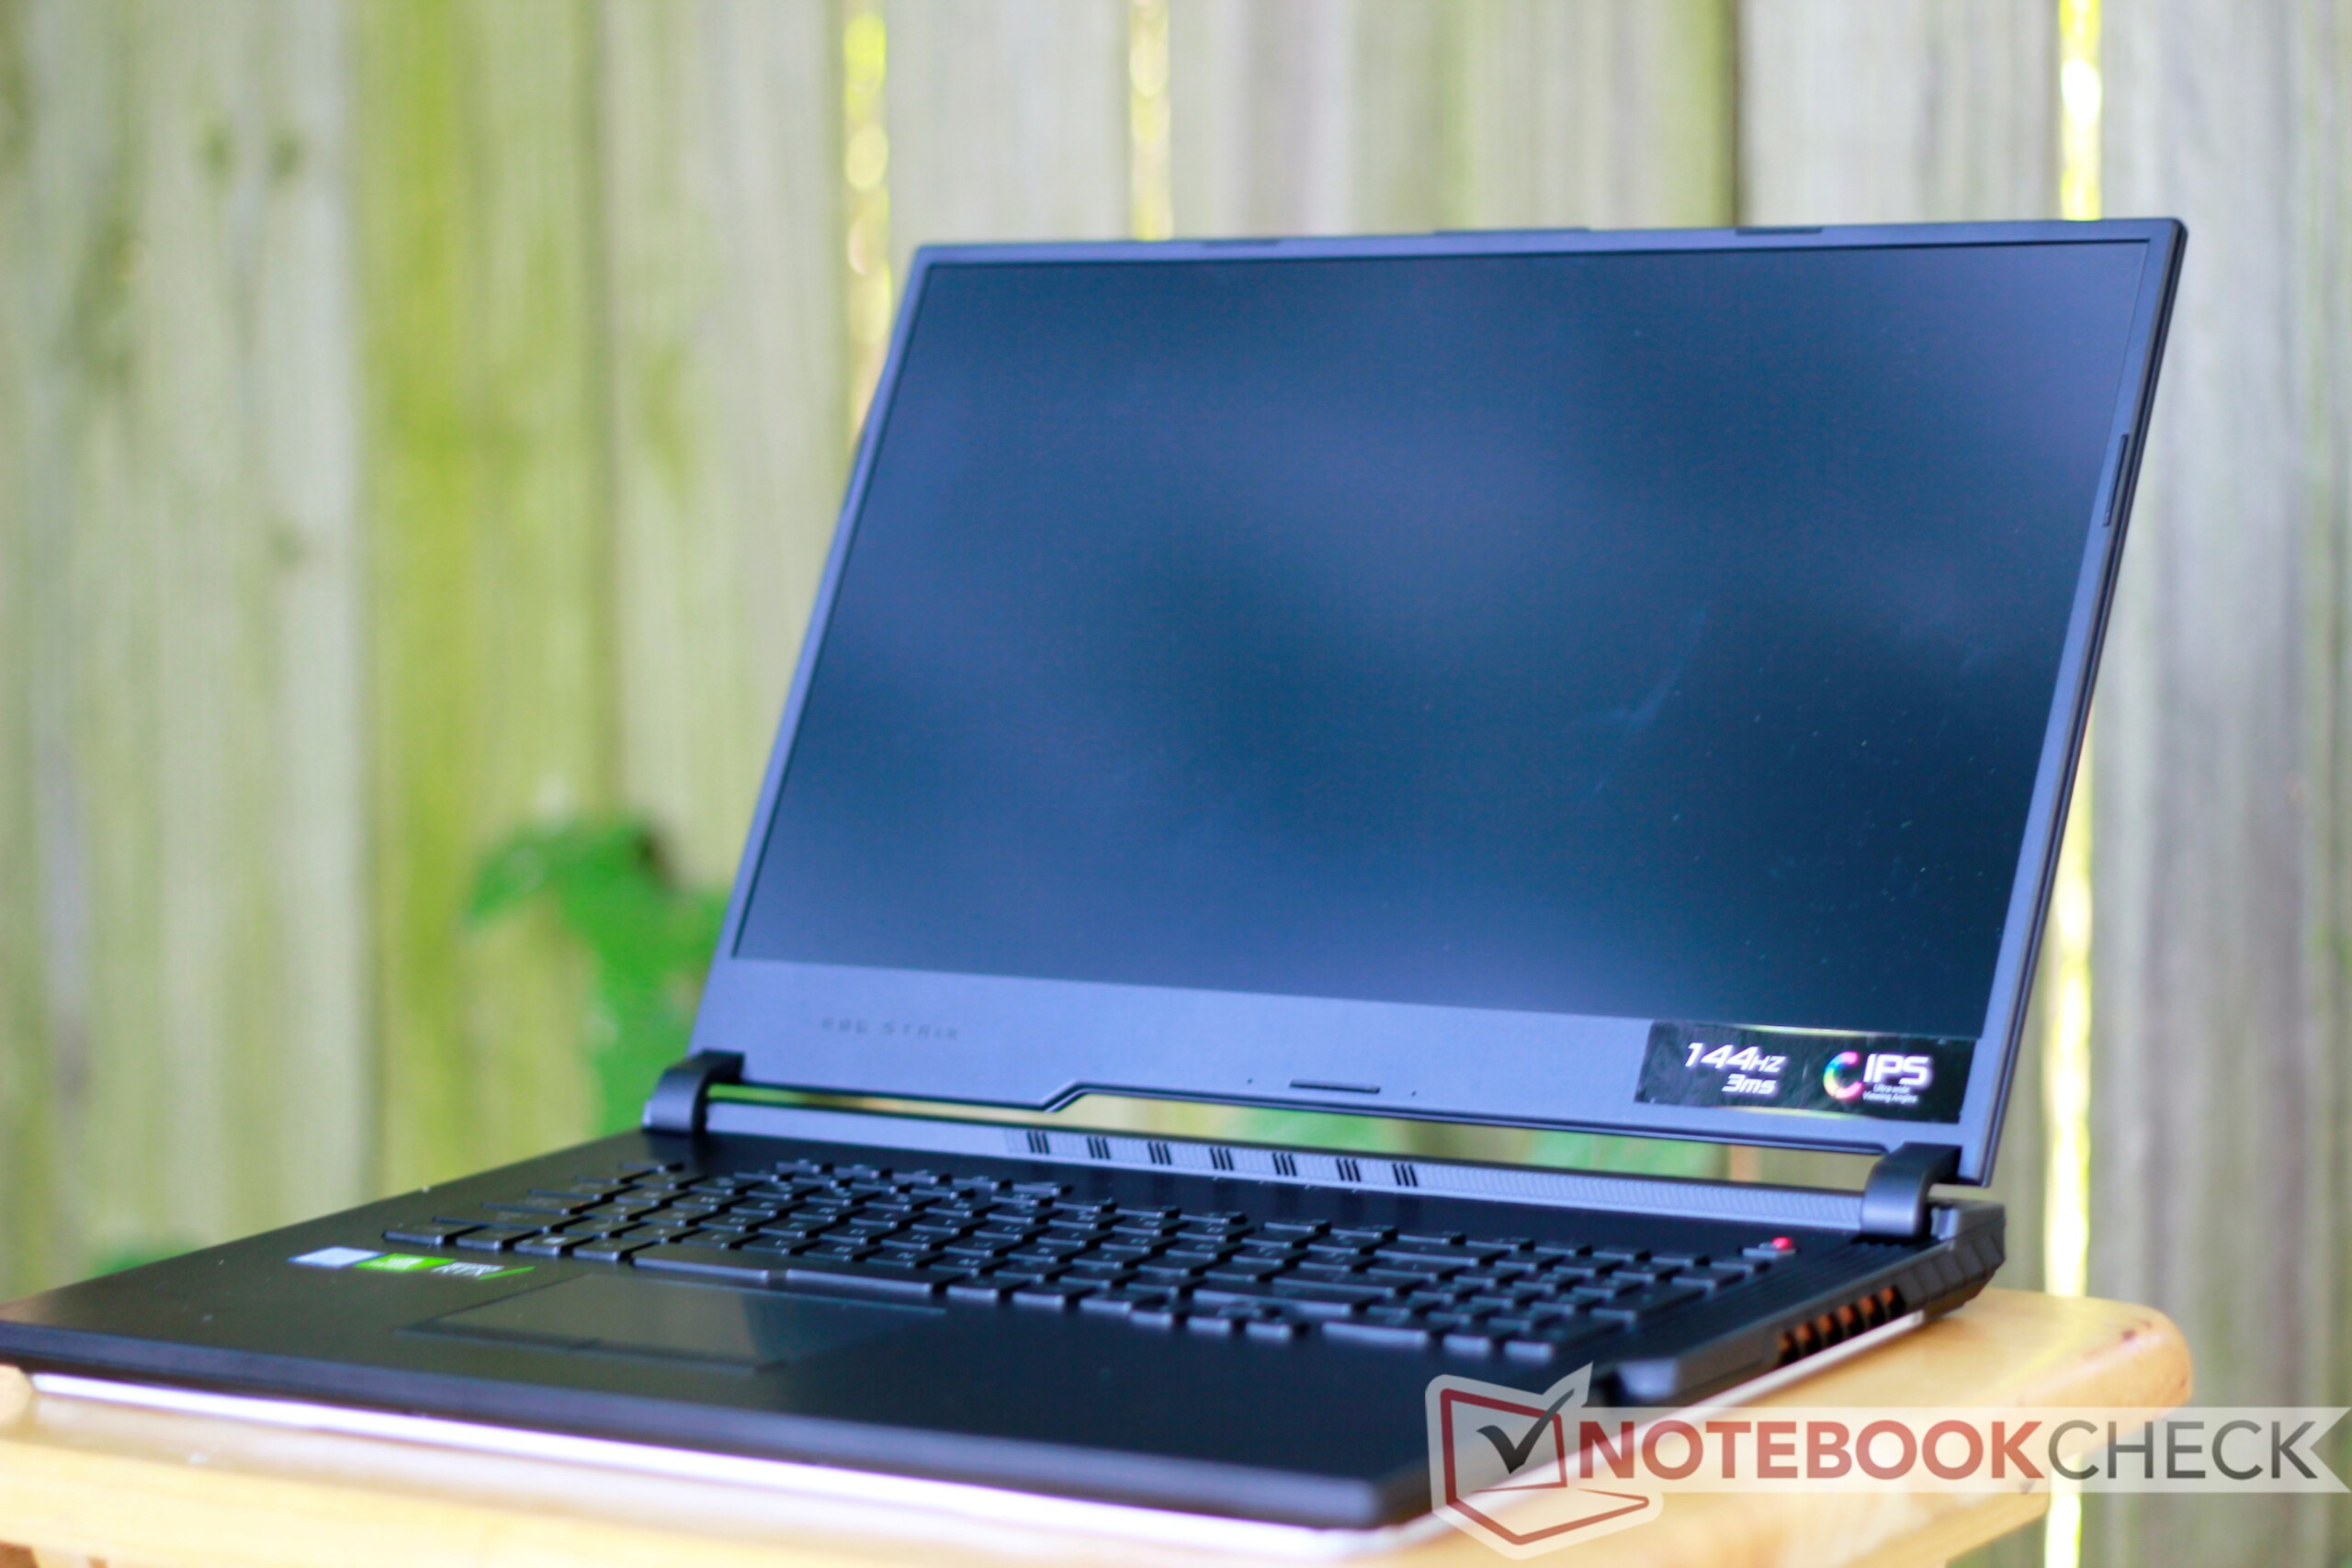
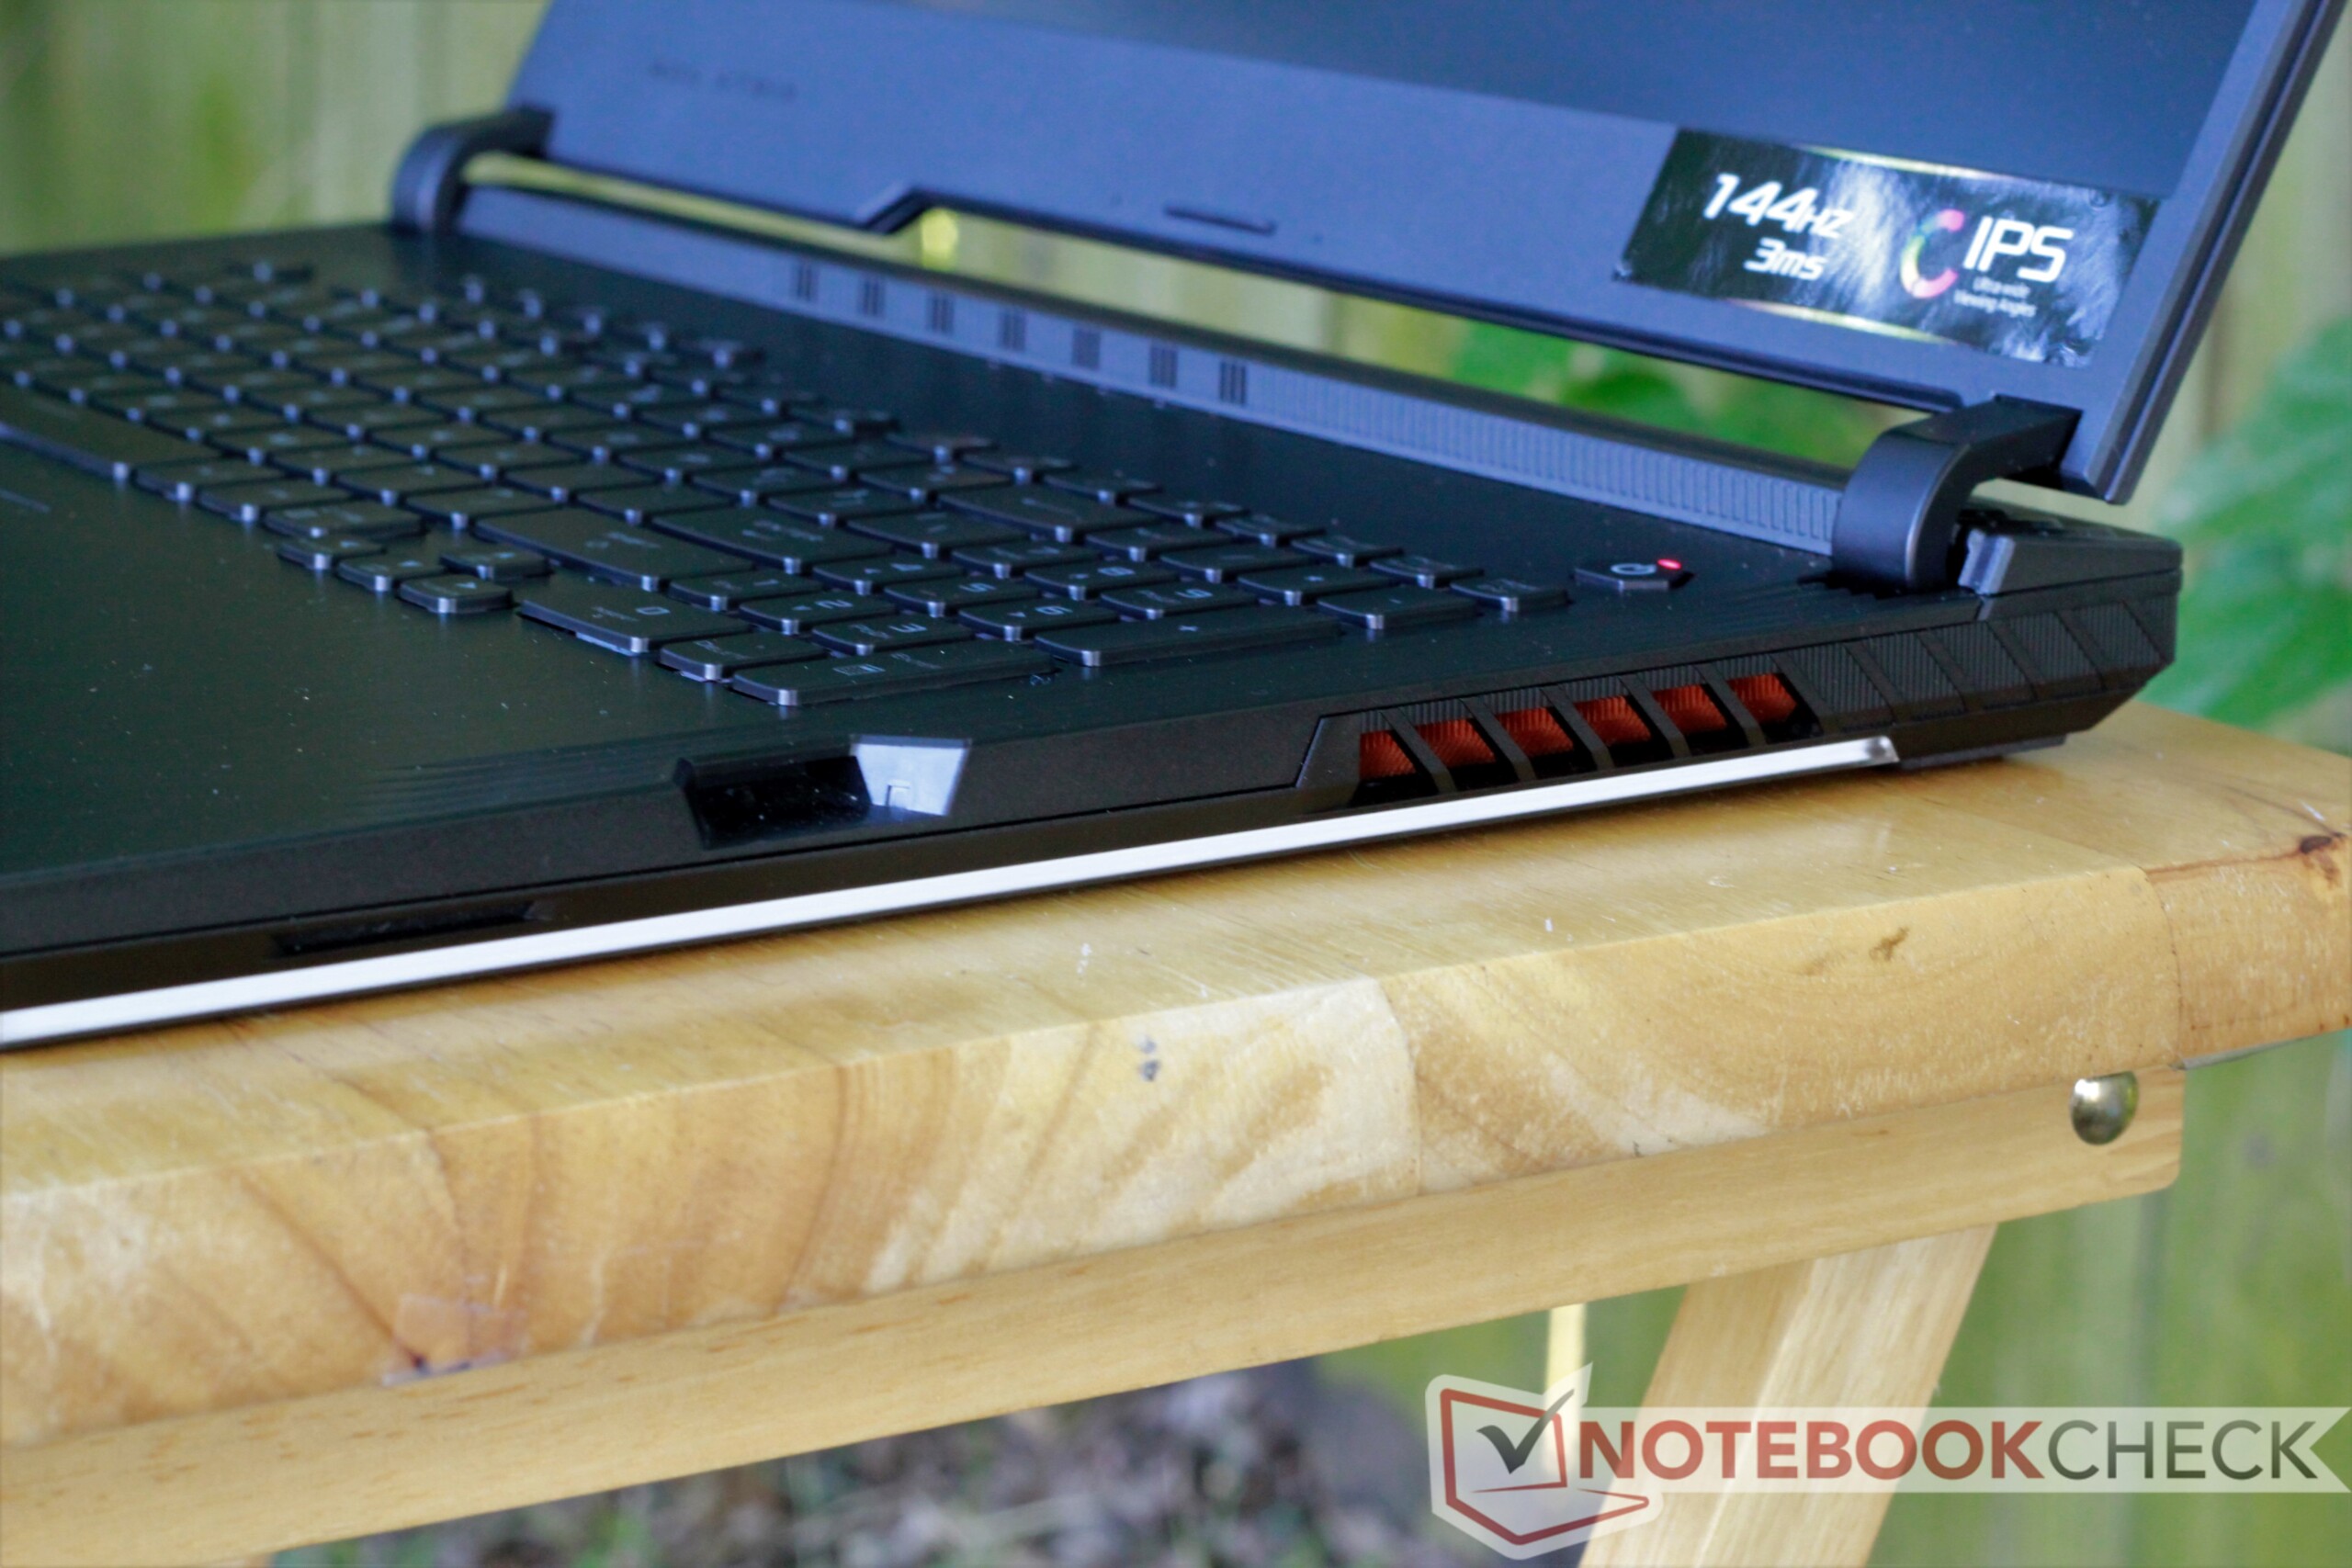
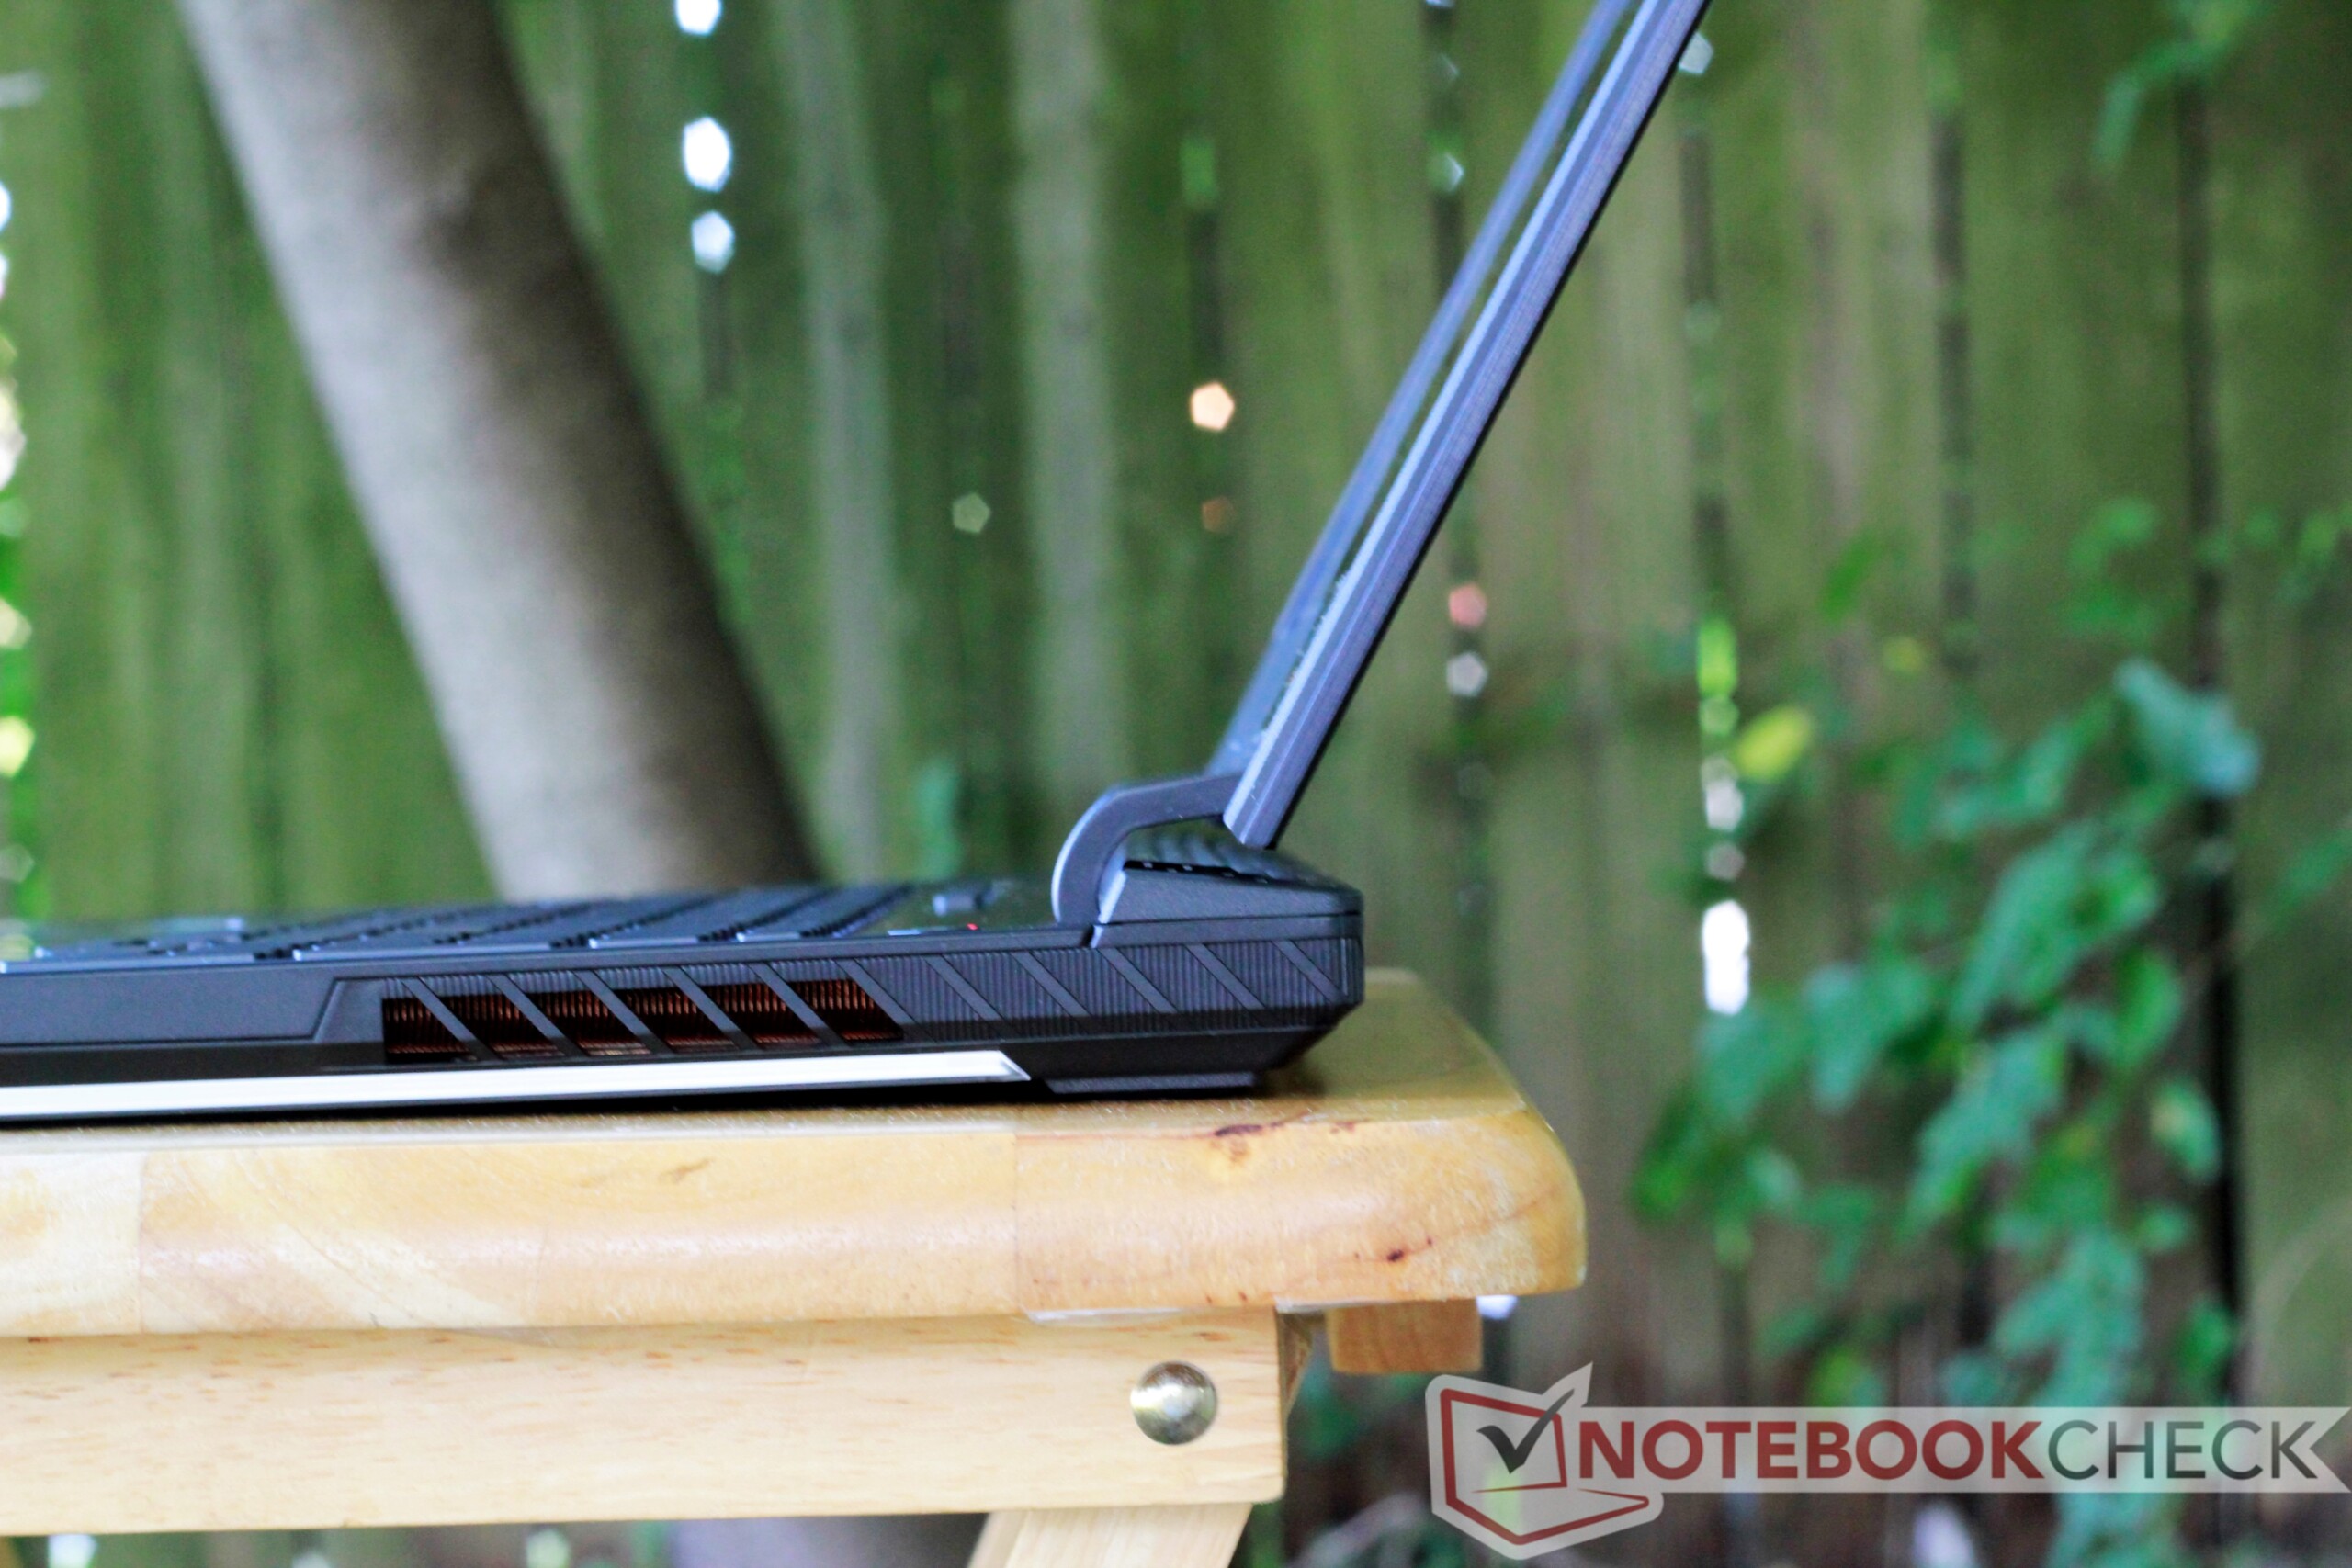
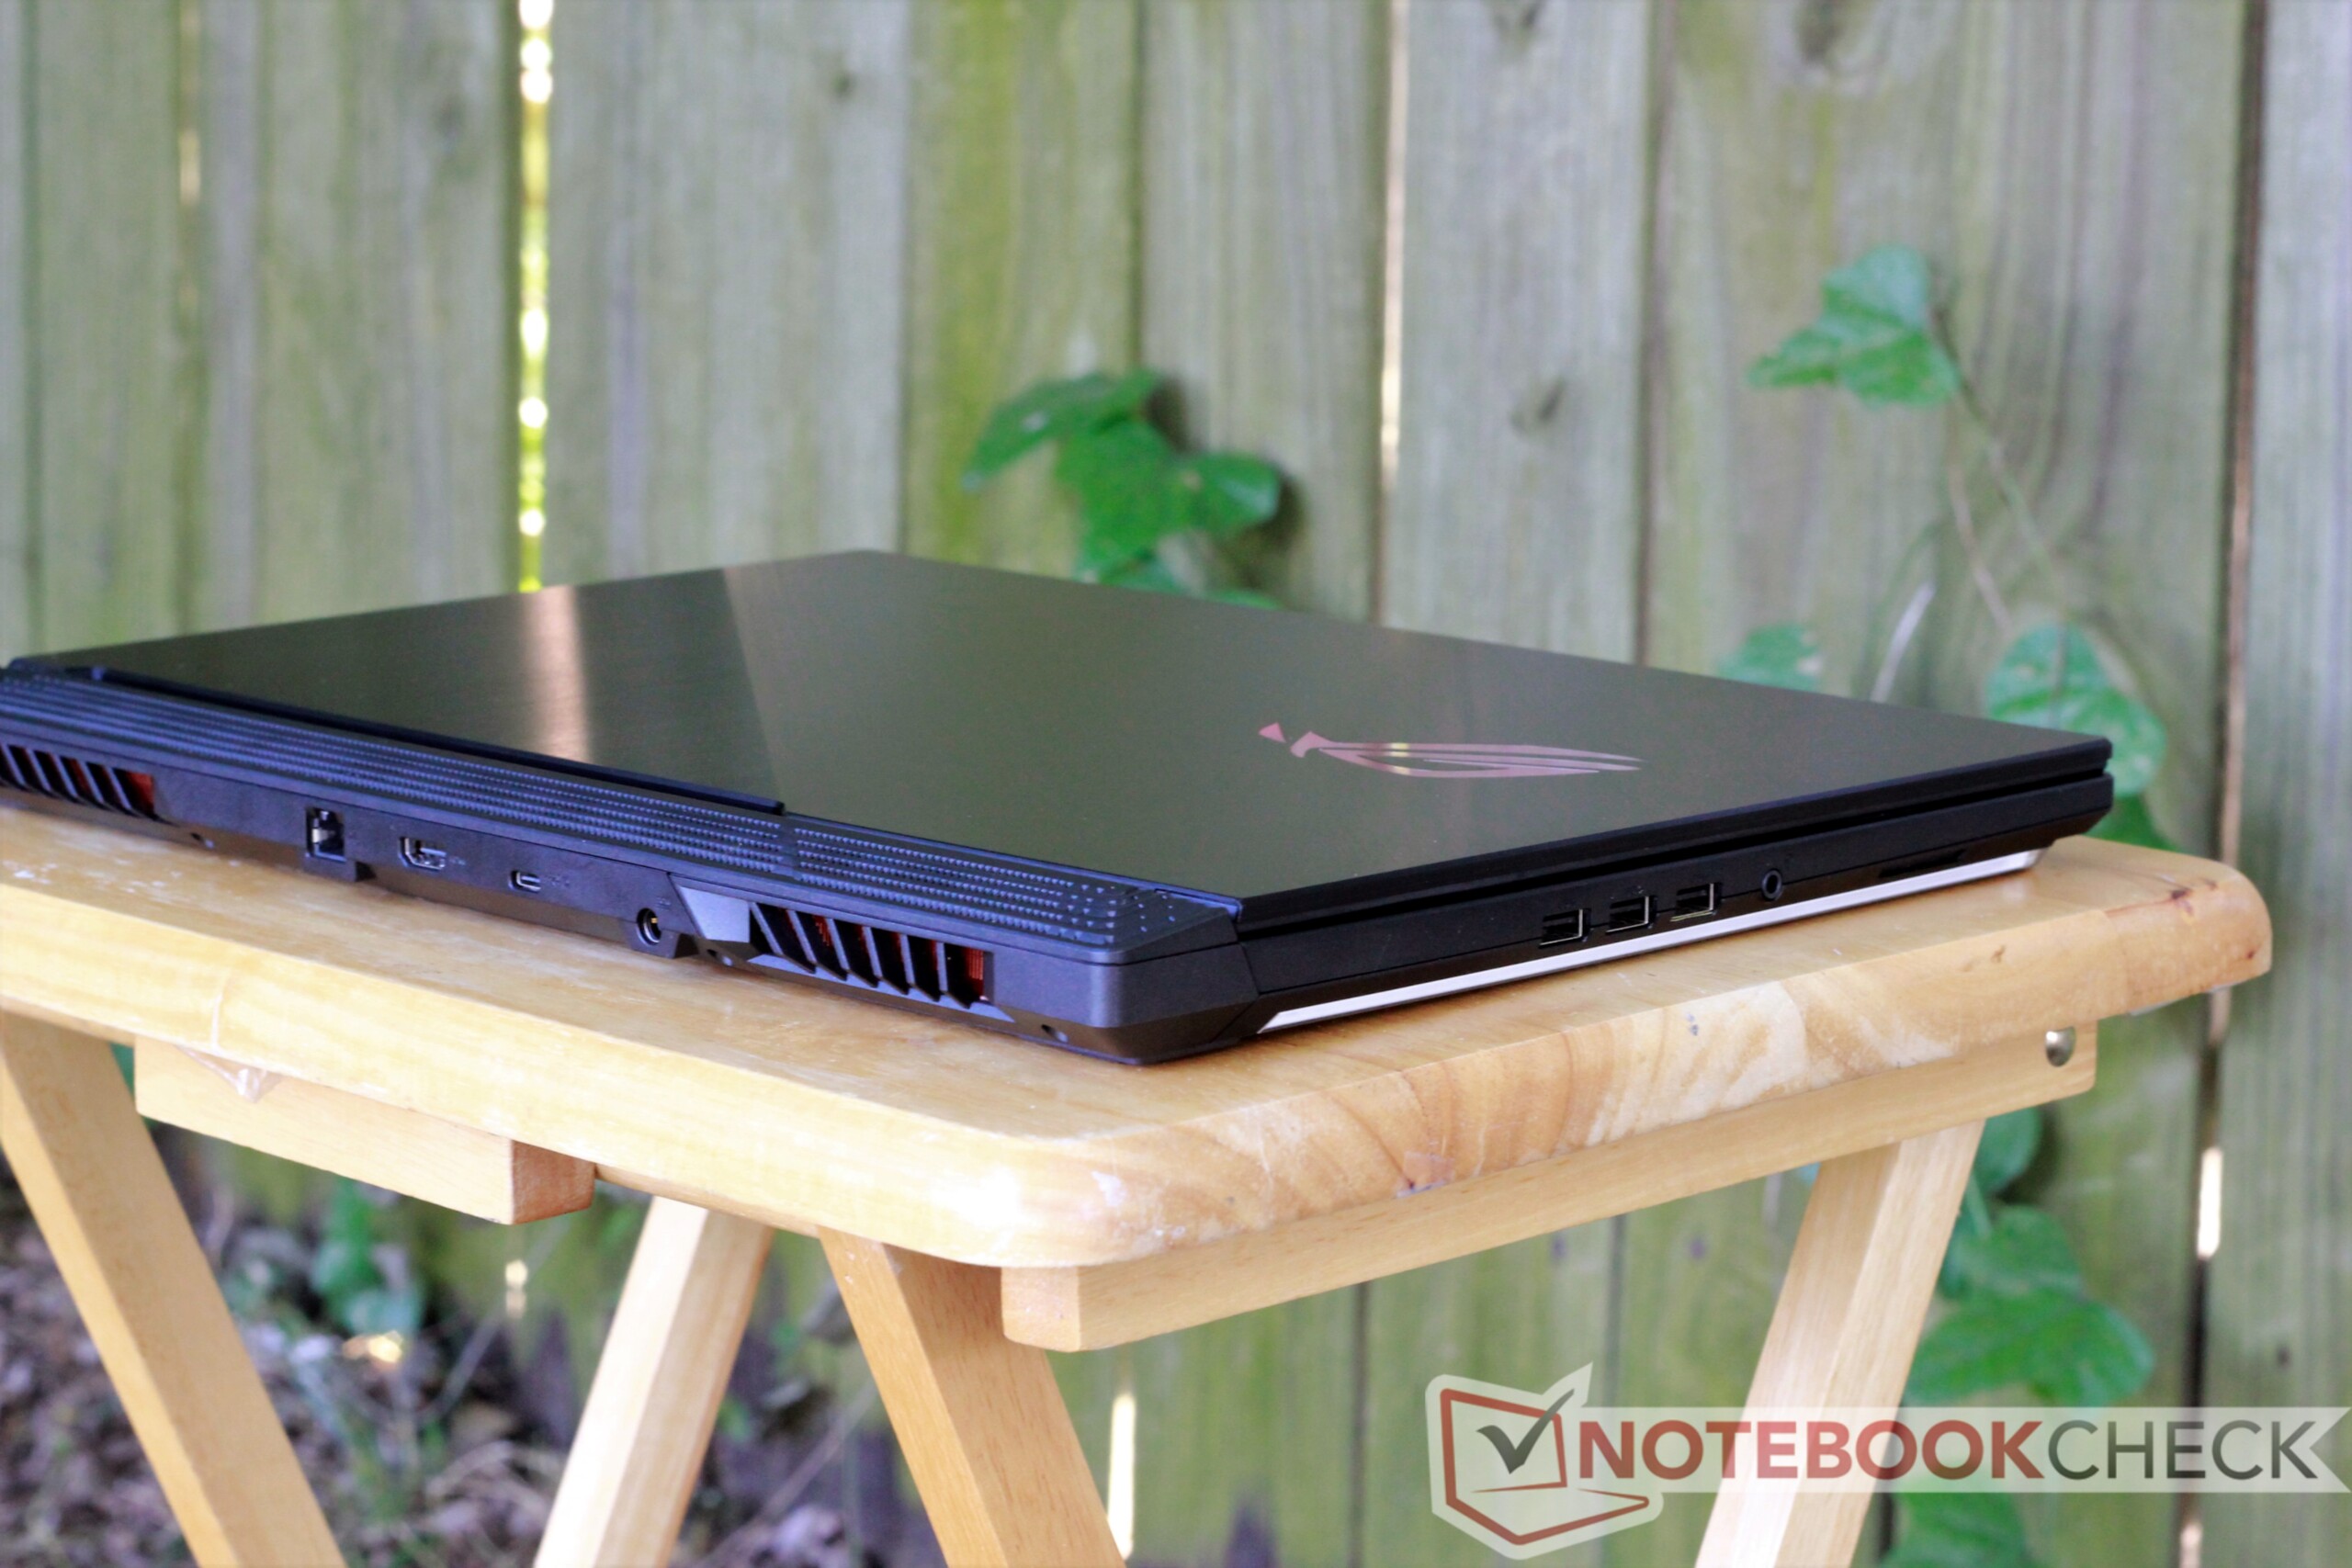
O velho ditado diz que a beleza é apenas superficial. A Asus adicionou muito talento ao exterior do G731GW, mas parece ter esquecido alguns fatores que tornam um portátil para jogos ótimo. Em particular, o posicionamento estranho das portas e o processo de manutenção irritante deixam um gosto ruim após um prato delicioso.
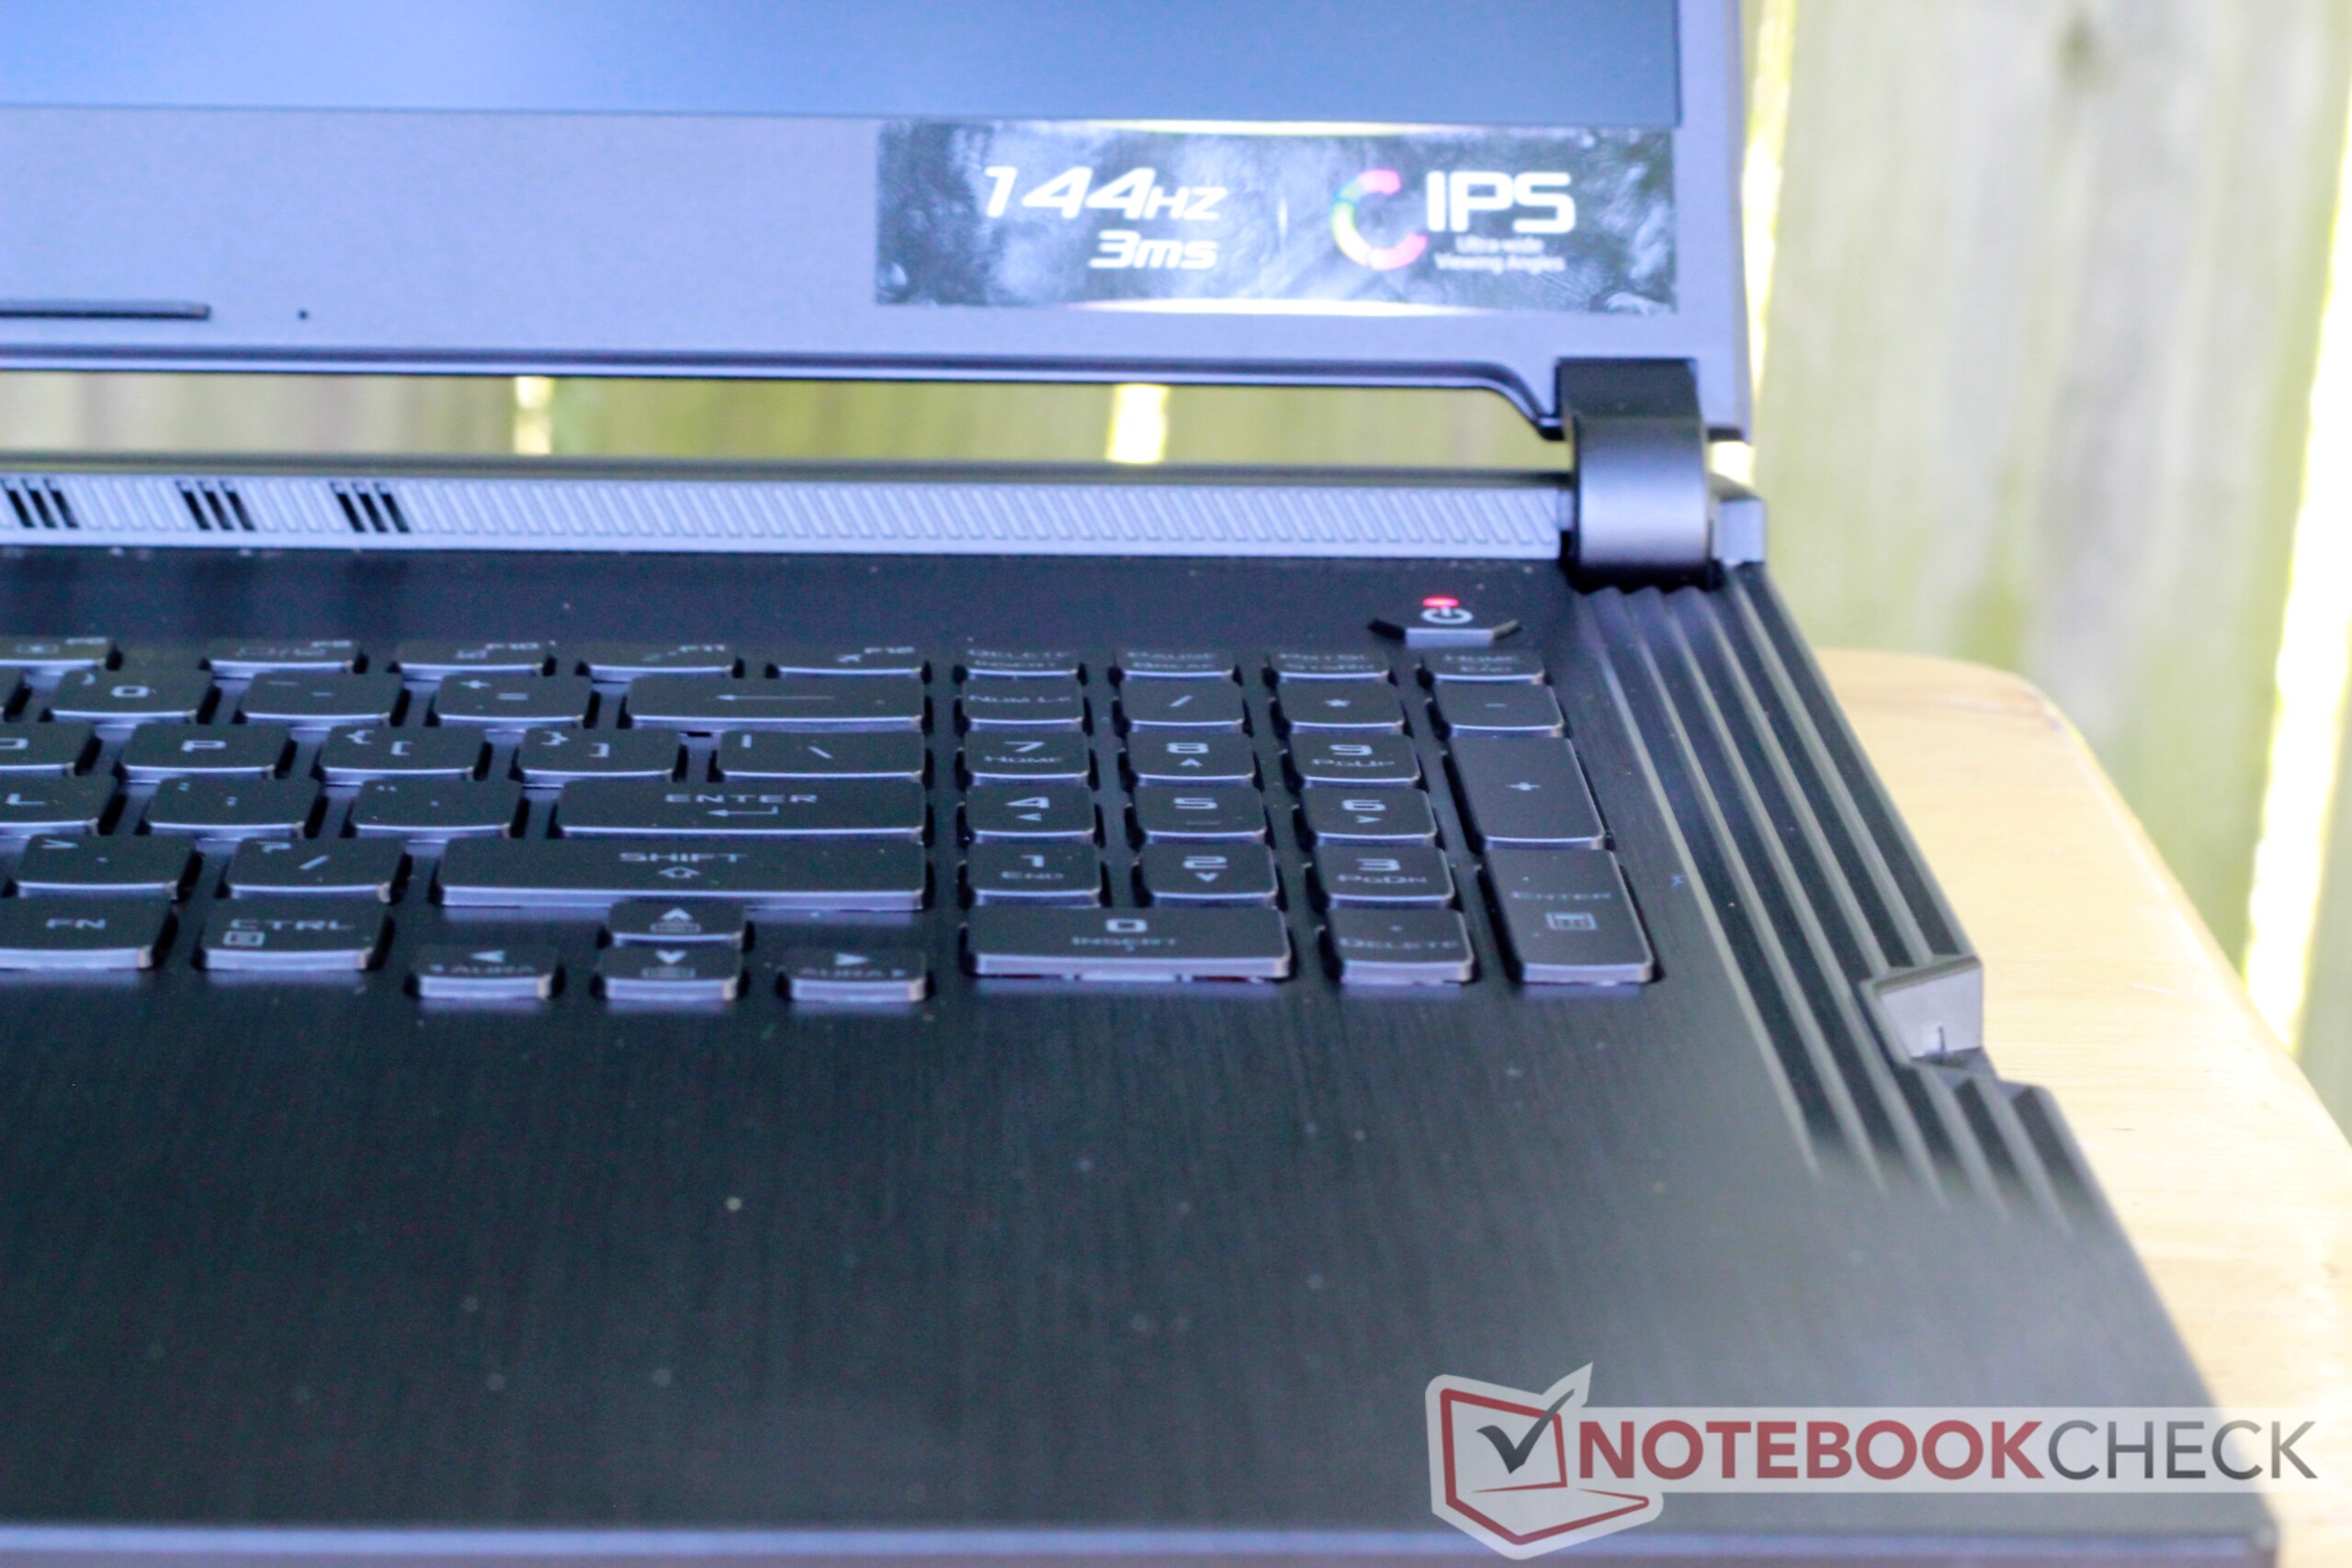
O G731GW faz muitas coisas bem. Sua tela de 144 Hz é uma das melhores que já vimos em portáteis para jogos, e seu teclado é excelente e oferece uma resposta rápida. Da mesma forma, o desempenho em jogos é ótimo; a maioria dos jogos rodará fluentemente na tela de alta taxa de atualização graças às poderosas GeForce RTX 2070 e Core i7-9750H.
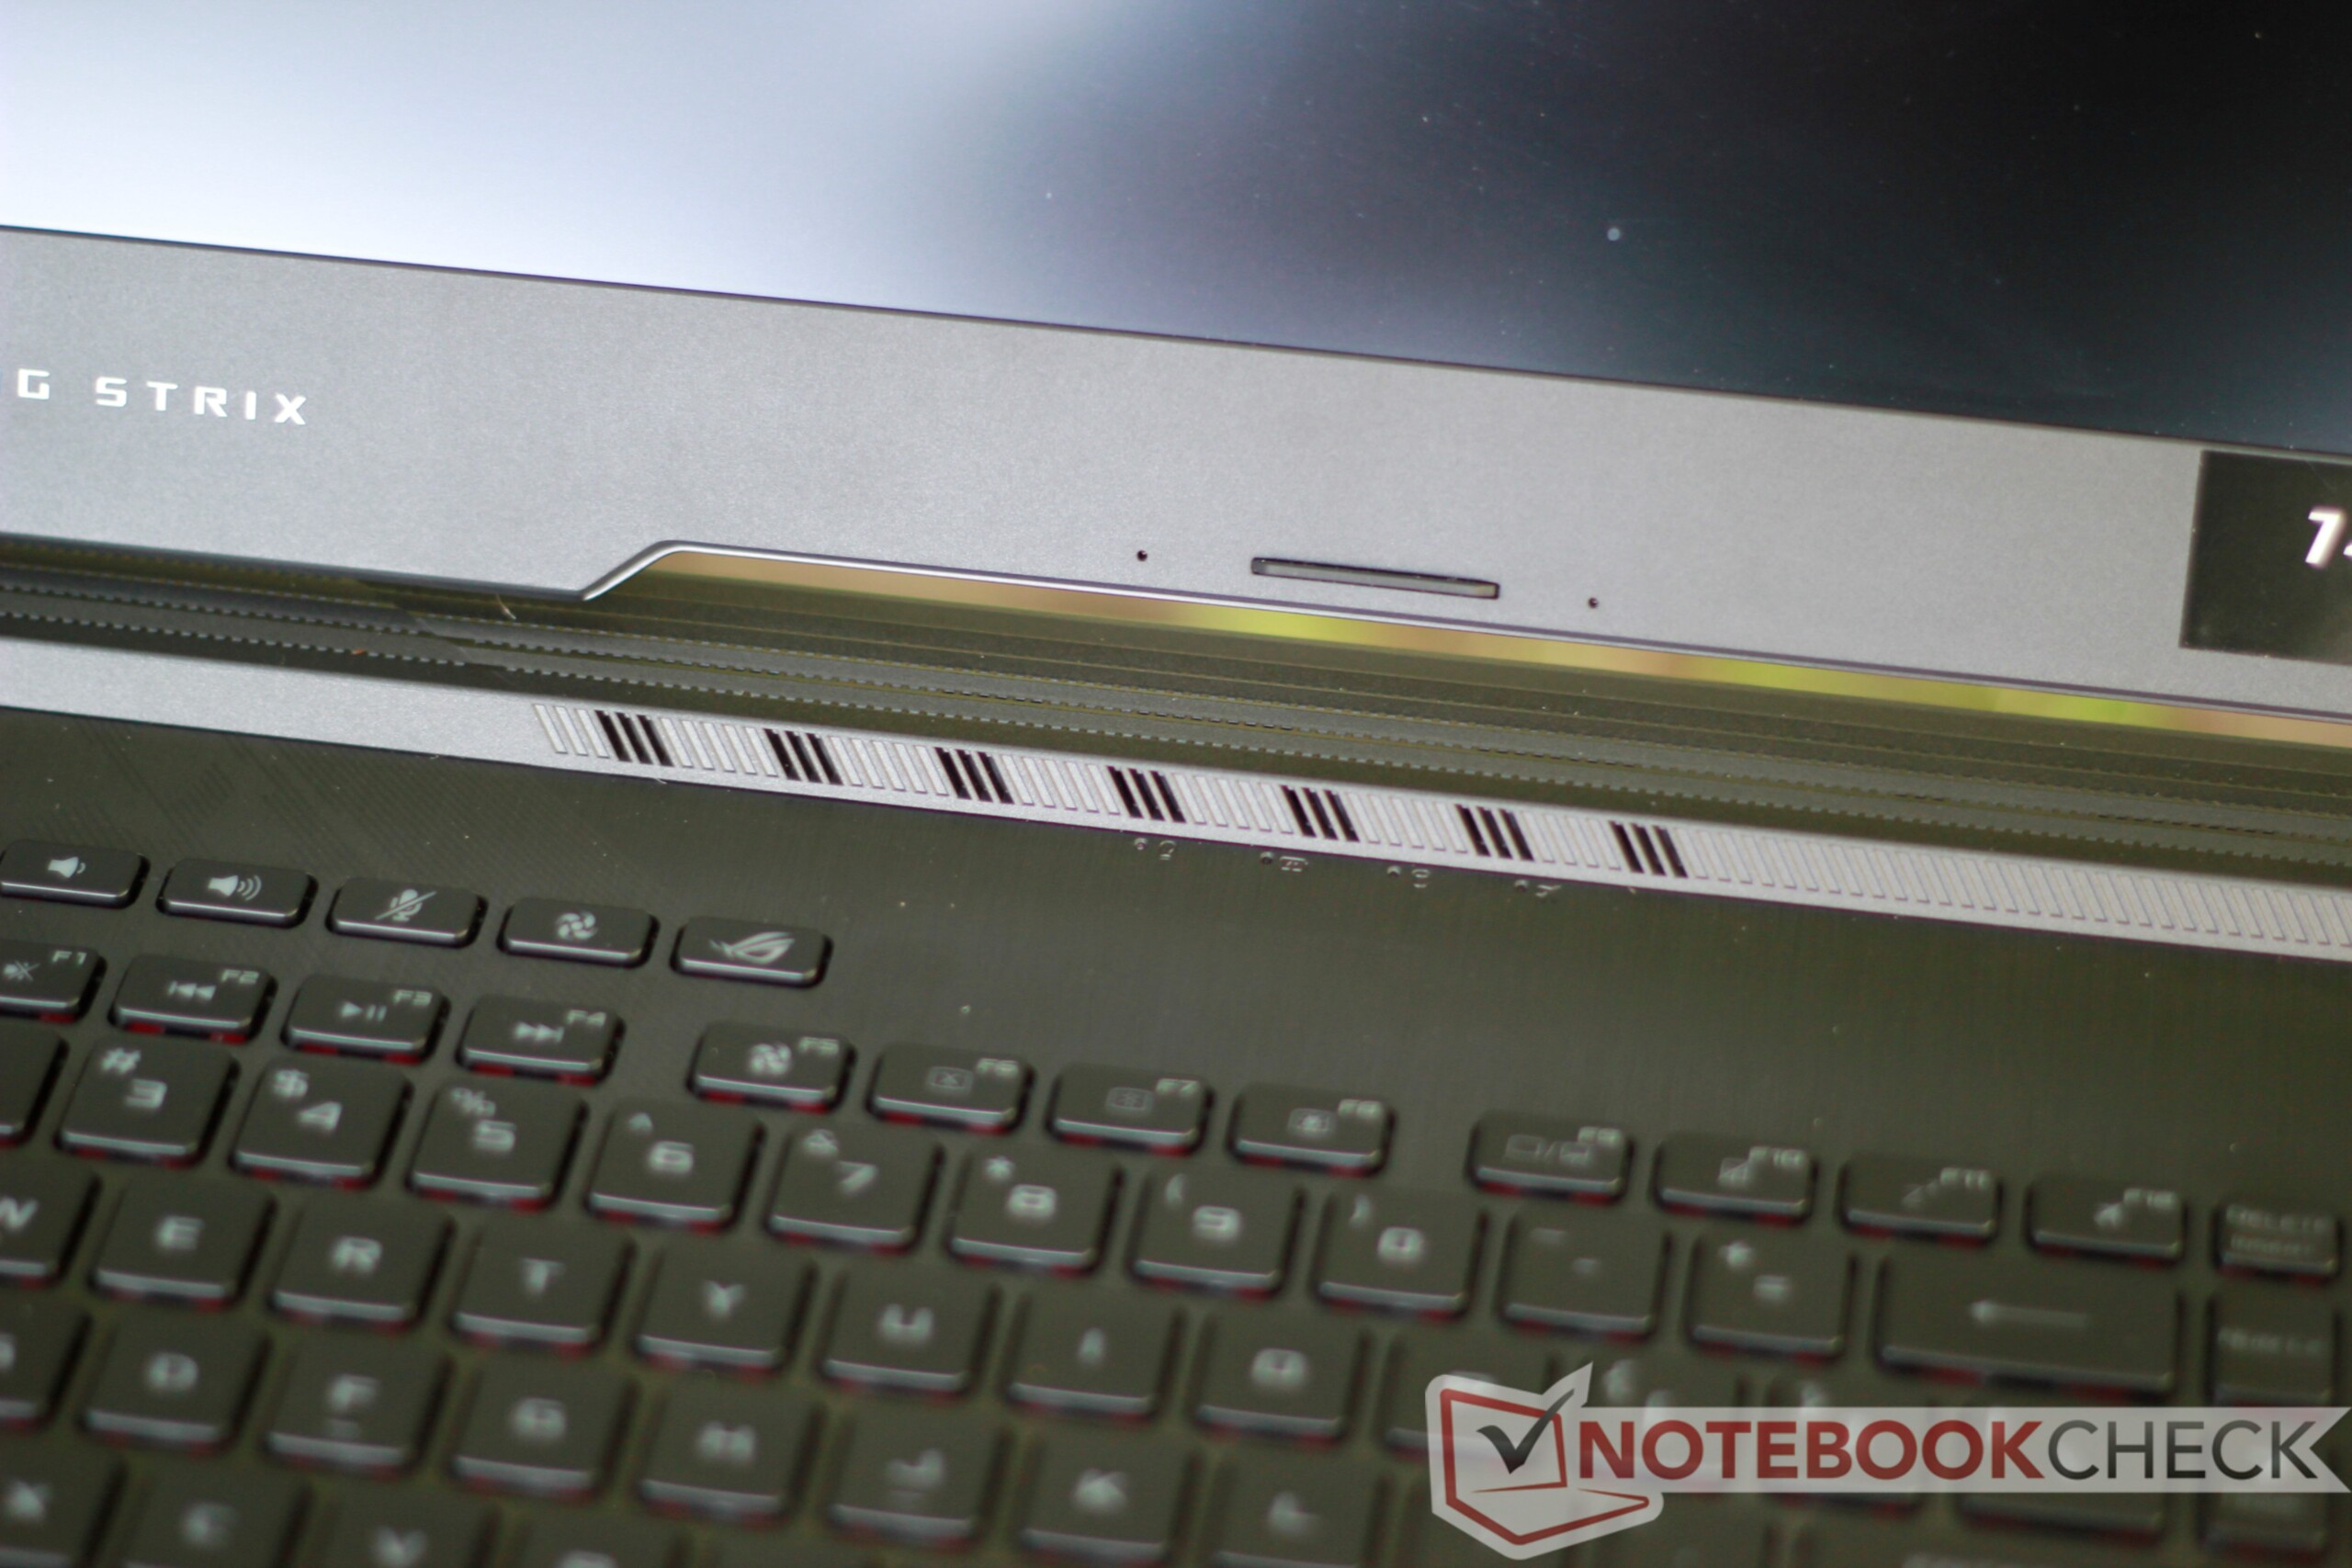
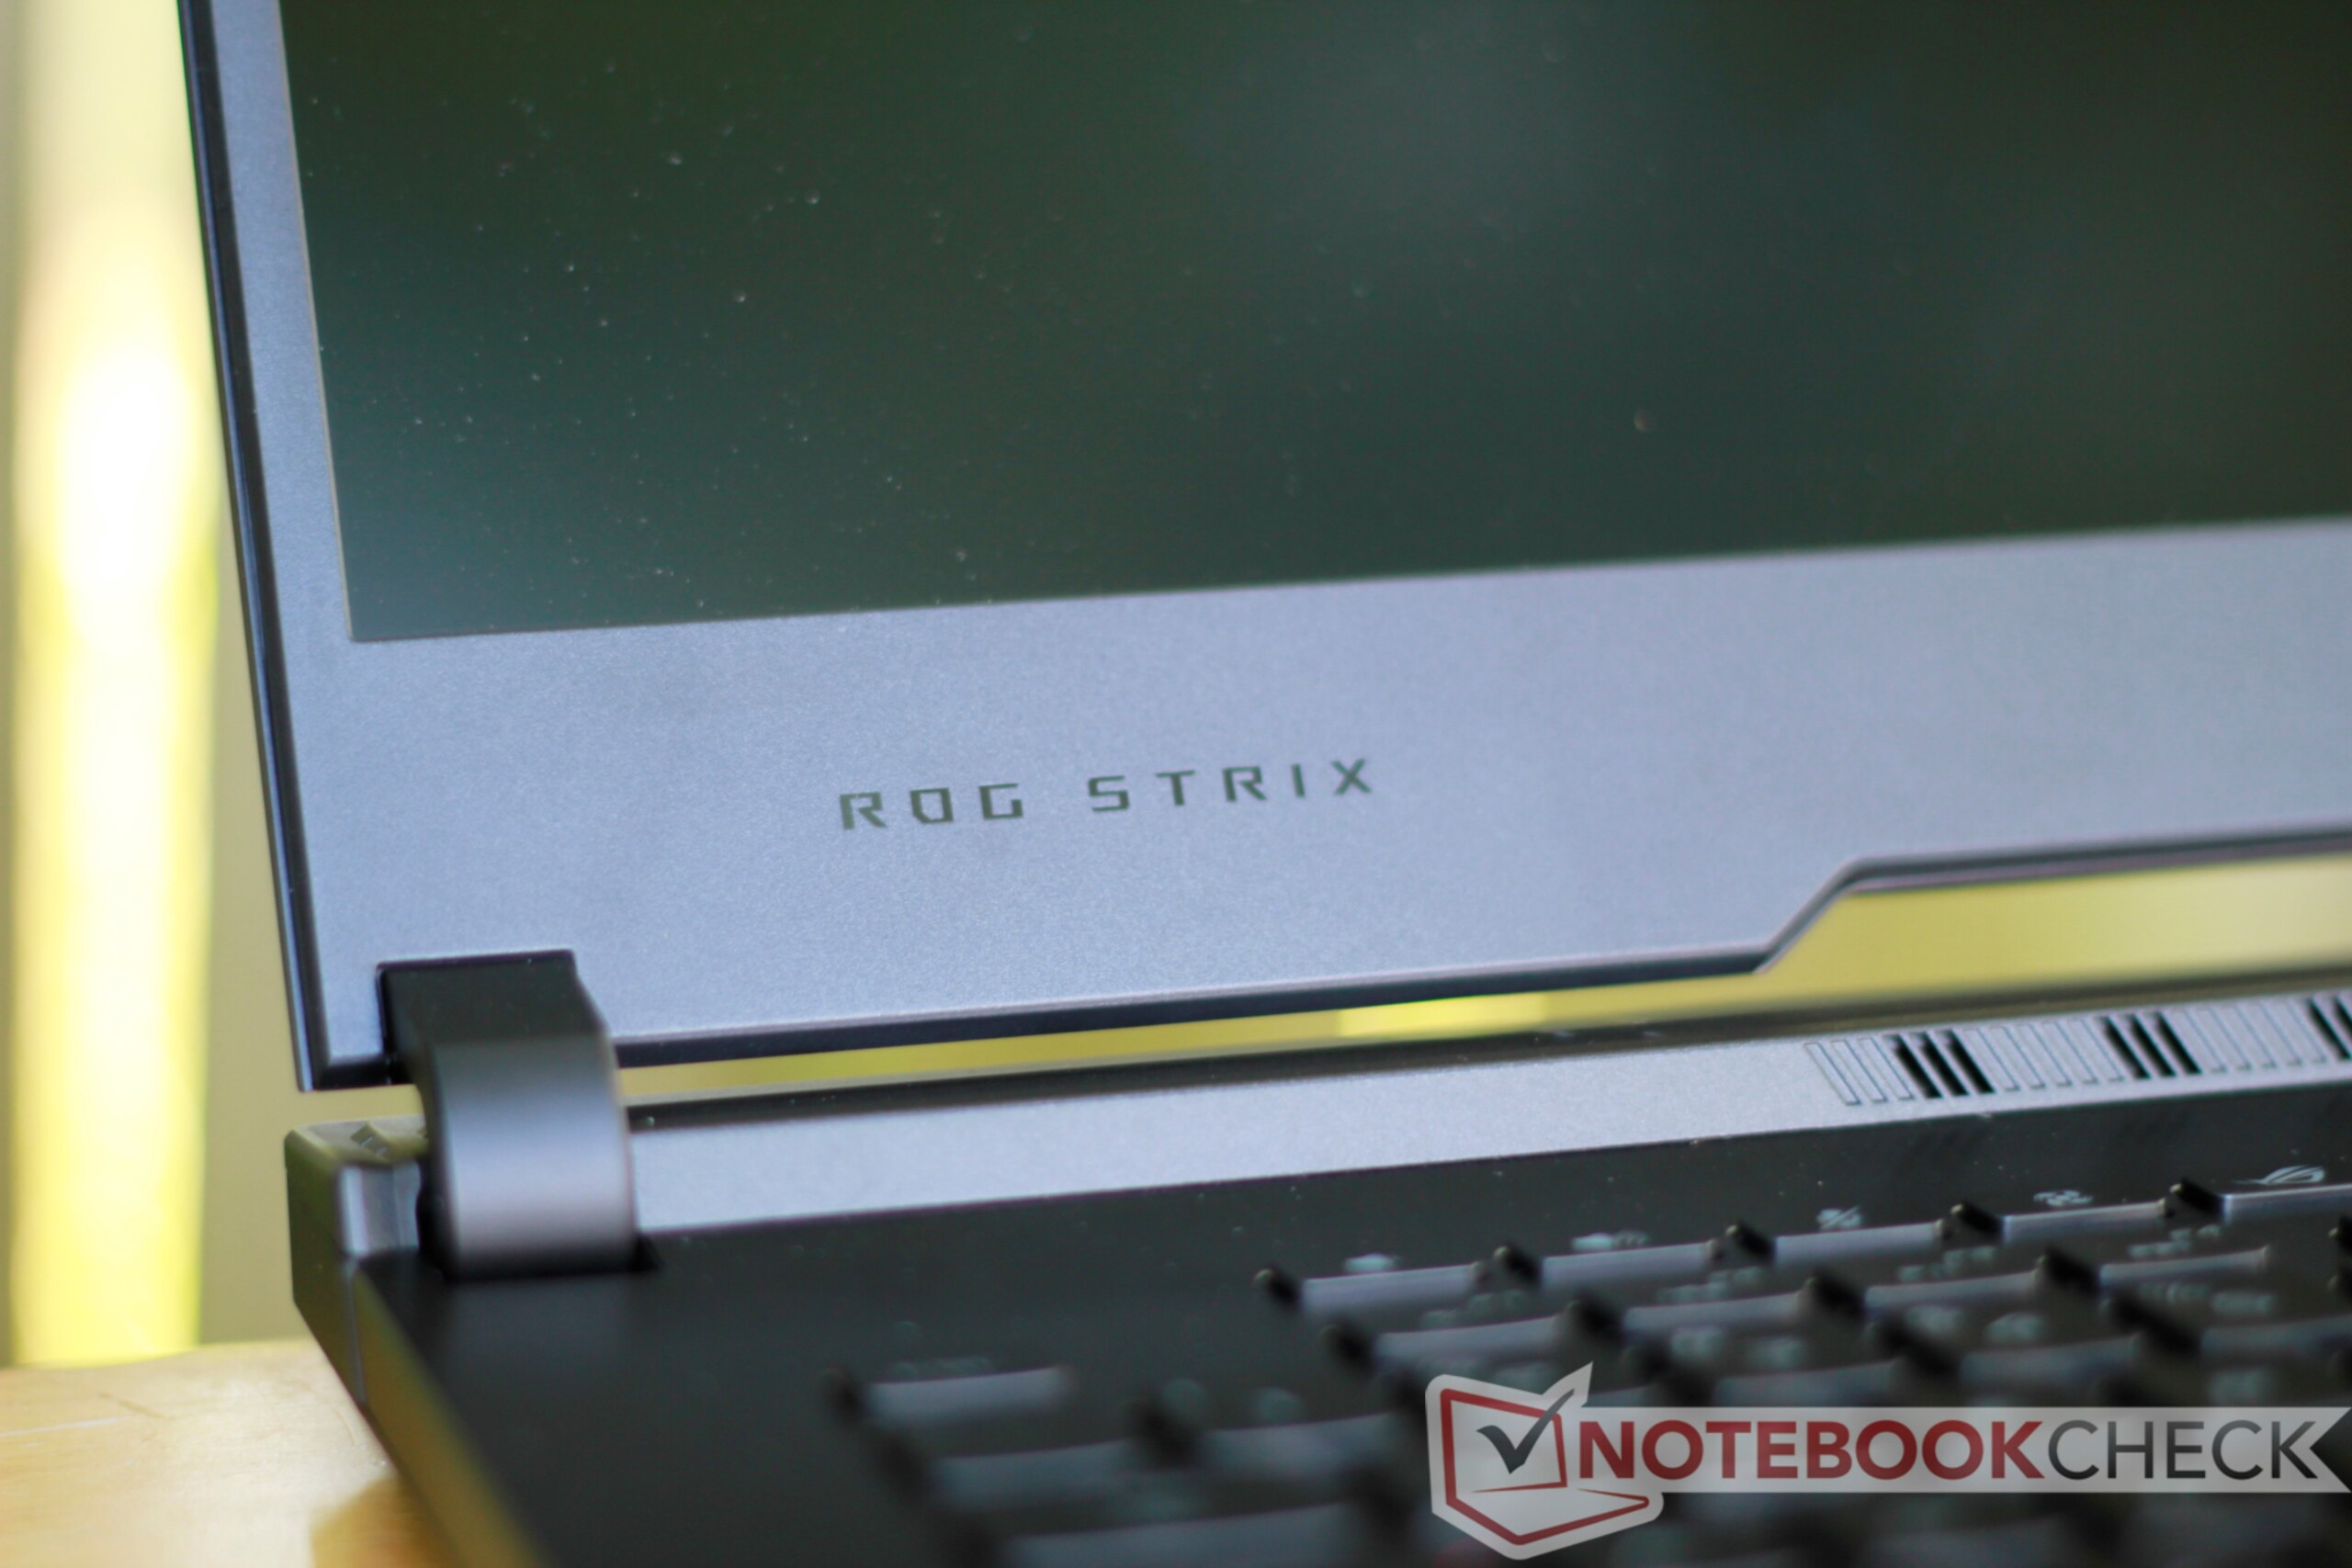
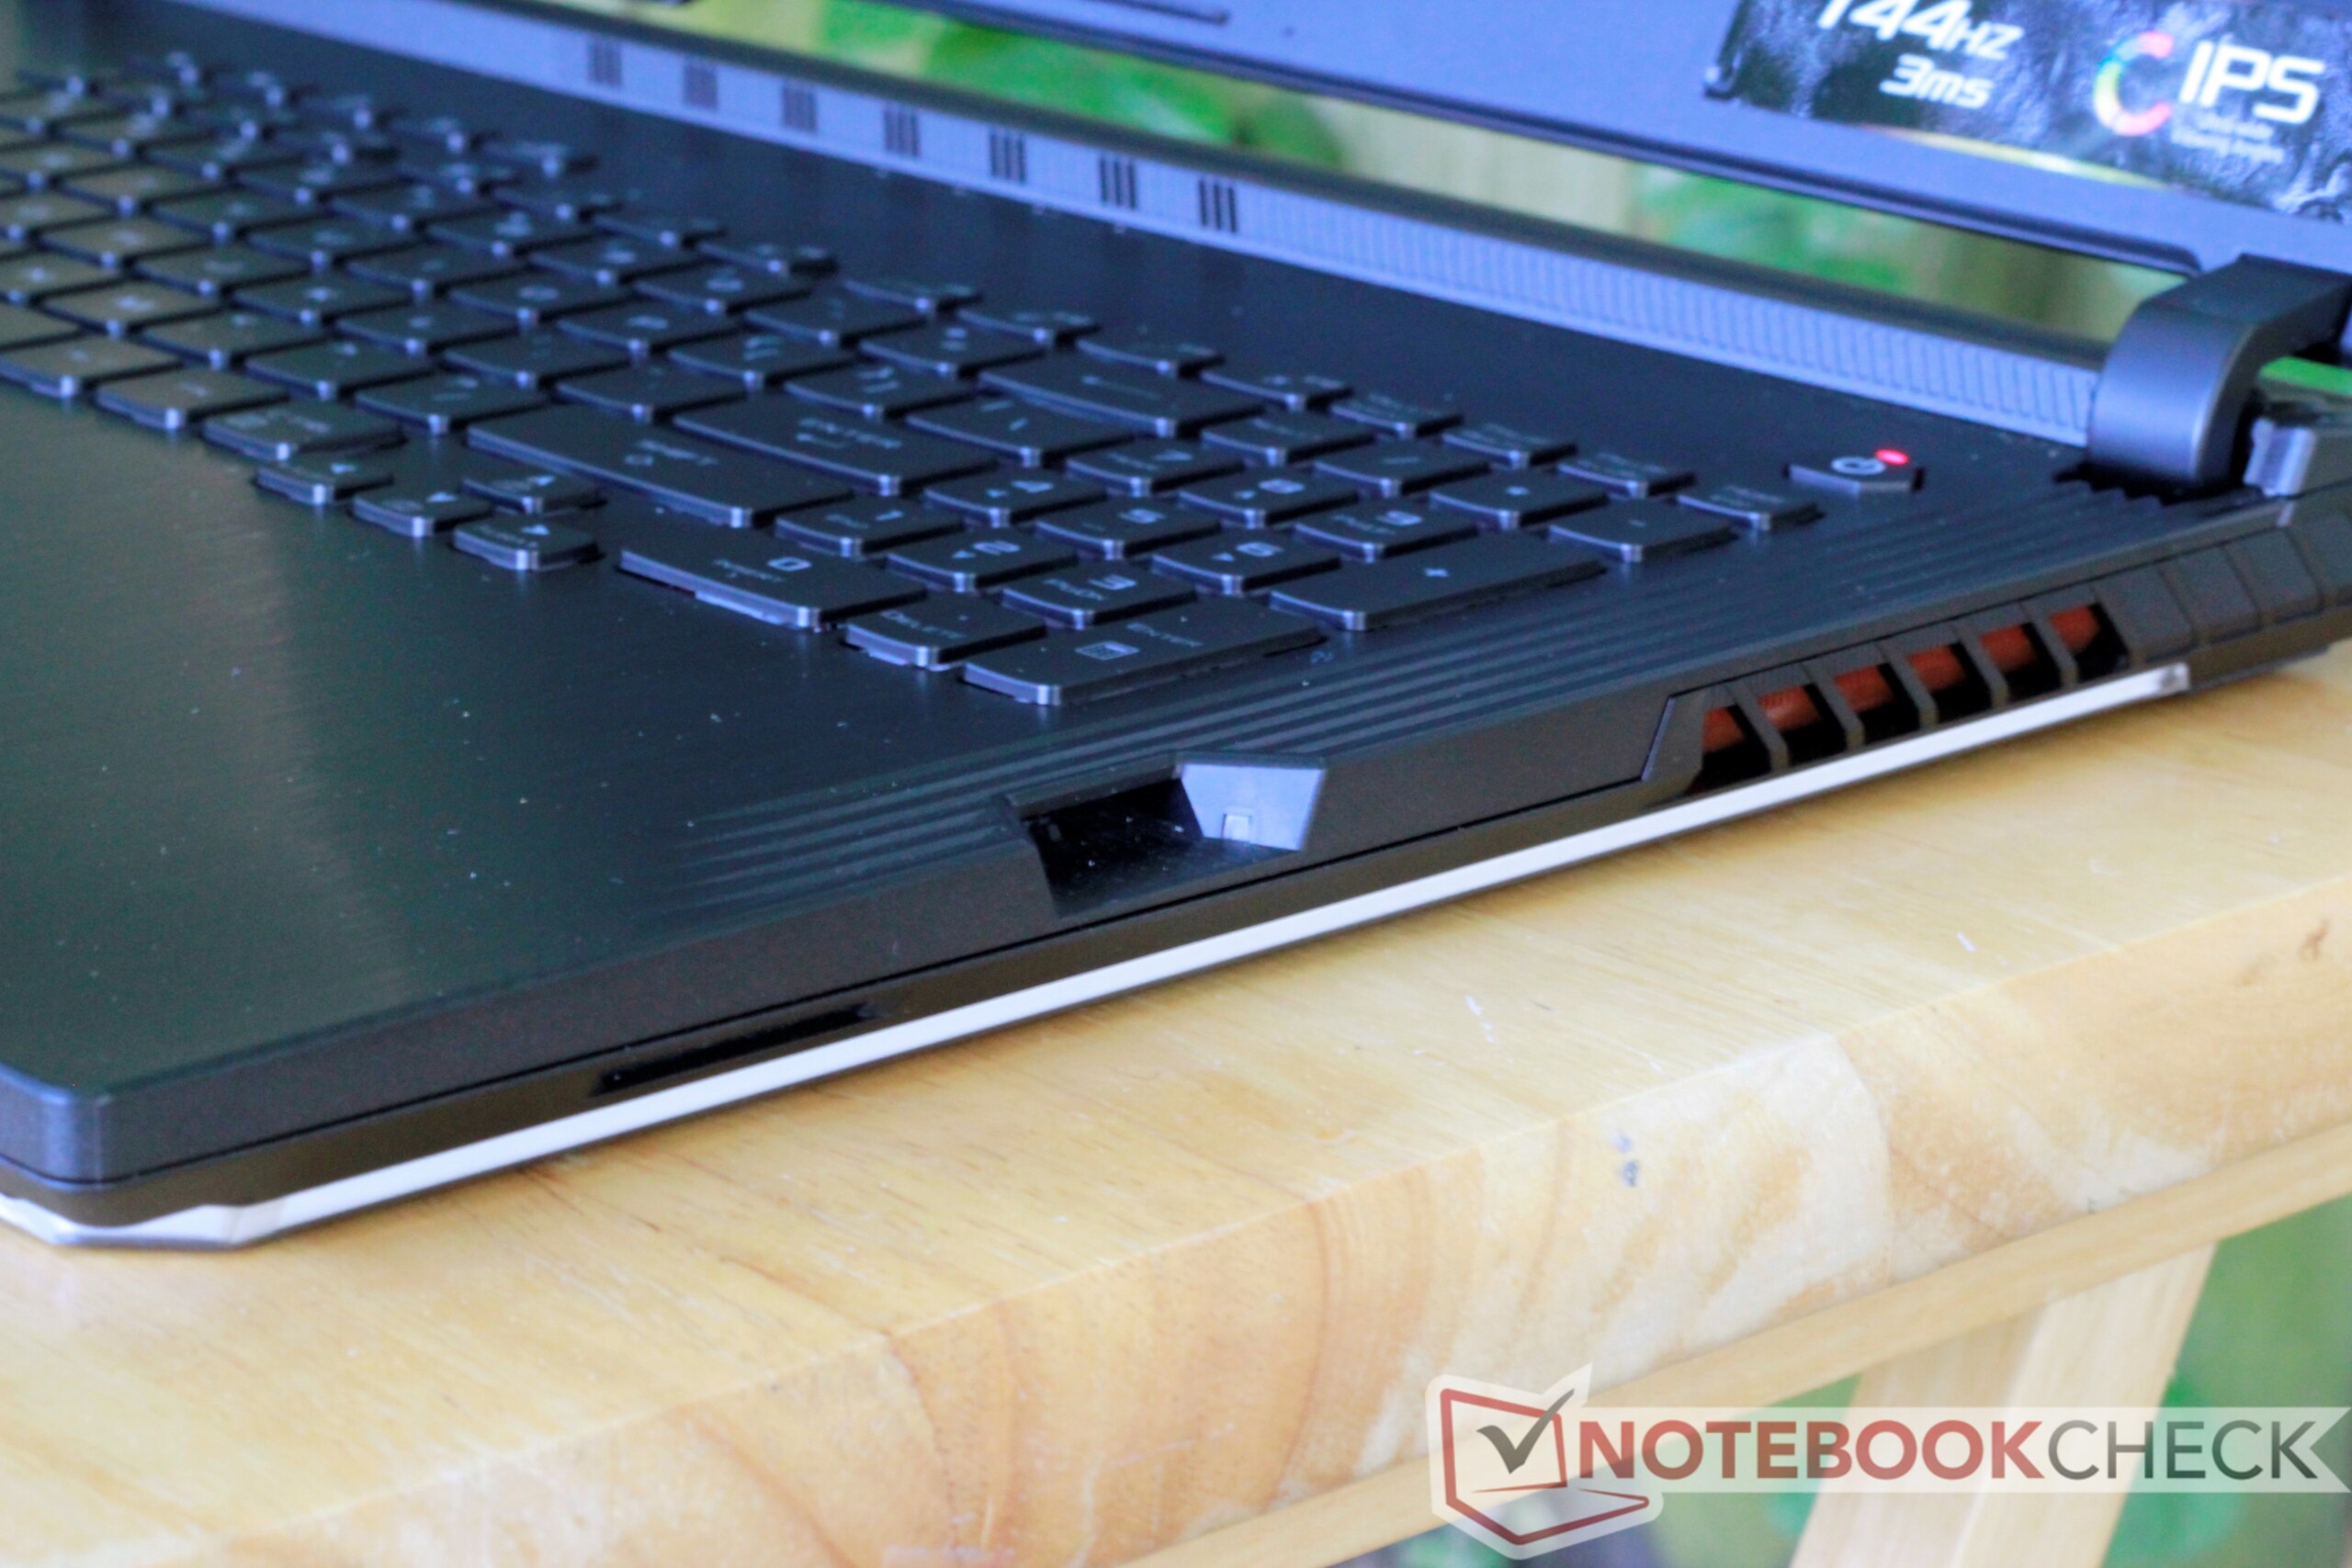
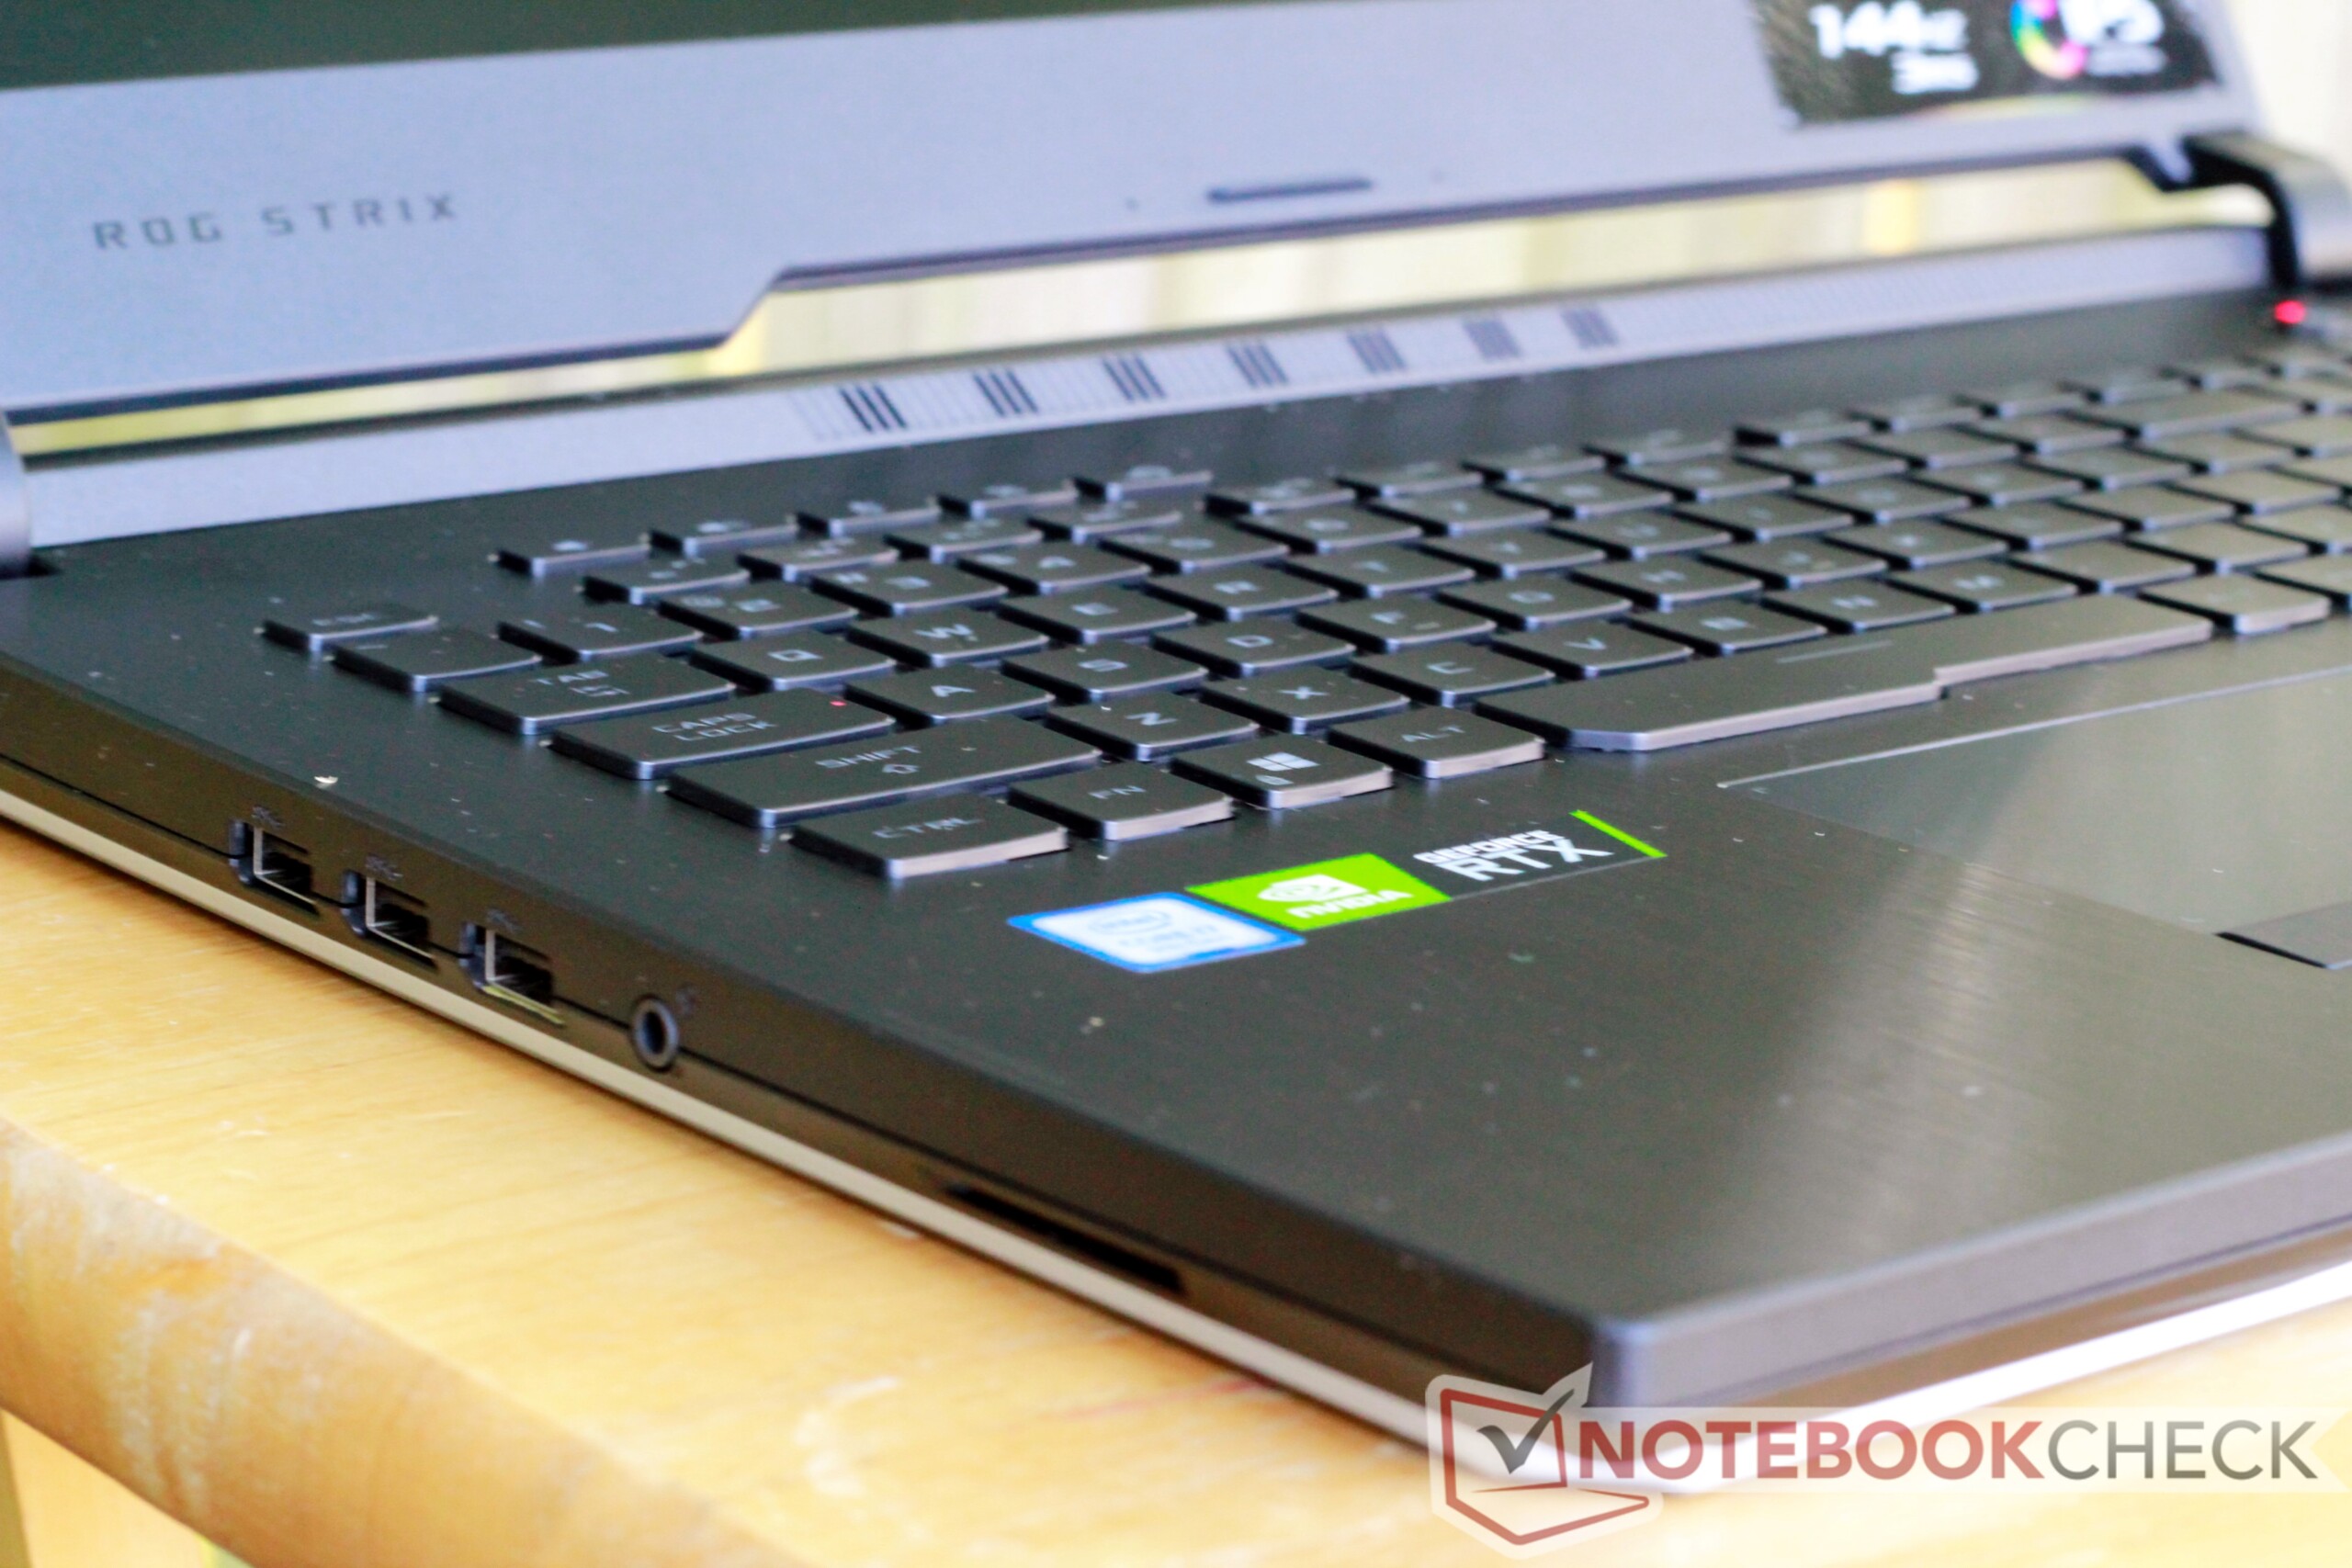
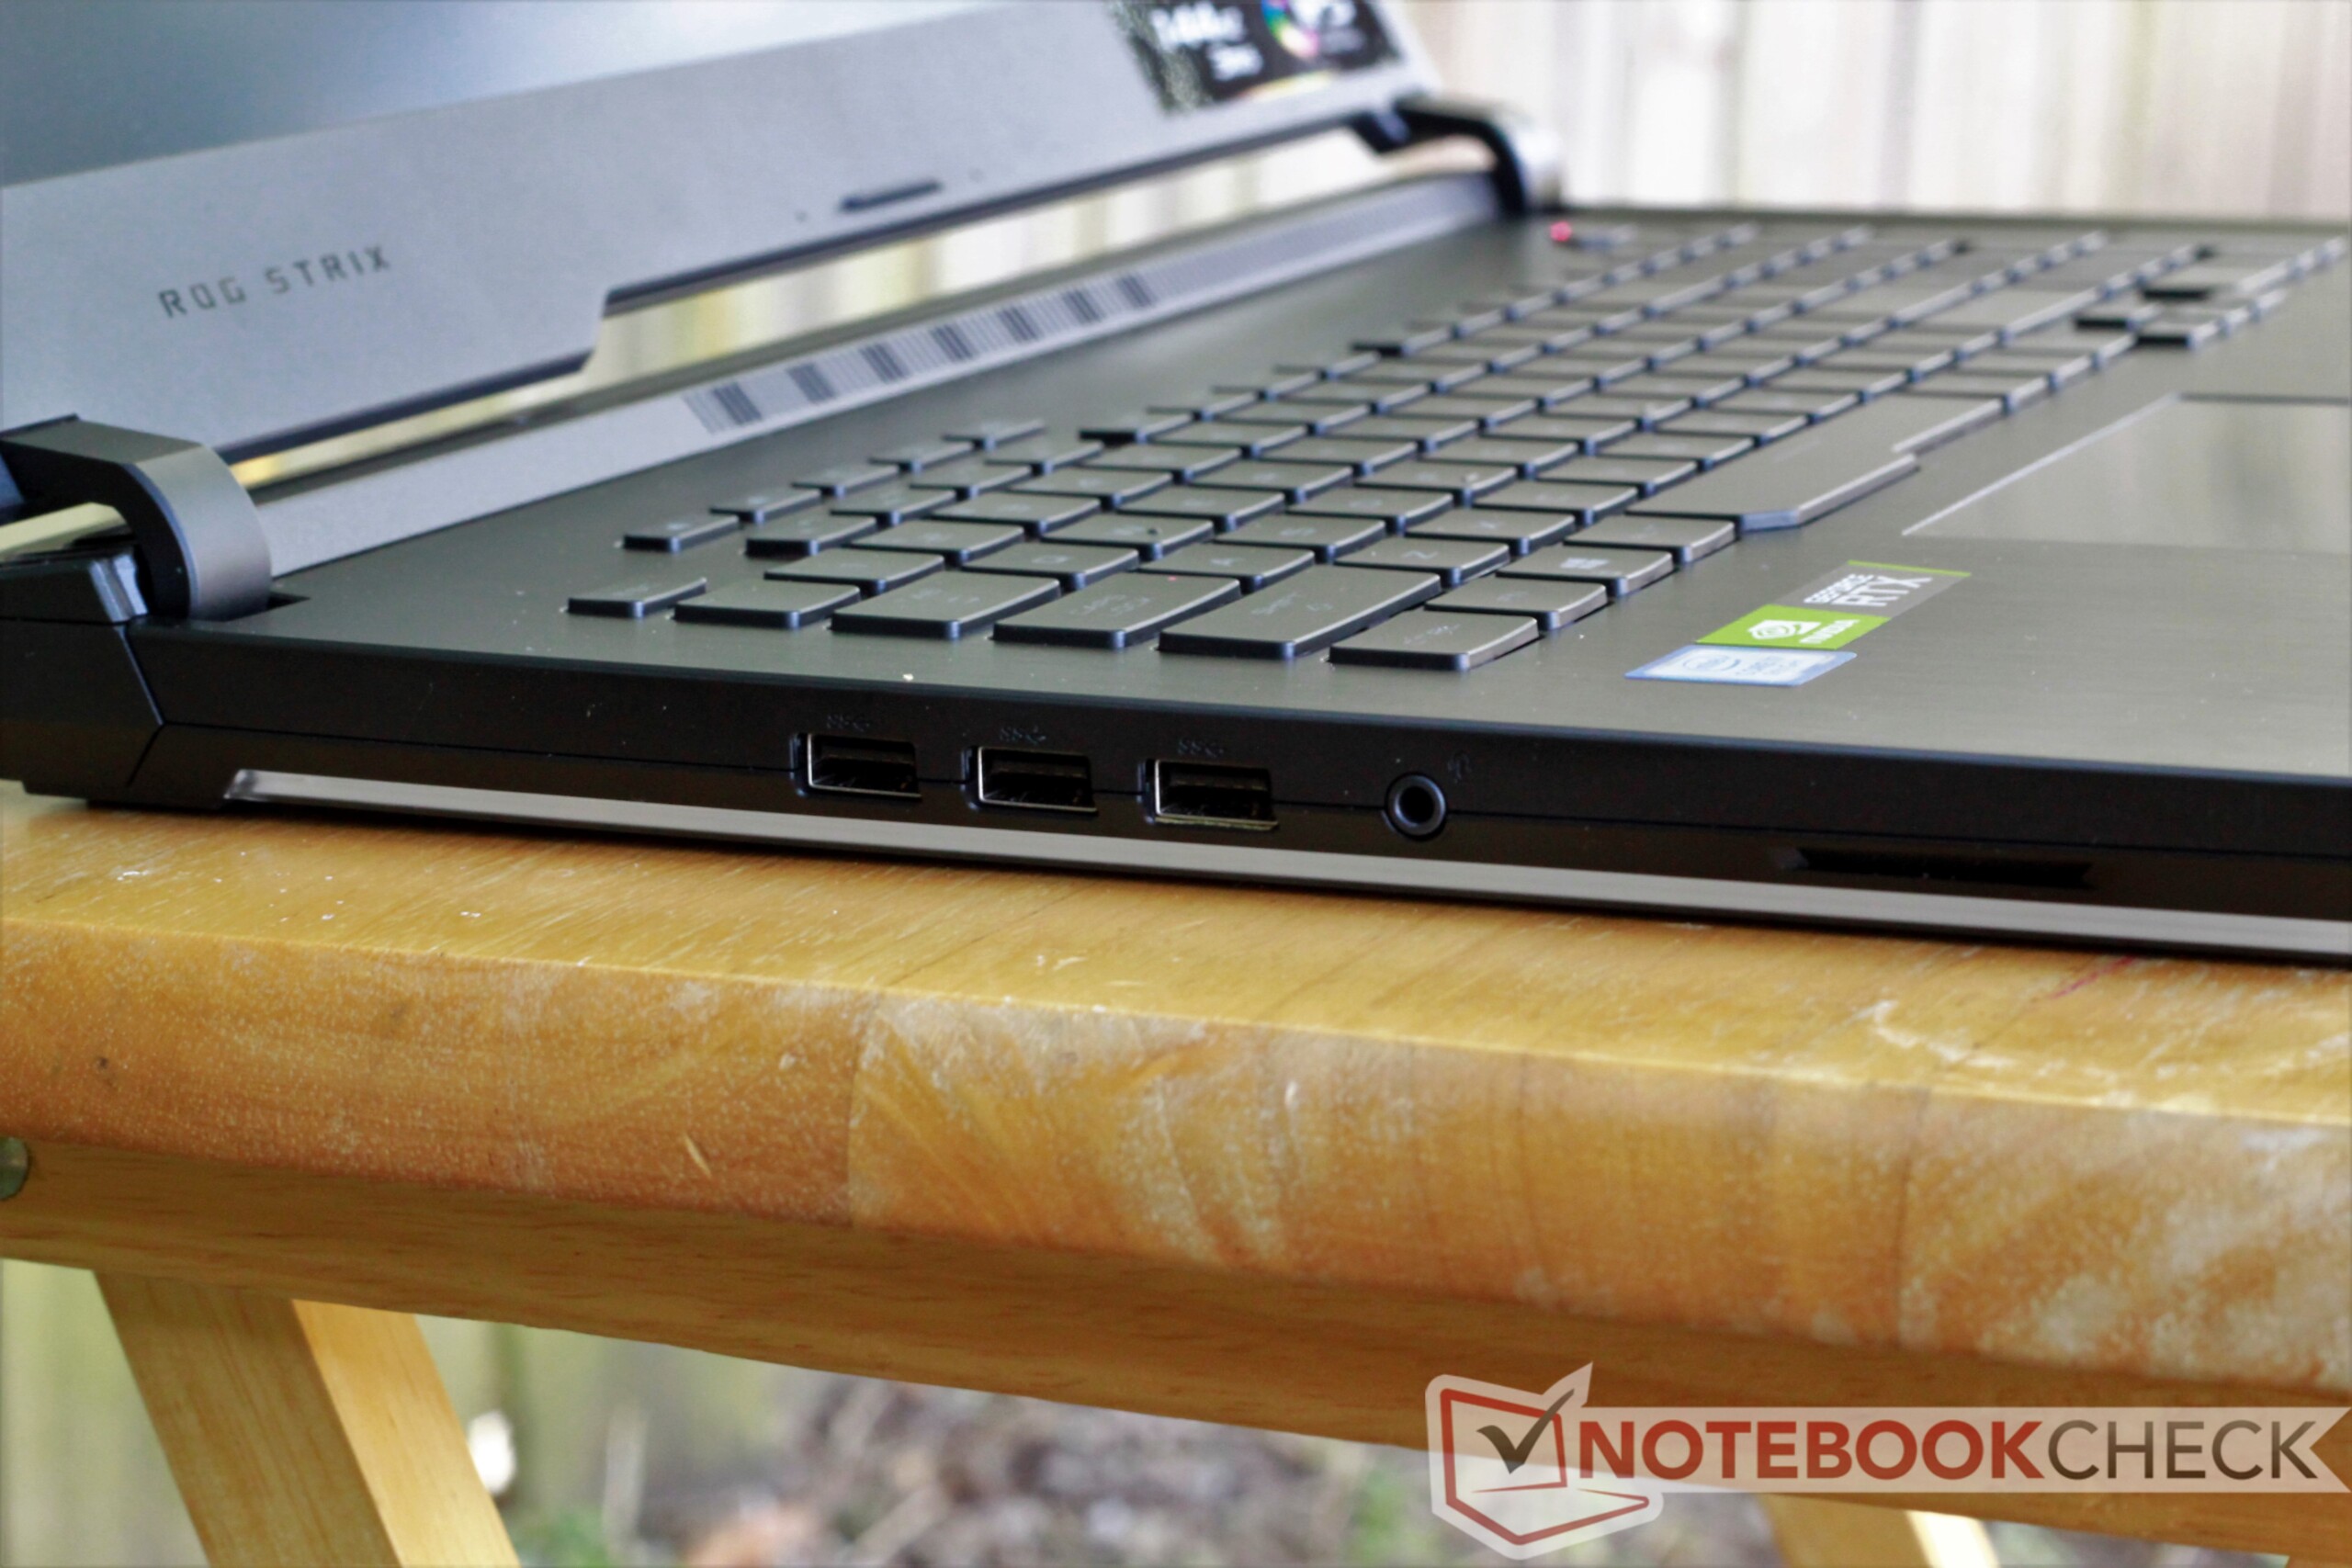
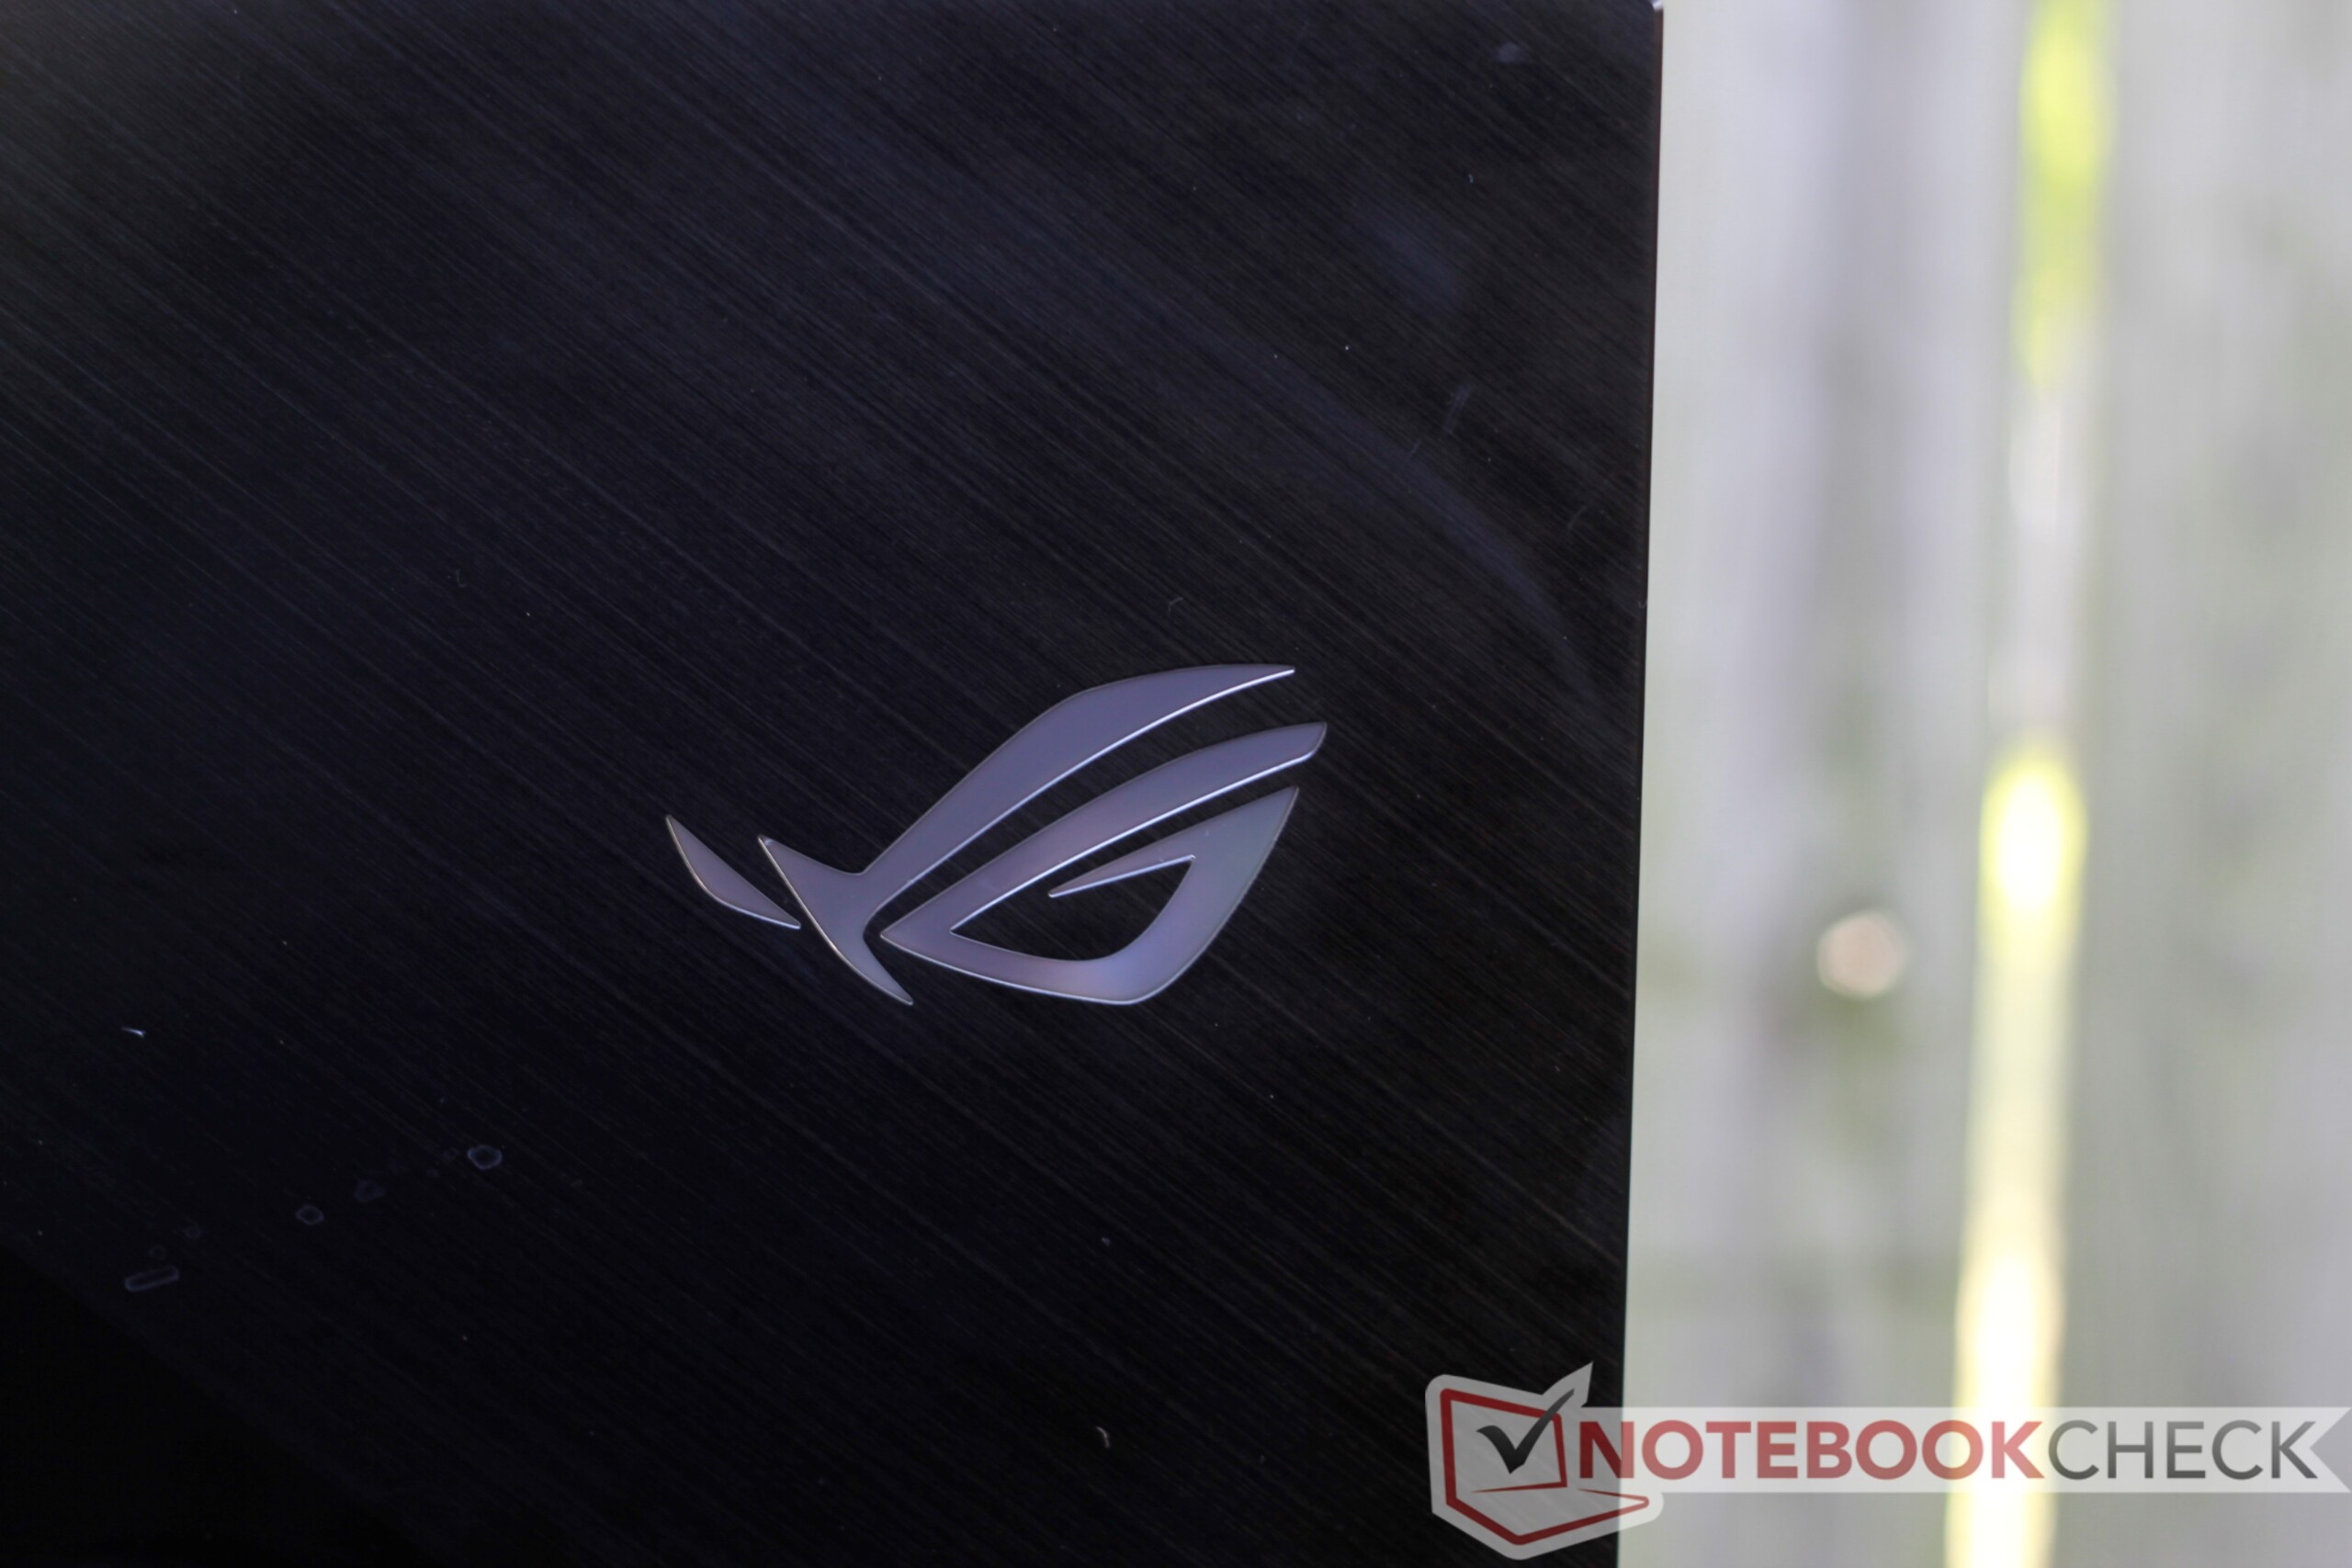
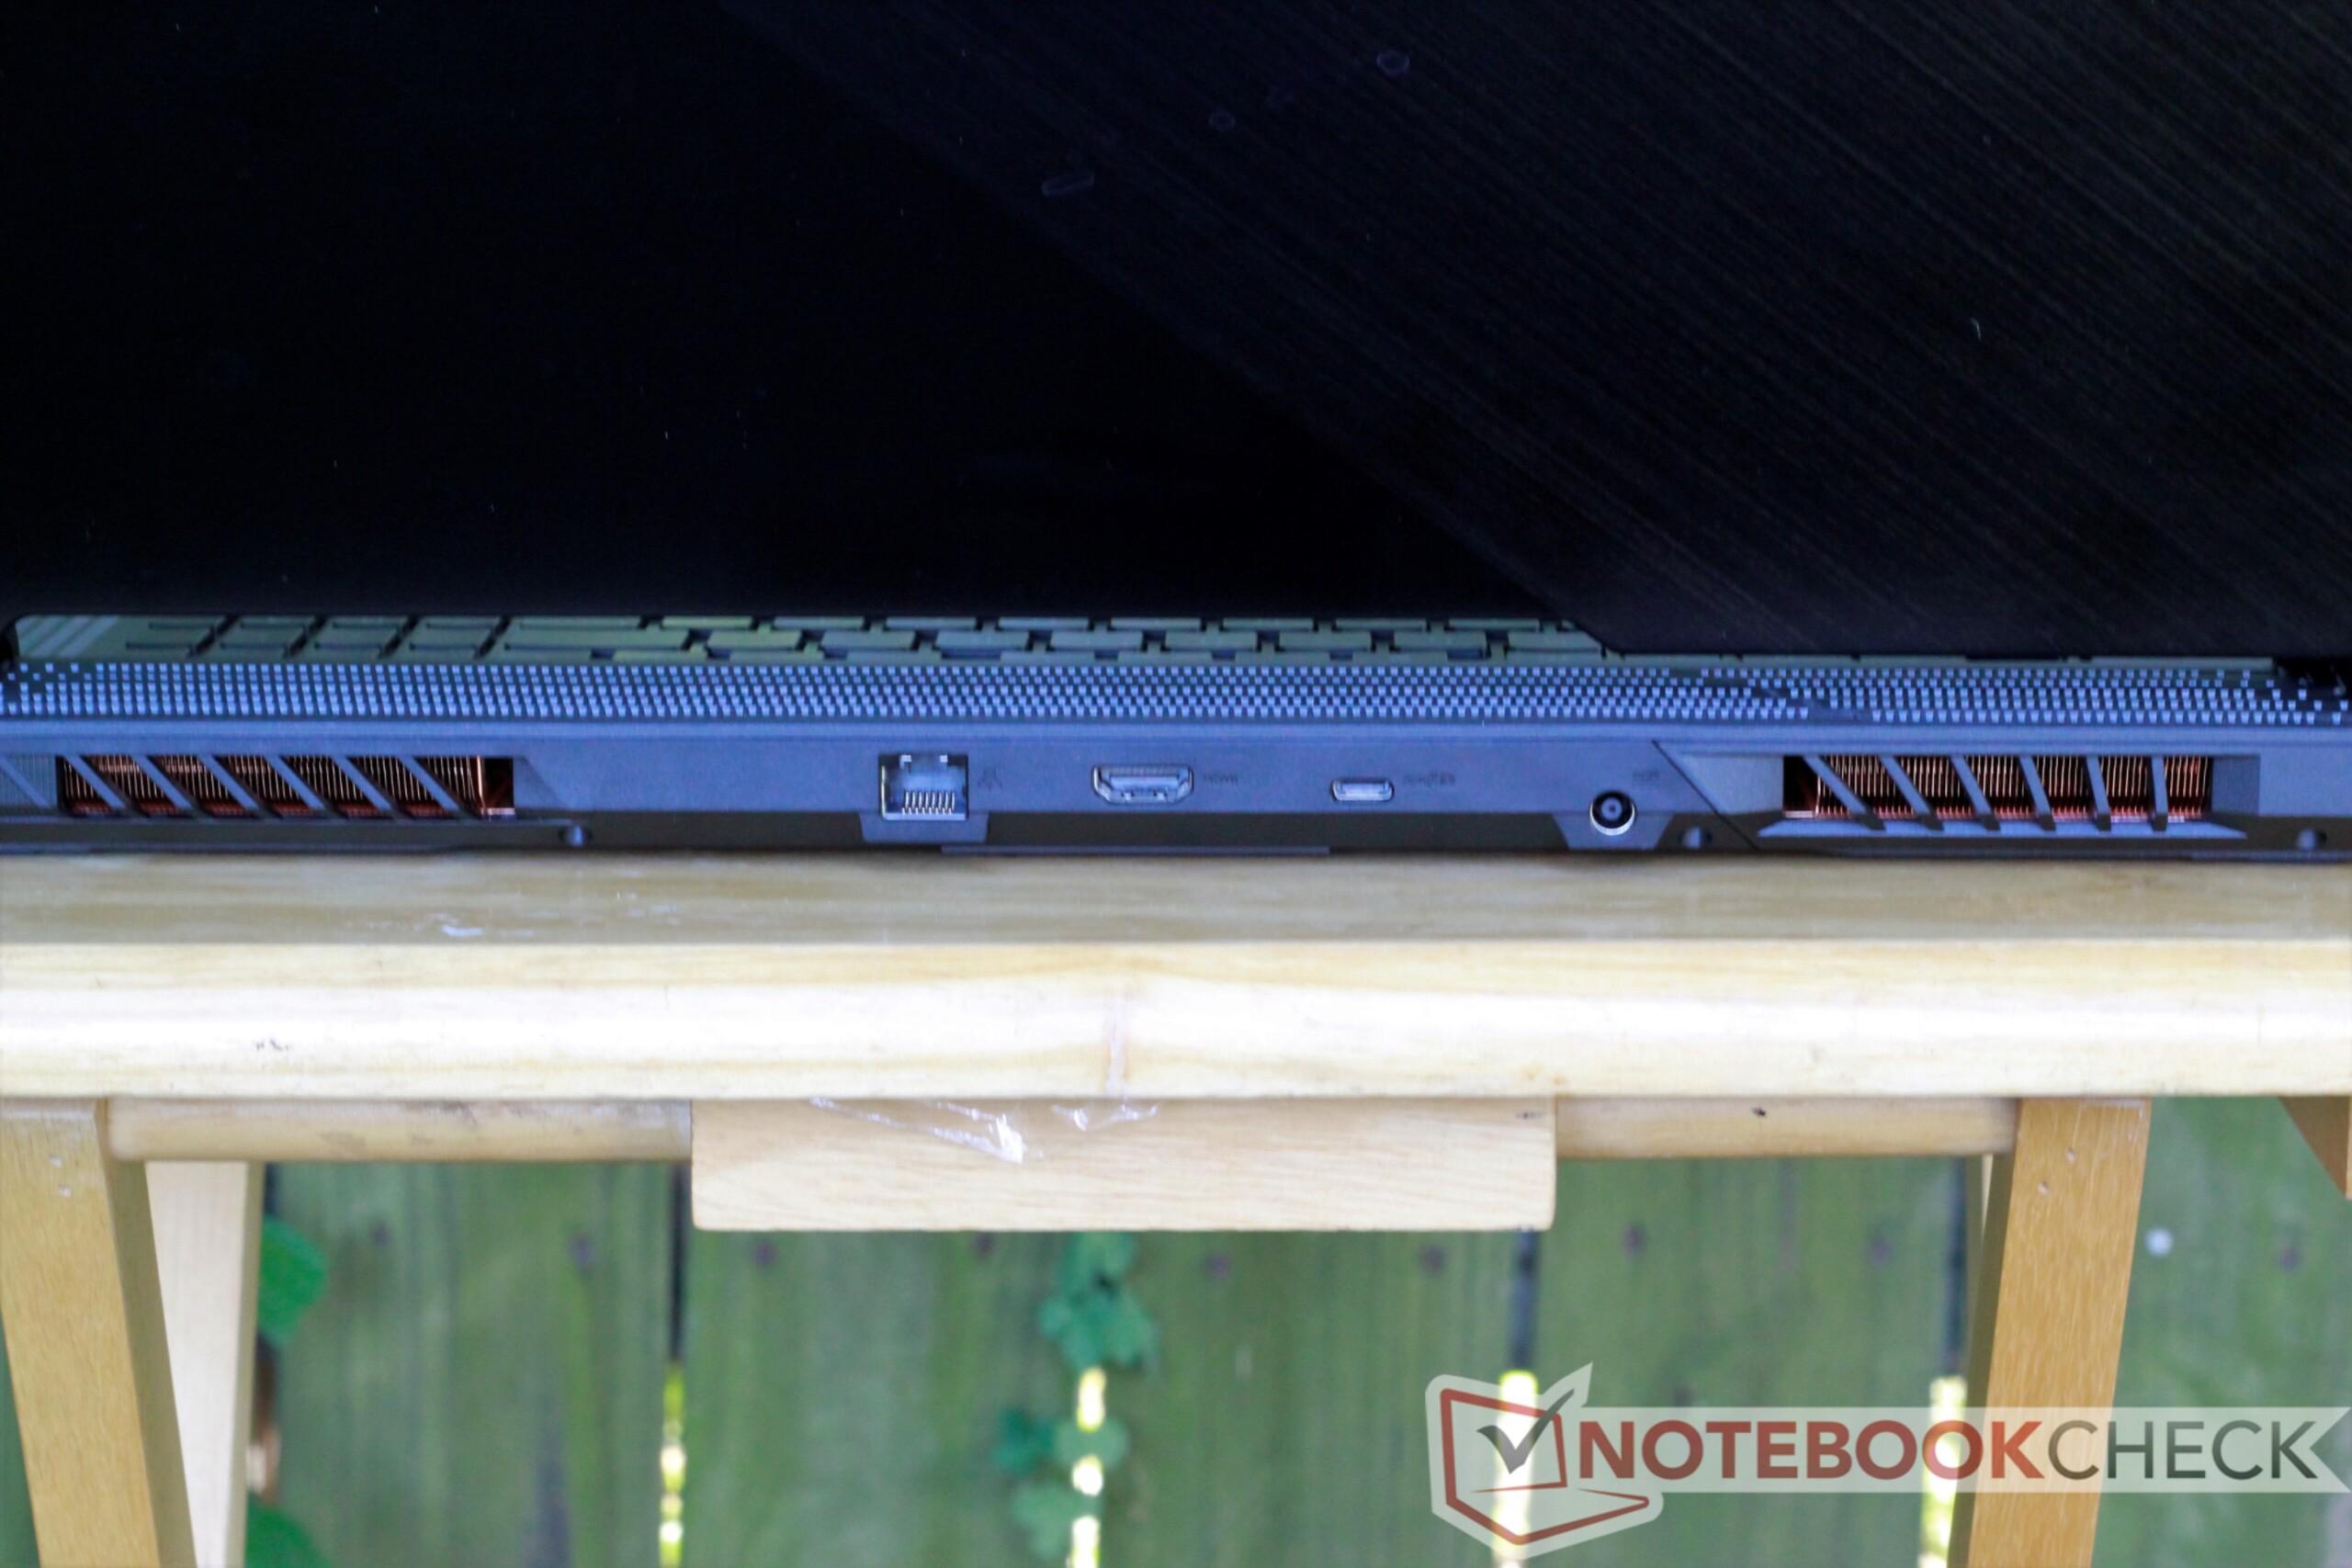
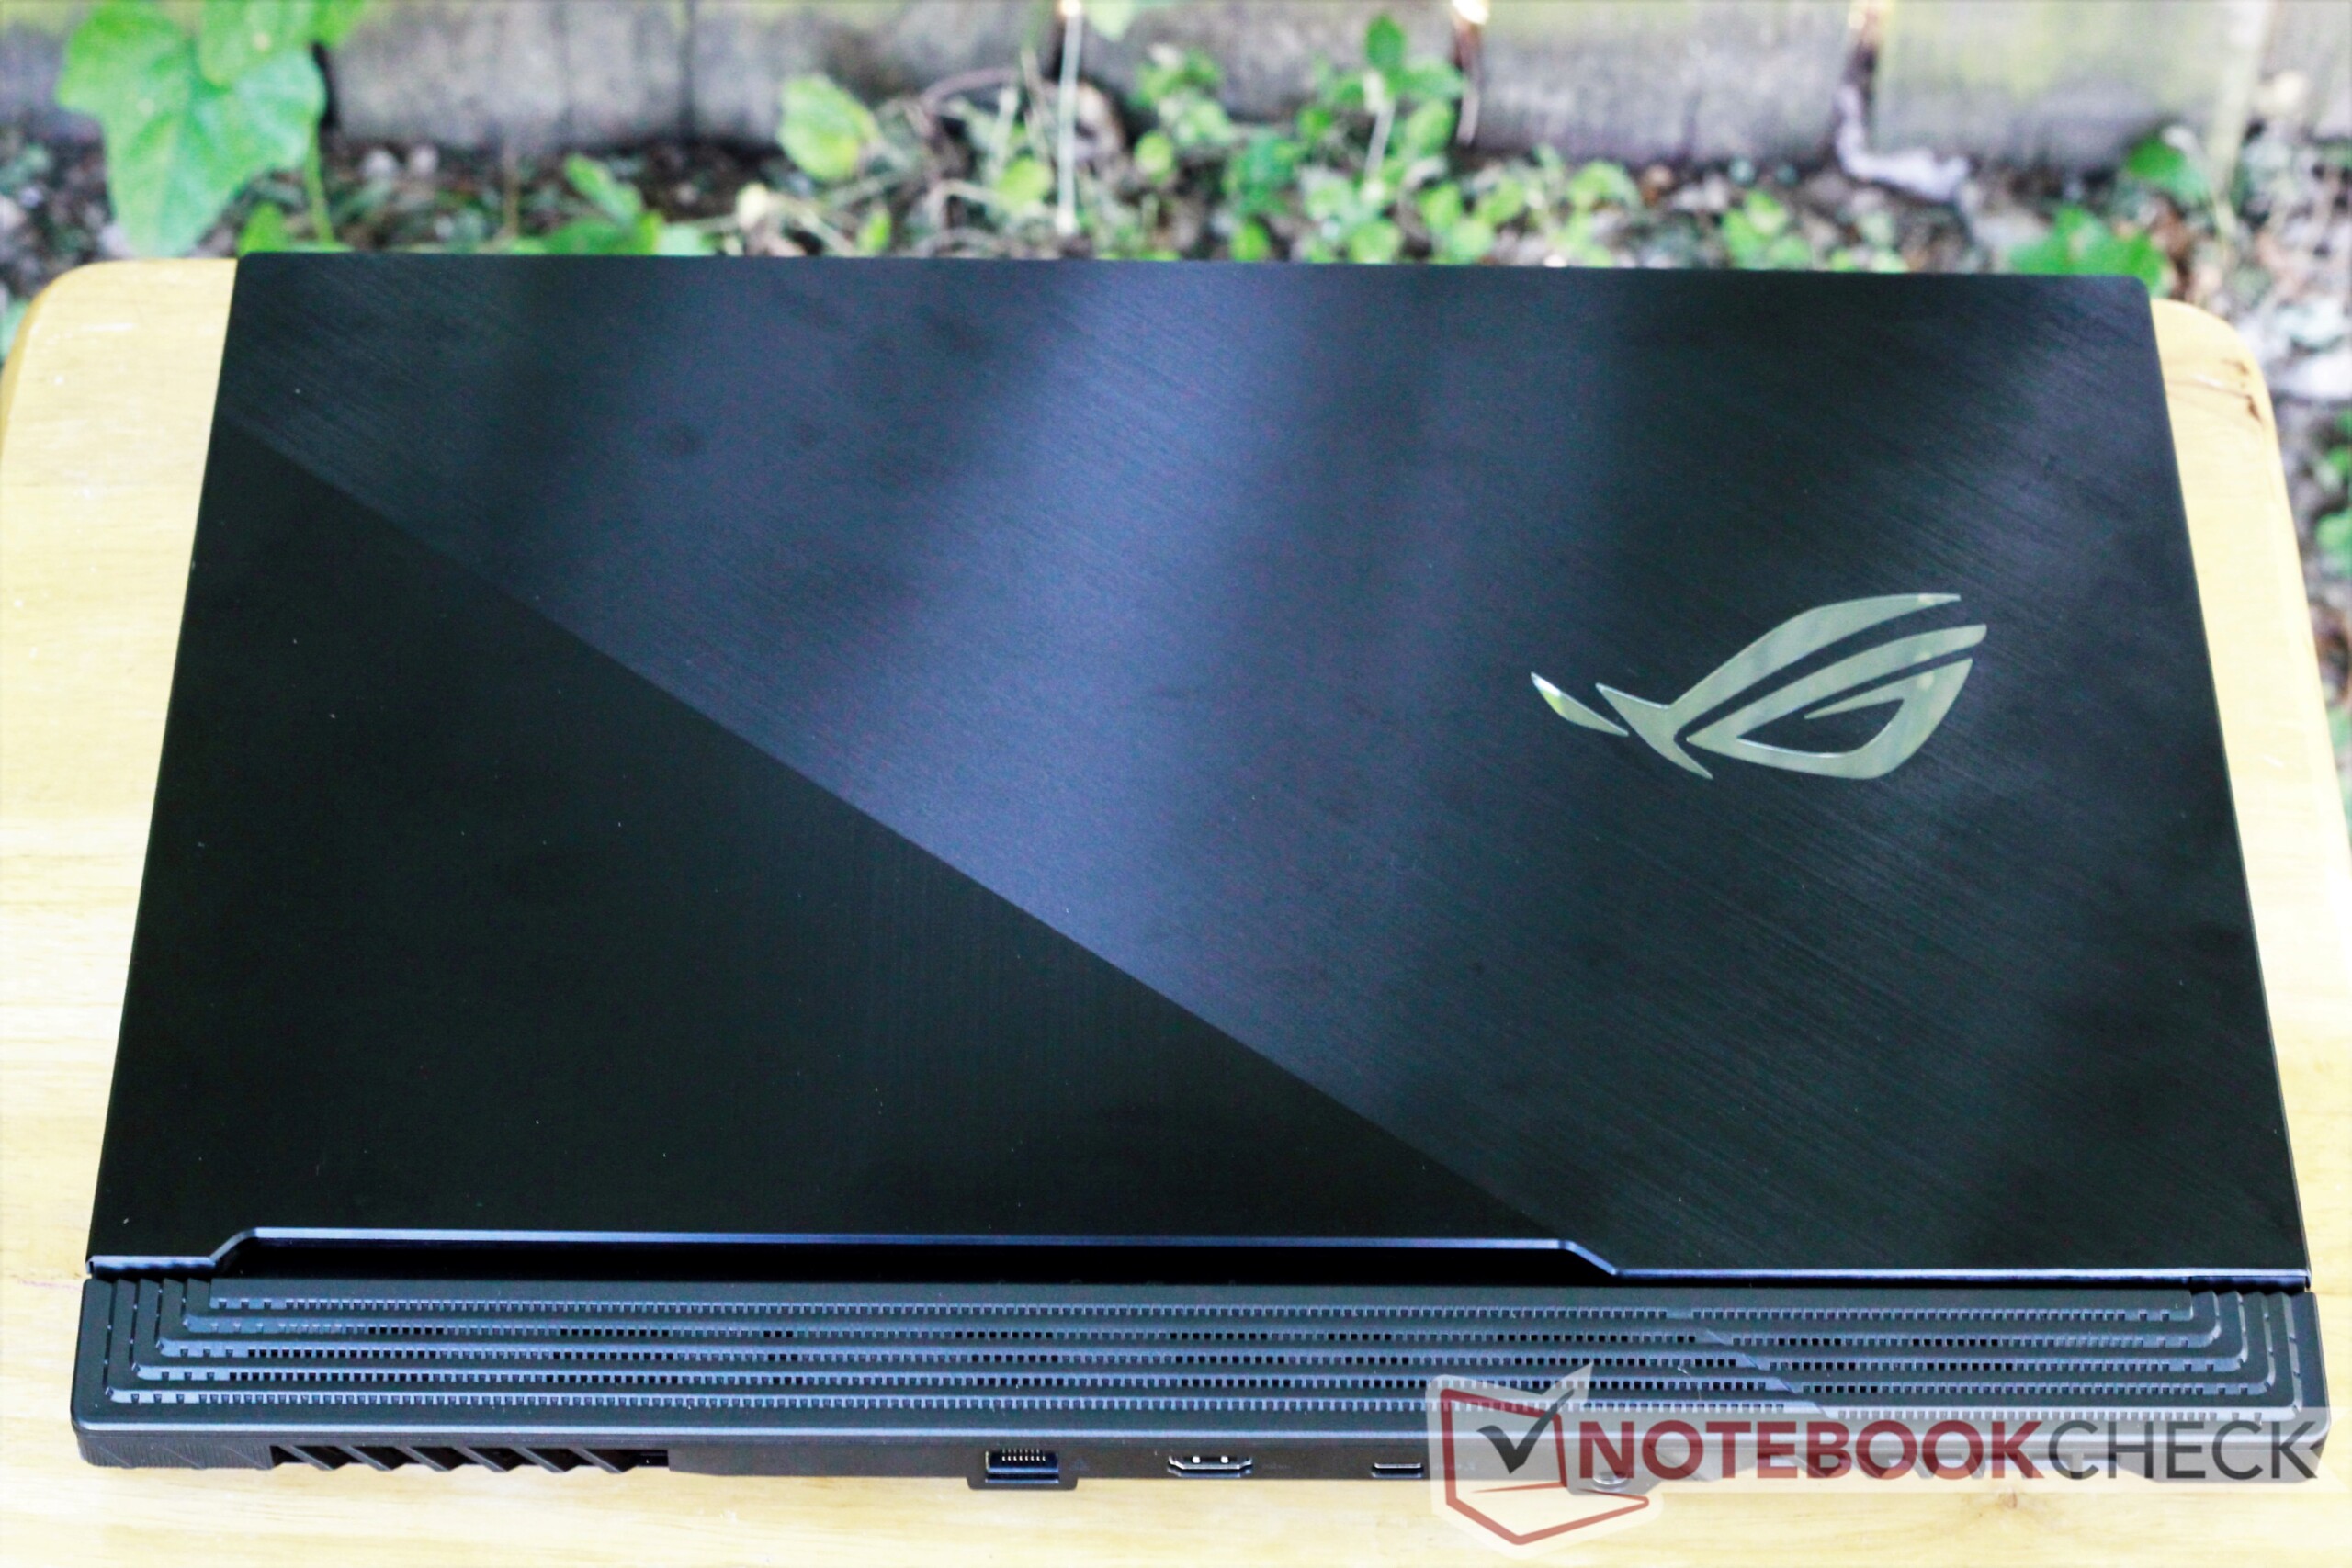
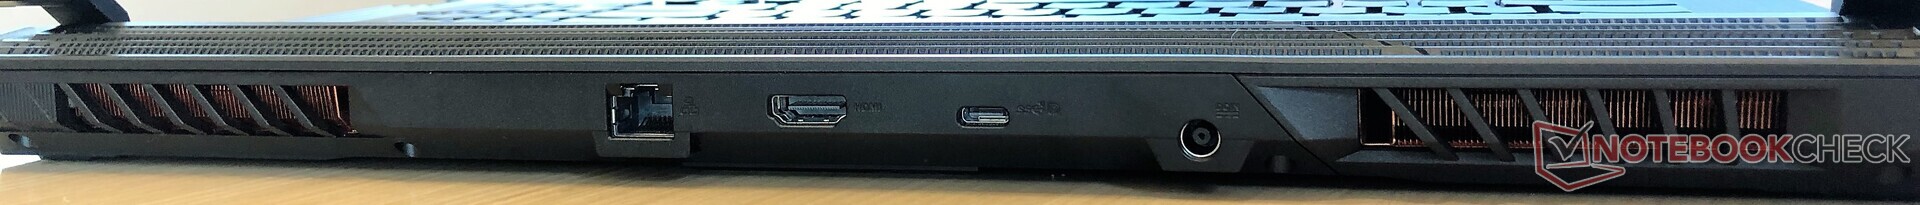
No entanto, existem muitos pequenos aborrecimentos que os potenciais compradores devem considerar. O logotipo RGB e a faixa RGB inferior não podem ser desativadas sem desativar a luz de fundo do teclado. Todas as portas USB estão no lado esquerdo da máquina, o que dificulta o roteamento de um cabo de mouse. Os cabos de fita RGB tornam a abertura do dispositivo para atualizações, uma lição de cautela. Por fim, o desempenho geral é um problema por trás dos portáteis concorrentes, Eurocom Nightsky RX17.
Tudo dito, o Asus G731GW flerta com a grandeza, mas é retido por uma soma de pequenas falhas. No entanto, considerando o preço relativamente baixo em comparação com outros portáteis de jogos de gama alta ($2000, ~ $2325 conforme configurado), estes pequenos aborrecimentos podem valer a pena.
Asus ASUS ROG Strix SCAR III G731GW-XB74
- 09/20/2019 v7 (old)
Sam Medley
Price comparison
