Breve Análise do Portátil Eurocom Nightsky RX17 (Clevo PB70RC/PB71RC)
| SD Card Reader | |
| average JPG Copy Test (av. of 3 runs) | |
| Eurocom Nightsky RX17 (Toshiba Exceria Pro SDXC 64 GB UHS-II) | |
| Eurocom Q8 (Toshiba Exceria Pro SDXC 64 GB UHS-II) | |
| Razer Blade Pro 17 RTX 2080 Max-Q (Toshiba Exceria Pro SDXC 64 GB UHS-II) | |
| Asus ZenBook 15 UX533FD (Toshiba Exceria Pro SDXC 64 GB UHS-II) | |
| maximum AS SSD Seq Read Test (1GB) | |
| Eurocom Nightsky RX17 (Toshiba Exceria Pro SDXC 64 GB UHS-II) | |
| Eurocom Q8 (Toshiba Exceria Pro SDXC 64 GB UHS-II) | |
| Razer Blade Pro 17 RTX 2080 Max-Q (Toshiba Exceria Pro SDXC 64 GB UHS-II) | |
| Asus ZenBook 15 UX533FD (Toshiba Exceria Pro SDXC 64 GB UHS-II) | |
| Networking | |
| iperf3 transmit AX12 | |
| Razer Blade Pro 17 RTX 2080 Max-Q | |
| Eurocom Q8 | |
| Asus Zephyrus S GX701GX | |
| Eurocom Nightsky RX17 | |
| iperf3 receive AX12 | |
| Razer Blade Pro 17 RTX 2080 Max-Q | |
| Asus Zephyrus S GX701GX | |
| Eurocom Q8 | |
| Eurocom Nightsky RX17 | |
| |||||||||||||||||||||||||
iluminação: 90 %
iluminação com acumulador: 298.4 cd/m²
Contraste: 995:1 (Preto: 0.3 cd/m²)
ΔE ColorChecker Calman: 3.58 | ∀{0.5-29.43 Ø4.71}
calibrated: 2.82
ΔE Greyscale Calman: 3.1 | ∀{0.09-98 Ø4.96}
92.7% sRGB (Argyll 1.6.3 3D)
60.2% AdobeRGB 1998 (Argyll 1.6.3 3D)
67.2% AdobeRGB 1998 (Argyll 3D)
93.1% sRGB (Argyll 3D)
66.1% Display P3 (Argyll 3D)
Gamma: 2.24
CCT: 7064 K
| Eurocom Nightsky RX17 BOE NV173FHM-N44, IPS, 17.3", 1920x1080 | Razer Blade Pro 17 RTX 2080 Max-Q AU Optronics B173HAN04.0, IPS, 17.3", 1920x1080 | Asus Zephyrus S GX701GX B173HAN04.0 (AUO409D), IPS, 17.3", 1920x1080 | MSI GS75 8SG Stealth N173HCE-G33 (CMN175C), IPS, 17.3", 1920x1080 | Eurocom Q8 AU Optronics B173QTN01.0, Dell P/N WJGD4, TN LED, 17.3", 2560x1440 | Lenovo Legion Y740-17ICH AU Optronics B173HAN03.2, IPS, 17.3", 1920x1080 | |
|---|---|---|---|---|---|---|
| Display | -7% | -5% | -2% | -12% | -3% | |
| Display P3 Coverage (%) | 66.1 | 60.6 -8% | 62.9 -5% | 63.6 -4% | 58.7 -11% | 64 -3% |
| sRGB Coverage (%) | 93.1 | 89 -4% | 87.8 -6% | 95.4 2% | 81 -13% | 90.4 -3% |
| AdobeRGB 1998 Coverage (%) | 67.2 | 62.1 -8% | 63.9 -5% | 65.5 -3% | 58.9 -12% | 64.8 -4% |
| Response Times | 34% | 32% | 31% | -10% | -9% | |
| Response Time Grey 50% / Grey 80% * (ms) | 16.4 ? | 6.8 ? 59% | 7.2 ? 56% | 7.6 ? 54% | 21.6 ? -32% | 15.6 ? 5% |
| Response Time Black / White * (ms) | 10.4 ? | 9.6 ? 8% | 9.6 ? 8% | 9.6 ? 8% | 9 ? 13% | 12.8 ? -23% |
| PWM Frequency (Hz) | 990 ? | 25510 ? | ||||
| Screen | 4% | 17% | 26% | -74% | -22% | |
| Brightness middle (cd/m²) | 298.4 | 299.3 0% | 288 -3% | 355 19% | 367.9 23% | 299.1 0% |
| Brightness (cd/m²) | 287 | 294 2% | 287 0% | 327 14% | 346 21% | 273 -5% |
| Brightness Distribution (%) | 90 | 94 4% | 91 1% | 85 -6% | 84 -7% | 81 -10% |
| Black Level * (cd/m²) | 0.3 | 0.29 3% | 0.2 33% | 0.26 13% | 0.55 -83% | 0.27 10% |
| Contrast (:1) | 995 | 1032 4% | 1440 45% | 1365 37% | 669 -33% | 1108 11% |
| Colorchecker dE 2000 * | 3.58 | 2.55 29% | 2.33 35% | 1.54 57% | 9.86 -175% | 5.07 -42% |
| Colorchecker dE 2000 max. * | 6.29 | 4.73 25% | 5.34 15% | 3 52% | 17.56 -179% | 10.55 -68% |
| Colorchecker dE 2000 calibrated * | 2.82 | 2.9 -3% | 2.47 12% | 0.77 73% | 4.43 -57% | 3.31 -17% |
| Greyscale dE 2000 * | 3.1 | 3.5 -13% | 1.19 62% | 2.19 29% | 12.4 -300% | 6.8 -119% |
| Gamma | 2.24 98% | 2.28 96% | 2.41 91% | 2.42 91% | 2.09 105% | 2.46 89% |
| CCT | 7064 92% | 7101 92% | 6710 97% | 6893 94% | 11064 59% | 7805 83% |
| Color Space (Percent of AdobeRGB 1998) (%) | 60.2 | 57 -5% | 57 -5% | 61 1% | 52.5 -13% | 58.5 -3% |
| Color Space (Percent of sRGB) (%) | 92.7 | 88.7 -4% | 88 -5% | 95 2% | 80.5 -13% | 89.9 -3% |
| Média Total (Programa/Configurações) | 10% /
6% | 15% /
15% | 18% /
22% | -32% /
-54% | -11% /
-17% |
* ... menor é melhor
Exibir tempos de resposta
| ↔ Tempo de resposta preto para branco | ||
|---|---|---|
| 10.4 ms ... ascensão ↗ e queda ↘ combinadas | ↗ 6 ms ascensão | 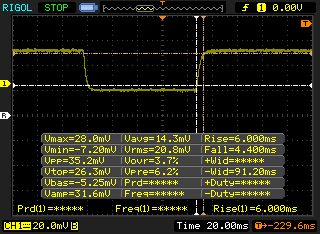 |
| ↘ 4.4 ms queda | ||
| A tela mostra boas taxas de resposta em nossos testes, mas pode ser muito lenta para jogadores competitivos. Em comparação, todos os dispositivos testados variam de 0.1 (mínimo) a 240 (máximo) ms. » 28 % de todos os dispositivos são melhores. Isso significa que o tempo de resposta medido é melhor que a média de todos os dispositivos testados (19.8 ms). | ||
| ↔ Tempo de resposta 50% cinza a 80% cinza | ||
| 16.4 ms ... ascensão ↗ e queda ↘ combinadas | ↗ 8.4 ms ascensão | 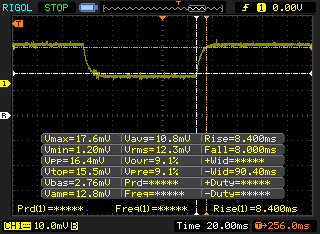 |
| ↘ 8 ms queda | ||
| A tela mostra boas taxas de resposta em nossos testes, mas pode ser muito lenta para jogadores competitivos. Em comparação, todos os dispositivos testados variam de 0.165 (mínimo) a 636 (máximo) ms. » 31 % de todos os dispositivos são melhores. Isso significa que o tempo de resposta medido é melhor que a média de todos os dispositivos testados (31 ms). | ||
Cintilação da tela / PWM (modulação por largura de pulso)
| Tela tremeluzindo/PWM detectado | 990 Hz | ≤ 99 % configuração de brilho | 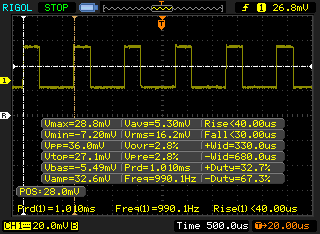 |
A luz de fundo da tela pisca em 990 Hz (pior caso, por exemplo, utilizando PWM) Cintilação detectada em uma configuração de brilho de 99 % e abaixo. Não deve haver cintilação ou PWM acima desta configuração de brilho. A frequência de 990 Hz é bastante alta, então a maioria dos usuários sensíveis ao PWM não deve notar nenhuma oscilação. [pwm_comparison] Em comparação: 52 % de todos os dispositivos testados não usam PWM para escurecer a tela. Se PWM foi detectado, uma média de 7754 (mínimo: 5 - máximo: 343500) Hz foi medida. | |||
| wPrime 2.10 - 1024m | |
| Asus ROG Zephyrus G15 GA502DU | |
| Alienware 17 R4 | |
| Média Intel Core i7-9750H (n=1) | |
| Eurocom Sky X7C | |
| MSI GE75 9SG | |
* ... menor é melhor
| PCMark 8 Home Score Accelerated v2 | 4402 pontos | |
| PCMark 8 Work Score Accelerated v2 | 5721 pontos | |
| PCMark 10 Score | 5982 pontos | |
Ajuda | ||
| Eurocom Nightsky RX17 2x Samsung SSD 970 Pro 512GB (RAID 0) | Razer Blade Pro 17 RTX 2080 Max-Q Samsung SSD PM981 MZVLB512HAJQ | MSI GS75 8SG Stealth 2x Samsung SSD PM981 MZVLB512HAJQ (RAID 0) | Eurocom Q8 Samsung SSD 960 Pro 512 GB m.2 | Lenovo Legion Y740-17ICH Samsung SSD PM981 MZVLB256HAHQ | |
|---|---|---|---|---|---|
| AS SSD | -12% | -2% | -11% | -26% | |
| Seq Read (MB/s) | 2297 | 1831 -20% | 3005 31% | 2481 8% | 1153 -50% |
| Seq Write (MB/s) | 2860 | 1744 -39% | 2668 -7% | 1869 -35% | 1328 -54% |
| 4K Read (MB/s) | 52.2 | 45.16 -13% | 40.89 -22% | 35.57 -32% | 35.05 -33% |
| 4K Write (MB/s) | 125.8 | 107.1 -15% | 94.4 -25% | 107.9 -14% | 96 -24% |
| 4K-64 Read (MB/s) | 1412 | 1240 -12% | 1366 -3% | 1232 -13% | 727 -49% |
| 4K-64 Write (MB/s) | 1228 | 1695 38% | 1197 -3% | 1285 5% | 1212 -1% |
| Access Time Read * (ms) | 0.04 | 0.064 -60% | 0.055 -38% | 0.043 -8% | 0.063 -58% |
| Access Time Write * (ms) | 0.09 | 0.037 59% | 0.039 57% | 0.035 61% | 0.04 56% |
| Score Read (Points) | 1694 | 1468 -13% | 1708 1% | 1515 -11% | 878 -48% |
| Score Write (Points) | 1640 | 1977 21% | 1558 -5% | 1579 -4% | 1441 -12% |
| Score Total (Points) | 4235 | 4197 -1% | 4123 -3% | 3840 -9% | 2784 -34% |
| Copy ISO MB/s (MB/s) | 2514 | 2086 -17% | 1596 -37% | 1487 -41% | |
| Copy Program MB/s (MB/s) | 592 | 425.5 -28% | 406.7 -31% | 608 3% | |
| Copy Game MB/s (MB/s) | 1494 | 555 -63% | 958 -36% | 1162 -22% |
* ... menor é melhor

| 3DMark 11 Performance | 21509 pontos | |
| 3DMark Cloud Gate Standard Score | 40478 pontos | |
| 3DMark Fire Strike Score | 18195 pontos | |
| 3DMark Time Spy Score | 7863 pontos | |
Ajuda | ||
| The Witcher 3 - 1920x1080 Ultra Graphics & Postprocessing (HBAO+) | |
| Asus ROG Strix RTX 2080 OC | |
| MSI GT76 Titan DT 9SG | |
| Razer Blade Pro 17 RTX 2080 Max-Q | |
| Média NVIDIA GeForce RTX 2070 Mobile (64 - 82.1, n=21) | |
| Eurocom Nightsky RX17 | |
| MSI GT63 Titan 8RG-046 | |
| Dell G7 17 7790 | |
| MSI GL73 8SE-010US | |
| Asus ROG Zephyrus G15 GA502DU | |
| Eurocom Q8 | |
| Asus TUF FX705DT-AU068T | |
| Asus G752VY-GC110T | |
| Asus ZenBook 15 UX533FD | |
| baixo | média | alto | ultra | |
|---|---|---|---|---|
| BioShock Infinite (2013) | 355 | 305.3 | 272.2 | 172.9 |
| The Witcher 3 (2015) | 317.7 | 245.5 | 145.1 | 73.8 |
| Rise of the Tomb Raider (2016) | 218.2 | 201.7 | 148.5 | 122 |
| Eurocom Nightsky RX17 GeForce RTX 2070 Mobile, i7-9750H, 2x Samsung SSD 970 Pro 512GB (RAID 0) | Razer Blade Pro 17 RTX 2080 Max-Q GeForce RTX 2080 Max-Q, i7-9750H, Samsung SSD PM981 MZVLB512HAJQ | Asus Zephyrus S GX701GX GeForce RTX 2080 Max-Q, i7-8750H, Samsung SSD PM981 MZVLB1T0HALR | MSI GS75 8SG Stealth GeForce RTX 2080 Max-Q, i7-8750H, 2x Samsung SSD PM981 MZVLB512HAJQ (RAID 0) | Eurocom Q8 GeForce GTX 1070 Mobile, i9-8950HK, Samsung SSD 960 Pro 512 GB m.2 | Asus Strix Scar III G531GW GeForce RTX 2070 Mobile, i9-9880H, Intel SSD 660p 1TB SSDPEKNW010T8 | |
|---|---|---|---|---|---|---|
| Noise | 2% | -2% | -5% | -1% | -12% | |
| desligado / ambiente * (dB) | 28 | 28.2 -1% | 29 -4% | 30 -7% | 28 -0% | 29 -4% |
| Idle Minimum * (dB) | 28 | 28.2 -1% | 29 -4% | 31 -11% | 28.2 -1% | 30 -7% |
| Idle Average * (dB) | 28.4 | 28.2 1% | 32 -13% | 32 -13% | 31.8 -12% | 37 -30% |
| Idle Maximum * (dB) | 32.9 | 30.8 6% | 33 -0% | 41 -25% | 36.3 -10% | 39 -19% |
| Load Average * (dB) | 45 | 42 7% | 47 -4% | 47 -4% | 46.7 -4% | 54 -20% |
| Witcher 3 ultra * (dB) | 53.2 | 51 4% | 49 8% | 47 12% | 46.9 12% | 54 -2% |
| Load Maximum * (dB) | 53.2 | 53 -0% | 51 4% | 48 10% | 49.7 7% | 54 -2% |
* ... menor é melhor
Barulho
| Ocioso |
| 28 / 28.4 / 32.9 dB |
| Carga |
| 45 / 53.2 dB |
 | ||
30 dB silencioso 40 dB(A) audível 50 dB(A) ruidosamente alto |
||
min: | ||
(-) A temperatura máxima no lado superior é 48.6 °C / 119 F, em comparação com a média de 40.4 °C / 105 F , variando de 21.2 a 68.8 °C para a classe Gaming.
(-) A parte inferior aquece até um máximo de 46.8 °C / 116 F, em comparação com a média de 43.2 °C / 110 F
(+) Em uso inativo, a temperatura média para o lado superior é 31.4 °C / 89 F, em comparação com a média do dispositivo de 33.9 °C / ### class_avg_f### F.
(±) Jogando The Witcher 3, a temperatura média para o lado superior é 37.1 °C / 99 F, em comparação com a média do dispositivo de 33.9 °C / ## #class_avg_f### F.
(+) Os apoios para as mãos e o touchpad são mais frios que a temperatura da pele, com um máximo de 31.2 °C / 88.2 F e, portanto, são frios ao toque.
(-) A temperatura média da área do apoio para as mãos de dispositivos semelhantes foi 28.8 °C / 83.8 F (-2.4 °C / -4.4 F).
Eurocom Nightsky RX17 análise de áudio
(+) | os alto-falantes podem tocar relativamente alto (###valor### dB)
Graves 100 - 315Hz
(±) | graves reduzidos - em média 8.5% menor que a mediana
(+) | o baixo é linear (5.3% delta para a frequência anterior)
Médios 400 - 2.000 Hz
(±) | médios mais altos - em média 5.4% maior que a mediana
(+) | médios são lineares (4.8% delta para frequência anterior)
Altos 2 - 16 kHz
(+) | agudos equilibrados - apenas 1.1% longe da mediana
(+) | os máximos são lineares (4.1% delta da frequência anterior)
Geral 100 - 16.000 Hz
(+) | o som geral é linear (12% diferença em relação à mediana)
Comparado com a mesma classe
» 12% de todos os dispositivos testados nesta classe foram melhores, 4% semelhantes, 84% piores
» O melhor teve um delta de 6%, a média foi 18%, o pior foi 132%
Comparado com todos os dispositivos testados
» 9% de todos os dispositivos testados foram melhores, 2% semelhantes, 88% piores
» O melhor teve um delta de 4%, a média foi 23%, o pior foi 134%
Apple MacBook 12 (Early 2016) 1.1 GHz análise de áudio
(+) | os alto-falantes podem tocar relativamente alto (###valor### dB)
Graves 100 - 315Hz
(±) | graves reduzidos - em média 11.3% menor que a mediana
(±) | a linearidade dos graves é média (14.2% delta para a frequência anterior)
Médios 400 - 2.000 Hz
(+) | médios equilibrados - apenas 2.4% longe da mediana
(+) | médios são lineares (5.5% delta para frequência anterior)
Altos 2 - 16 kHz
(+) | agudos equilibrados - apenas 2% longe da mediana
(+) | os máximos são lineares (4.5% delta da frequência anterior)
Geral 100 - 16.000 Hz
(+) | o som geral é linear (10.2% diferença em relação à mediana)
Comparado com a mesma classe
» 7% de todos os dispositivos testados nesta classe foram melhores, 2% semelhantes, 90% piores
» O melhor teve um delta de 5%, a média foi 18%, o pior foi 53%
Comparado com todos os dispositivos testados
» 5% de todos os dispositivos testados foram melhores, 1% semelhantes, 94% piores
» O melhor teve um delta de 4%, a média foi 23%, o pior foi 134%
| desligado | |
| Ocioso | |
| Carga |
|
Key:
min: | |
| Eurocom Nightsky RX17 i7-9750H, GeForce RTX 2070 Mobile, 2x Samsung SSD 970 Pro 512GB (RAID 0), IPS, 1920x1080, 17.3" | Razer Blade Pro 17 RTX 2080 Max-Q i7-9750H, GeForce RTX 2080 Max-Q, Samsung SSD PM981 MZVLB512HAJQ, IPS, 1920x1080, 17.3" | Eurocom Q8 i9-8950HK, GeForce GTX 1070 Mobile, Samsung SSD 960 Pro 512 GB m.2, TN LED, 2560x1440, 17.3" | Dell G7 17 7790 i7-8750H, GeForce RTX 2070 Max-Q, Toshiba BG3 KBG30ZMS256G, IPS, 1920x1080, 17.3" | MSI GL73 8SE-010US i7-8750H, GeForce RTX 2060 Mobile, Kingston RBUSNS8154P3128GJ, TN LED, 1920x1080, 17.3" | Alienware 17 R4 i7-7820HK, GeForce GTX 1080 Mobile, SK Hynix PC300 NVMe 512 GB, TN LED, 2560x1440, 17.3" | |
|---|---|---|---|---|---|---|
| Power Consumption | 3% | -12% | 18% | 25% | -46% | |
| Idle Minimum * (Watt) | 18.6 | 16.2 13% | 26.3 -41% | 9.5 49% | 8.8 53% | 37.5 -102% |
| Idle Average * (Watt) | 22.6 | 20.4 10% | 29 -28% | 16.2 28% | 16.2 28% | 37.6 -66% |
| Idle Maximum * (Watt) | 23 | 26.1 -13% | 32.3 -40% | 23.8 -3% | 18.3 20% | 37.6 -63% |
| Load Average * (Watt) | 93.4 | 96.5 -3% | 82.4 12% | 101.7 -9% | 86.1 8% | 122.4 -31% |
| Witcher 3 ultra * (Watt) | 186.4 | 182.9 2% | 192 -3% | 155 17% | 146.7 21% | 180.3 3% |
| Load Maximum * (Watt) | 233.6 | 214.3 8% | 170.2 27% | 172.2 26% | 186.4 20% | 277.4 -19% |
* ... menor é melhor
| Eurocom Nightsky RX17 i7-9750H, GeForce RTX 2070 Mobile, 62 Wh | Razer Blade Pro 17 RTX 2080 Max-Q i7-9750H, GeForce RTX 2080 Max-Q, 70 Wh | Asus Zephyrus S GX701GX i7-8750H, GeForce RTX 2080 Max-Q, 76 Wh | MSI GS75 8SG Stealth i7-8750H, GeForce RTX 2080 Max-Q, 80.25 Wh | Eurocom Q8 i9-8950HK, GeForce GTX 1070 Mobile, 66 Wh | Lenovo Legion Y740-17ICH i7-8750H, GeForce RTX 2080 Max-Q, 76 Wh | |
|---|---|---|---|---|---|---|
| Duração da bateria | 56% | 28% | 74% | 30% | 60% | |
| Reader / Idle (h) | 4.2 | 4.9 17% | 5 19% | 7.7 83% | ||
| WiFi v1.3 (h) | 2 | 4.7 135% | 3.8 90% | 5.3 165% | 2.6 30% | 3.2 60% |
| Load (h) | 1.2 | 1.4 17% | 0.9 -25% | 0.9 -25% |
Pro
Contra
Sempre citamos a facilidade de manutenção como a principal razão para possuir um portátil baseado em Clevo sobre opções mais populares da Asus, Alienware, Acer ou MSI. Infelizmente, este não é o caso do Eurocom Nightsky RX17. O fato de haver de duas a três vezes mais parafusos para serem removidos e de que o teclado precisa ser desconectado apenas para atualizar algo tão simples quanto RAM ou armazenamento é um passo na direção oposta. Os projetos da Clevo sempre foram bem-sucedidos em conectar o usuário aos componentes principais de um portátil mais do que os concorrentes, mas não sentimos o mesmo vínculo com a natureza fechada do Nightsky RX17. Quando se torna mais rápido e fácil adicionar uma barra de RAM a um Razer Blade Pro 17 do que a um barebone maior Clevo, então você sabe que fez algo errado em algum ponto.
Além da decepcionante capacidade de manutenção, o Nightsky RX17 não faz o suficiente para se destacar no mar de alternativas de jogos de 17 polegadas. Sim, o desempenho é excelente, mas o ruído do ventilador, a duração da bateria, a superfície do clickpad e a rigidez do chassi podem ser melhorados. O Asus ROG Strix Hero III G731GW pode ser encontrado on-line com a mesma CPU Core i7-9750H, GPU RTX 2070 e tela de 144 Hz como nossa configuração Eurocom por cerca de US $200 a US $300 a menos. Se você está insistindo em ter o melhor que o Clevo tem para oferecer, então o Eurocom Sky X4C ou X7C será uma melhor compra que o Nightsky RX17.
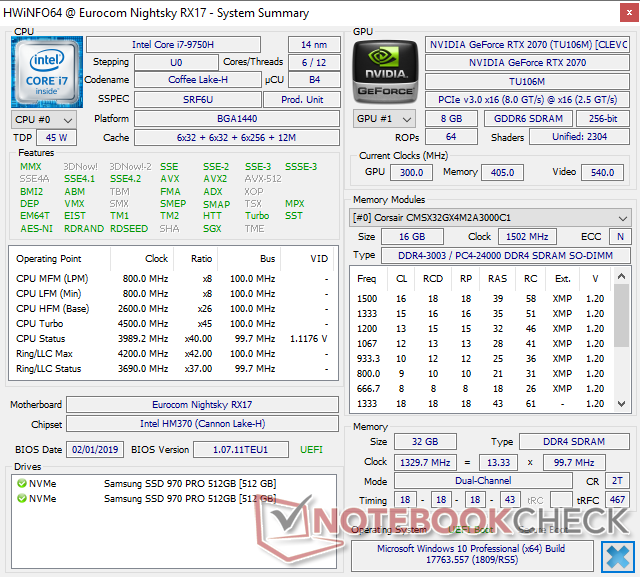
O Nightsky RX17 funciona um pouco mais rápido do que um portátil concorrente com o mesmo Core i7-9750H e GeForce RTX 2070. Infelizmente, é provável que também seja significativamente mais difícil fazer a manutenção ou atualizar.
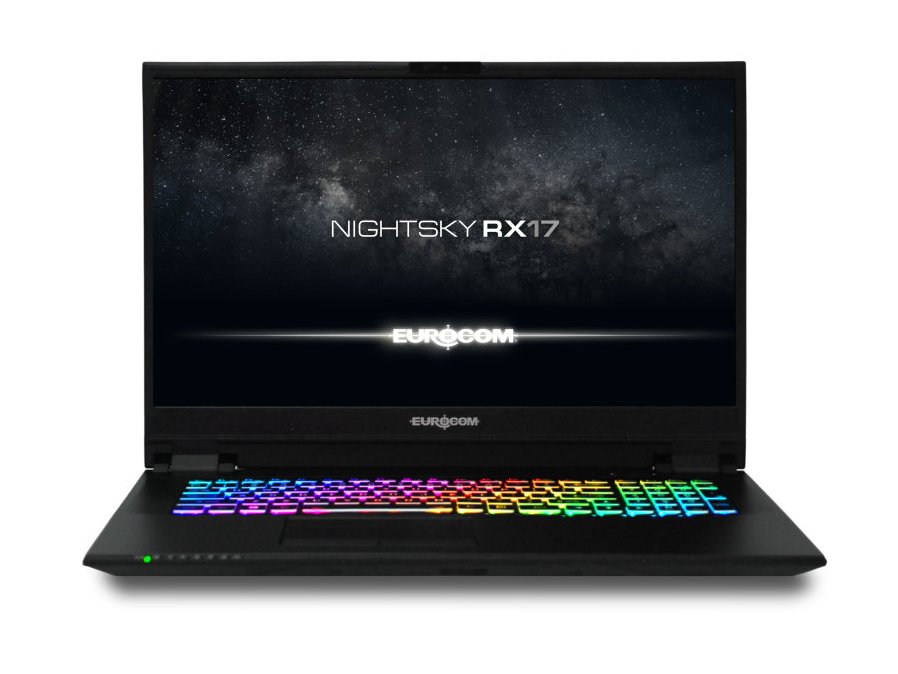
Eurocom Nightsky RX17
- 07/01/2019 v6 (old)
Allen Ngo
Price comparison
