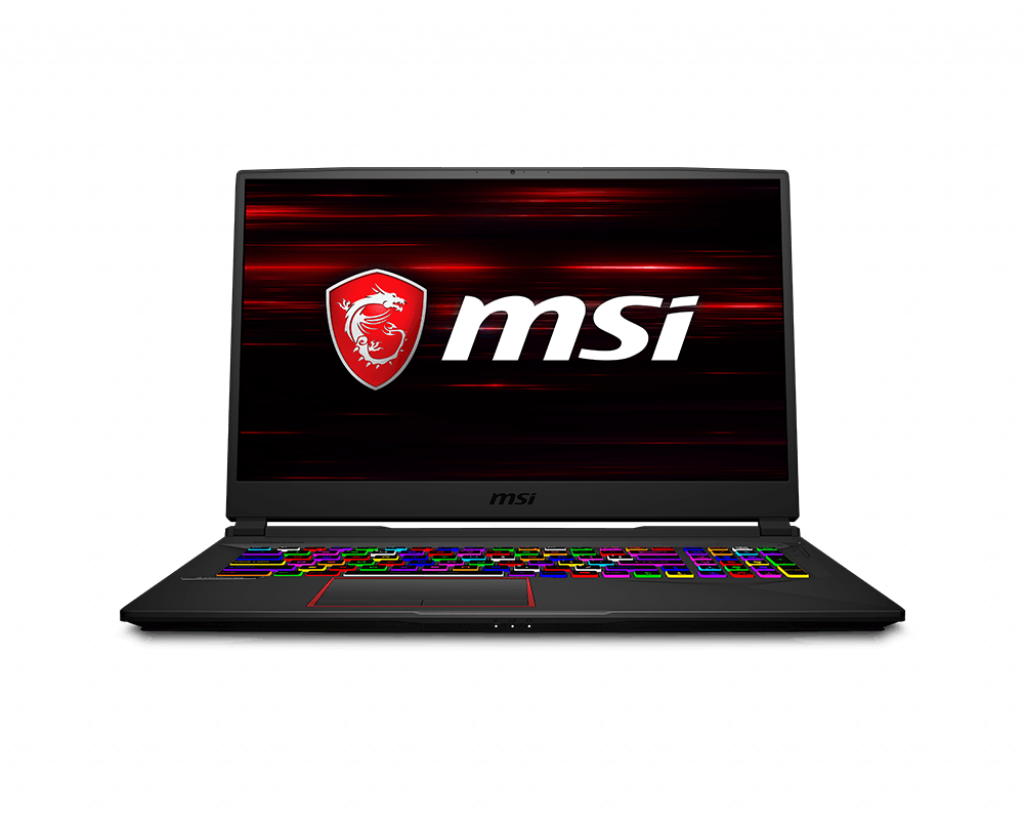
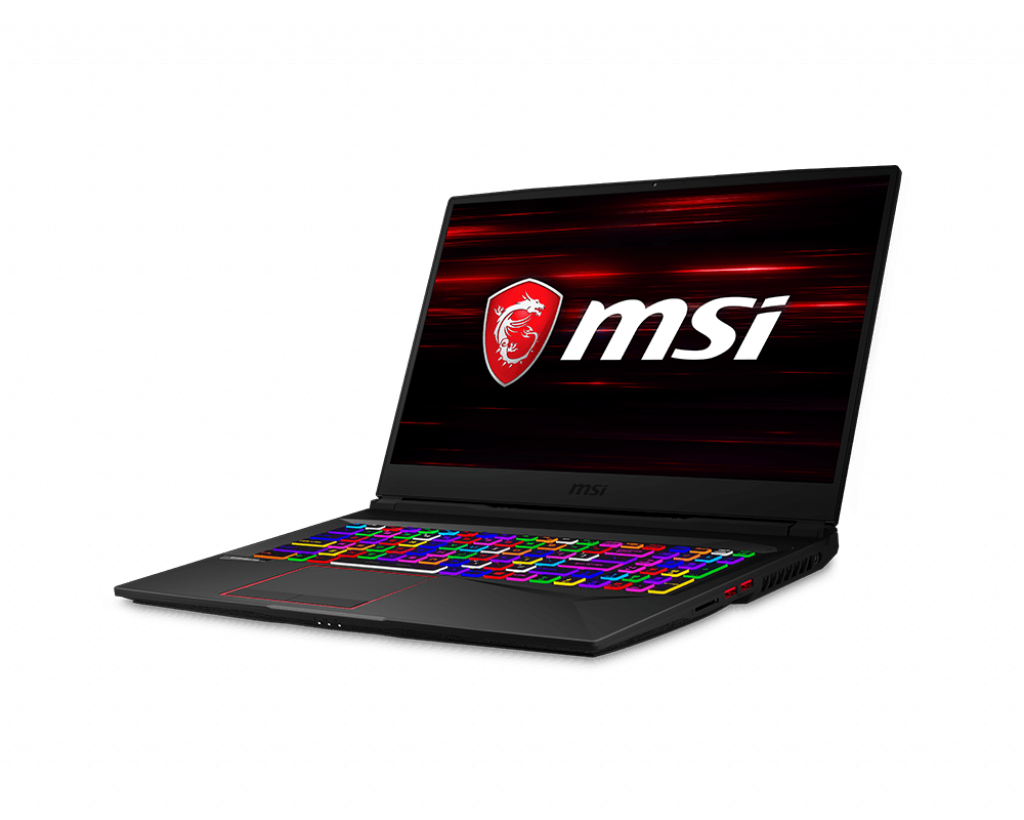
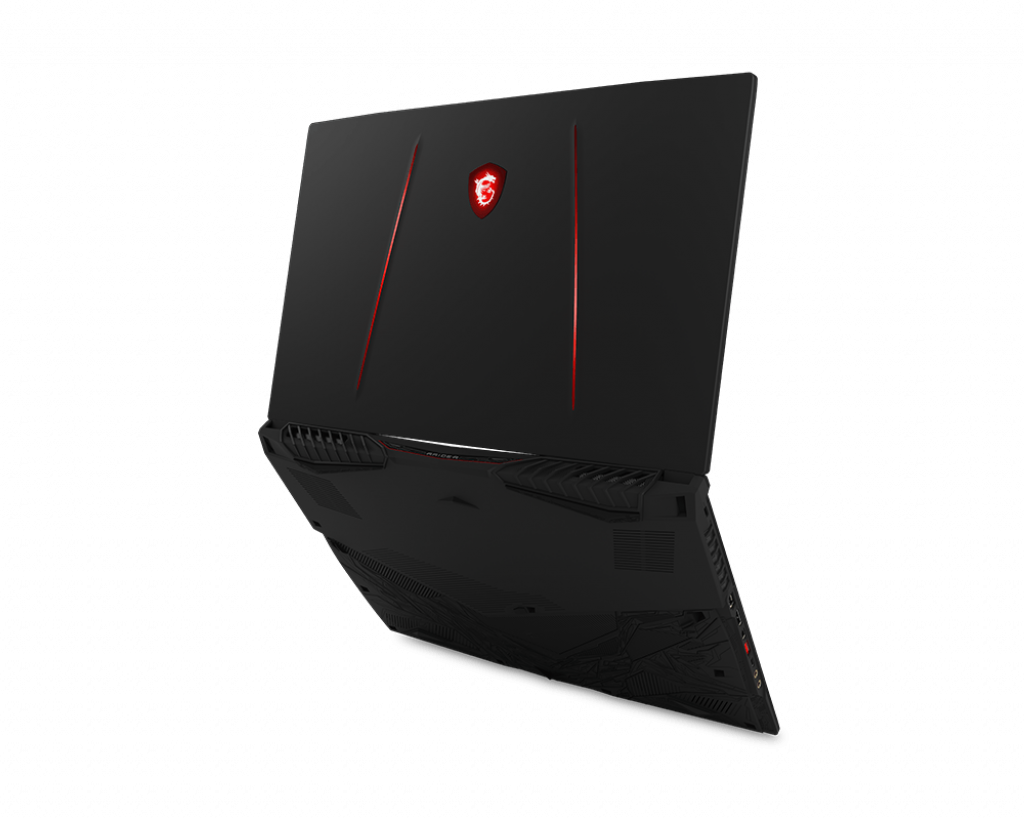
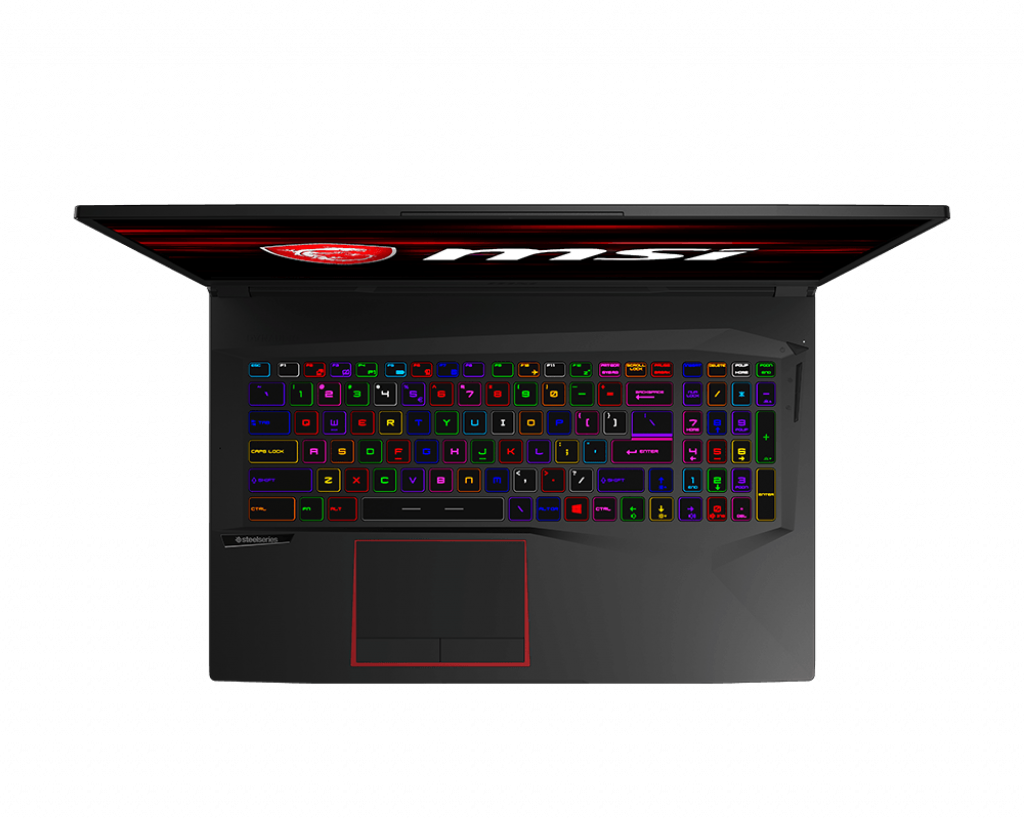
Breve Análise do Portátil MSI GE75 Raider 9SG (Core i9-9880H, RTX 2080)
| SD Card Reader | |
| average JPG Copy Test (av. of 3 runs) | |
| Dell XPS 15 9570 Core i9 UHD (Toshiba Exceria Pro SDXC 64 GB UHS-II) | |
| MSI GT75 8RG-090 Titan (Toshiba Exceria Pro SDXC 64 GB UHS-II) | |
| MSI GE75 9SG (Toshiba Exceria Pro SDXC 64 GB UHS-II) | |
| MSI GE73 8RF-008 Raider RGB (Toshiba Exceria Pro SDXC 64 GB UHS-II) | |
| maximum AS SSD Seq Read Test (1GB) | |
| Dell XPS 15 9570 Core i9 UHD (Toshiba Exceria Pro SDXC 64 GB UHS-II) | |
| MSI GT75 8RG-090 Titan (Toshiba Exceria Pro SDXC 64 GB UHS-II) | |
| MSI GE75 9SG (Toshiba Exceria Pro SDXC 64 GB UHS-II) | |
| MSI GE73 8RF-008 Raider RGB (Toshiba Exceria Pro SDXC 64 GB UHS-II) | |
| Networking | |
| iperf3 transmit AX12 | |
| MSI GT75 8RG-090 Titan | |
| MSI GE75 9SG | |
| Acer Predator Triton 700 | |
| Asus TUF FX705DY-AU072 | |
| iperf3 receive AX12 | |
| MSI GT75 8RG-090 Titan | |
| Acer Predator Triton 700 | |
| MSI GE75 9SG | |
| Asus TUF FX705DY-AU072 | |
| |||||||||||||||||||||||||
iluminação: 89 %
iluminação com acumulador: 400.7 cd/m²
Contraste: 1179:1 (Preto: 0.34 cd/m²)
ΔE ColorChecker Calman: 1.33 | ∀{0.5-29.43 Ø4.72}
calibrated: 1.39
ΔE Greyscale Calman: 1.3 | ∀{0.09-98 Ø4.97}
92.1% sRGB (Argyll 1.6.3 3D)
58.2% AdobeRGB 1998 (Argyll 1.6.3 3D)
63.5% AdobeRGB 1998 (Argyll 3D)
92% sRGB (Argyll 3D)
61.5% Display P3 (Argyll 3D)
Gamma: 2.24
CCT: 6735 K
| MSI GE75 9SG Chi Mei N173HCE-G33, AHVA, 17.3", 1920x1080 | Asus TUF FX705DY-AU072 AU Optronics B173HAN04.2, IPS, 17.3", 1920x1080 | Asus Zephyrus S GX701GX B173HAN04.0 (AUO409D), IPS, 17.3", 1920x1080 | MSI GT75 8RG-090 Titan CMN N173HHE-G32 (CMN1747), TN, 17.3", 1920x1080 | Acer Predator Triton 700 AUO B156HAN04.2 (AUO42ED), IPS, 15.6", 1920x1080 | MSI GE73 8RF-008 Raider RGB Chi Mei N173HHE-G32 (CMN1747), TN WLED, 17.3", 1920x1080 | |
|---|---|---|---|---|---|---|
| Display | -1% | 31% | -1% | 31% | ||
| Display P3 Coverage (%) | 61.5 | 62.9 2% | 90.9 48% | 62.5 2% | 90.8 48% | |
| sRGB Coverage (%) | 92 | 87.8 -5% | 100 9% | 88.7 -4% | 99.9 9% | |
| AdobeRGB 1998 Coverage (%) | 63.5 | 63.9 1% | 86.2 36% | 63.5 0% | 85.8 35% | |
| Response Times | -383% | -23% | 2% | -435% | -198% | |
| Response Time Grey 50% / Grey 80% * (ms) | 7.2 ? | 40 ? -456% | 7.2 ? -0% | 8 ? -11% | 44.8 ? -522% | 28 ? -289% |
| Response Time Black / White * (ms) | 6.6 ? | 27 ? -309% | 9.6 ? -45% | 5.6 ? 15% | 29.6 ? -348% | 13.6 ? -106% |
| PWM Frequency (Hz) | 26040 ? | 26000 ? | 25000 ? | |||
| Screen | -34% | -17% | -14% | -94% | -40% | |
| Brightness middle (cd/m²) | 400.7 | 322 -20% | 288 -28% | 240 -40% | 291 -27% | 273 -32% |
| Brightness (cd/m²) | 372 | 303 -19% | 287 -23% | 248 -33% | 277 -26% | 273 -27% |
| Brightness Distribution (%) | 89 | 84 -6% | 91 2% | 83 -7% | 84 -6% | 90 1% |
| Black Level * (cd/m²) | 0.34 | 0.32 6% | 0.2 41% | 0.22 35% | 0.22 35% | 0.26 24% |
| Contrast (:1) | 1179 | 1006 -15% | 1440 22% | 1091 -7% | 1323 12% | 1050 -11% |
| Colorchecker dE 2000 * | 1.33 | 2.97 -123% | 2.33 -75% | 2.14 -61% | 5.52 -315% | 3.52 -165% |
| Colorchecker dE 2000 max. * | 3.51 | 5.08 -45% | 5.34 -52% | 5.04 -44% | 10.72 -205% | 6.34 -81% |
| Colorchecker dE 2000 calibrated * | 1.39 | 2.29 -65% | 2.47 -78% | 1.54 -11% | 2.09 -50% | |
| Greyscale dE 2000 * | 1.3 | 2.26 -74% | 1.19 8% | 1.62 -25% | 6.59 -407% | 3.11 -139% |
| Gamma | 2.24 98% | 2.45 90% | 2.41 91% | 2.28 96% | 2.44 90% | 2.43 91% |
| CCT | 6735 97% | 6892 94% | 6710 97% | 6846 95% | 7816 83% | 6999 93% |
| Color Space (Percent of AdobeRGB 1998) (%) | 58.2 | 57 -2% | 57 -2% | 77 32% | 58 0% | 76 31% |
| Color Space (Percent of sRGB) (%) | 92.1 | 87 -6% | 88 -4% | 100 9% | 89 -3% | 100 9% |
| Média Total (Programa/Configurações) | -209% /
-87% | -14% /
-15% | 6% /
-3% | -177% /
-121% | -69% /
-46% |
* ... menor é melhor
Exibir tempos de resposta
| ↔ Tempo de resposta preto para branco | ||
|---|---|---|
| 6.6 ms ... ascensão ↗ e queda ↘ combinadas | ↗ 3.2 ms ascensão | 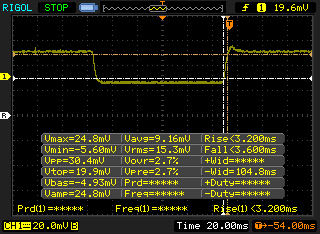 |
| ↘ 3.4 ms queda | ||
| A tela mostra taxas de resposta muito rápidas em nossos testes e deve ser muito adequada para jogos em ritmo acelerado. Em comparação, todos os dispositivos testados variam de 0.1 (mínimo) a 240 (máximo) ms. » 21 % de todos os dispositivos são melhores. Isso significa que o tempo de resposta medido é melhor que a média de todos os dispositivos testados (19.8 ms). | ||
| ↔ Tempo de resposta 50% cinza a 80% cinza | ||
| 7.2 ms ... ascensão ↗ e queda ↘ combinadas | ↗ 3.8 ms ascensão | 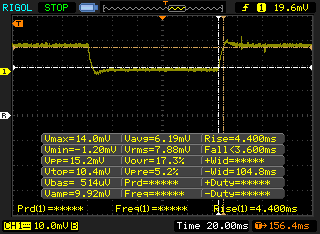 |
| ↘ 3.4 ms queda | ||
| A tela mostra taxas de resposta muito rápidas em nossos testes e deve ser muito adequada para jogos em ritmo acelerado. Em comparação, todos os dispositivos testados variam de 0.165 (mínimo) a 636 (máximo) ms. » 20 % de todos os dispositivos são melhores. Isso significa que o tempo de resposta medido é melhor que a média de todos os dispositivos testados (31 ms). | ||
Cintilação da tela / PWM (modulação por largura de pulso)
| Tela tremeluzindo/PWM detectado | 26040 Hz | ≤ 10 % configuração de brilho | 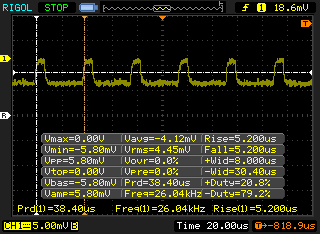 |
A luz de fundo da tela pisca em 26040 Hz (pior caso, por exemplo, utilizando PWM) Cintilação detectada em uma configuração de brilho de 10 % e abaixo. Não deve haver cintilação ou PWM acima desta configuração de brilho. A frequência de 26040 Hz é bastante alta, então a maioria dos usuários sensíveis ao PWM não deve notar nenhuma oscilação. [pwm_comparison] Em comparação: 52 % de todos os dispositivos testados não usam PWM para escurecer a tela. Se PWM foi detectado, uma média de 7763 (mínimo: 5 - máximo: 343500) Hz foi medida. | |||
| Cinebench R20 | |
| CPU (Multi Core) | |
| MSI GE75 9SG | |
| Média Intel Core i9-9880H (2953 - 3712, n=7) | |
| Gigabyte Aero 15 Classic-XA | |
| Asus TUF FX705DY-AU072 | |
| CPU (Single Core) | |
| Média Intel Core i9-9880H (441 - 474, n=7) | |
| MSI GE75 9SG | |
| Gigabyte Aero 15 Classic-XA | |
| Asus TUF FX705DY-AU072 | |
| PCMark 8 | |
| Home Score Accelerated v2 | |
| Aorus X9 DT | |
| MSI GT75 8RG-090 Titan | |
| MSI GE75 8SG Raider | |
| MSI GE75 9SG | |
| Asus TUF FX705DY-AU072 | |
| Work Score Accelerated v2 | |
| Aorus X9 DT | |
| MSI GE75 9SG | |
| MSI GT75 8RG-090 Titan | |
| MSI GE75 8SG Raider | |
| Asus TUF FX705DY-AU072 | |
| PCMark 8 Home Score Accelerated v2 | 4550 pontos | |
| PCMark 8 Work Score Accelerated v2 | 6004 pontos | |
| PCMark 10 Score | 6306 pontos | |
Ajuda | ||
| MSI GE75 9SG Samsung SSD PM981 MZVLB1T0HALR | Asus TUF FX705DY-AU072 Kingston RBUSNS8154P3512GJ | Asus Zephyrus S GX701GX Samsung SSD PM981 MZVLB1T0HALR | MSI GT75 8RG-090 Titan 2x Samsung PM961 MZVLW256HEHP (RAID 0) | Acer Predator Triton 700 2x SK Hynix Canvas SC300 512GB M.2 (HFS512G39MND) (RAID 0) | MSI GE73 8RF-008 Raider RGB Toshiba HG6 THNSNJ256G8NY | |
|---|---|---|---|---|---|---|
| AS SSD | -28% | 9% | 10% | -2% | -84% | |
| Seq Read (MB/s) | 1358 | 1419 4% | 911 -33% | 3058 125% | 2517 85% | 511 -62% |
| Seq Write (MB/s) | 2381 | 828 -65% | 2347 -1% | 2196 -8% | 2372 0% | 425.7 -82% |
| 4K Read (MB/s) | 27.02 | 35.71 32% | 53 96% | 38.37 42% | 41.47 53% | 14.07 -48% |
| 4K Write (MB/s) | 89.2 | 86.8 -3% | 122.5 37% | 97.7 10% | 93 4% | 38.34 -57% |
| 4K-64 Read (MB/s) | 1642 | 848 -48% | 1577 -4% | 1347 -18% | 1057 -36% | 351.4 -79% |
| 4K-64 Write (MB/s) | 1799 | 708 -61% | 1734 -4% | 1236 -31% | 913 -49% | 172.7 -90% |
| Access Time Read * (ms) | 0.067 | 0.063 6% | 0.08 -19% | 0.056 16% | 0.062 7% | 0.235 -251% |
| Access Time Write * (ms) | 0.05 | 0.044 12% | 0.031 38% | 0.038 24% | 0.041 18% | 0.097 -94% |
| Score Read (Points) | 1805 | 1026 -43% | 1721 -5% | 1691 -6% | 1350 -25% | 417 -77% |
| Score Write (Points) | 2127 | 878 -59% | 2091 -2% | 1553 -27% | 1243 -42% | 254 -88% |
| Score Total (Points) | 4899 | 2405 -51% | 4771 -3% | 4066 -17% | 3282 -33% | 881 -82% |
| Copy ISO MB/s (MB/s) | 3193 | 687 -78% | 412.5 -87% | |||
| Copy Program MB/s (MB/s) | 198.2 | 234.7 18% | 192.9 -3% | |||
| Copy Game MB/s (MB/s) | 1054 | 474.7 -55% | 295.5 -72% |
* ... menor é melhor

| 3DMark | |
| 1920x1080 Fire Strike Graphics | |
| MSI RTX 2080 Gaming X Trio | |
| MSI GE75 8SG Raider | |
| MSI GE75 9SG | |
| Asus Zephyrus S GX701GX | |
| Schenker XMG Ultra 17 | |
| Acer Predator Triton 700 | |
| MSI GE73 8RF-008 Raider RGB | |
| Gigabyte Aero 15 Classic-XA | |
| MSI GL73 8SE-010US | |
| Schenker Compact 15 | |
| Acer Aspire Nitro 5 AN515-54-53Z2 | |
| Dell XPS 15 9570 Core i9 UHD | |
| Asus TUF FX705DY-AU072 | |
| 2560x1440 Time Spy Graphics | |
| MSI RTX 2080 Gaming X Trio | |
| MSI GE75 8SG Raider | |
| MSI GE75 9SG | |
| Asus Zephyrus S GX701GX | |
| Schenker XMG Ultra 17 | |
| Gigabyte Aero 15 Classic-XA | |
| MSI GL73 8SE-010US | |
| MSI GE73 8RF-008 Raider RGB | |
| Schenker Compact 15 | |
| Asus TUF FX705DY-AU072 | |
| 2560x1440 Port Royal Graphics | |
| MSI GE75 9SG | |
| Asus Zephyrus S GX701GX | |
| Gigabyte Aero 15 Classic-XA | |
| MSI GL73 8SE-010US | |
| 2560x1440 Time Spy Score | |
| MSI RTX 2080 Gaming X Trio | |
| MSI GE75 9SG | |
| MSI GE75 8SG Raider | |
| Asus Zephyrus S GX701GX | |
| Schenker XMG Ultra 17 | |
| Gigabyte Aero 15 Classic-XA | |
| MSI GE73 8RF-008 Raider RGB | |
| MSI GL73 8SE-010US | |
| Schenker Compact 15 | |
| Asus TUF FX705DY-AU072 | |
| 3DMark 11 | |
| 1280x720 Performance GPU | |
| MSI RTX 2080 Gaming X Trio | |
| MSI GE75 9SG | |
| MSI GE75 8SG Raider | |
| Asus Zephyrus S GX701GX | |
| Schenker XMG Ultra 17 | |
| Acer Predator Triton 700 | |
| MSI GE73 8RF-008 Raider RGB | |
| Gigabyte Aero 15 Classic-XA | |
| MSI GL73 8SE-010US | |
| Schenker Compact 15 | |
| Acer Aspire Nitro 5 AN515-54-53Z2 | |
| Dell XPS 15 9570 Core i9 UHD | |
| Asus TUF FX705DY-AU072 | |
| 1280x720 Performance Combined | |
| MSI GE75 9SG | |
| MSI RTX 2080 Gaming X Trio | |
| Schenker Compact 15 | |
| Schenker XMG Ultra 17 | |
| Asus Zephyrus S GX701GX | |
| Gigabyte Aero 15 Classic-XA | |
| MSI GE75 8SG Raider | |
| MSI GE73 8RF-008 Raider RGB | |
| Acer Aspire Nitro 5 AN515-54-53Z2 | |
| MSI GL73 8SE-010US | |
| Acer Predator Triton 700 | |
| Dell XPS 15 9570 Core i9 UHD | |
| Asus TUF FX705DY-AU072 | |
| 3DMark 06 Standard Score | 39973 pontos | |
| 3DMark 11 Performance | 27116 pontos | |
| 3DMark Cloud Gate Standard Score | 41840 pontos | |
| 3DMark Fire Strike Score | 18947 pontos | |
| 3DMark Time Spy Score | 9266 pontos | |
Ajuda | ||
| Shadow of the Tomb Raider - 1920x1080 Highest Preset AA:T | |
| MSI RTX 2080 Gaming X Trio | |
| MSI GE75 9SG | |
| Média NVIDIA GeForce RTX 2080 Mobile (69 - 124, n=7) | |
| MSI GE75 8SG Raider | |
| Asus Zephyrus S GX701GX | |
| MSI GL73 8SE-010US | |
| Schenker Compact 15 | |
| Acer Aspire Nitro 5 AN515-54-53Z2 | |
| baixo | média | alto | ultra | |
|---|---|---|---|---|
| BioShock Infinite (2013) | 341.4 | 303.9 | 280.7 | 190.9 |
| The Witcher 3 (2015) | 289.7 | 250.1 | 173 | 95.3 |
| Rise of the Tomb Raider (2016) | 250.6 | 187.2 | 161.7 | 144.3 |
| Shadow of the Tomb Raider (2018) | 146 | 120 | 115 | 109 |
| MSI GE75 9SG GeForce RTX 2080 Mobile, i9-9880H, Samsung SSD PM981 MZVLB1T0HALR | MSI GE75 8SG Raider GeForce RTX 2080 Mobile, i7-8750H, Kingston RBUSNS8154P3512GJ | Aorus X9 DT GeForce GTX 1080 Mobile, i9-8950HK, Transcend TS1TMTE850 | Asus Zephyrus S GX701GX GeForce RTX 2080 Max-Q, i7-8750H, Samsung SSD PM981 MZVLB1T0HALR | MSI GT75 8RG-090 Titan GeForce GTX 1080 Mobile, i9-8950HK, 2x Samsung PM961 MZVLW256HEHP (RAID 0) | MSI GE73 8RF-008 Raider RGB GeForce GTX 1070 Mobile, i7-8750H, Toshiba HG6 THNSNJ256G8NY | |
|---|---|---|---|---|---|---|
| Noise | -9% | -18% | -1% | -9% | -3% | |
| desligado / ambiente * (dB) | 28.2 | 30 -6% | 30 -6% | 29 -3% | 30 -6% | 30 -6% |
| Idle Minimum * (dB) | 30.4 | 30 1% | 36 -18% | 29 5% | 32 -5% | 32 -5% |
| Idle Average * (dB) | 30.4 | 34 -12% | 37 -22% | 32 -5% | 34 -12% | 33 -9% |
| Idle Maximum * (dB) | 33.4 | 37 -11% | 43 -29% | 33 1% | 37 -11% | 34 -2% |
| Load Average * (dB) | 37.1 | 52 -40% | 50 -35% | 47 -27% | 43 -16% | 41 -11% |
| Witcher 3 ultra * (dB) | 54.2 | 53 2% | 57 -5% | 49 10% | 57 -5% | 50 8% |
| Load Maximum * (dB) | 56.4 | 54 4% | 61 -8% | 51 10% | 62 -10% | 54 4% |
* ... menor é melhor
Barulho
| Ocioso |
| 30.4 / 30.4 / 33.4 dB |
| Carga |
| 37.1 / 56.4 dB |
 | ||
30 dB silencioso 40 dB(A) audível 50 dB(A) ruidosamente alto |
||
min: | ||
(-) A temperatura máxima no lado superior é 48.8 °C / 120 F, em comparação com a média de 40.4 °C / 105 F , variando de 21.2 a 68.8 °C para a classe Gaming.
(-) A parte inferior aquece até um máximo de 52 °C / 126 F, em comparação com a média de 43.2 °C / 110 F
(+) Em uso inativo, a temperatura média para o lado superior é 31.8 °C / 89 F, em comparação com a média do dispositivo de 33.9 °C / ### class_avg_f### F.
(-) Jogando The Witcher 3, a temperatura média para o lado superior é 40 °C / 104 F, em comparação com a média do dispositivo de 33.9 °C / ## #class_avg_f### F.
(+) Os apoios para as mãos e o touchpad estão atingindo a temperatura máxima da pele (32 °C / 89.6 F) e, portanto, não estão quentes.
(-) A temperatura média da área do apoio para as mãos de dispositivos semelhantes foi 28.8 °C / 83.8 F (-3.2 °C / -5.8 F).
MSI GE75 9SG análise de áudio
(+) | os alto-falantes podem tocar relativamente alto (###valor### dB)
Graves 100 - 315Hz
(±) | graves reduzidos - em média 12.2% menor que a mediana
(±) | a linearidade dos graves é média (8.7% delta para a frequência anterior)
Médios 400 - 2.000 Hz
(±) | médios mais altos - em média 6.7% maior que a mediana
(±) | a linearidade dos médios é média (11.5% delta para frequência anterior)
Altos 2 - 16 kHz
(+) | agudos equilibrados - apenas 2.9% longe da mediana
(±) | a linearidade dos máximos é média (7.6% delta para frequência anterior)
Geral 100 - 16.000 Hz
(±) | a linearidade do som geral é média (16.5% diferença em relação à mediana)
Comparado com a mesma classe
» 42% de todos os dispositivos testados nesta classe foram melhores, 7% semelhantes, 51% piores
» O melhor teve um delta de 6%, a média foi 18%, o pior foi 132%
Comparado com todos os dispositivos testados
» 28% de todos os dispositivos testados foram melhores, 6% semelhantes, 66% piores
» O melhor teve um delta de 4%, a média foi 23%, o pior foi 134%
Apple MacBook 12 (Early 2016) 1.1 GHz análise de áudio
(+) | os alto-falantes podem tocar relativamente alto (###valor### dB)
Graves 100 - 315Hz
(±) | graves reduzidos - em média 11.3% menor que a mediana
(±) | a linearidade dos graves é média (14.2% delta para a frequência anterior)
Médios 400 - 2.000 Hz
(+) | médios equilibrados - apenas 2.4% longe da mediana
(+) | médios são lineares (5.5% delta para frequência anterior)
Altos 2 - 16 kHz
(+) | agudos equilibrados - apenas 2% longe da mediana
(+) | os máximos são lineares (4.5% delta da frequência anterior)
Geral 100 - 16.000 Hz
(+) | o som geral é linear (10.2% diferença em relação à mediana)
Comparado com a mesma classe
» 7% de todos os dispositivos testados nesta classe foram melhores, 2% semelhantes, 91% piores
» O melhor teve um delta de 5%, a média foi 18%, o pior foi 53%
Comparado com todos os dispositivos testados
» 5% de todos os dispositivos testados foram melhores, 1% semelhantes, 94% piores
» O melhor teve um delta de 4%, a média foi 23%, o pior foi 134%
| desligado | |
| Ocioso | |
| Carga |
|
Key:
min: | |
| MSI GE75 9SG i9-9880H, GeForce RTX 2080 Mobile, Samsung SSD PM981 MZVLB1T0HALR, AHVA, 1920x1080, 17.3" | MSI GE75 8SG Raider i7-8750H, GeForce RTX 2080 Mobile, Kingston RBUSNS8154P3512GJ, AHVA, 1920x1080, 17.3" | Asus Zephyrus S GX701GX i7-8750H, GeForce RTX 2080 Max-Q, Samsung SSD PM981 MZVLB1T0HALR, IPS, 1920x1080, 17.3" | MSI GT75 8RG-090 Titan i9-8950HK, GeForce GTX 1080 Mobile, 2x Samsung PM961 MZVLW256HEHP (RAID 0), TN, 1920x1080, 17.3" | Acer Predator Triton 700 i7-7700HQ, GeForce GTX 1080 Max-Q, 2x SK Hynix Canvas SC300 512GB M.2 (HFS512G39MND) (RAID 0), IPS, 1920x1080, 15.6" | MSI GE73 8RF-008 Raider RGB i7-8750H, GeForce GTX 1070 Mobile, Toshiba HG6 THNSNJ256G8NY, TN WLED, 1920x1080, 17.3" | |
|---|---|---|---|---|---|---|
| Power Consumption | 19% | -3% | -61% | -31% | 4% | |
| Idle Minimum * (Watt) | 13.9 | 7 50% | 19 -37% | 31 -123% | 28 -101% | 15 -8% |
| Idle Average * (Watt) | 18.8 | 15 20% | 22 -17% | 35 -86% | 33 -76% | 20 -6% |
| Idle Maximum * (Watt) | 23.1 | 22 5% | 30 -30% | 45 -95% | 41 -77% | 26 -13% |
| Load Average * (Watt) | 112.3 | 92 18% | 104 7% | 130 -16% | 94 16% | 97 14% |
| Witcher 3 ultra * (Watt) | 231 | 207 10% | 167 28% | 268 -16% | 160 31% | 186 19% |
| Load Maximum * (Watt) | 291.5 | 254 13% | 203 30% | 374 -28% | 222 24% | 239 18% |
* ... menor é melhor
| MSI GE75 9SG i9-9880H, GeForce RTX 2080 Mobile, 65 Wh | Asus TUF FX705DY-AU072 R5 3550H, Radeon RX 560X (Laptop), 64 Wh | Asus Zephyrus S GX701GX i7-8750H, GeForce RTX 2080 Max-Q, 76 Wh | Acer Predator Triton 700 i7-7700HQ, GeForce GTX 1080 Max-Q, 54 Wh | MSI GE73 8RF-008 Raider RGB i7-8750H, GeForce GTX 1070 Mobile, 51 Wh | MSI GE75 8SG Raider i7-8750H, GeForce RTX 2080 Mobile, 65 Wh | |
|---|---|---|---|---|---|---|
| Duração da bateria | 47% | -22% | -51% | -37% | -4% | |
| WiFi v1.3 (h) | 4.9 | 7.2 47% | 3.8 -22% | 2.4 -51% | 3.1 -37% | 4.7 -4% |
| Reader / Idle (h) | 12.6 | 5 | 2.5 | 5.1 | 7.8 | |
| Load (h) | 2 | 0.9 | 1.2 | 0.6 | 0.9 | |
| Witcher 3 ultra (h) | 0.8 |
Pro
Contra
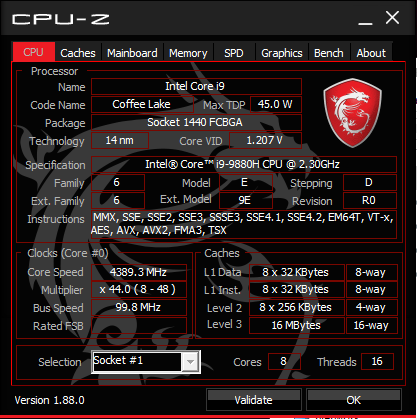
O Core i9-9880H é o que o Core i9-8950HK deveria ter sido. Os dois núcleos extras proporcionam a vantagem de desempenho que ele precisa tanto sobre o Core i7-8750H e o Core i7-9750H. O i7-8750H médio é cerca de 36% mais lento antes de contabilizar qualquer limitação de desempenho.
As desvantagens são o que você esperaria de uma CPU mais rápida baseada na mesma arquitetura subjacente. Ou seja, as temperaturas do núcleo e o consumo de energia são maiores quando a CPU está sob estresse total. O i9-9880H estabiliza a 90 °C ao rodar o Prime95 em comparação com 73 °C no SKU i7-8750H. Enquanto isso, durante os jogos consome 231 W contra 207 W no GE73 8SG do ano passado. Os aplicativos que não utilizam totalmente todos os oito núcleos terão um ganho de desempenho menor do que a série Core i7 de seis núcleos.
É claro que o GE75 9SG é apenas um exemplo do Core i9-9880H. A faixa de freqüência muito grande do i9-9880H (2,3 - 3,8 GHz) significa que outros OEMs podem implementar o mesmo processador em velocidades mais lentas para um desempenho potencialmente mais lento do que o que observamos aqui. No entanto, nossa primeira pitada da 9ª geração do Core i9 já parece muito promissora.
Os entusiastas vão querer considerar o Core i9 de 9na geração especialmente se eles confiarem em aplicações otimizadas para oito núcleos de CPU. Os jogadores também têm algo a ganhar com o i9-9880H, embora com um aumento muito menor de 10% no desempenho para a maioria dos títulos. Em ambos os casos, a nova CPU está em um lugar muito melhor em comparação com o Core i9-8950HK do ano passado.
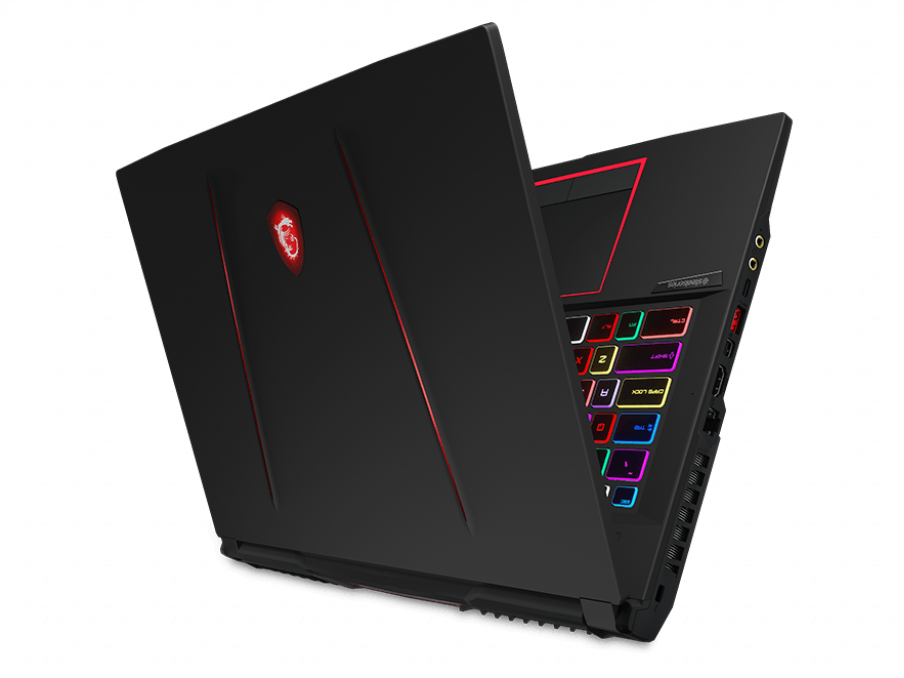
MSI GE75 9SG
- 07/02/2020 v7 (old)
Allen Ngo
Price comparison
