Breve Análise do Portátil Asus ROG Zephyrus M GM501 (i7-8750H, GTX 1070, Full-HD)
| Networking | |
| iperf3 transmit AX12 | |
| Asus Zephyrus M GM501 | |
| Acer Predator Triton 700 | |
| MSI GS63VR 7RG-005 | |
| Asus Zephyrus GX501 | |
| Gigabyte Aero 15X | |
| iperf3 receive AX12 | |
| MSI GS63VR 7RG-005 | |
| Gigabyte Aero 15X | |
| Asus Zephyrus GX501 | |
| Asus Zephyrus M GM501 | |
| Acer Predator Triton 700 | |
| |||||||||||||||||||||||||
iluminação: 89 %
iluminação com acumulador: 307 cd/m²
Contraste: 1228:1 (Preto: 0.25 cd/m²)
ΔE ColorChecker Calman: 5.74 | ∀{0.5-29.43 Ø4.71}
calibrated: 1.94
ΔE Greyscale Calman: 6.44 | ∀{0.09-98 Ø4.96}
93% sRGB (Argyll 1.6.3 3D)
60% AdobeRGB 1998 (Argyll 1.6.3 3D)
67.2% AdobeRGB 1998 (Argyll 3D)
92.7% sRGB (Argyll 3D)
66.1% Display P3 (Argyll 3D)
Gamma: 2.48
CCT: 8395 K
| Asus Zephyrus M GM501 AUO B156HAN07.1 (AUO71ED), IPS, 1920x1080 | Asus Zephyrus GX501 AUO B156HAN04.2 (AUO42ED), IPS, 1920x1080 | Acer Predator Triton 700 AUO B156HAN04.2 (AUO42ED), IPS, 1920x1080 | Gigabyte Aero 15X Chi Mei N156HCA-EA1 (CMN15D7), IPS, 1920x1080 | MSI GS63VR 7RG-005 Chi Mei N156HHE-GA1 (CMN15F4), TN LED, 1920x1080 | |
|---|---|---|---|---|---|
| Display | -2% | -5% | -2% | 25% | |
| Display P3 Coverage (%) | 66.1 | 64.8 -2% | 62.5 -5% | 64.7 -2% | 91.6 39% |
| sRGB Coverage (%) | 92.7 | 91.8 -1% | 88.7 -4% | 90.4 -2% | 100 8% |
| AdobeRGB 1998 Coverage (%) | 67.2 | 65.9 -2% | 63.5 -6% | 65.7 -2% | 86.6 29% |
| Response Times | -322% | -382% | -364% | -11% | |
| Response Time Grey 50% / Grey 80% * (ms) | 6.6 ? | 40.4 ? -512% | 44.8 ? -579% | 43.2 ? -555% | 10.4 ? -58% |
| Response Time Black / White * (ms) | 10.4 ? | 24 ? -131% | 29.6 ? -185% | 28.4 ? -173% | 6.6 ? 37% |
| PWM Frequency (Hz) | 26000 ? | 25510 ? | |||
| Screen | 2% | 0% | -7% | 18% | |
| Brightness middle (cd/m²) | 307 | 328 7% | 291 -5% | 338 10% | 269 -12% |
| Brightness (cd/m²) | 296 | 305 3% | 277 -6% | 324 9% | 254 -14% |
| Brightness Distribution (%) | 89 | 83 -7% | 84 -6% | 88 -1% | 85 -4% |
| Black Level * (cd/m²) | 0.25 | 0.25 -0% | 0.22 12% | 0.34 -36% | 0.21 16% |
| Contrast (:1) | 1228 | 1312 7% | 1323 8% | 994 -19% | 1281 4% |
| Colorchecker dE 2000 * | 5.74 | 6.02 -5% | 5.52 4% | 5.92 -3% | 3 48% |
| Colorchecker dE 2000 max. * | 11.32 | 10.14 10% | 10.72 5% | 11.77 -4% | 5.62 50% |
| Colorchecker dE 2000 calibrated * | 1.94 | ||||
| Greyscale dE 2000 * | 6.44 | 6.32 2% | 6.59 -2% | 7.45 -16% | 3.18 51% |
| Gamma | 2.48 89% | 2.28 96% | 2.44 90% | 2.58 85% | 2.25 98% |
| CCT | 8395 77% | 8194 79% | 7816 83% | 6366 102% | 7274 89% |
| Color Space (Percent of AdobeRGB 1998) (%) | 60 | 60 0% | 58 -3% | 59 -2% | 77 28% |
| Color Space (Percent of sRGB) (%) | 93 | 92 -1% | 89 -4% | 90 -3% | 100 8% |
| Média Total (Programa/Configurações) | -107% /
-42% | -129% /
-52% | -124% /
-53% | 11% /
15% |
* ... menor é melhor
Exibir tempos de resposta
| ↔ Tempo de resposta preto para branco | ||
|---|---|---|
| 10.4 ms ... ascensão ↗ e queda ↘ combinadas | ↗ 5.2 ms ascensão | 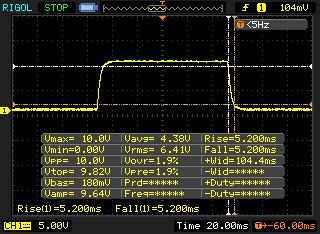 |
| ↘ 5.2 ms queda | ||
| A tela mostra boas taxas de resposta em nossos testes, mas pode ser muito lenta para jogadores competitivos. Em comparação, todos os dispositivos testados variam de 0.1 (mínimo) a 240 (máximo) ms. » 28 % de todos os dispositivos são melhores. Isso significa que o tempo de resposta medido é melhor que a média de todos os dispositivos testados (19.8 ms). | ||
| ↔ Tempo de resposta 50% cinza a 80% cinza | ||
| 6.6 ms ... ascensão ↗ e queda ↘ combinadas | ↗ 3.4 ms ascensão | 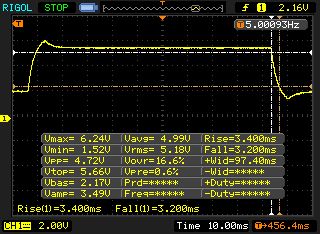 |
| ↘ 3.2 ms queda | ||
| A tela mostra taxas de resposta muito rápidas em nossos testes e deve ser muito adequada para jogos em ritmo acelerado. Em comparação, todos os dispositivos testados variam de 0.165 (mínimo) a 636 (máximo) ms. » 20 % de todos os dispositivos são melhores. Isso significa que o tempo de resposta medido é melhor que a média de todos os dispositivos testados (31 ms). | ||
Cintilação da tela / PWM (modulação por largura de pulso)
| Tela tremeluzindo / PWM não detectado | 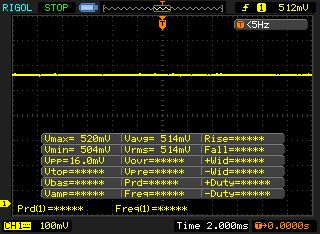 | ||
[pwm_comparison] Em comparação: 52 % de todos os dispositivos testados não usam PWM para escurecer a tela. Se PWM foi detectado, uma média de 7757 (mínimo: 5 - máximo: 343500) Hz foi medida. | |||
| PCMark 8 Home Score Accelerated v2 | 4627 pontos | |
| PCMark 8 Work Score Accelerated v2 | 5662 pontos | |
| PCMark 10 Score | 5194 pontos | |
Ajuda | ||
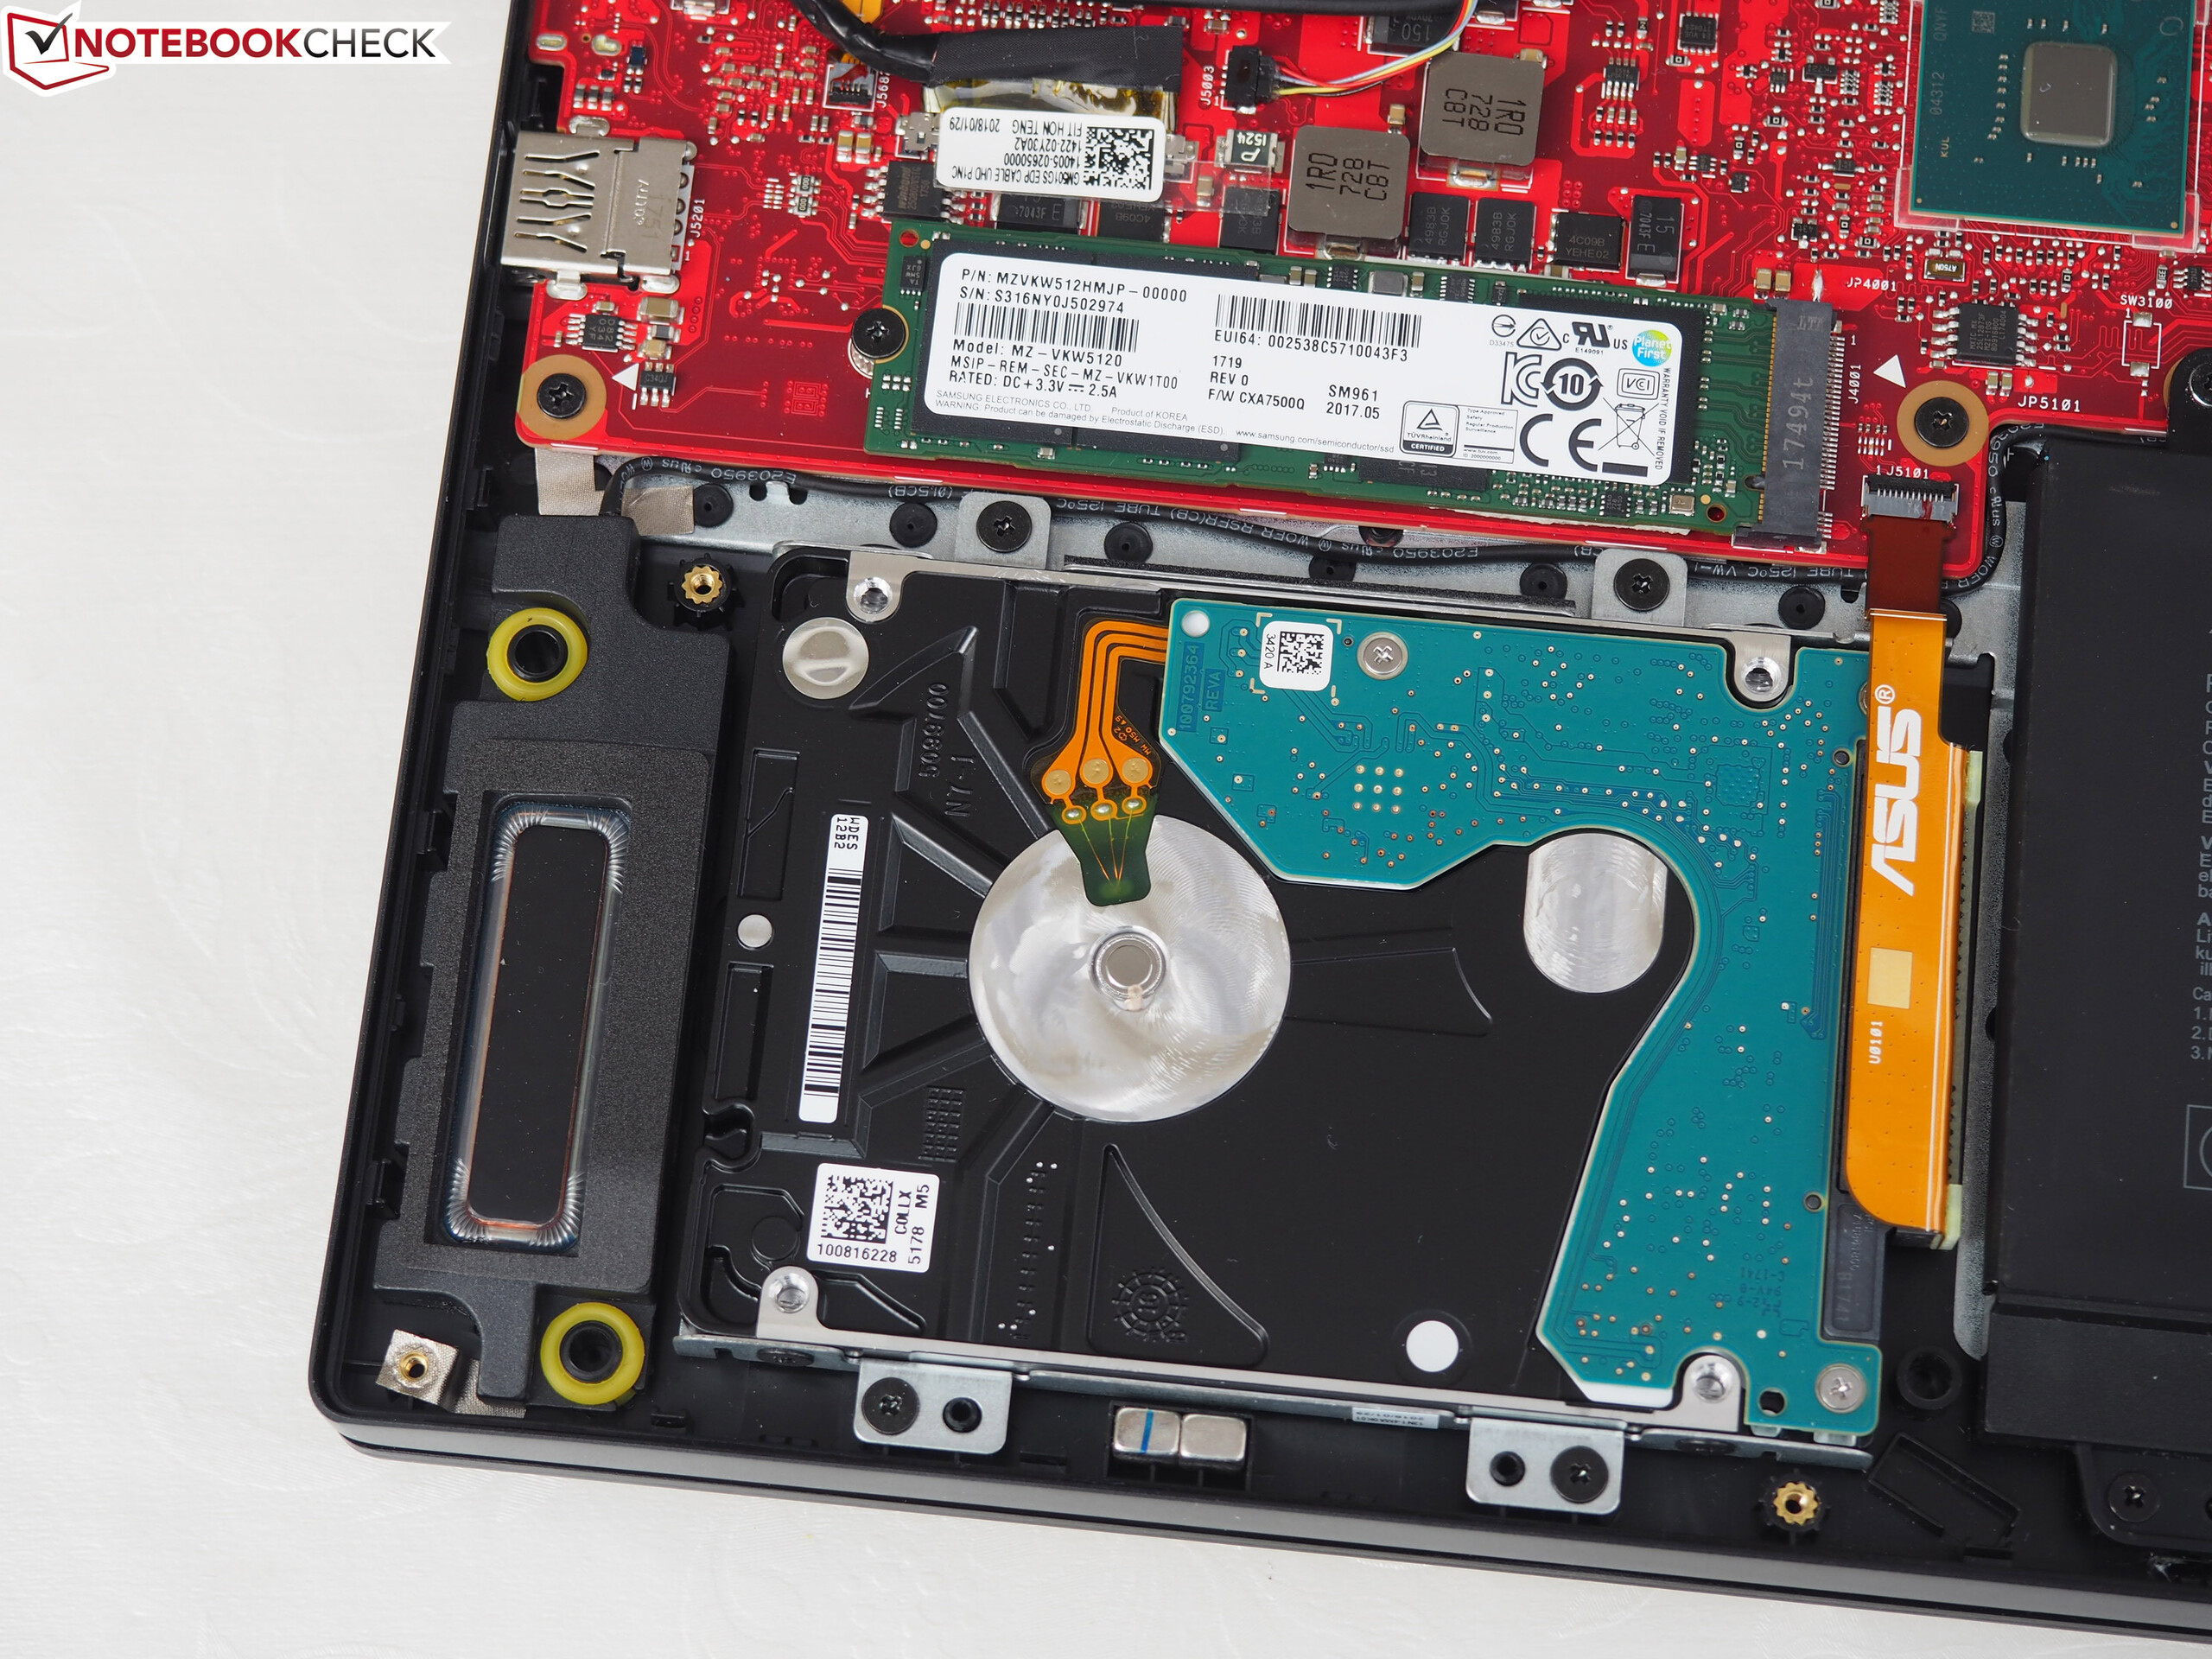
| Asus Zephyrus M GM501 Samsung SM961 MZVKW512HMJP m.2 PCI-e | Asus Zephyrus GX501 Samsung SSD SM961 1TB M.2 MZVKW1T0HMLH | Acer Predator Triton 700 2x SK Hynix Canvas SC300 512GB M.2 (HFS512G39MND) (RAID 0) | Gigabyte Aero 15X Samsung SM961 MZVKW512HMJP m.2 PCI-e | MSI GS63VR 7RG-005 Samsung SM961 MZVPW256HEGL | Média Samsung SM961 MZVKW512HMJP m.2 PCI-e | |
|---|---|---|---|---|---|---|
| AS SSD | 5% | 2% | 8% | 5% | ||
| Seq Read (MB/s) | 2091 | 2517 20% | 2508 20% | 2382 14% | 2576 ? 23% | |
| Seq Write (MB/s) | 1580 | 2372 50% | 1124 -29% | 1281 -19% | 1438 ? -9% | |
| 4K Read (MB/s) | 43.42 | 41.47 -4% | 46.56 7% | 51 17% | 47.8 ? 10% | |
| 4K Write (MB/s) | 90.2 | 93 3% | 113.8 26% | 124.7 38% | 114.2 ? 27% | |
| Score Read (Points) | 1471 | 1350 -8% | 1522 3% | 1795 22% | 1475 ? 0% | |
| Score Write (Points) | 1446 | 1243 -14% | 1333 -8% | 1185 -18% | 1267 ? -12% | |
| Score Total (Points) | 3649 | 3282 -10% | 3570 -2% | 3848 5% | 3447 ? -6% |

| 3DMark 06 Standard Score | 31045 pontos | |
| 3DMark 11 Performance | 18278 pontos | |
| 3DMark Cloud Gate Standard Score | 36015 pontos | |
| 3DMark Fire Strike Score | 14945 pontos | |
Ajuda | ||
| The Witcher 3 - 1920x1080 Ultra Graphics & Postprocessing (HBAO+) | |
| Média da turma Gaming (104.7 - 240, n=7, últimos 2 anos) | |
| Acer Predator Triton 700 | |
| Asus Zephyrus GX501 | |
| Asus Zephyrus M GM501 | |
| Média NVIDIA GeForce GTX 1070 Mobile (48.2 - 68.4, n=41) | |
| Gigabyte Aero 15X | |
| MSI GS63VR 7RG-005 | |
| baixo | média | alto | ultra | |
|---|---|---|---|---|
| The Witcher 3 (2015) | 106 | 59.4 | ||
| Rocket League (2017) | 143 | |||
| Dirt 4 (2017) | 126 | 78.4 | ||
| Playerunknown's Battlegrounds (PUBG) (2017) | 131 | 86.2 | ||
| F1 2017 (2017) | 119 | 88 | ||
| Middle-earth: Shadow of War (2017) | 102 | 75 | ||
| The Evil Within 2 (2017) | 59.6 | 58.1 | ||
| ELEX (2017) | 99.1 | 75 | ||
| Call of Duty WWII (2017) | 144 | 117 | ||
| Kingdom Come: Deliverance (2018) | 75.6 | 54.2 |
Barulho
| Ocioso |
| 30 / 31 / 33 dB |
| Carga |
| 49 / 52 dB |
 | ||
30 dB silencioso 40 dB(A) audível 50 dB(A) ruidosamente alto |
||
min: | ||
| Asus Zephyrus M GM501 GeForce GTX 1070 Mobile, i7-8750H | Asus Zephyrus GX501 GeForce GTX 1080 Max-Q, i7-7700HQ | Acer Predator Triton 700 GeForce GTX 1080 Max-Q, i7-7700HQ | Gigabyte Aero 15X GeForce GTX 1070 Max-Q, i7-7700HQ | MSI GS63VR 7RG-005 GeForce GTX 1070 Max-Q, i7-7700HQ | Média NVIDIA GeForce GTX 1070 Mobile | Média da turma Gaming | |
|---|---|---|---|---|---|---|---|
| Noise | 4% | -1% | 2% | 2% | -3% | 10% | |
| desligado / ambiente * (dB) | 29 | 31 -7% | 31 -7% | 30 -3% | 30 -3% | 29.8 ? -3% | 24.1 ? 17% |
| Idle Minimum * (dB) | 30 | 32 -7% | 33 -10% | 31 -3% | 31 -3% | 31.9 ? -6% | 26 ? 13% |
| Idle Average * (dB) | 31 | 33 -6% | 34 -10% | 32 -3% | 34 -10% | 33.4 ? -8% | 27.4 ? 12% |
| Idle Maximum * (dB) | 33 | 34 -3% | 40 -21% | 36 -9% | 35 -6% | 36.3 ? -10% | 30.1 ? 9% |
| Load Average * (dB) | 49 | 39 20% | 41 16% | 39 20% | 42 14% | 44.5 ? 9% | 43.6 ? 11% |
| Witcher 3 ultra * (dB) | 50 | 42 16% | 43 14% | 44 12% | 44 12% | ||
| Load Maximum * (dB) | 52 | 46 12% | 48 8% | 52 -0% | 46 12% | 51.4 ? 1% | 54.2 ? -4% |
* ... menor é melhor
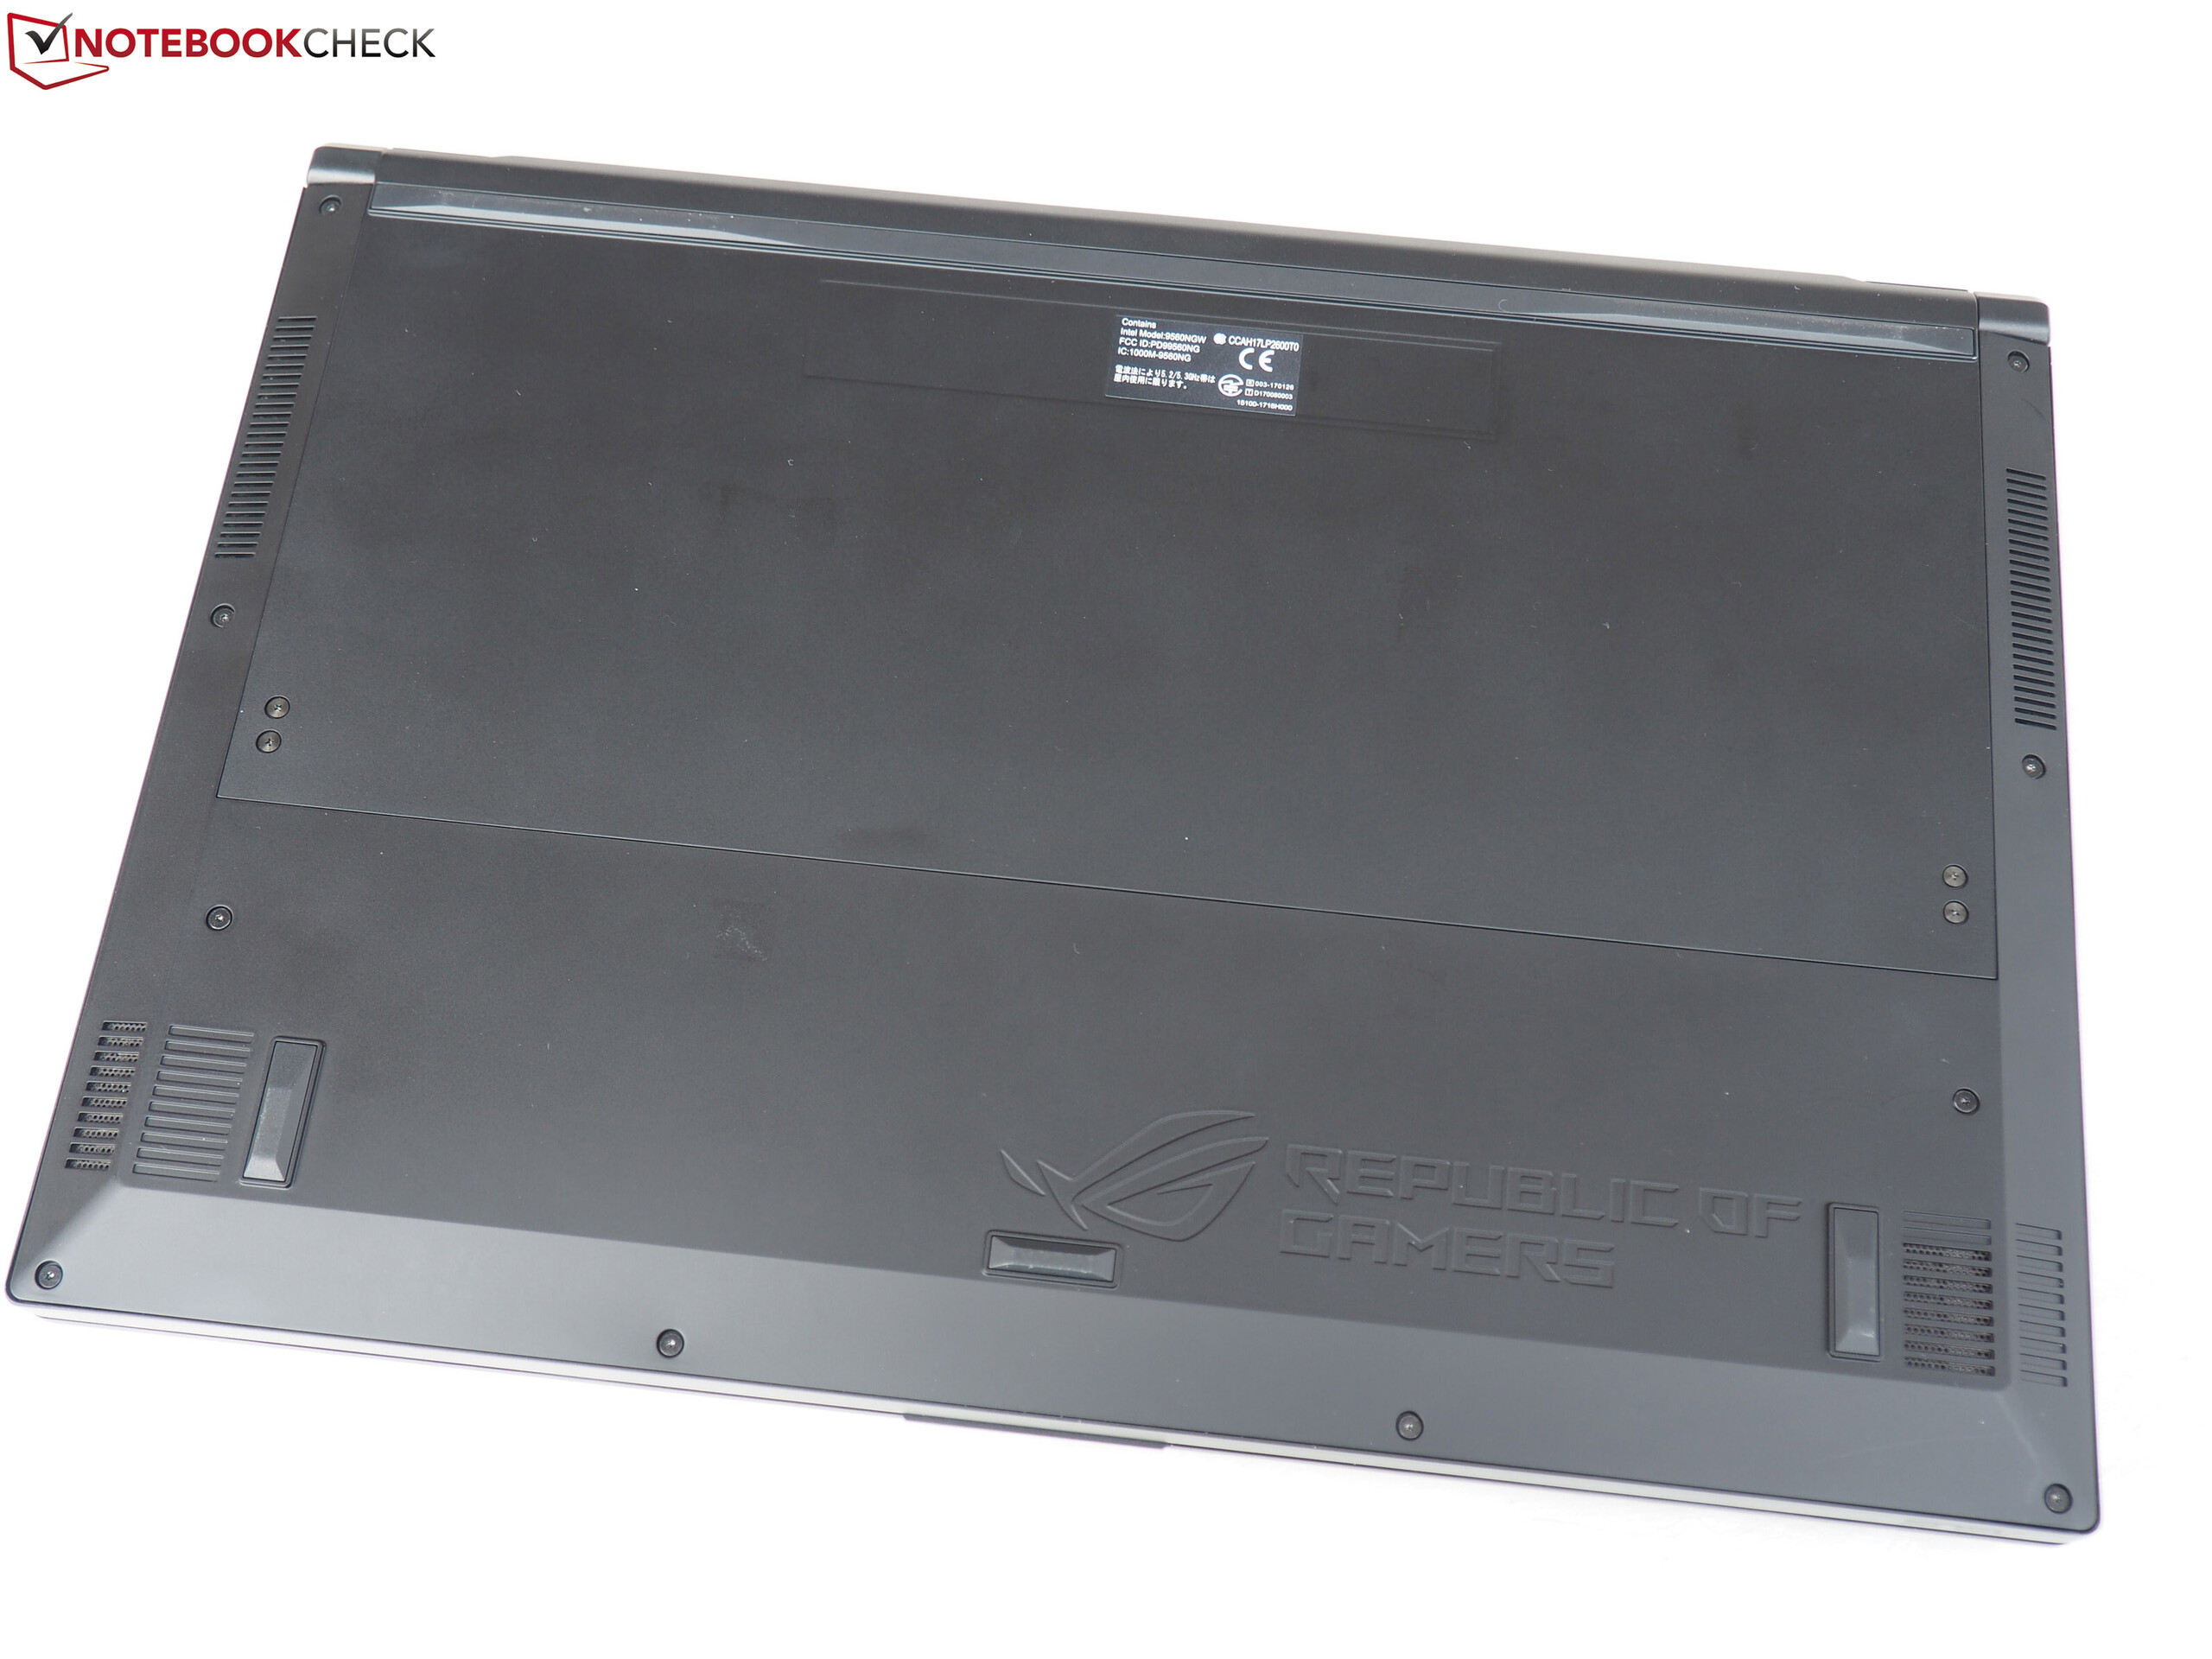
(-) A temperatura máxima no lado superior é 52 °C / 126 F, em comparação com a média de 40.4 °C / 105 F , variando de 21.2 a 68.8 °C para a classe Gaming.
(-) A parte inferior aquece até um máximo de 49 °C / 120 F, em comparação com a média de 43.2 °C / 110 F
(+) Em uso inativo, a temperatura média para o lado superior é 28.8 °C / 84 F, em comparação com a média do dispositivo de 33.9 °C / ### class_avg_f### F.
(-) Jogando The Witcher 3, a temperatura média para o lado superior é 43.3 °C / 110 F, em comparação com a média do dispositivo de 33.9 °C / ## #class_avg_f### F.
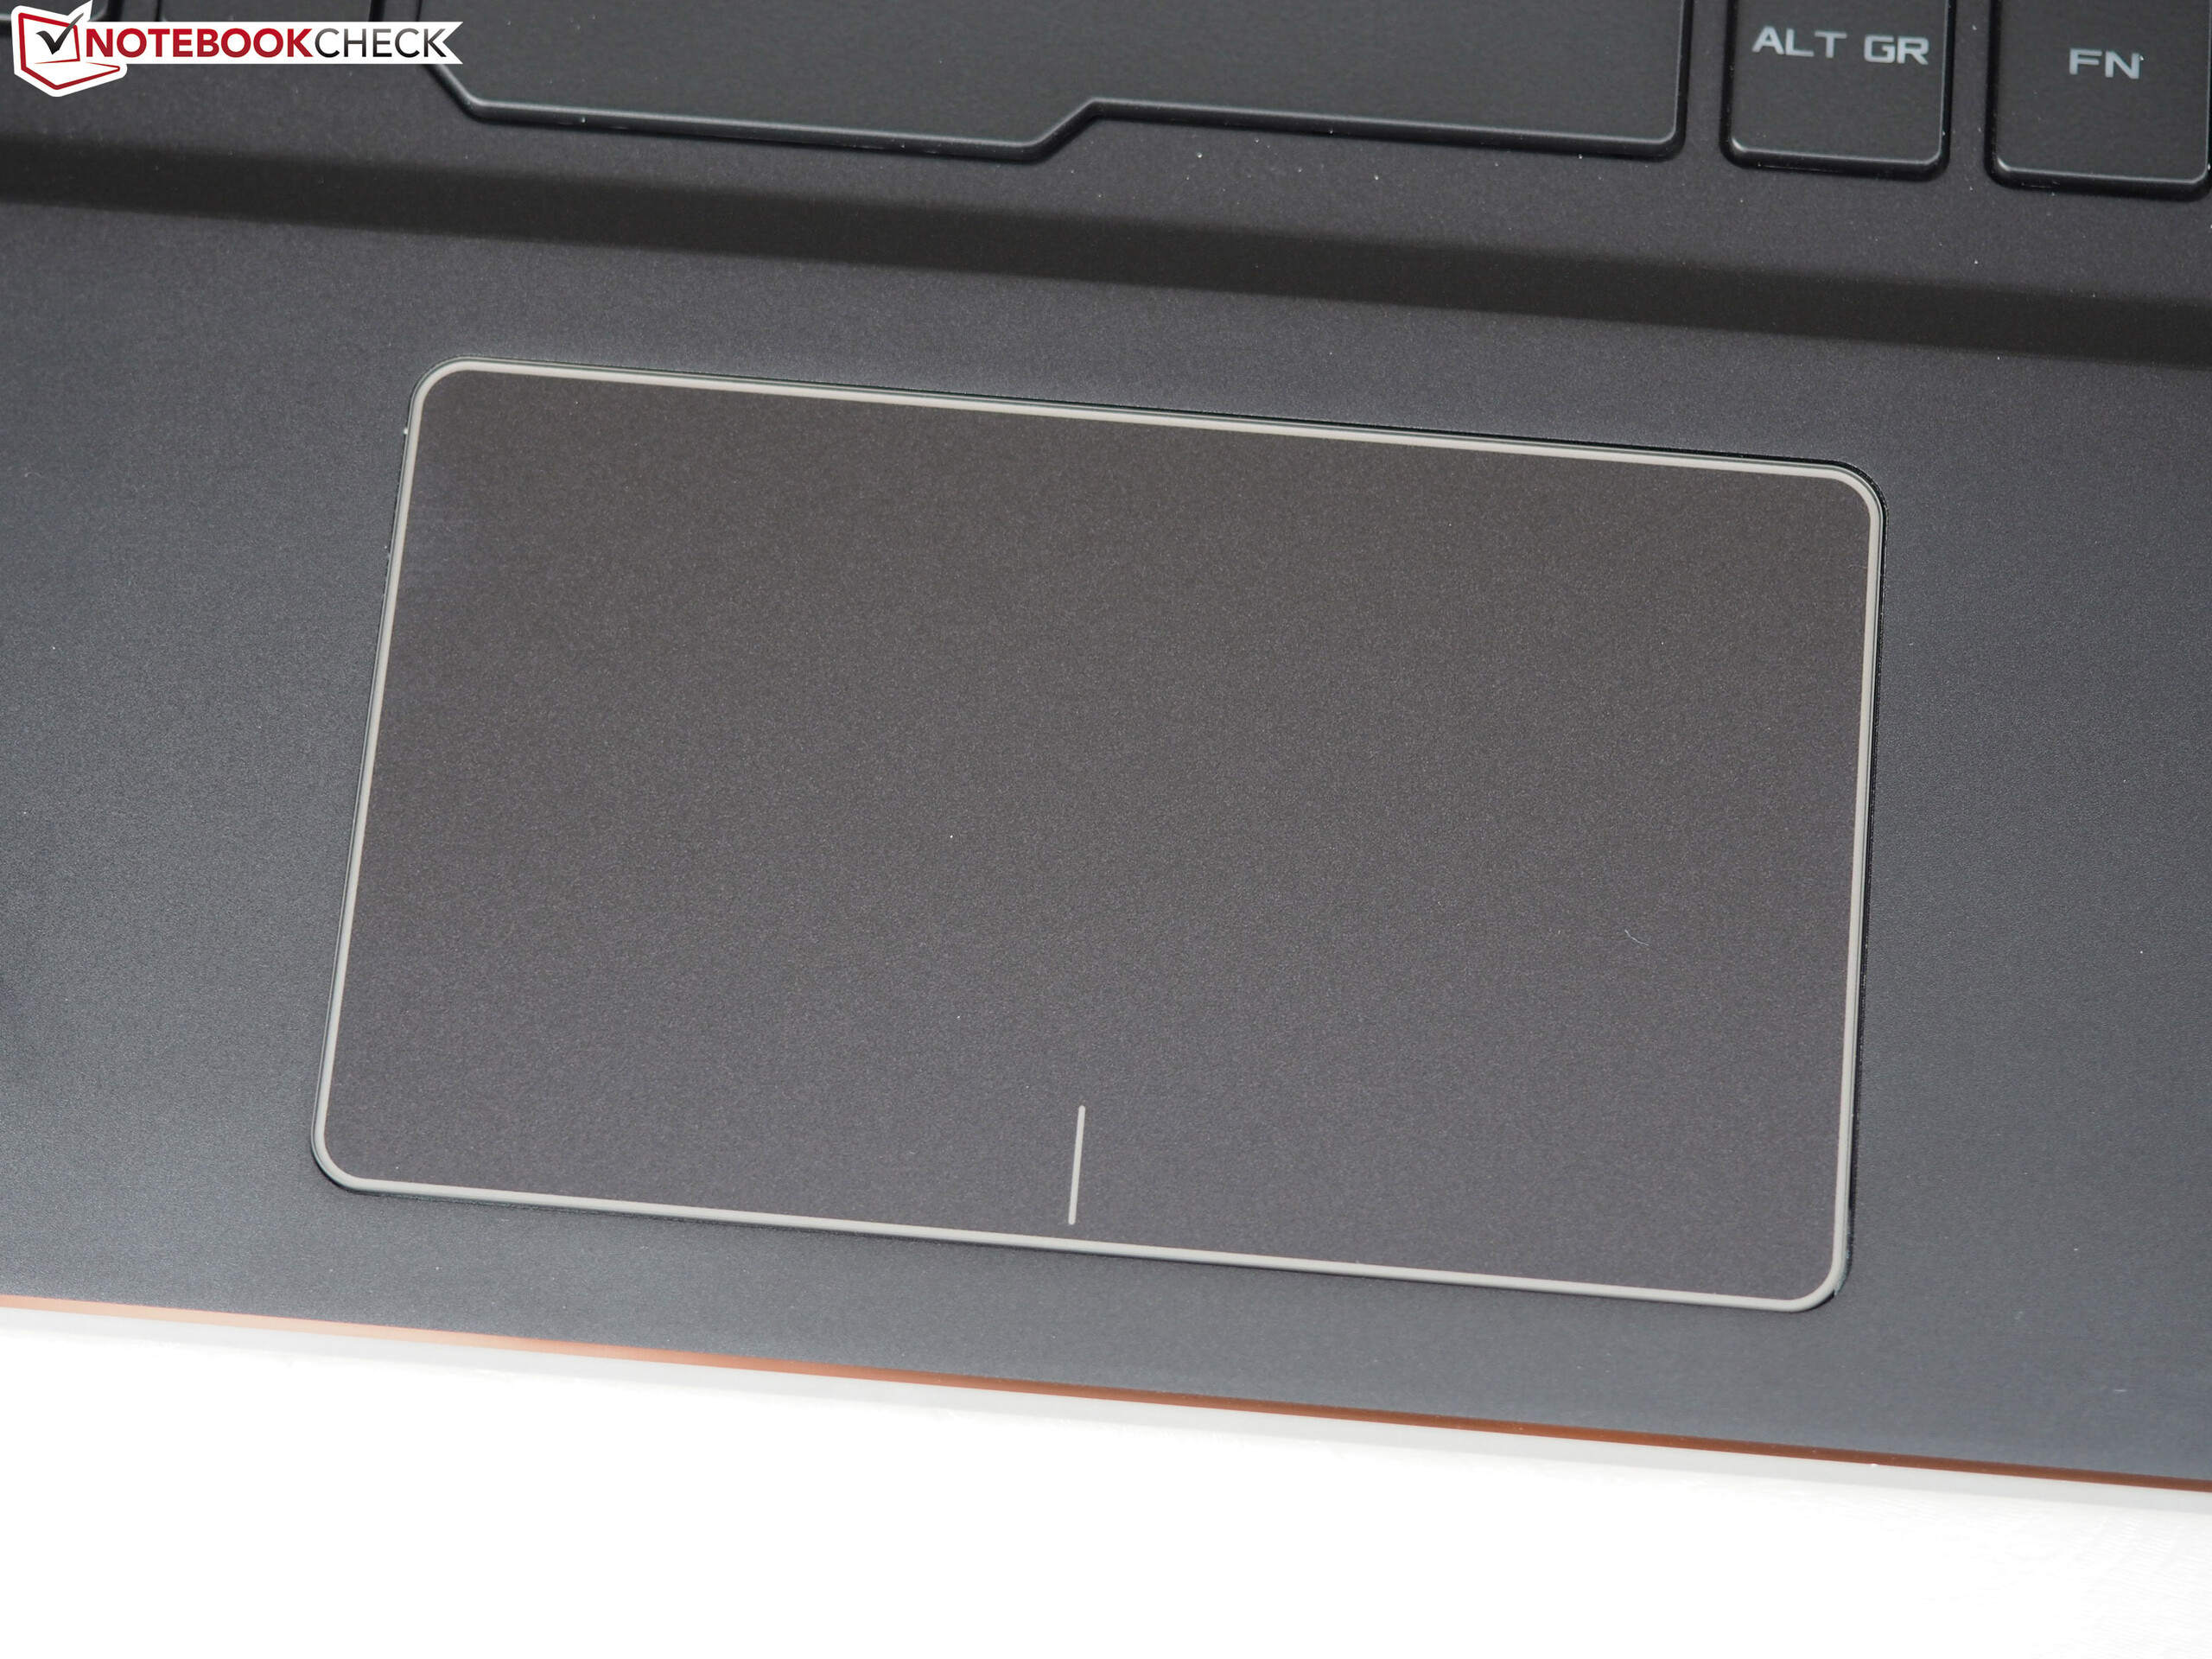
(±) Os apoios para as mãos e o touchpad podem ficar muito quentes ao toque, com um máximo de 38 °C / 100.4 F.
(-) A temperatura média da área do apoio para as mãos de dispositivos semelhantes foi 28.8 °C / 83.8 F (-9.2 °C / -16.6 F).
| Asus Zephyrus M GM501 GeForce GTX 1070 Mobile, i7-8750H | Asus Zephyrus GX501 GeForce GTX 1080 Max-Q, i7-7700HQ | Acer Predator Triton 700 GeForce GTX 1080 Max-Q, i7-7700HQ | Gigabyte Aero 15X GeForce GTX 1070 Max-Q, i7-7700HQ | MSI GS63VR 7RG-005 GeForce GTX 1070 Max-Q, i7-7700HQ | Média NVIDIA GeForce GTX 1070 Mobile | Média da turma Gaming | |
|---|---|---|---|---|---|---|---|
| Heat | -6% | -14% | 6% | 3% | 2% | 1% | |
| Maximum Upper Side * (°C) | 52 | 57 -10% | 61 -17% | 51 2% | 47 10% | 47.1 ? 9% | 45.2 ? 13% |
| Maximum Bottom * (°C) | 49 | 54 -10% | 69 -41% | 58 -18% | 63 -29% | 50.9 ? -4% | 48.1 ? 2% |
| Idle Upper Side * (°C) | 31 | 32 -3% | 29 6% | 25 19% | 25 19% | 30.6 ? 1% | 31 ? -0% |
| Idle Bottom * (°C) | 31 | 31 -0% | 32 -3% | 25 19% | 27 13% | 30.3 ? 2% | 34.2 ? -10% |
* ... menor é melhor
Asus Zephyrus M GM501 análise de áudio
(+) | os alto-falantes podem tocar relativamente alto (###valor### dB)
Graves 100 - 315Hz
(+) | bons graves - apenas 4.8% longe da mediana
(±) | a linearidade dos graves é média (8.3% delta para a frequência anterior)
Médios 400 - 2.000 Hz
(+) | médios equilibrados - apenas 3.2% longe da mediana
(+) | médios são lineares (3.6% delta para frequência anterior)
Altos 2 - 16 kHz
(±) | máximos mais altos - em média 5.8% maior que a mediana
(+) | os máximos são lineares (6.5% delta da frequência anterior)
Geral 100 - 16.000 Hz
(+) | o som geral é linear (11.5% diferença em relação à mediana)
Comparado com a mesma classe
» 10% de todos os dispositivos testados nesta classe foram melhores, 3% semelhantes, 87% piores
» O melhor teve um delta de 6%, a média foi 18%, o pior foi 132%
Comparado com todos os dispositivos testados
» 8% de todos os dispositivos testados foram melhores, 2% semelhantes, 90% piores
» O melhor teve um delta de 4%, a média foi 23%, o pior foi 134%
Acer Predator Triton 700 análise de áudio
(+) | os alto-falantes podem tocar relativamente alto (###valor### dB)
Graves 100 - 315Hz
(-) | quase nenhum baixo - em média 15.2% menor que a mediana
(±) | a linearidade dos graves é média (10.1% delta para a frequência anterior)
Médios 400 - 2.000 Hz
(±) | médios mais altos - em média 8% maior que a mediana
(+) | médios são lineares (6.7% delta para frequência anterior)
Altos 2 - 16 kHz
(+) | agudos equilibrados - apenas 2% longe da mediana
(+) | os máximos são lineares (4.9% delta da frequência anterior)
Geral 100 - 16.000 Hz
(±) | a linearidade do som geral é média (19.9% diferença em relação à mediana)
Comparado com a mesma classe
» 70% de todos os dispositivos testados nesta classe foram melhores, 6% semelhantes, 24% piores
» O melhor teve um delta de 6%, a média foi 18%, o pior foi 132%
Comparado com todos os dispositivos testados
» 51% de todos os dispositivos testados foram melhores, 7% semelhantes, 42% piores
» O melhor teve um delta de 4%, a média foi 23%, o pior foi 134%
| desligado | |
| Ocioso | |
| Carga |
|
Key:
min: | |
| Asus Zephyrus M GM501 GeForce GTX 1070 Mobile, i7-8750H | Asus Zephyrus GX501 GeForce GTX 1080 Max-Q, i7-7700HQ | Acer Predator Triton 700 GeForce GTX 1080 Max-Q, i7-7700HQ | Gigabyte Aero 15X GeForce GTX 1070 Max-Q, i7-7700HQ | MSI GS63VR 7RG-005 GeForce GTX 1070 Max-Q, i7-7700HQ | Média NVIDIA GeForce GTX 1070 Mobile | Média da turma Gaming | |
|---|---|---|---|---|---|---|---|
| Power Consumption | -1% | -33% | 28% | 21% | -21% | 0% | |
| Idle Minimum * (Watt) | 16 | 18 -13% | 28 -75% | 10 37% | 12 25% | 21 ? -31% | 13 ? 19% |
| Idle Average * (Watt) | 19 | 23 -21% | 33 -74% | 13 32% | 16 16% | 26.4 ? -39% | 19 ? -0% |
| Idle Maximum * (Watt) | 26 | 31 -19% | 41 -58% | 20 23% | 21 19% | 31.8 ? -22% | 24.6 ? 5% |
| Load Average * (Watt) | 103 | 79 23% | 94 9% | 79 23% | 85 17% | 117.7 ? -14% | 110.7 ? -7% |
| Witcher 3 ultra * (Watt) | 164 | 148 10% | 160 2% | 120 27% | 128 22% | ||
| Load Maximum * (Watt) | 223 | 196 12% | 222 -0% | 165 26% | 162 27% | 219 ? 2% | 259 ? -16% |
* ... menor é melhor
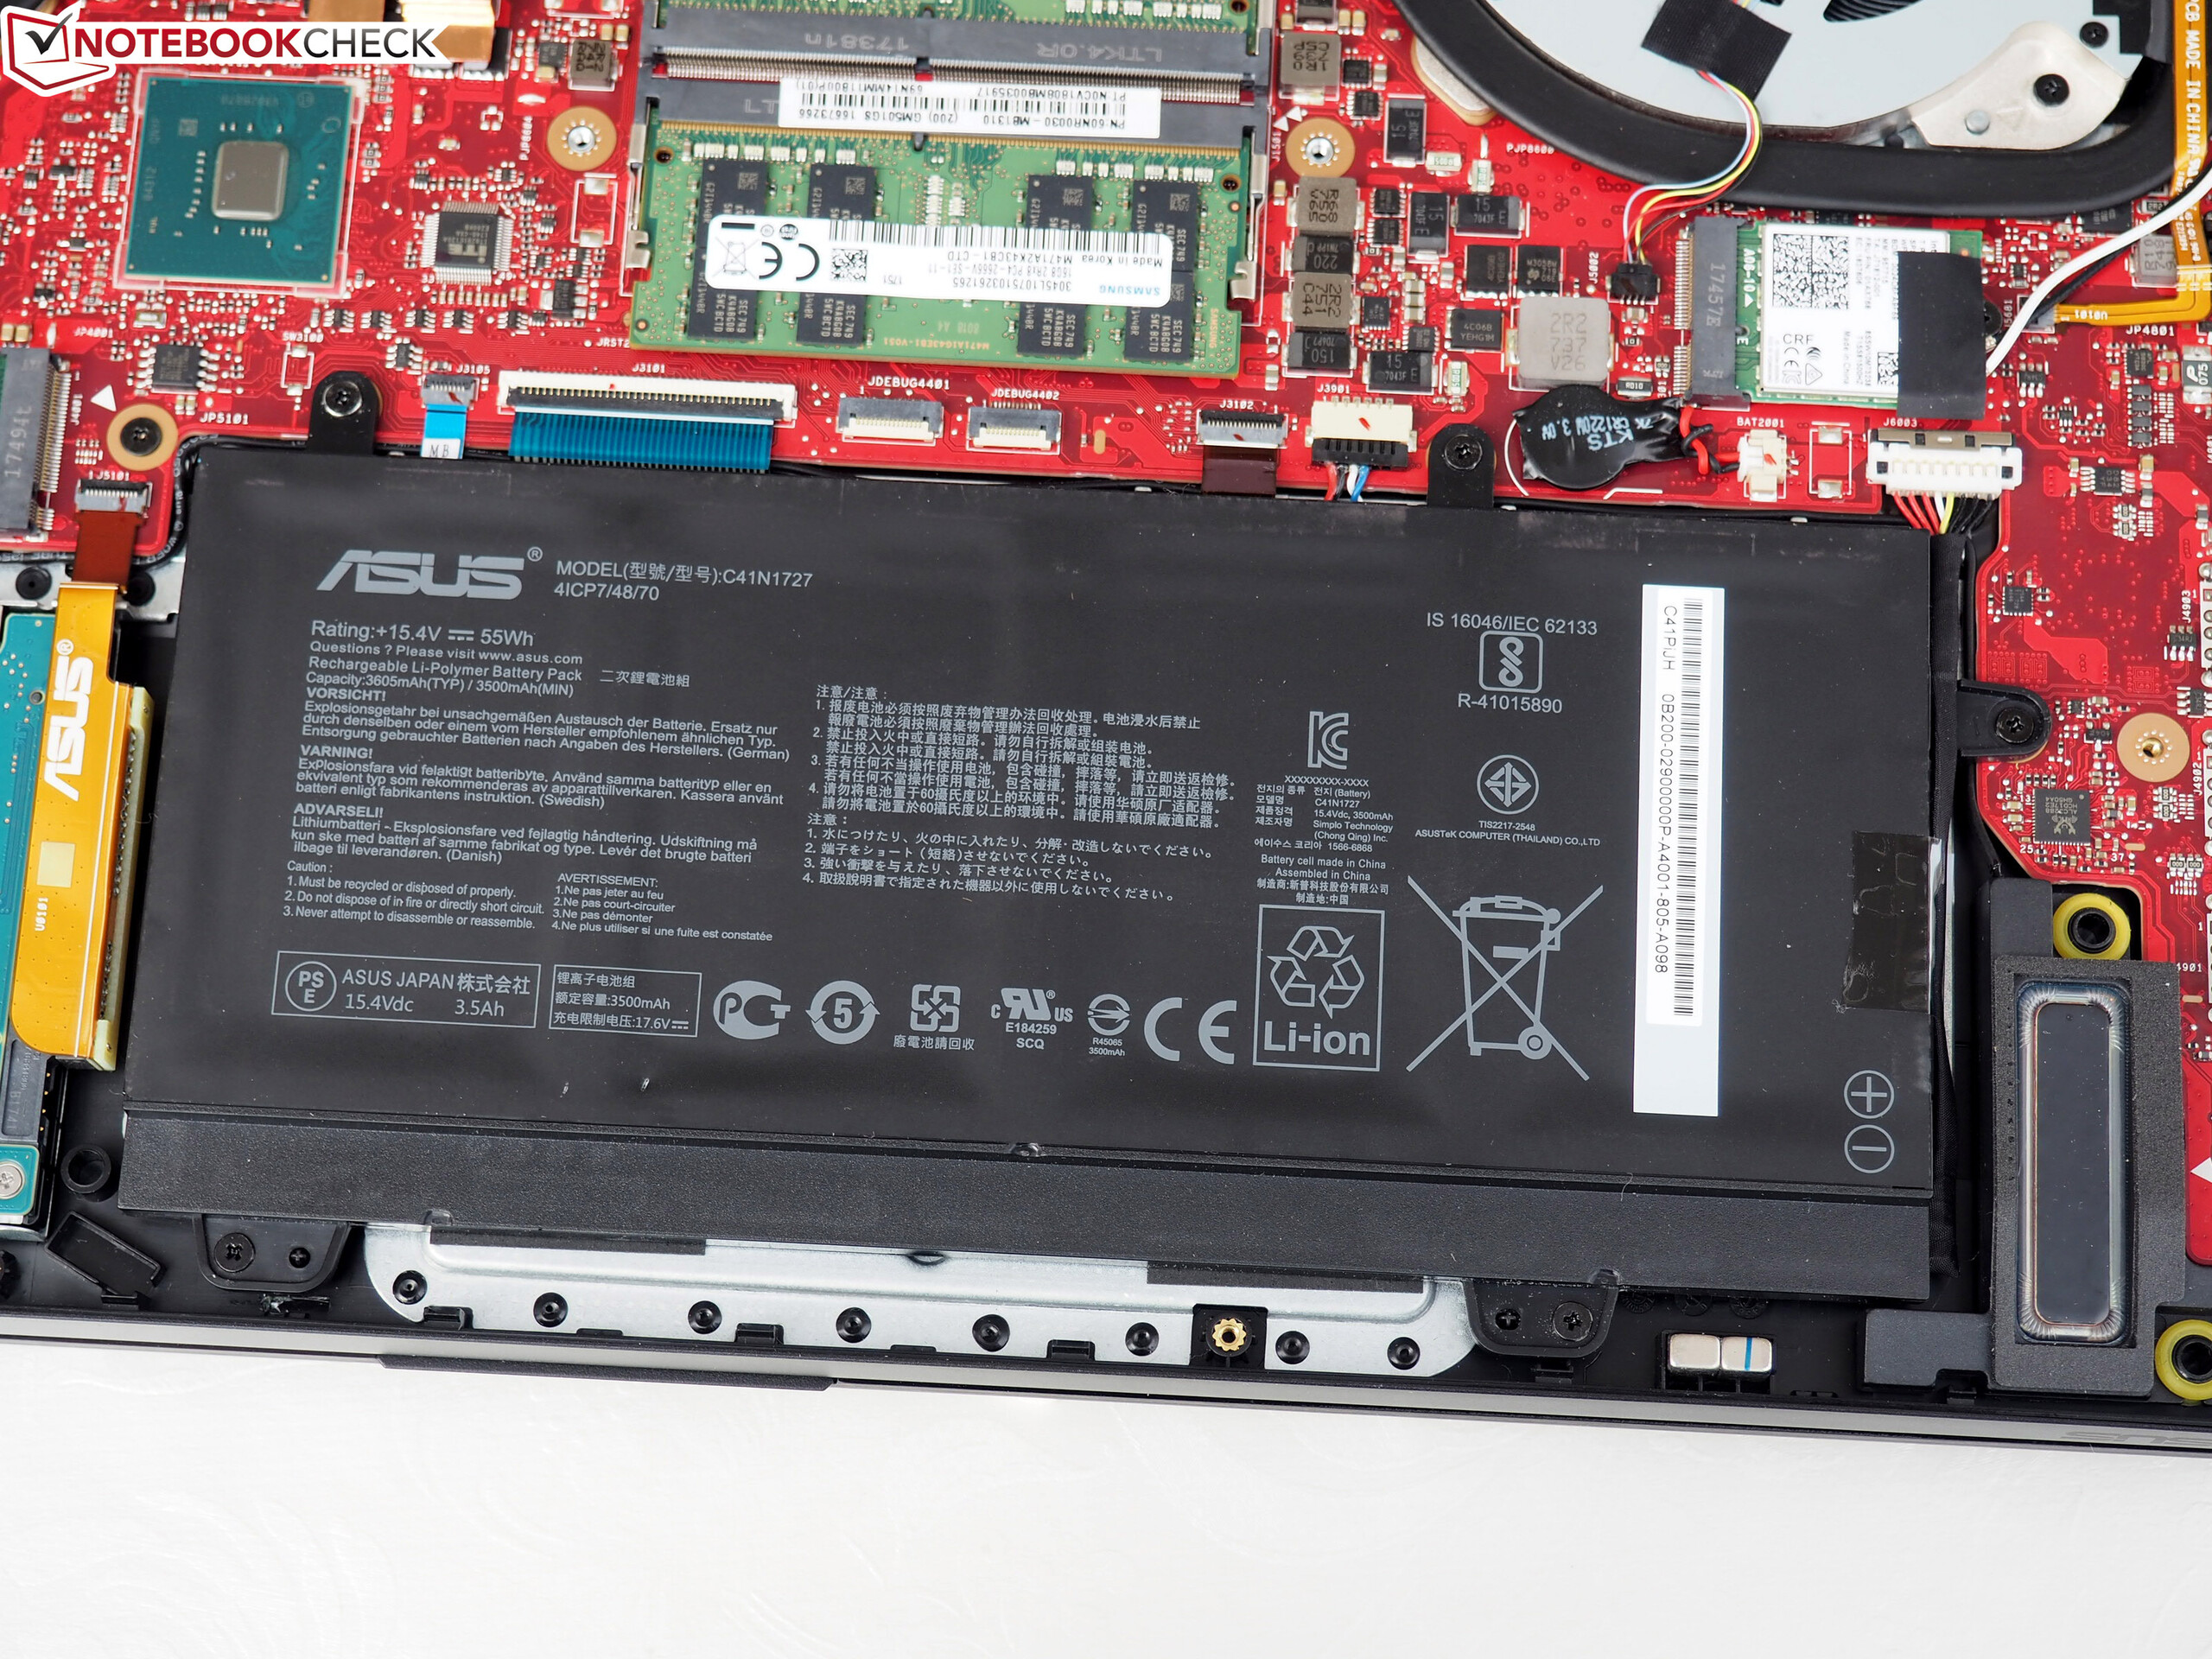
| Asus Zephyrus M GM501 GeForce GTX 1070 Mobile, i7-8750H, 55 Wh | Asus Zephyrus GX501 GeForce GTX 1080 Max-Q, i7-7700HQ, 50 Wh | Acer Predator Triton 700 GeForce GTX 1080 Max-Q, i7-7700HQ, 54 Wh | Gigabyte Aero 15X GeForce GTX 1070 Max-Q, i7-7700HQ, 94.2 Wh | MSI GS63VR 7RG-005 GeForce GTX 1070 Max-Q, i7-7700HQ, 52.4 Wh | Média da turma Gaming | |
|---|---|---|---|---|---|---|
| Duração da bateria | -26% | -20% | 182% | 28% | 126% | |
| Reader / Idle (h) | 4 | 3.1 -22% | 2.5 -37% | 13 225% | 5.7 43% | 8.27 ? 107% |
| H.264 (h) | 2.7 | 2.2 -19% | 1.8 -33% | 7.6 181% | 3.8 41% | 8.32 ? 208% |
| WiFi v1.3 (h) | 2.7 | 2.2 -19% | 2.4 -11% | 8.2 204% | 3.9 44% | 7.11 ? 163% |
| Load (h) | 1.2 | 0.7 -42% | 1.2 0% | 2.6 117% | 1 -17% | 1.502 ? 25% |
Pro
Contra
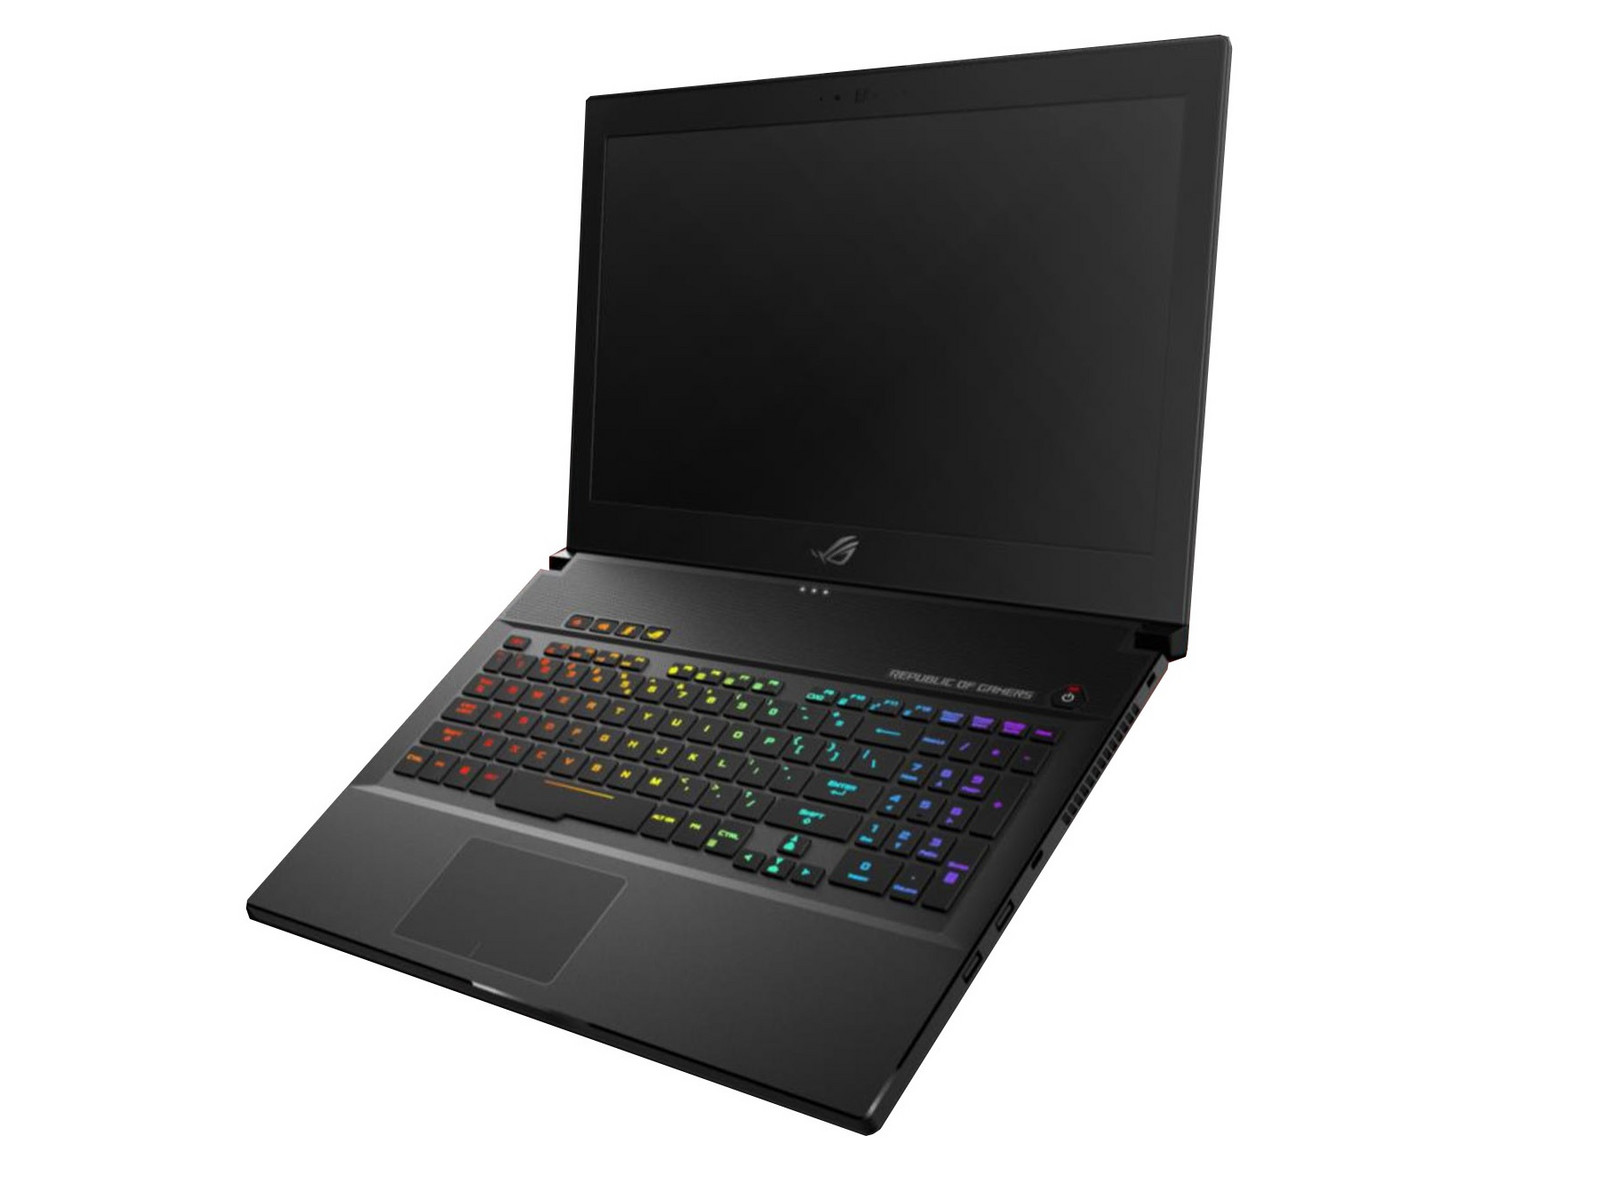
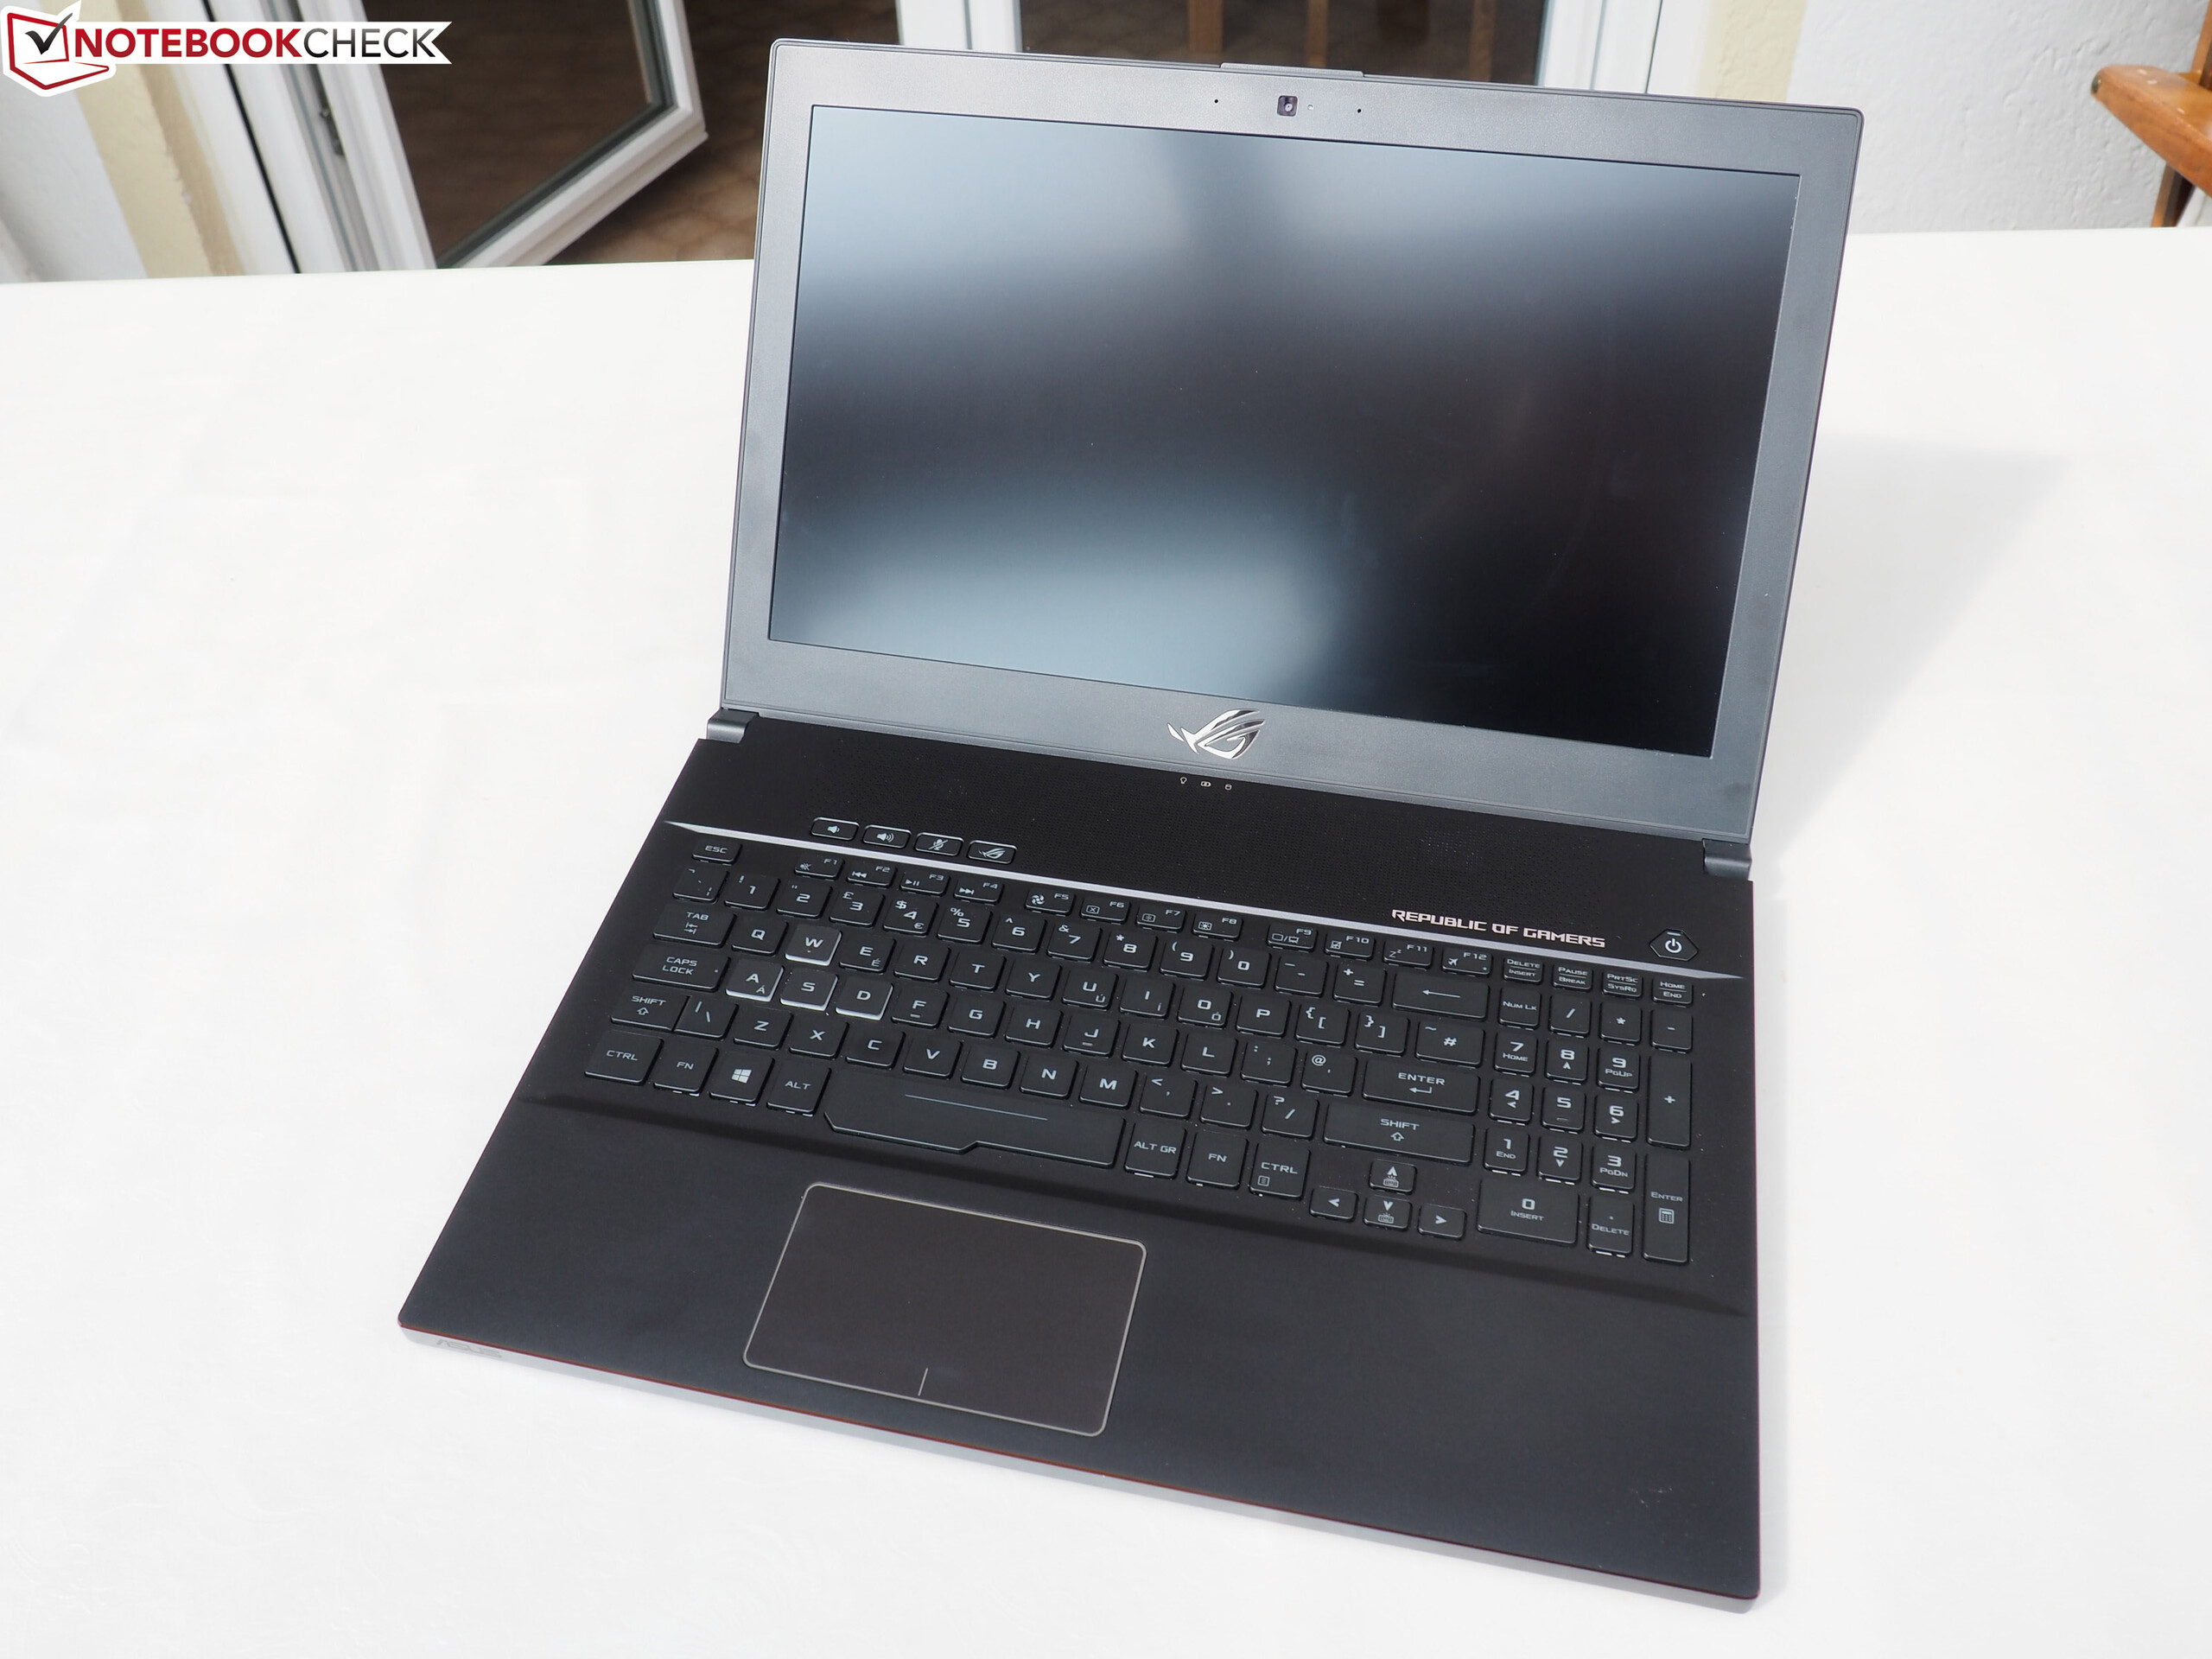
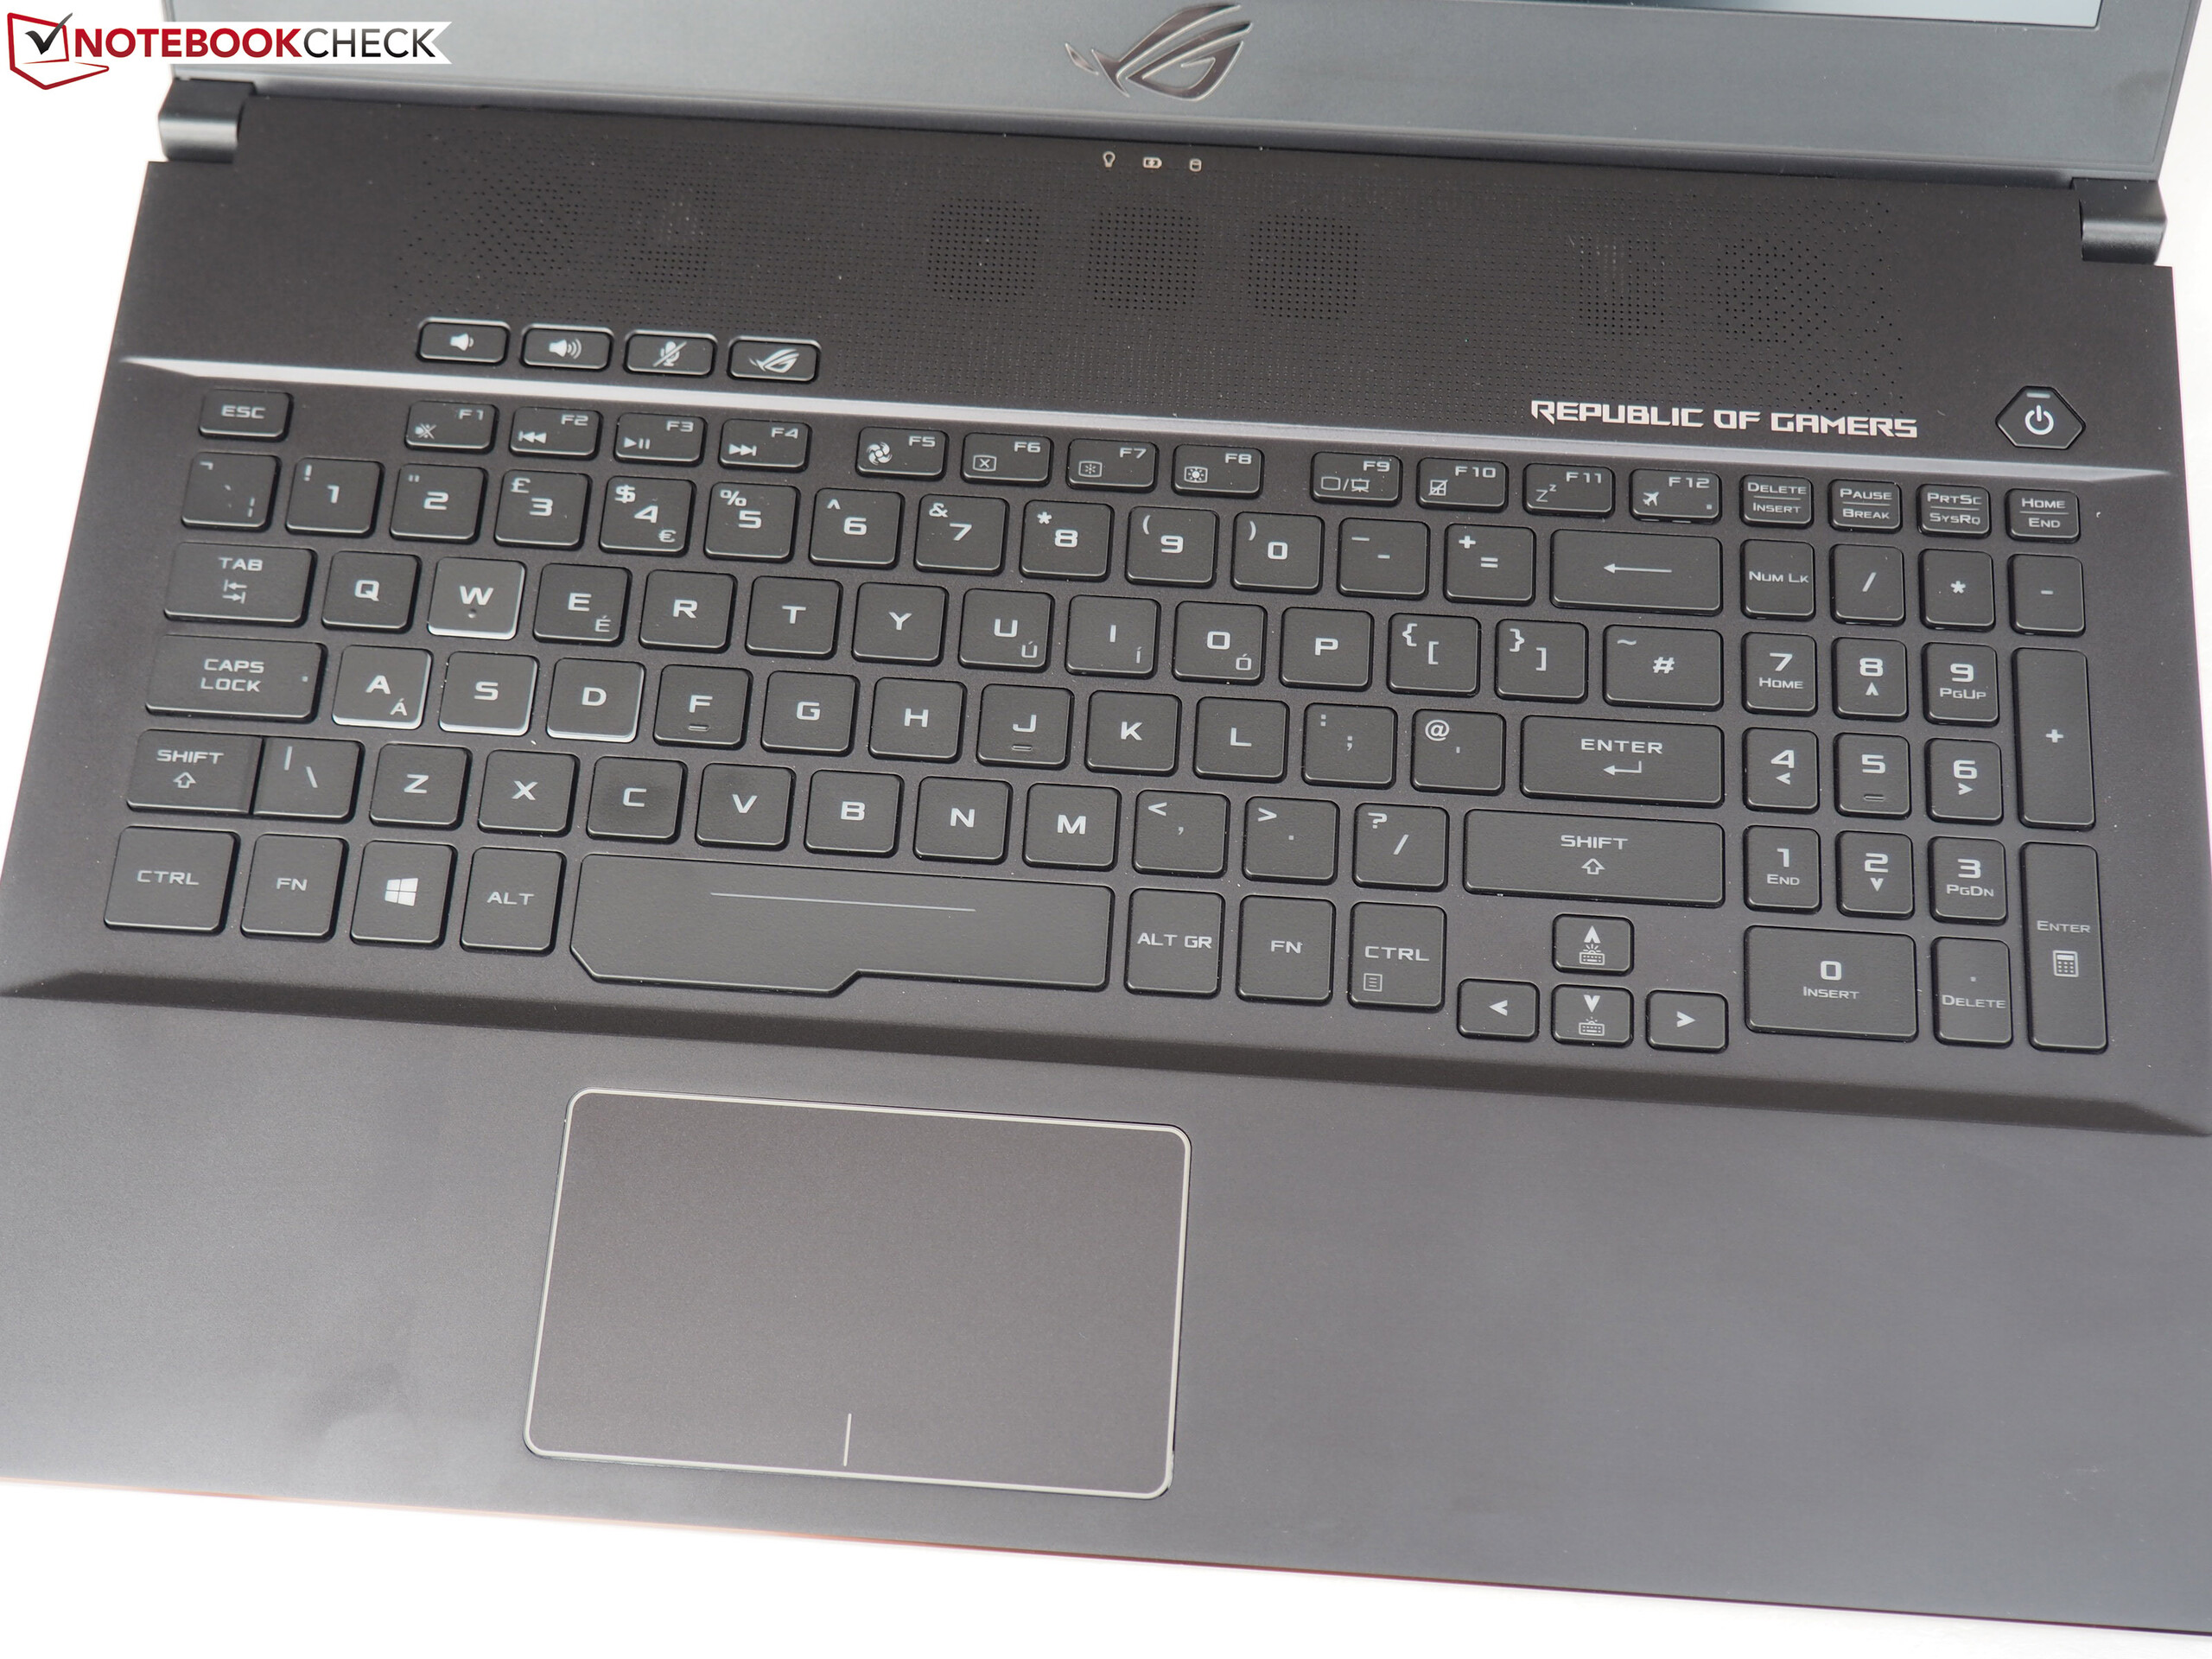
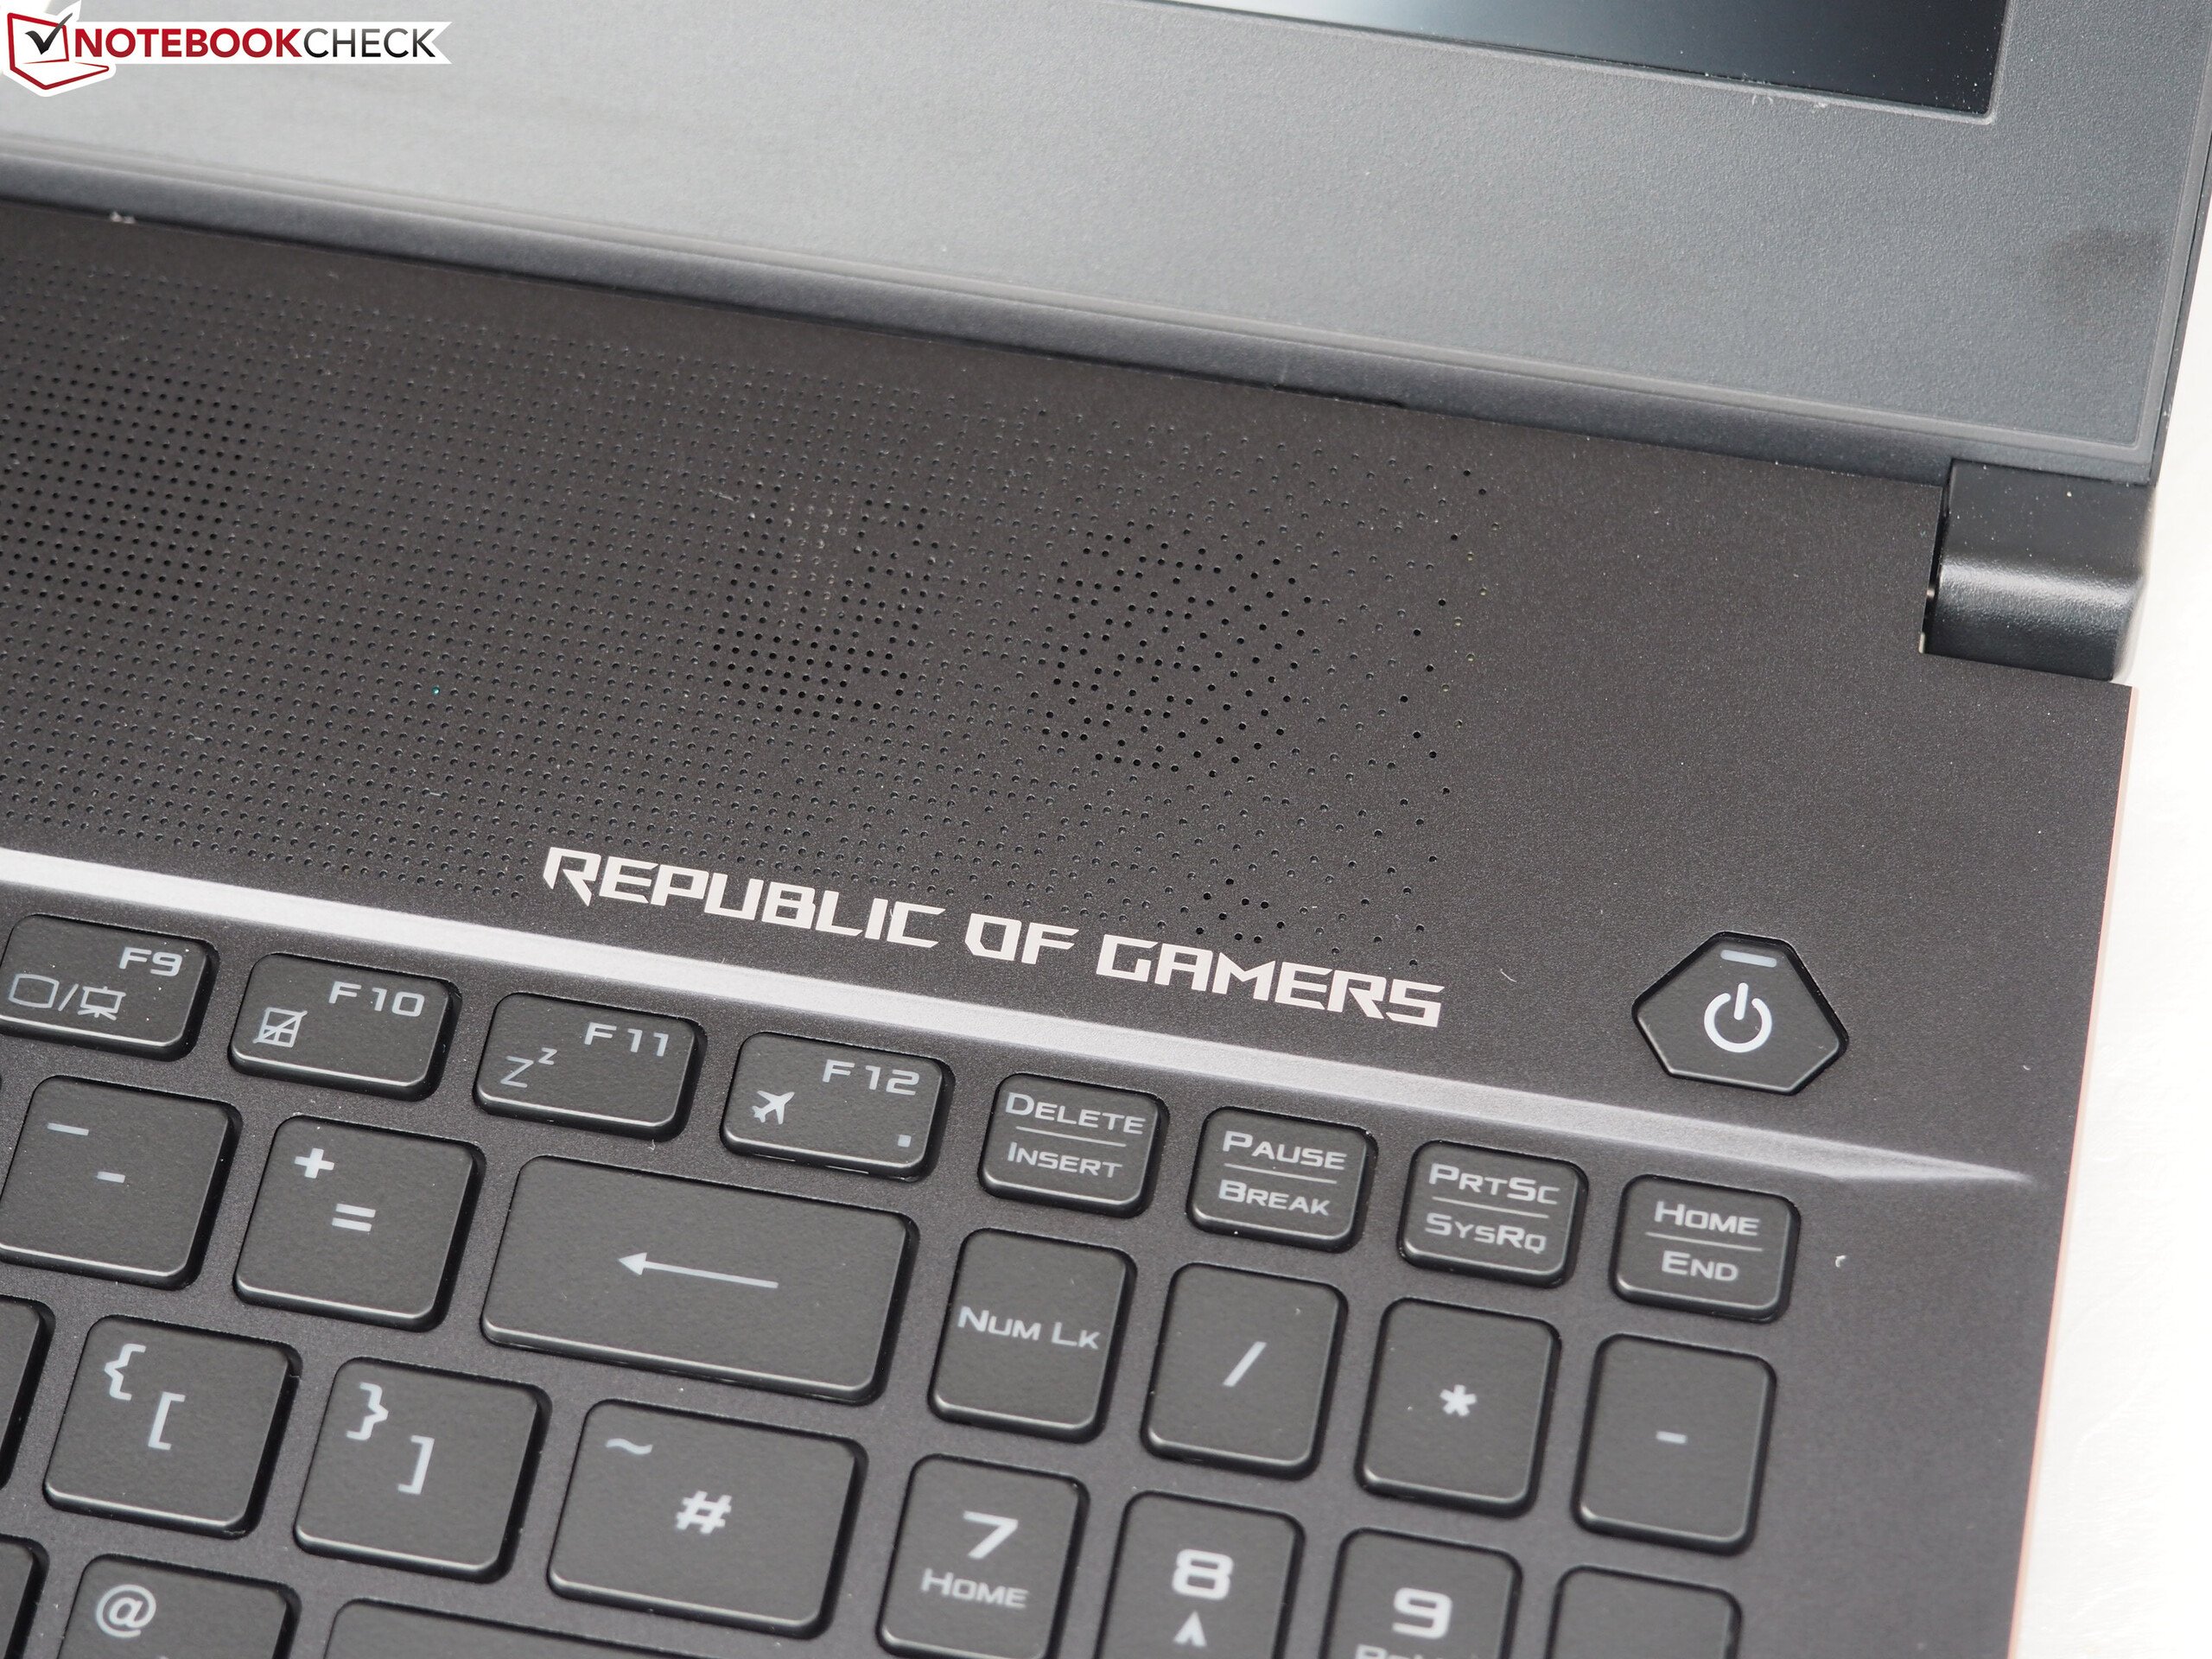
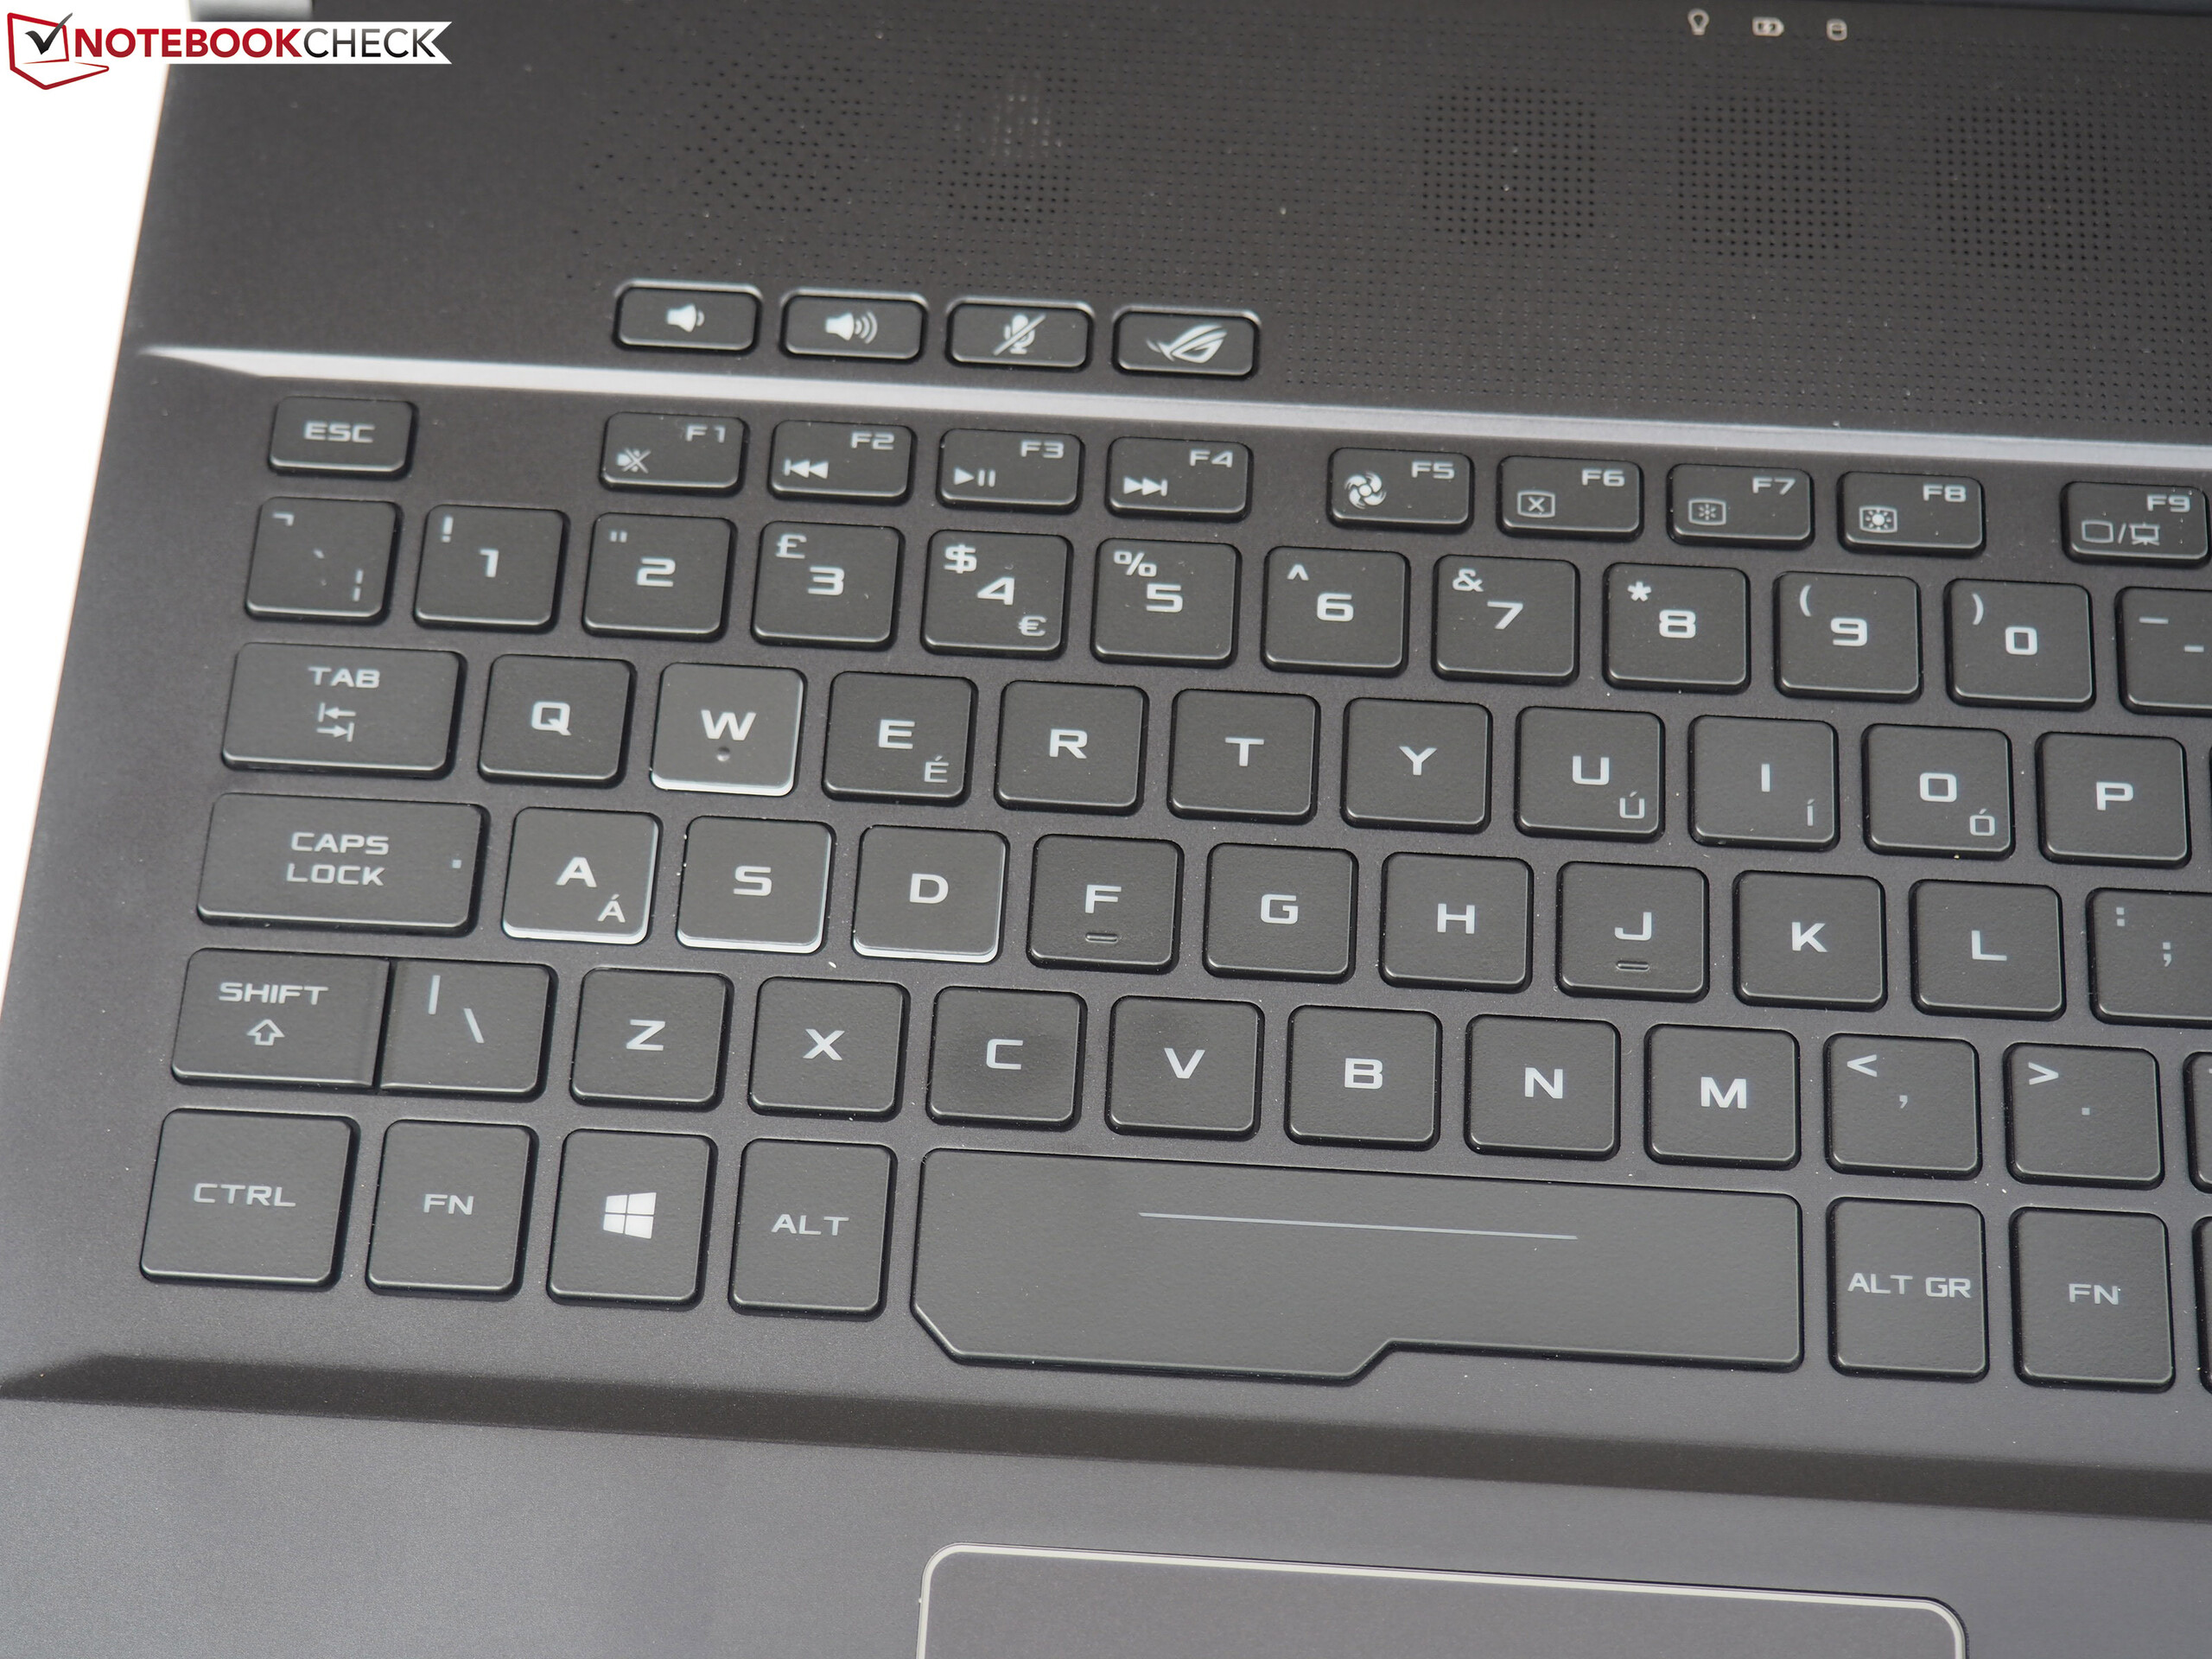
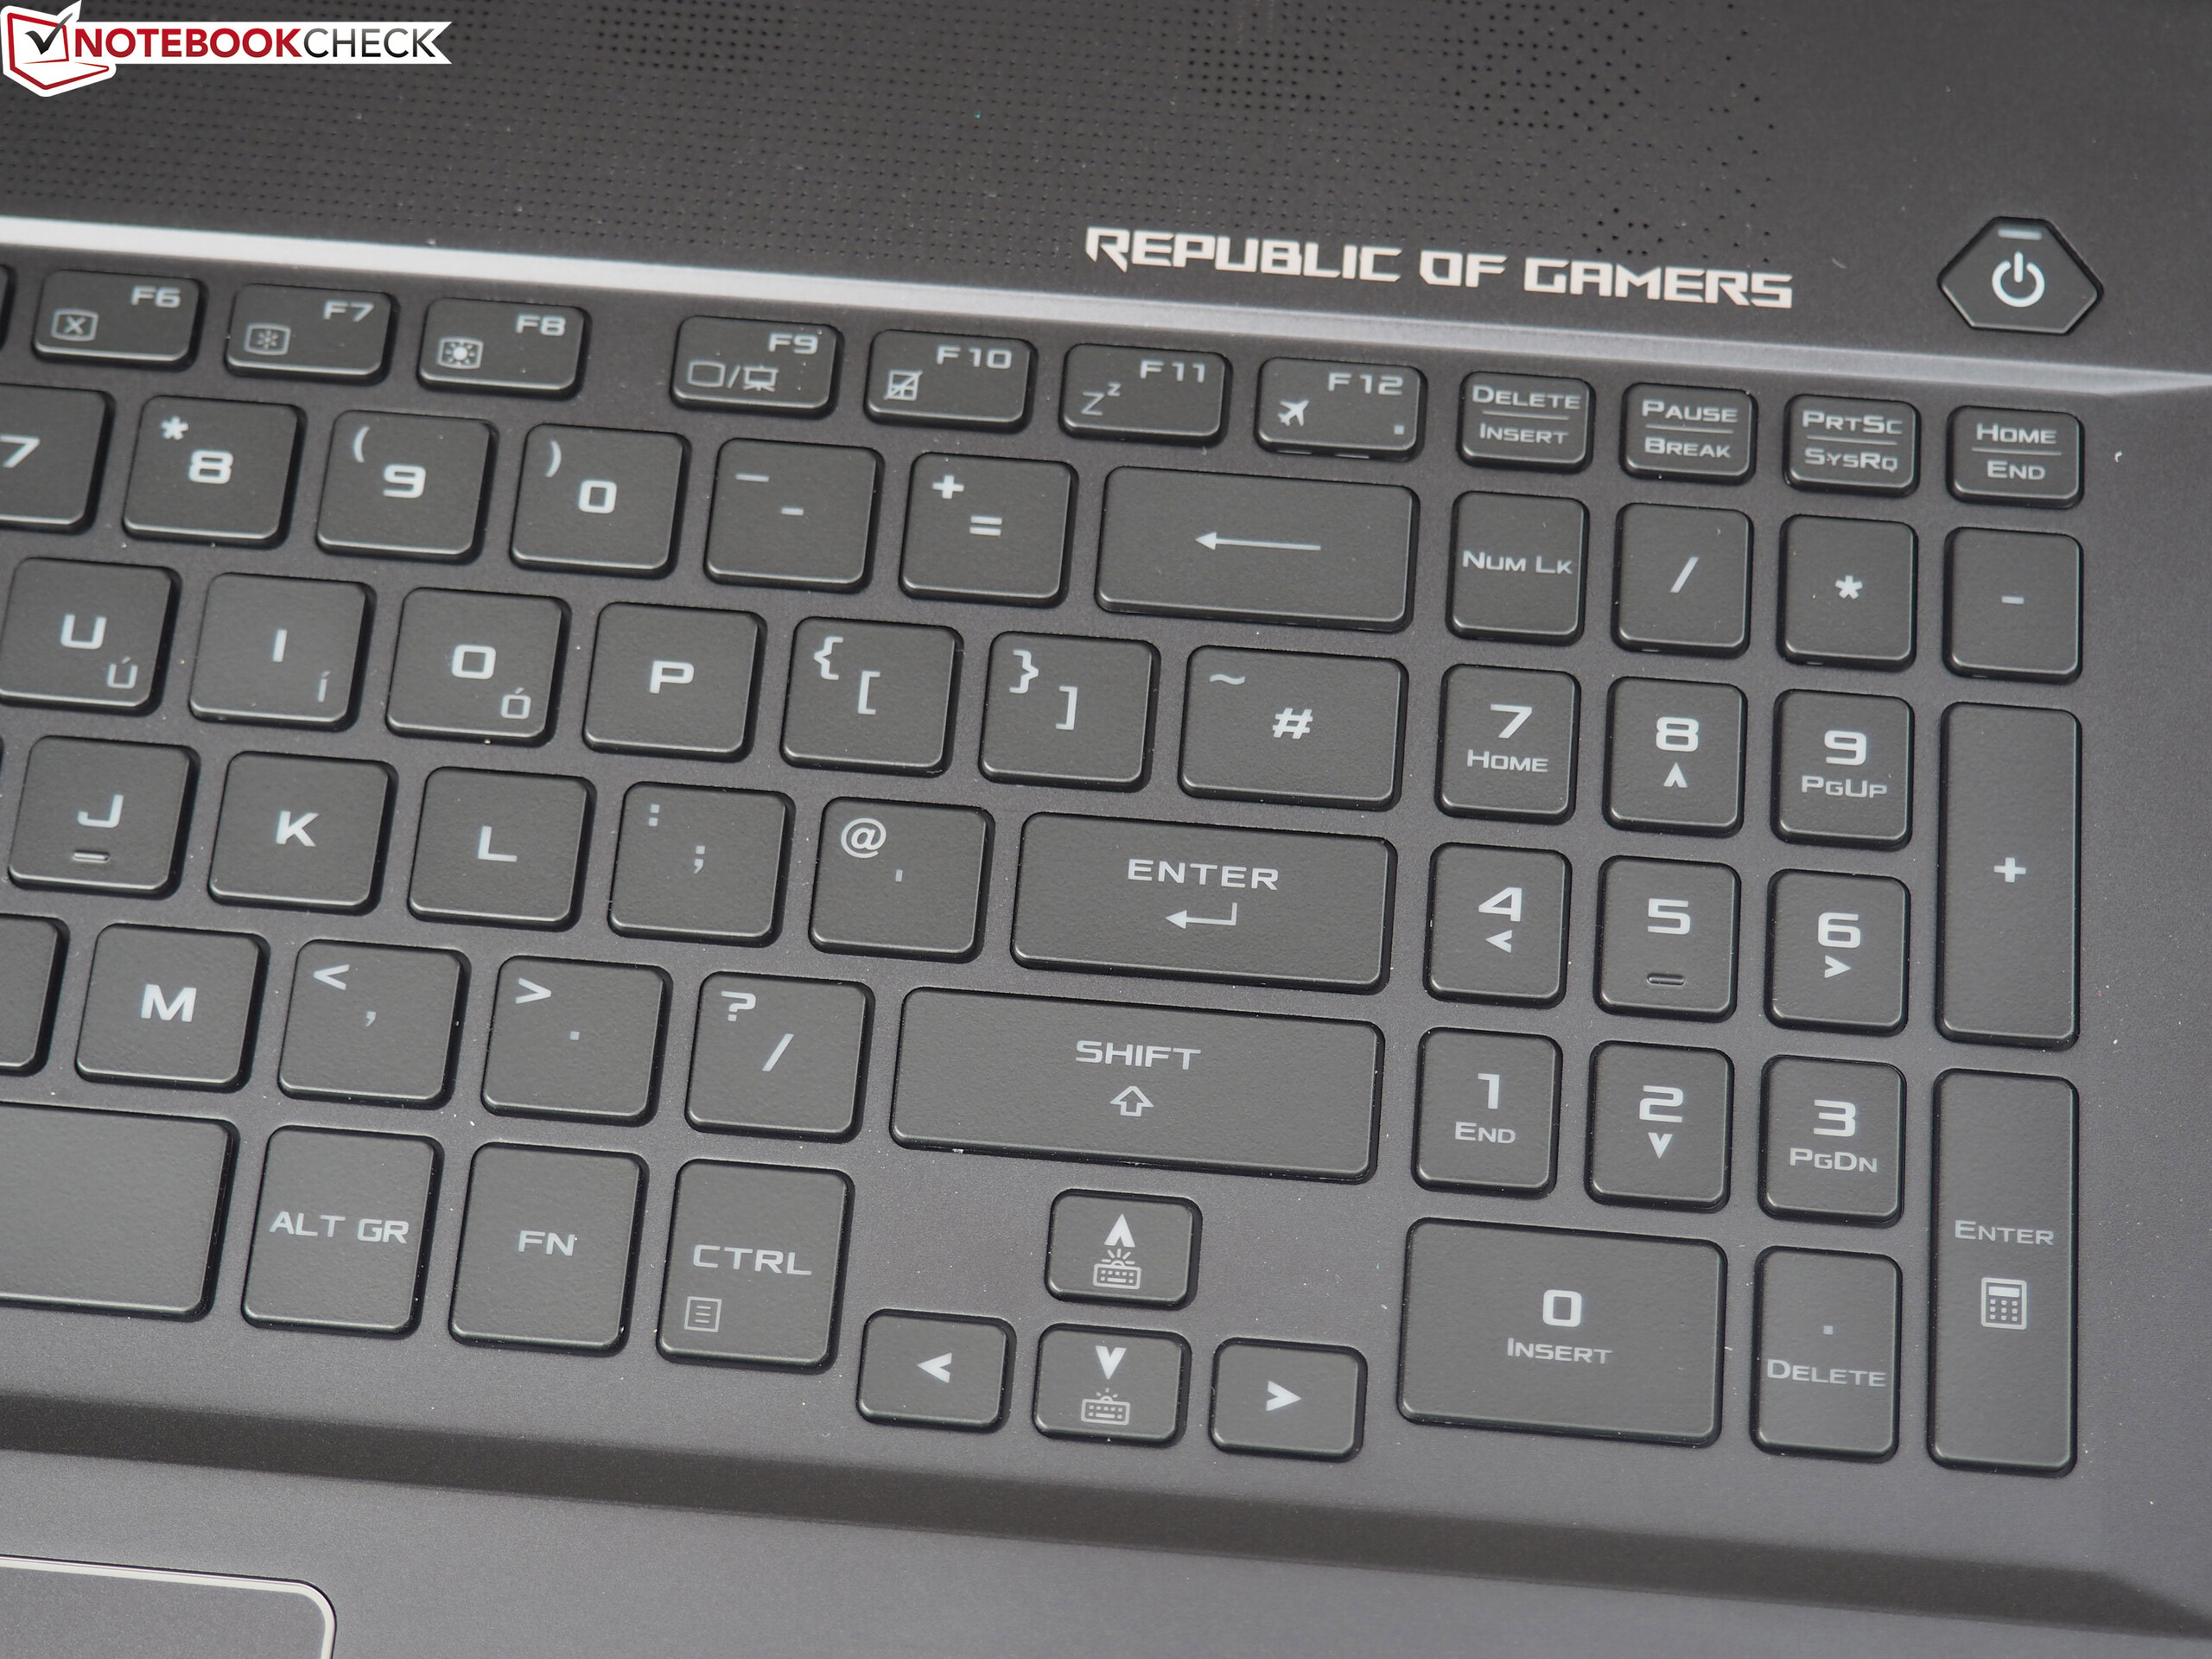
Se você tivesse que escolher entre o ROG Zephyrus GX501VI(GTX 1080 Max-Q) e o ROG Zephyrus M GM501GS (GeForce GTX 1070), pessoalmente, escolheríamos a última opção. Embora o GM501 seja significativamente mais barulhento durante aplicativos 3D, é muito mais barato, oferecendo desempenho de jogo quase idêntico e, acreditamos que tem melhores dispositivos de entrada. A tela de alto contraste de 144Hz com suporte para G-Sync e comutação gráfica opcional também é um forte motivo para compra.
Infelizmente, o GM501 não consegue muito tempo de duração da bateria devido à sua tecnologia Optimus. Seria necessária uma bateria maior. Assim, o Aero 15X permanece como o número 1 na arena do portáteis de gama alta de 15 polegadas. O concorrente da Acer (Predator Triton 700), bem como o MSI GS63VR pode ser mantido em xeque pelos nossos Gamers Zephyrus M. que viajam muito e esperam alto desempenho, bem como uma carcaça fina, confortavelmente leve e de boa aparência.
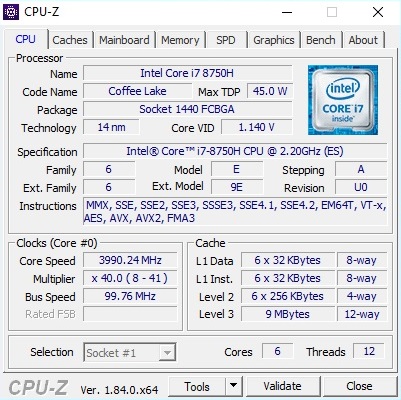
A arquitetura de seis núcleos da Intel, que agora testamos pela primeira vez em um dispositivo móvel, garante um aumento generoso no desempenho em aplicativos multi-core. Isso foi extremamente necessário após o lançamento dos chips de seis e oito núcleos da AMD baseados em Ryzen. Ou, como se diz: A competição é boa para os negócios.
A propósito, os comentários para a novíssima MSI GS65 e a atualização da Gigabyte Aero 15X (ambos com Coffee Lake) estarão disponíveis em breve - e provavelmente serão fortes concorrentes contra a Zephyrus M.
Asus Zephyrus M GM501
- 04/02/2018 v6 (old)
Florian Glaser
Price comparison