Breve Análise do Portátil Gigabyte Aero 15X (i7-7700HQ, GTX 1070 Max-Q, FHD)

| SD Card Reader | |
| average JPG Copy Test (av. of 3 runs) | |
| Eurocom Q5 | |
| Gigabyte Aero 15X (Toshiba Exceria Pro SDXC 64 GB UHS-II) | |
| Gigabyte Aero 15 (Toshiba Exceria Pro SDXC 64 GB UHS-II) | |
| MSI GS63VR 7RF-228US (Toshiba Exceria Pro SDXC 64 GB UHS-II) | |
| maximum AS SSD Seq Read Test (1GB) | |
| Eurocom Q5 | |
| Gigabyte Aero 15 (Toshiba Exceria Pro SDXC 64 GB UHS-II) | |
| Gigabyte Aero 15X (Toshiba Exceria Pro SDXC 64 GB UHS-II) | |
| MSI GS63VR 7RF-228US (Toshiba Exceria Pro SDXC 64 GB UHS-II) | |
| Networking | |
| iperf3 transmit AX12 | |
| MSI GS63VR 7RF-228US | |
| Eurocom Q5 | |
| Asus Zephyrus GX501VS | |
| Gigabyte Aero 15X | |
| Gigabyte Aero 15 | |
| iperf3 receive AX12 | |
| Gigabyte Aero 15X | |
| Gigabyte Aero 15 | |
| Eurocom Q5 | |
| MSI GS63VR 7RF-228US | |
| Asus Zephyrus GX501VS | |
| |||||||||||||||||||||||||
iluminação: 88 %
iluminação com acumulador: 338 cd/m²
Contraste: 994:1 (Preto: 0.34 cd/m²)
ΔE ColorChecker Calman: 5.92 | ∀{0.5-29.43 Ø4.71}
ΔE Greyscale Calman: 7.45 | ∀{0.09-98 Ø4.96}
90% sRGB (Argyll 1.6.3 3D)
59% AdobeRGB 1998 (Argyll 1.6.3 3D)
65.7% AdobeRGB 1998 (Argyll 3D)
90.4% sRGB (Argyll 3D)
64.7% Display P3 (Argyll 3D)
Gamma: 2.58
CCT: 6366 K
| Gigabyte Aero 15X Chi Mei N156HCA-EA1 (CMN15D7), 1920x1080, 15.6" | MSI GS63VR 7RF-228US 3840x2160, 15.6" | Gigabyte Aero 15 N156HCA-EA1 (CMN15D7), 1920x1080, 15.6" | Asus Zephyrus GX501VS ID: AUO42ED, Name: AU Optronics B156HAN04.2, 1920x1080, 15.6" | Eurocom Q5 ID: LGD04D4, Name: LG Philips LP156UD1-SPB1, 3840x2160, 15.6" | |
|---|---|---|---|---|---|
| Display | -23% | 1% | -5% | -1% | |
| Display P3 Coverage (%) | 64.7 | 48.21 -25% | 65.2 1% | 62.1 -4% | 63 -3% |
| sRGB Coverage (%) | 90.4 | 72.6 -20% | 92.5 2% | 85.6 -5% | 92.7 3% |
| AdobeRGB 1998 Coverage (%) | 65.7 | 49.81 -24% | 66.5 1% | 62.4 -5% | 64.4 -2% |
| Response Times | 26% | -6% | 12% | 12% | |
| Response Time Grey 50% / Grey 80% * (ms) | 43.2 ? | 28 ? 35% | 42.8 ? 1% | 33.2 ? 23% | 32.4 ? 25% |
| Response Time Black / White * (ms) | 28.4 ? | 23.6 ? 17% | 32 ? -13% | 28 ? 1% | 28.8 ? -1% |
| PWM Frequency (Hz) | 26000 ? | 1351 ? | 26000 ? | ||
| Screen | -22% | 4% | 11% | -9% | |
| Brightness middle (cd/m²) | 338 | 274.2 -19% | 320 -5% | 307.1 -9% | 287.5 -15% |
| Brightness (cd/m²) | 324 | 263 -19% | 316 -2% | 309 -5% | 279 -14% |
| Brightness Distribution (%) | 88 | 92 5% | 90 2% | 86 -2% | 87 -1% |
| Black Level * (cd/m²) | 0.34 | 0.44 -29% | 0.36 -6% | 0.35 -3% | 0.65 -91% |
| Contrast (:1) | 994 | 623 -37% | 889 -11% | 877 -12% | 442 -56% |
| Colorchecker dE 2000 * | 5.92 | 8 -35% | 4.62 22% | 3.4 43% | 4.5 24% |
| Colorchecker dE 2000 max. * | 11.77 | 14.6 -24% | 9.75 17% | 8.2 30% | 8.9 24% |
| Greyscale dE 2000 * | 7.45 | 9.1 -22% | 6 19% | 1.4 81% | 4.6 38% |
| Gamma | 2.58 85% | 2.24 98% | 2.46 89% | 2.19 100% | 2.39 92% |
| CCT | 6366 102% | 5020 129% | 6761 96% | 6558 99% | 7393 88% |
| Color Space (Percent of AdobeRGB 1998) (%) | 59 | 45.7 -23% | 60 2% | 55.6 -6% | 59 0% |
| Color Space (Percent of sRGB) (%) | 90 | 72.1 -20% | 92 2% | 85 -6% | 92.3 3% |
| Média Total (Programa/Configurações) | -6% /
-16% | -0% /
2% | 6% /
8% | 1% /
-4% |
* ... menor é melhor
Cintilação da tela / PWM (modulação por largura de pulso)
| Tela tremeluzindo/PWM detectado | 26000 Hz | ≤ 20 % configuração de brilho | 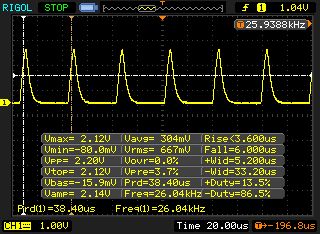 |
A luz de fundo da tela pisca em 26000 Hz (pior caso, por exemplo, utilizando PWM) Cintilação detectada em uma configuração de brilho de 20 % e abaixo. Não deve haver cintilação ou PWM acima desta configuração de brilho. A frequência de 26000 Hz é bastante alta, então a maioria dos usuários sensíveis ao PWM não deve notar nenhuma oscilação. [pwm_comparison] Em comparação: 52 % de todos os dispositivos testados não usam PWM para escurecer a tela. Se PWM foi detectado, uma média de 7757 (mínimo: 5 - máximo: 343500) Hz foi medida. | |||
Exibir tempos de resposta
| ↔ Tempo de resposta preto para branco | ||
|---|---|---|
| 28.4 ms ... ascensão ↗ e queda ↘ combinadas | ↗ 15.6 ms ascensão | 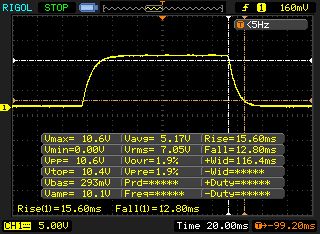 |
| ↘ 12.8 ms queda | ||
| A tela mostra taxas de resposta relativamente lentas em nossos testes e pode ser muito lenta para os jogadores. Em comparação, todos os dispositivos testados variam de 0.1 (mínimo) a 240 (máximo) ms. » 75 % de todos os dispositivos são melhores. Isso significa que o tempo de resposta medido é pior que a média de todos os dispositivos testados (19.8 ms). | ||
| ↔ Tempo de resposta 50% cinza a 80% cinza | ||
| 43.2 ms ... ascensão ↗ e queda ↘ combinadas | ↗ 22.8 ms ascensão | 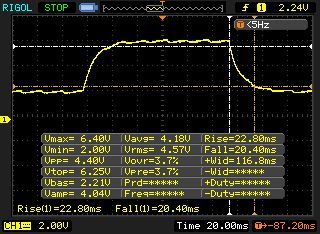 |
| ↘ 20.4 ms queda | ||
| A tela mostra taxas de resposta lentas em nossos testes e será insatisfatória para os jogadores. Em comparação, todos os dispositivos testados variam de 0.165 (mínimo) a 636 (máximo) ms. » 72 % de todos os dispositivos são melhores. Isso significa que o tempo de resposta medido é pior que a média de todos os dispositivos testados (31 ms). | ||
| Cinebench R10 | |
| Rendering Single 32Bit | |
| Gigabyte Aero 15X | |
| HP Omen 15-ce002ng | |
| Eurocom Q5 | |
| Asus Zephyrus GX501VS | |
| MSI GS63VR 7RF-228US | |
| MSI GS63VR 7RG | |
| Rendering Multiple CPUs 32Bit | |
| Gigabyte Aero 15X | |
| Asus Zephyrus GX501VS | |
| HP Omen 15-ce002ng | |
| MSI GS63VR 7RF-228US | |
| Eurocom Q5 | |
| MSI GS63VR 7RG | |
| Geekbench 3 | |
| 32 Bit Multi-Core Score | |
| Gigabyte Aero 15X | |
| 32 Bit Single-Core Score | |
| Gigabyte Aero 15X | |
| Geekbench 4.0 | |
| 64 Bit Multi-Core Score | |
| Gigabyte Aero 15X | |
| 64 Bit Single-Core Score | |
| Gigabyte Aero 15X | |
| Geekbench 4.4 | |
| 64 Bit Multi-Core Score | |
| Gigabyte Aero 15X | |
| 64 Bit Single-Core Score | |
| Gigabyte Aero 15X | |
| JetStream 1.1 - 1.1 Total | |
| Gigabyte Aero 15X (Edge 41) | |
| Eurocom Q5 (Edge 40.15063.0.0) | |
| MSI GS63VR 7RF-228US (Edge 38.14393.0.0) | |
| Acer Aspire VN7-593G-73HP V15 Nitro BE | |
| Asus Zephyrus GX501VS (Edge 40.15063.0.0) | |
| PCMark 7 Score | 6288 pontos | |
| PCMark 8 Home Score Accelerated v2 | 4394 pontos | |
| PCMark 8 Creative Score Accelerated v2 | 5546 pontos | |
| PCMark 8 Work Score Accelerated v2 | 5195 pontos | |
| PCMark 10 Score | 4933 pontos | |
Ajuda | ||

| Gigabyte Aero 15X Samsung SM961 MZVKW512HMJP m.2 PCI-e | MSI GS63VR 7RF-228US Samsung SM961 MZVKW512HMJP m.2 PCI-e | Gigabyte Aero 15 Lite-On CX2-8B512-Q11 | |
|---|---|---|---|
| CrystalDiskMark 3.0 | 19% | 13% | |
| Read Seq (MB/s) | 1381 | 2141 55% | 1769 28% |
| Write Seq (MB/s) | 1546 | 1621 5% | 1133 -27% |
| Read 512 (MB/s) | 418 | 499.7 20% | 891 113% |
| Write 512 (MB/s) | 1277 | 1531 20% | 1069 -16% |
| Read 4k (MB/s) | 51.3 | 54.2 6% | 44.7 -13% |
| Write 4k (MB/s) | 131 | 158.2 21% | 123.3 -6% |
| Read 4k QD32 (MB/s) | 544 | 632 16% | 645 19% |
| Write 4k QD32 (MB/s) | 480.2 | 527 10% | 490.5 2% |
| 3DMark 06 Standard Score | 27822 pontos | |
| 3DMark 11 Performance | 14847 pontos | |
| 3DMark Ice Storm Standard Score | 130556 pontos | |
| 3DMark Cloud Gate Standard Score | 27624 pontos | |
| 3DMark Fire Strike Score | 12166 pontos | |
| 3DMark Fire Strike Extreme Score | 6378 pontos | |
| 3DMark Time Spy Score | 4575 pontos | |
Ajuda | ||
| BioShock Infinite - 1920x1080 Ultra Preset, DX11 (DDOF) | |
| Asus G752VS-BA338T | |
| MSI GE73VR 7RF Raider | |
| Asus Zephyrus GX501VS | |
| Eurocom Q5 | |
| Gigabyte Aero 15X | |
| MSI GS63VR 7RF-228US | |
| Acer Aspire VN7-593G-73HP V15 Nitro BE | |
| Ghost Recon Wildlands - 1920x1080 Ultra Preset AA:T AF:16x | |
| Asus G752VS-BA338T | |
| MSI GS63VR 7RG | |
| Gigabyte Aero 15X | |
| Gigabyte Aero 15 | |
| HP Omen 15-ce002ng | |
| baixo | média | alto | ultra | |
|---|---|---|---|---|
| Tomb Raider (2013) | 478.7 | 439.3 | 371.5 | 185.2 |
| BioShock Infinite (2013) | 249 | 210.1 | 194.4 | 123.9 |
| The Witcher 3 (2015) | 232.8 | 164.8 | 94.5 | 52.4 |
| For Honor (2017) | 203.9 | 128.6 | 122.7 | 96 |
| Ghost Recon Wildlands (2017) | 148.4 | 86 | 78.6 | 43.7 |
| Middle-earth: Shadow of War (2017) | 132 | 114 | 90 | 69 |
| The Evil Within 2 (2017) | 88.5 | 53.3 | 54 | 53.8 |
| ELEX (2017) | 122.5 | 107.3 | 86.7 | 66.6 |
Barulho
| Ocioso |
| 31 / 32 / 36 dB |
| Carga |
| 39 / 52 dB |
 | ||
30 dB silencioso 40 dB(A) audível 50 dB(A) ruidosamente alto |
||
min: | ||
| Gigabyte Aero 15X i7-7700HQ, GeForce GTX 1070 Max-Q | MSI GS63VR 7RF-228US i7-7700HQ, GeForce GTX 1060 Mobile | HP Omen 15-ce002ng i7-7700HQ, GeForce GTX 1060 Max-Q | Gigabyte Aero 15 i7-7700HQ, GeForce GTX 1060 Mobile | Asus Zephyrus GX501VS i7-7700HQ, GeForce GTX 1070 Max-Q | MSI GE63VR 7RF Raider i7-7700HQ, GeForce GTX 1070 Mobile | Aorus X5 v7 i7-7820HK, GeForce GTX 1070 Mobile | Gigabyte P56XT i7-7700HQ, GeForce GTX 1070 Mobile | |
|---|---|---|---|---|---|---|---|---|
| Noise | 1% | 0% | 0% | 9% | -10% | -9% | -4% | |
| desligado / ambiente * (dB) | 30 | 28.8 4% | 30 -0% | 31 -3% | 28.5 5% | 30 -0% | 30 -0% | 30 -0% |
| Idle Minimum * (dB) | 31 | 33.1 -7% | 30 3% | 32 -3% | 28.5 8% | 33 -6% | 35 -13% | 34 -10% |
| Idle Average * (dB) | 32 | 33.1 -3% | 33 -3% | 33 -3% | 28.5 11% | 35 -9% | 36 -13% | 35 -9% |
| Idle Maximum * (dB) | 36 | 34 6% | 37 -3% | 34 6% | 30.1 16% | 40 -11% | 40 -11% | 39 -8% |
| Load Average * (dB) | 39 | 37.2 5% | 41 -5% | 39 -0% | 35.2 10% | 48 -23% | 43 -10% | 39 -0% |
| Witcher 3 ultra * (dB) | 44 | 46.1 -5% | 42 5% | 43 2% | 41.7 5% | 50 -14% | 49 -11% | 48 -9% |
| Load Maximum * (dB) | 52 | 47.1 9% | 50 4% | 50 4% | 48.8 6% | 55 -6% | 55 -6% | 49 6% |
* ... menor é melhor
(-) A temperatura máxima no lado superior é 51 °C / 124 F, em comparação com a média de 40.4 °C / 105 F , variando de 21.2 a 68.8 °C para a classe Gaming.
(-) A parte inferior aquece até um máximo de 58 °C / 136 F, em comparação com a média de 43.2 °C / 110 F
(+) Em uso inativo, a temperatura média para o lado superior é 24 °C / 75 F, em comparação com a média do dispositivo de 33.9 °C / ### class_avg_f### F.
(-) Jogando The Witcher 3, a temperatura média para o lado superior é 42.9 °C / 109 F, em comparação com a média do dispositivo de 33.9 °C / ## #class_avg_f### F.
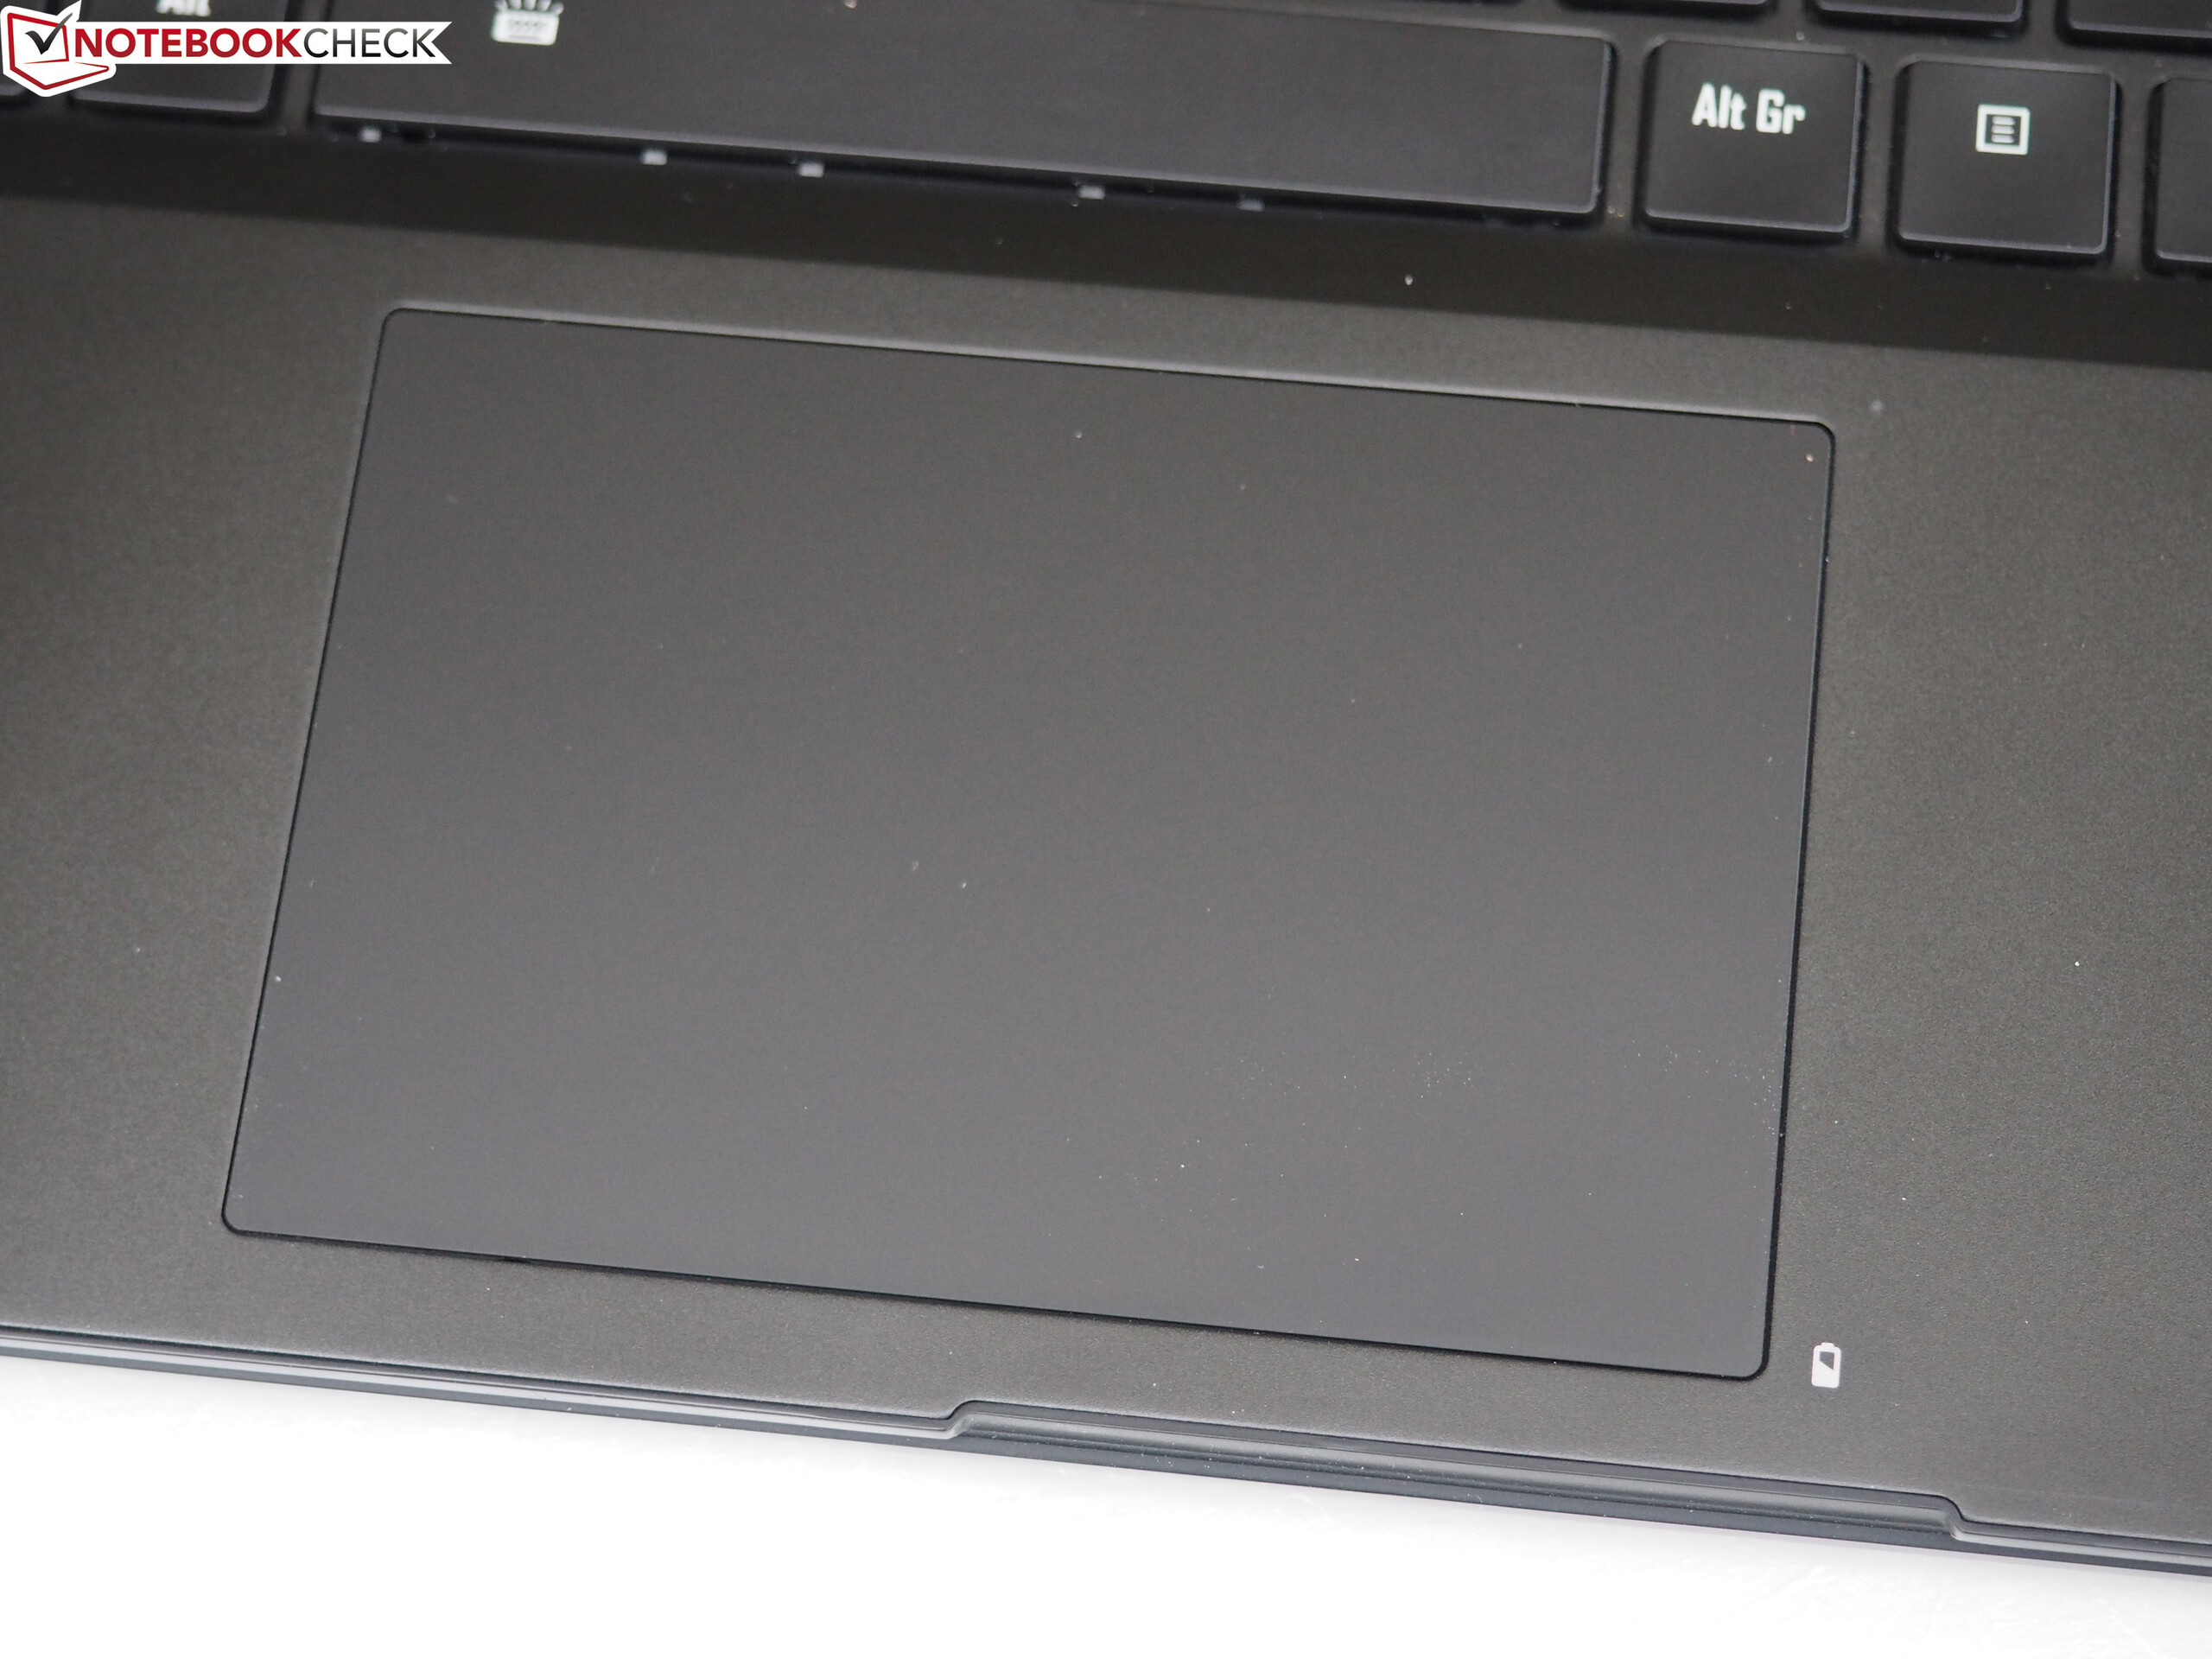
(±) Os apoios para as mãos e o touchpad podem ficar muito quentes ao toque, com um máximo de 39 °C / 102.2 F.
(-) A temperatura média da área do apoio para as mãos de dispositivos semelhantes foi 28.8 °C / 83.8 F (-10.2 °C / -18.4 F).
| Gigabyte Aero 15X i7-7700HQ, GeForce GTX 1070 Max-Q | MSI GS63VR 7RF-228US i7-7700HQ, GeForce GTX 1060 Mobile | HP Omen 15-ce002ng i7-7700HQ, GeForce GTX 1060 Max-Q | Gigabyte Aero 15 i7-7700HQ, GeForce GTX 1060 Mobile | Asus Zephyrus GX501VS i7-7700HQ, GeForce GTX 1070 Max-Q | MSI GE63VR 7RF Raider i7-7700HQ, GeForce GTX 1070 Mobile | Aorus X5 v7 i7-7820HK, GeForce GTX 1070 Mobile | Gigabyte P56XT i7-7700HQ, GeForce GTX 1070 Mobile | |
|---|---|---|---|---|---|---|---|---|
| Heat | -16% | -22% | -3% | -3% | -6% | -15% | -27% | |
| Maximum Upper Side * (°C) | 51 | 47 8% | 56 -10% | 54.4 -7% | 48 6% | 64 -25% | 65 -27% | |
| Maximum Bottom * (°C) | 58 | 54 7% | 61 -5% | 41.2 29% | 47 19% | 56 3% | 71 -22% | |
| Idle Upper Side * (°C) | 25 | 28.4 -14% | 36 -44% | 25 -0% | 31.2 -25% | 29 -16% | 29 -16% | 35 -40% |
| Idle Bottom * (°C) | 25 | 29.6 -18% | 40 -60% | 24 4% | 27.6 -10% | 33 -32% | 30 -20% | 30 -20% |
* ... menor é melhor
Gigabyte Aero 15X análise de áudio
(±) | o volume do alto-falante é médio, mas bom (###valor### dB)
Graves 100 - 315Hz
(±) | graves reduzidos - em média 12.6% menor que a mediana
(±) | a linearidade dos graves é média (14.3% delta para a frequência anterior)
Médios 400 - 2.000 Hz
(+) | médios equilibrados - apenas 4.8% longe da mediana
(+) | médios são lineares (4.1% delta para frequência anterior)
Altos 2 - 16 kHz
(+) | agudos equilibrados - apenas 3% longe da mediana
(+) | os máximos são lineares (3.1% delta da frequência anterior)
Geral 100 - 16.000 Hz
(±) | a linearidade do som geral é média (16.6% diferença em relação à mediana)
Comparado com a mesma classe
» 43% de todos os dispositivos testados nesta classe foram melhores, 7% semelhantes, 50% piores
» O melhor teve um delta de 6%, a média foi 18%, o pior foi 132%
Comparado com todos os dispositivos testados
» 29% de todos os dispositivos testados foram melhores, 6% semelhantes, 65% piores
» O melhor teve um delta de 4%, a média foi 23%, o pior foi 134%
Asus Zephyrus GX501VS análise de áudio
(-) | alto-falantes não muito altos (###valor### dB)
Graves 100 - 315Hz
(-) | quase nenhum baixo - em média 18.8% menor que a mediana
(±) | a linearidade dos graves é média (11.3% delta para a frequência anterior)
Médios 400 - 2.000 Hz
(+) | médios equilibrados - apenas 1.2% longe da mediana
(+) | médios são lineares (6.3% delta para frequência anterior)
Altos 2 - 16 kHz
(±) | máximos mais altos - em média 6.5% maior que a mediana
(+) | os máximos são lineares (6.3% delta da frequência anterior)
Geral 100 - 16.000 Hz
(±) | a linearidade do som geral é média (23.4% diferença em relação à mediana)
Comparado com a mesma classe
» 85% de todos os dispositivos testados nesta classe foram melhores, 5% semelhantes, 11% piores
» O melhor teve um delta de 6%, a média foi 18%, o pior foi 132%
Comparado com todos os dispositivos testados
» 70% de todos os dispositivos testados foram melhores, 6% semelhantes, 24% piores
» O melhor teve um delta de 4%, a média foi 23%, o pior foi 134%
| desligado | |
| Ocioso | |
| Carga |
|
Key:
min: | |
| Gigabyte Aero 15X i7-7700HQ, GeForce GTX 1070 Max-Q | MSI GS63VR 7RF-228US i7-7700HQ, GeForce GTX 1060 Mobile | HP Omen 15-ce002ng i7-7700HQ, GeForce GTX 1060 Max-Q | Gigabyte Aero 15 i7-7700HQ, GeForce GTX 1060 Mobile | Asus Zephyrus GX501VS i7-7700HQ, GeForce GTX 1070 Max-Q | MSI GE63VR 7RF Raider i7-7700HQ, GeForce GTX 1070 Mobile | Aorus X5 v7 i7-7820HK, GeForce GTX 1070 Mobile | Gigabyte P56XT i7-7700HQ, GeForce GTX 1070 Mobile | |
|---|---|---|---|---|---|---|---|---|
| Power Consumption | -18% | -32% | -5% | -28% | -24% | -81% | -22% | |
| Idle Minimum * (Watt) | 10 | 14.5 -45% | 18 -80% | 12 -20% | 19.1 -91% | 11 -10% | 26 -160% | 13 -30% |
| Idle Average * (Watt) | 13 | 17.3 -33% | 23 -77% | 15 -15% | 20.8 -60% | 16 -23% | 31 -138% | 17 -31% |
| Idle Maximum * (Watt) | 20 | 17.4 13% | 30 -50% | 20 -0% | 21.8 -9% | 21 -5% | 36 -80% | 22 -10% |
| Load Average * (Watt) | 79 | 93 -18% | 85 -8% | 82 -4% | 73.7 7% | 92 -16% | 93 -18% | 85 -8% |
| Witcher 3 ultra * (Watt) | 120 | 128.8 -7% | 96 20% | 111 7% | 130.2 -9% | 185 -54% | 176 -47% | 154 -28% |
| Load Maximum * (Watt) | 165 | 158 4% | 161 2% | 173.1 -5% | 224 -36% | 240 -45% | 208 -26% |
* ... menor é melhor
| Gigabyte Aero 15X i7-7700HQ, GeForce GTX 1070 Max-Q, 94.2 Wh | Acer Aspire VN7-593G-73HP V15 Nitro BE i7-7700HQ, GeForce GTX 1060 Mobile, 69 Wh | MSI GS63VR 7RF-228US i7-7700HQ, GeForce GTX 1060 Mobile, 65 Wh | Razer Blade (2017) i7-7700HQ, GeForce GTX 1060 Mobile, 70 Wh | HP Omen 15-ce002ng i7-7700HQ, GeForce GTX 1060 Max-Q, 70 Wh | Gigabyte Aero 15 i7-7700HQ, GeForce GTX 1060 Mobile, 94.24 Wh | Asus Zephyrus GX501VS i7-7700HQ, GeForce GTX 1070 Max-Q, 50 Wh | |
|---|---|---|---|---|---|---|---|
| Duração da bateria | -23% | -51% | 11% | -57% | -15% | -70% | |
| Reader / Idle (h) | 13 | 8.4 -35% | 6.4 -51% | 4.3 -67% | 10.6 -18% | 3.8 -71% | |
| H.264 (h) | 7.6 | 3.7 -51% | 7.7 1% | ||||
| WiFi v1.3 (h) | 8.2 | 6 -27% | 3.9 -52% | 9.1 11% | 3.3 -60% | 7 -15% | 2.5 -70% |
| Load (h) | 2.6 | 2.4 -8% | 1.3 -50% | 1.3 -50% | 1.9 -27% | 0.8 -69% |
Pro
Contra
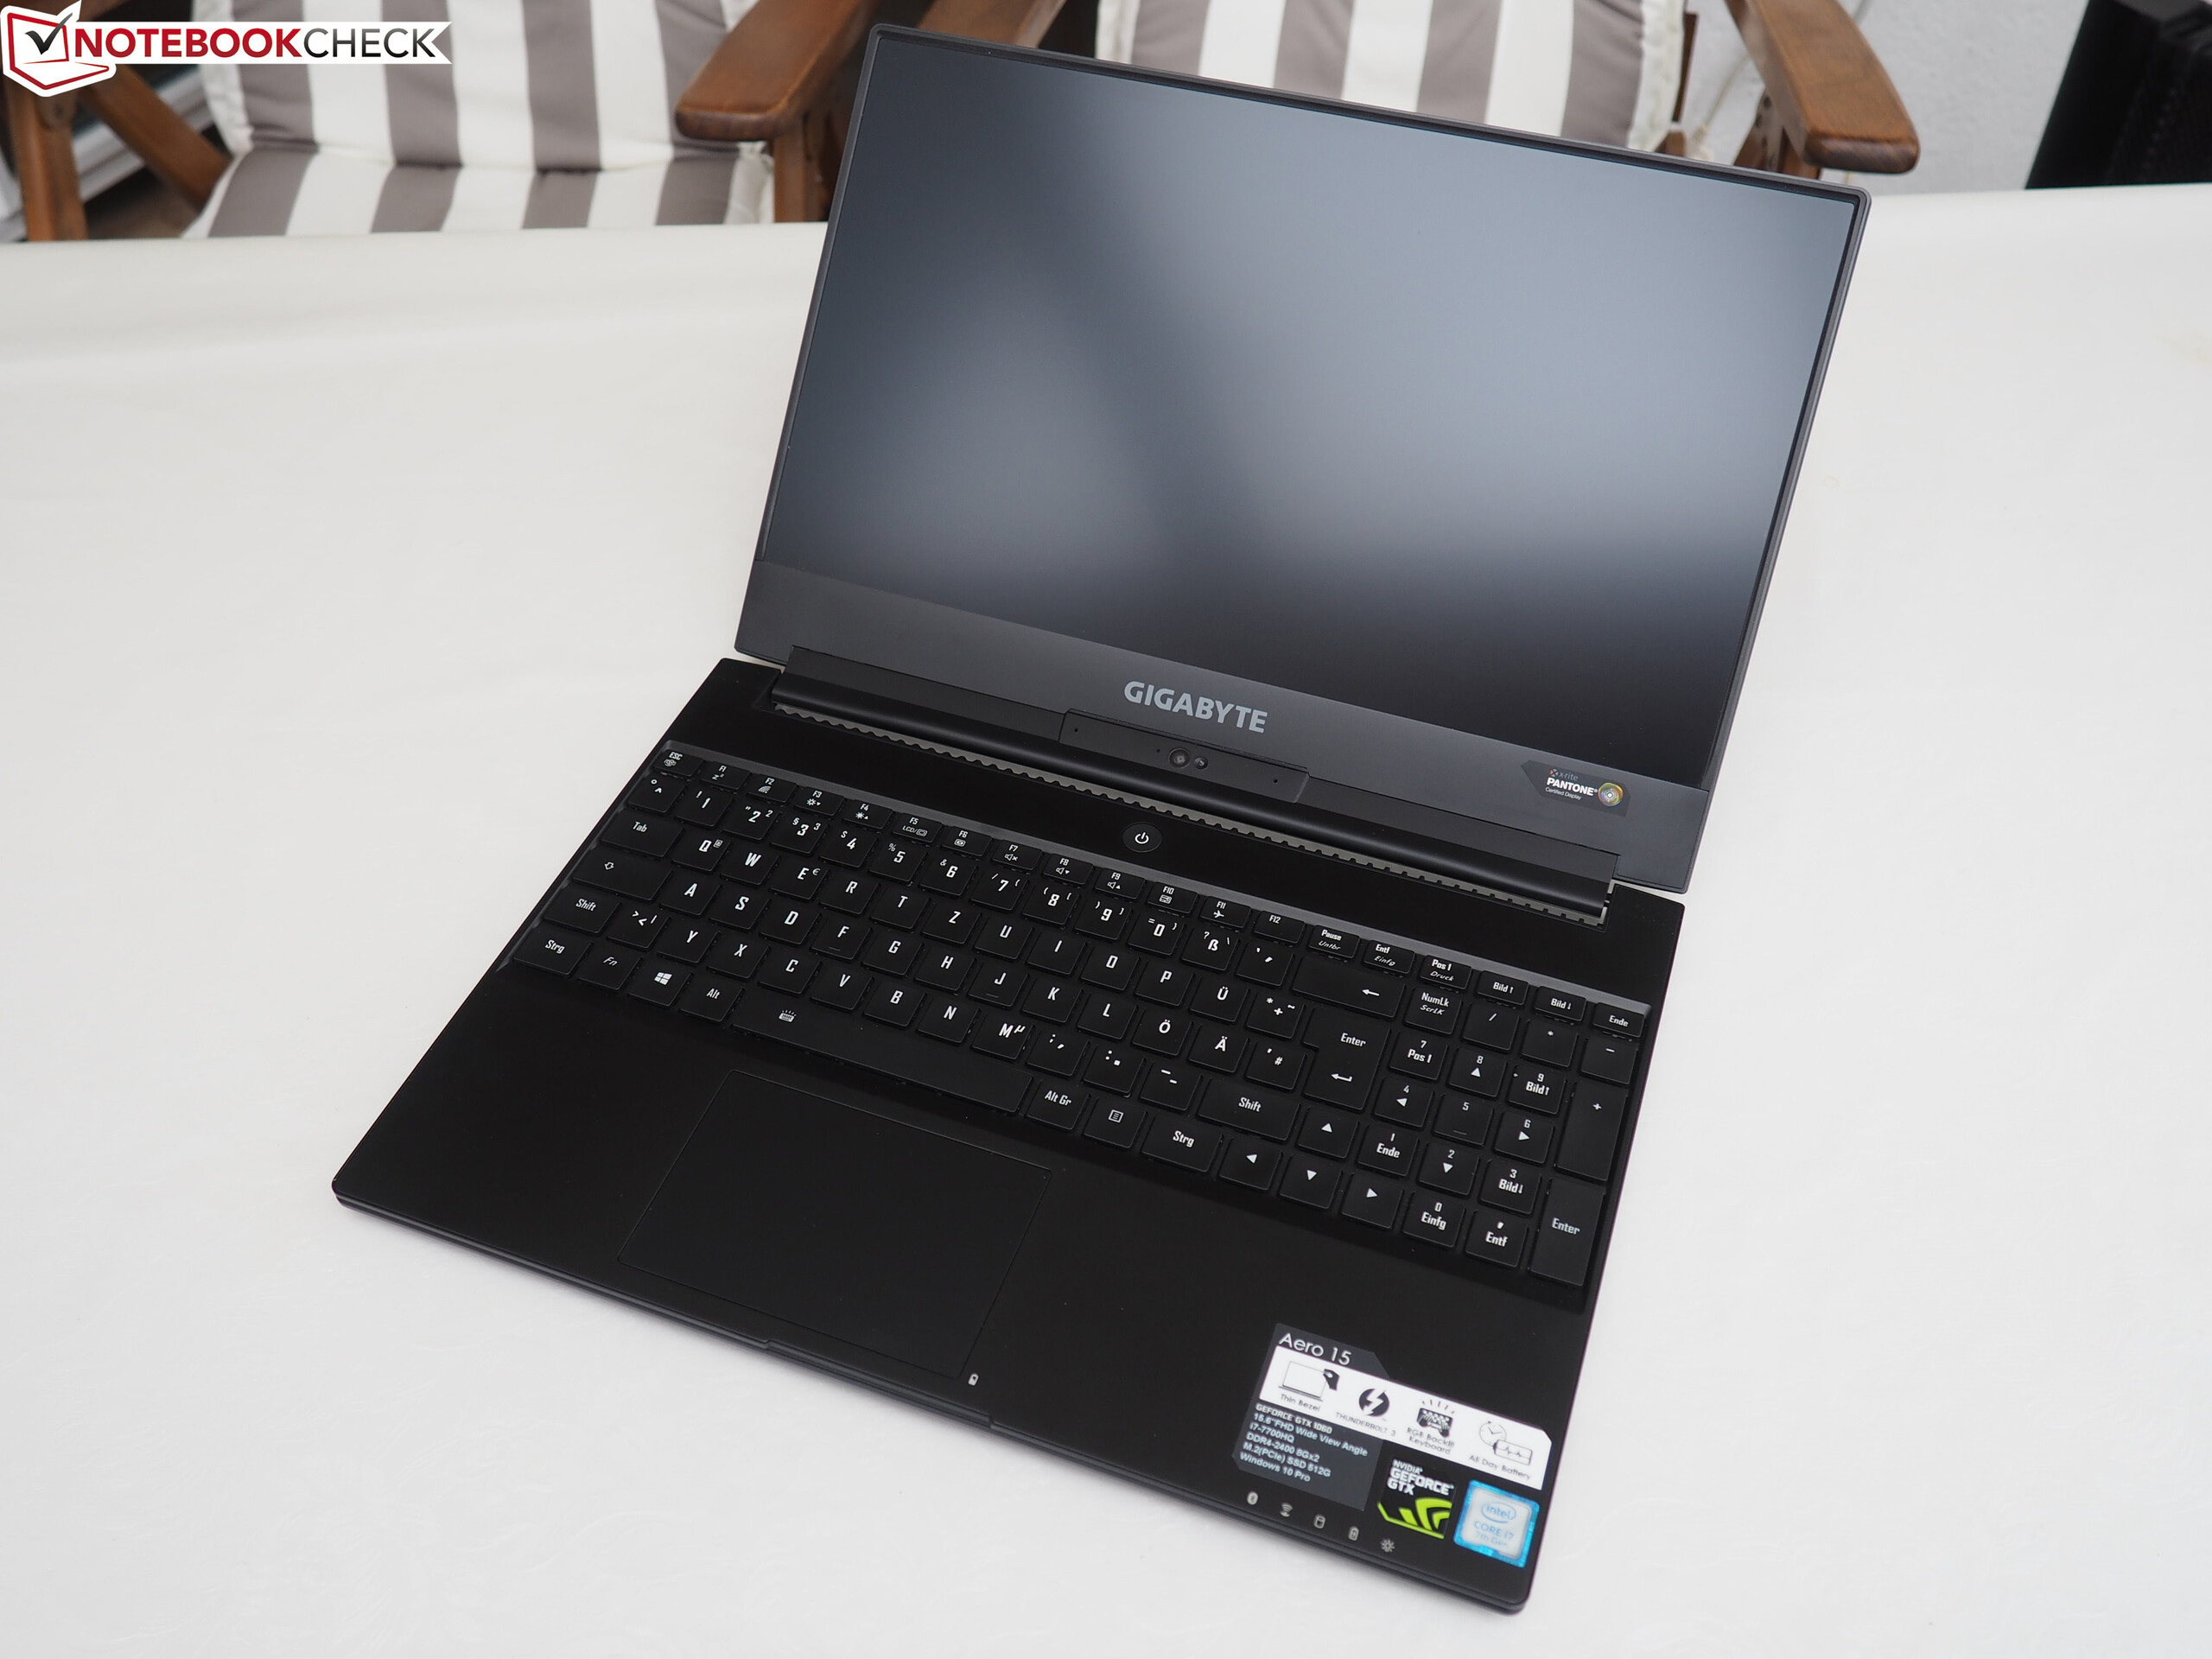
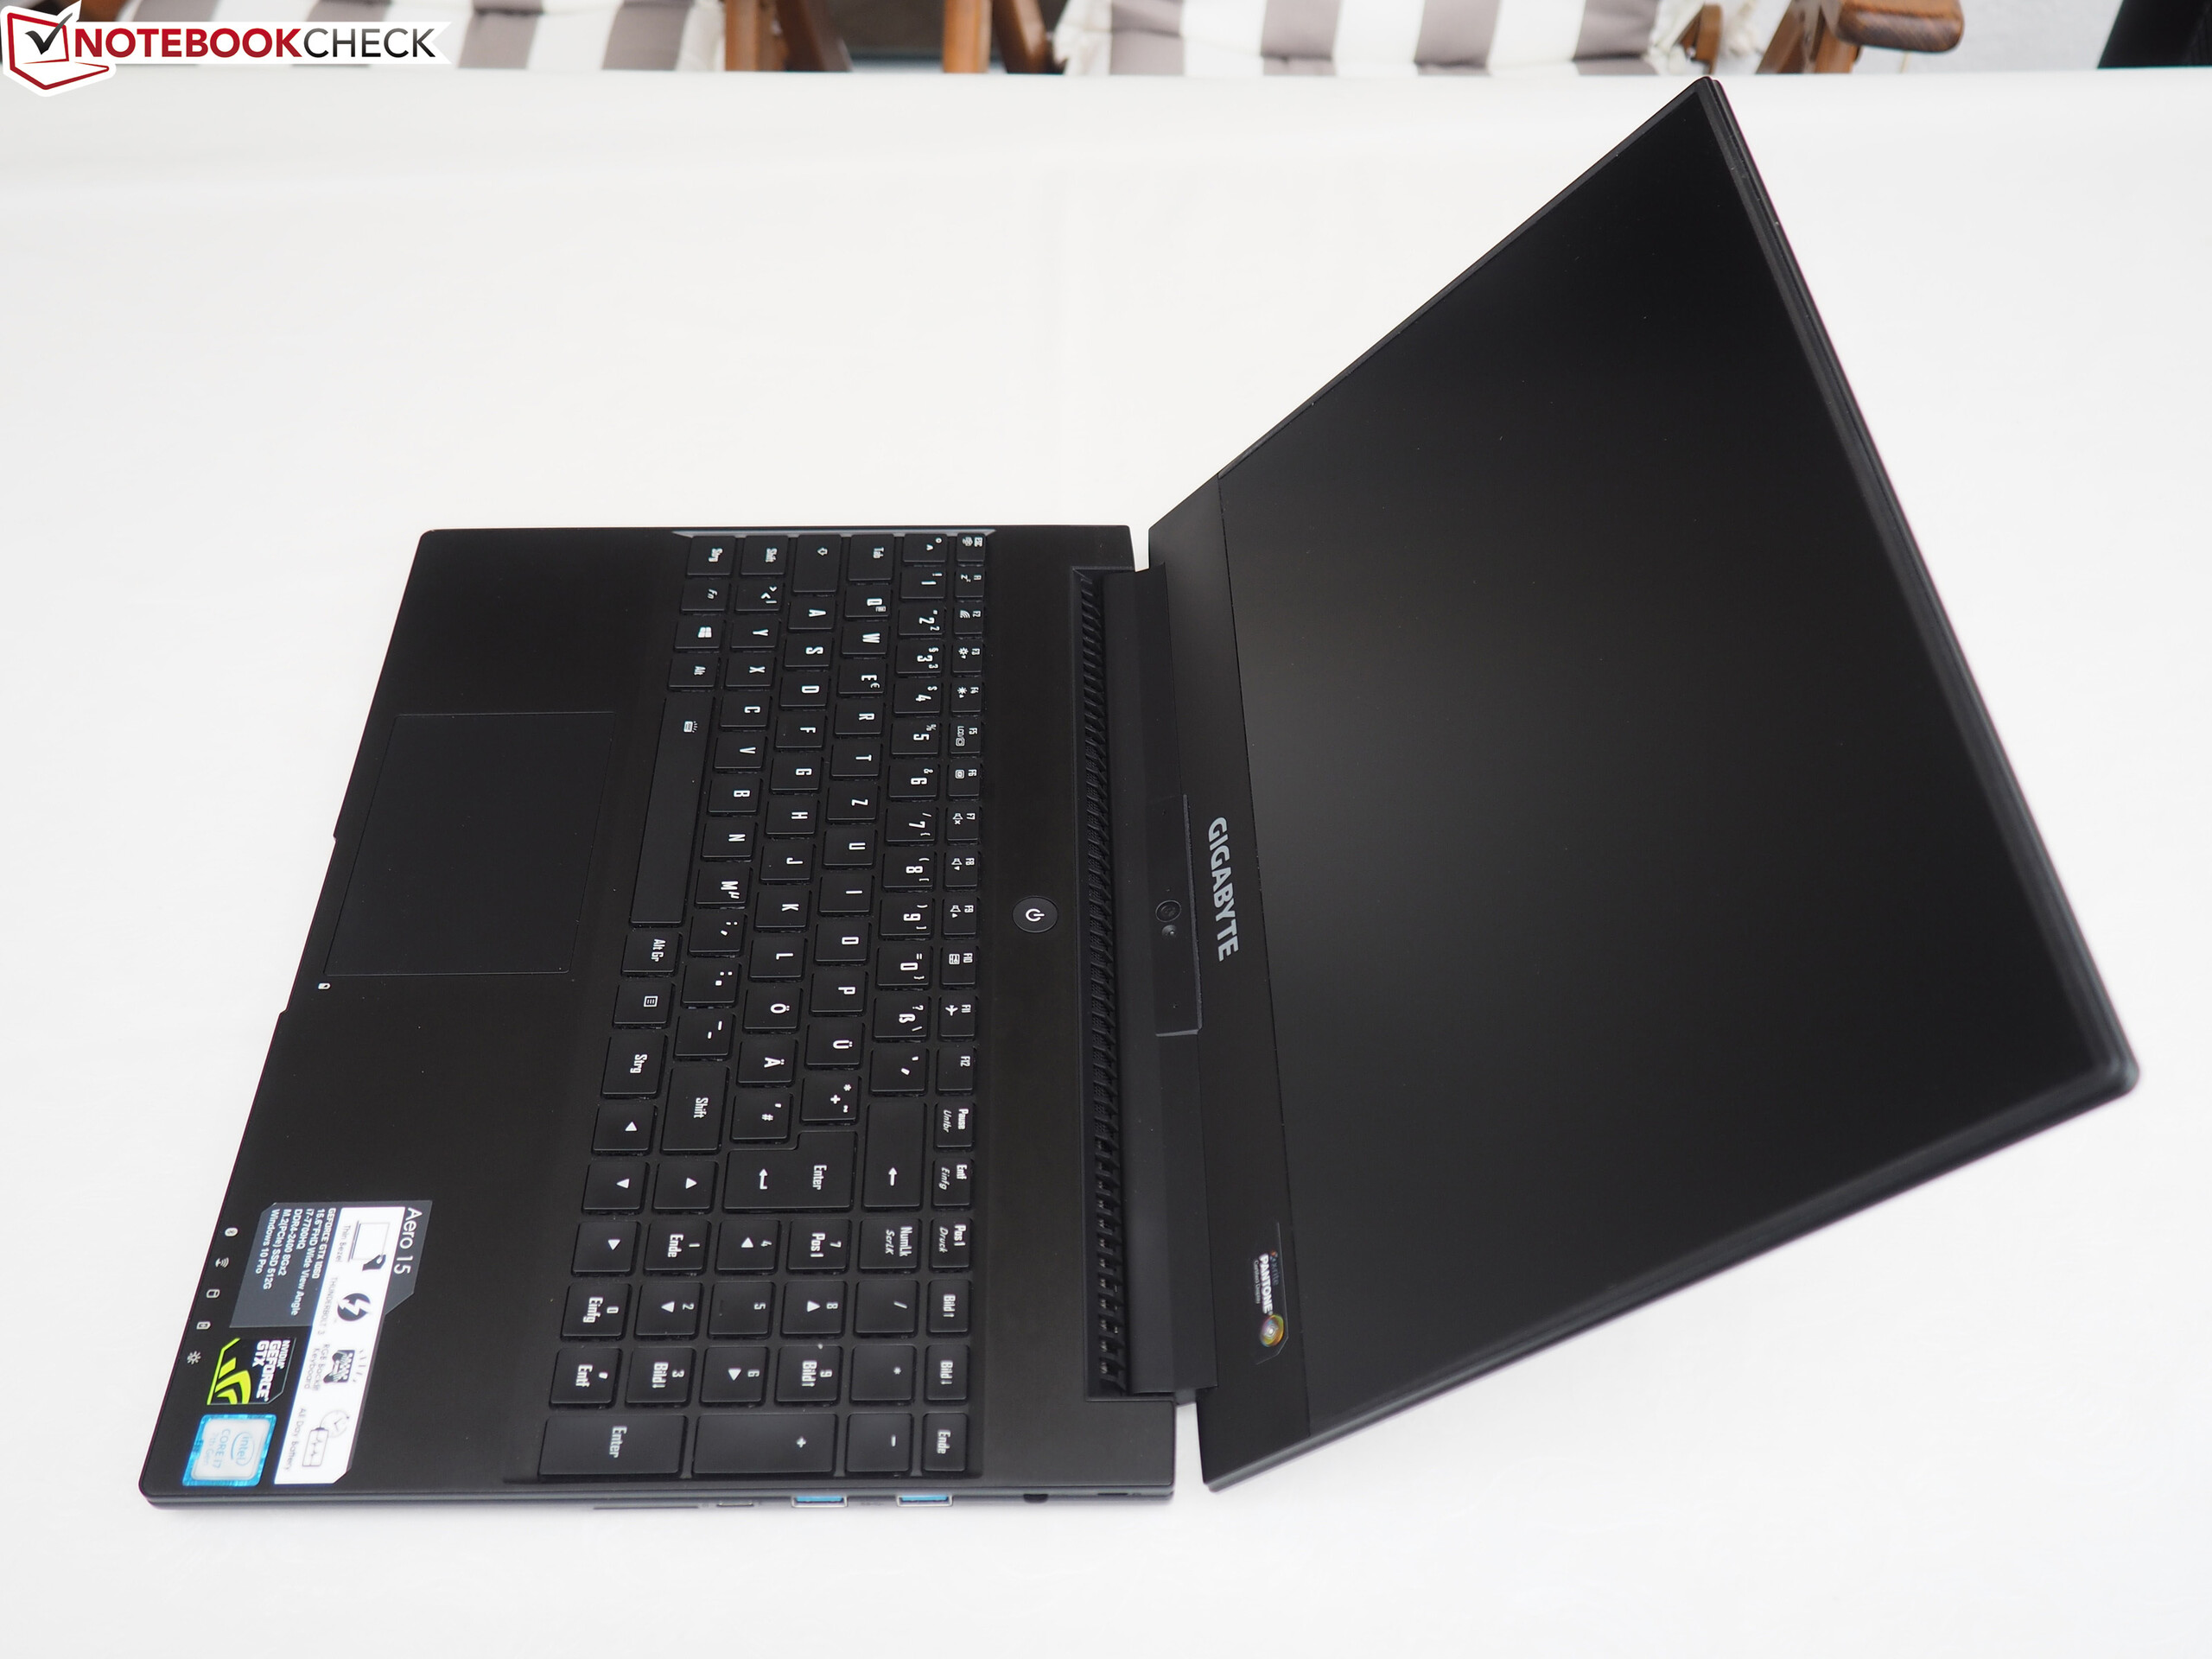
Graças ao seu poderoso hardware, o fino e elegante Aero 15X consegue rodar todos os jogos atuais com facilidade, com detalhes altos ou mesmo máximos na tela FHD mate.
Apesar do hardware poderoso, a duração da bateria é surpreendentemente decente.
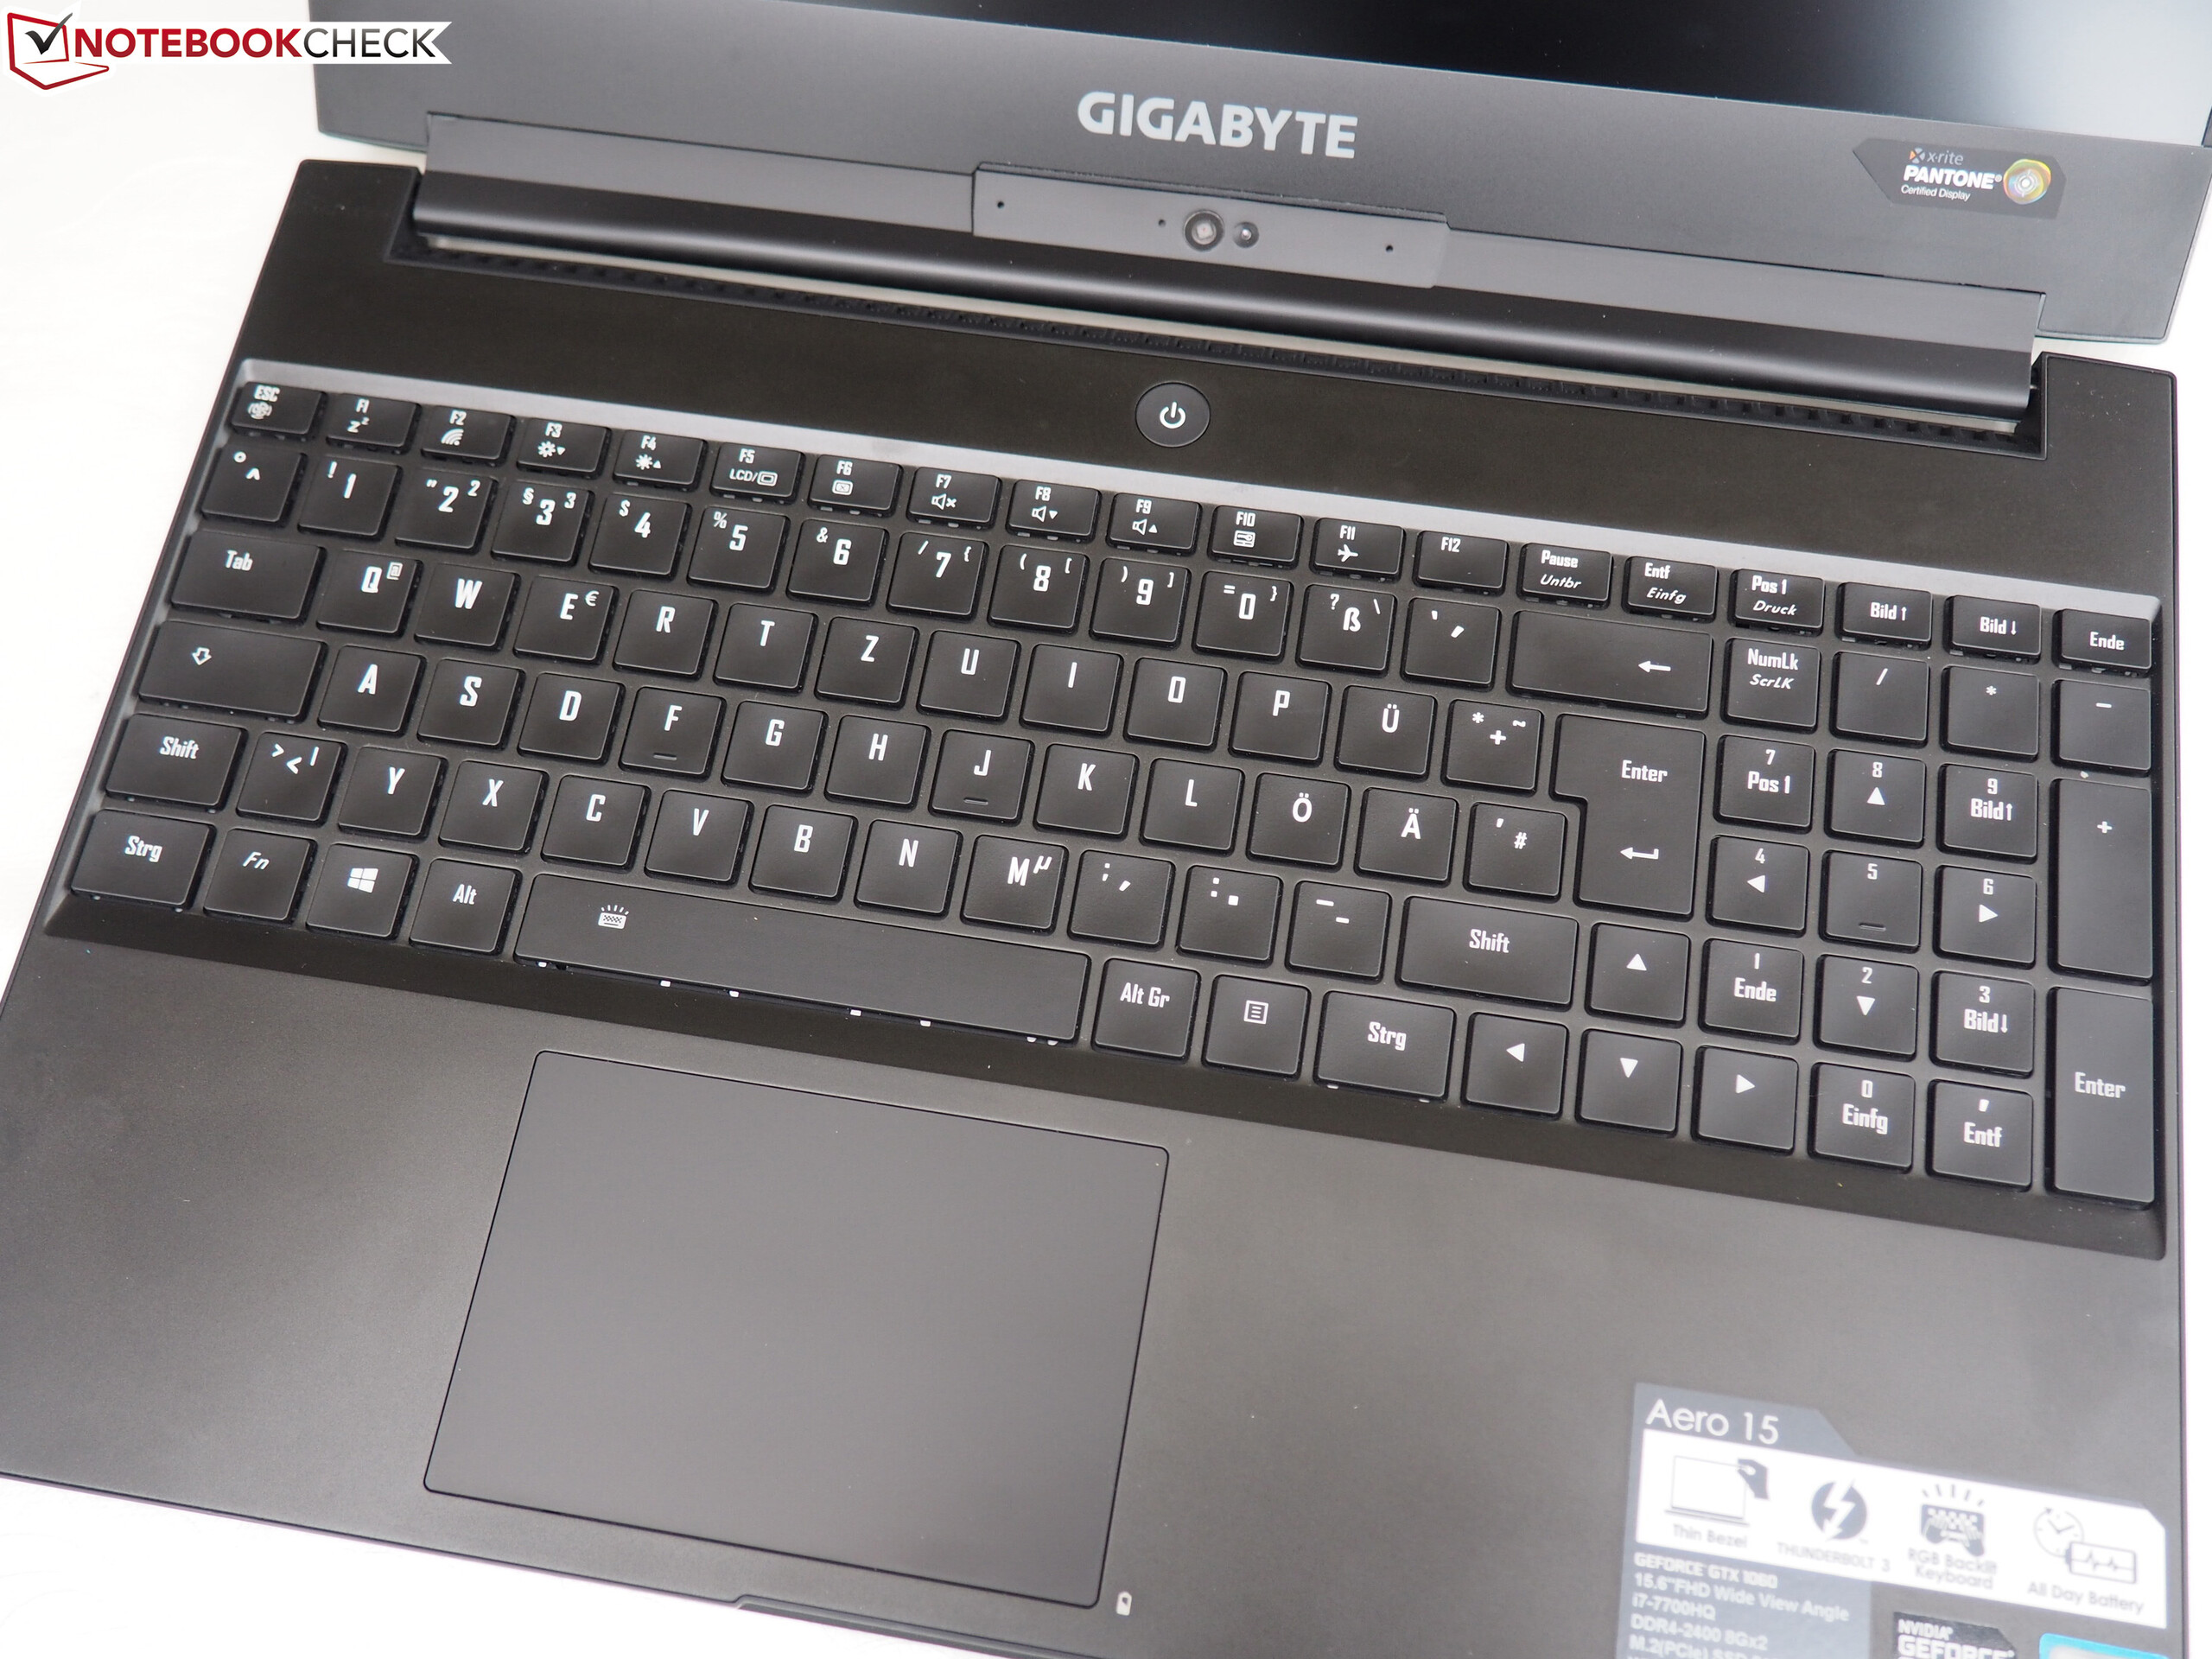
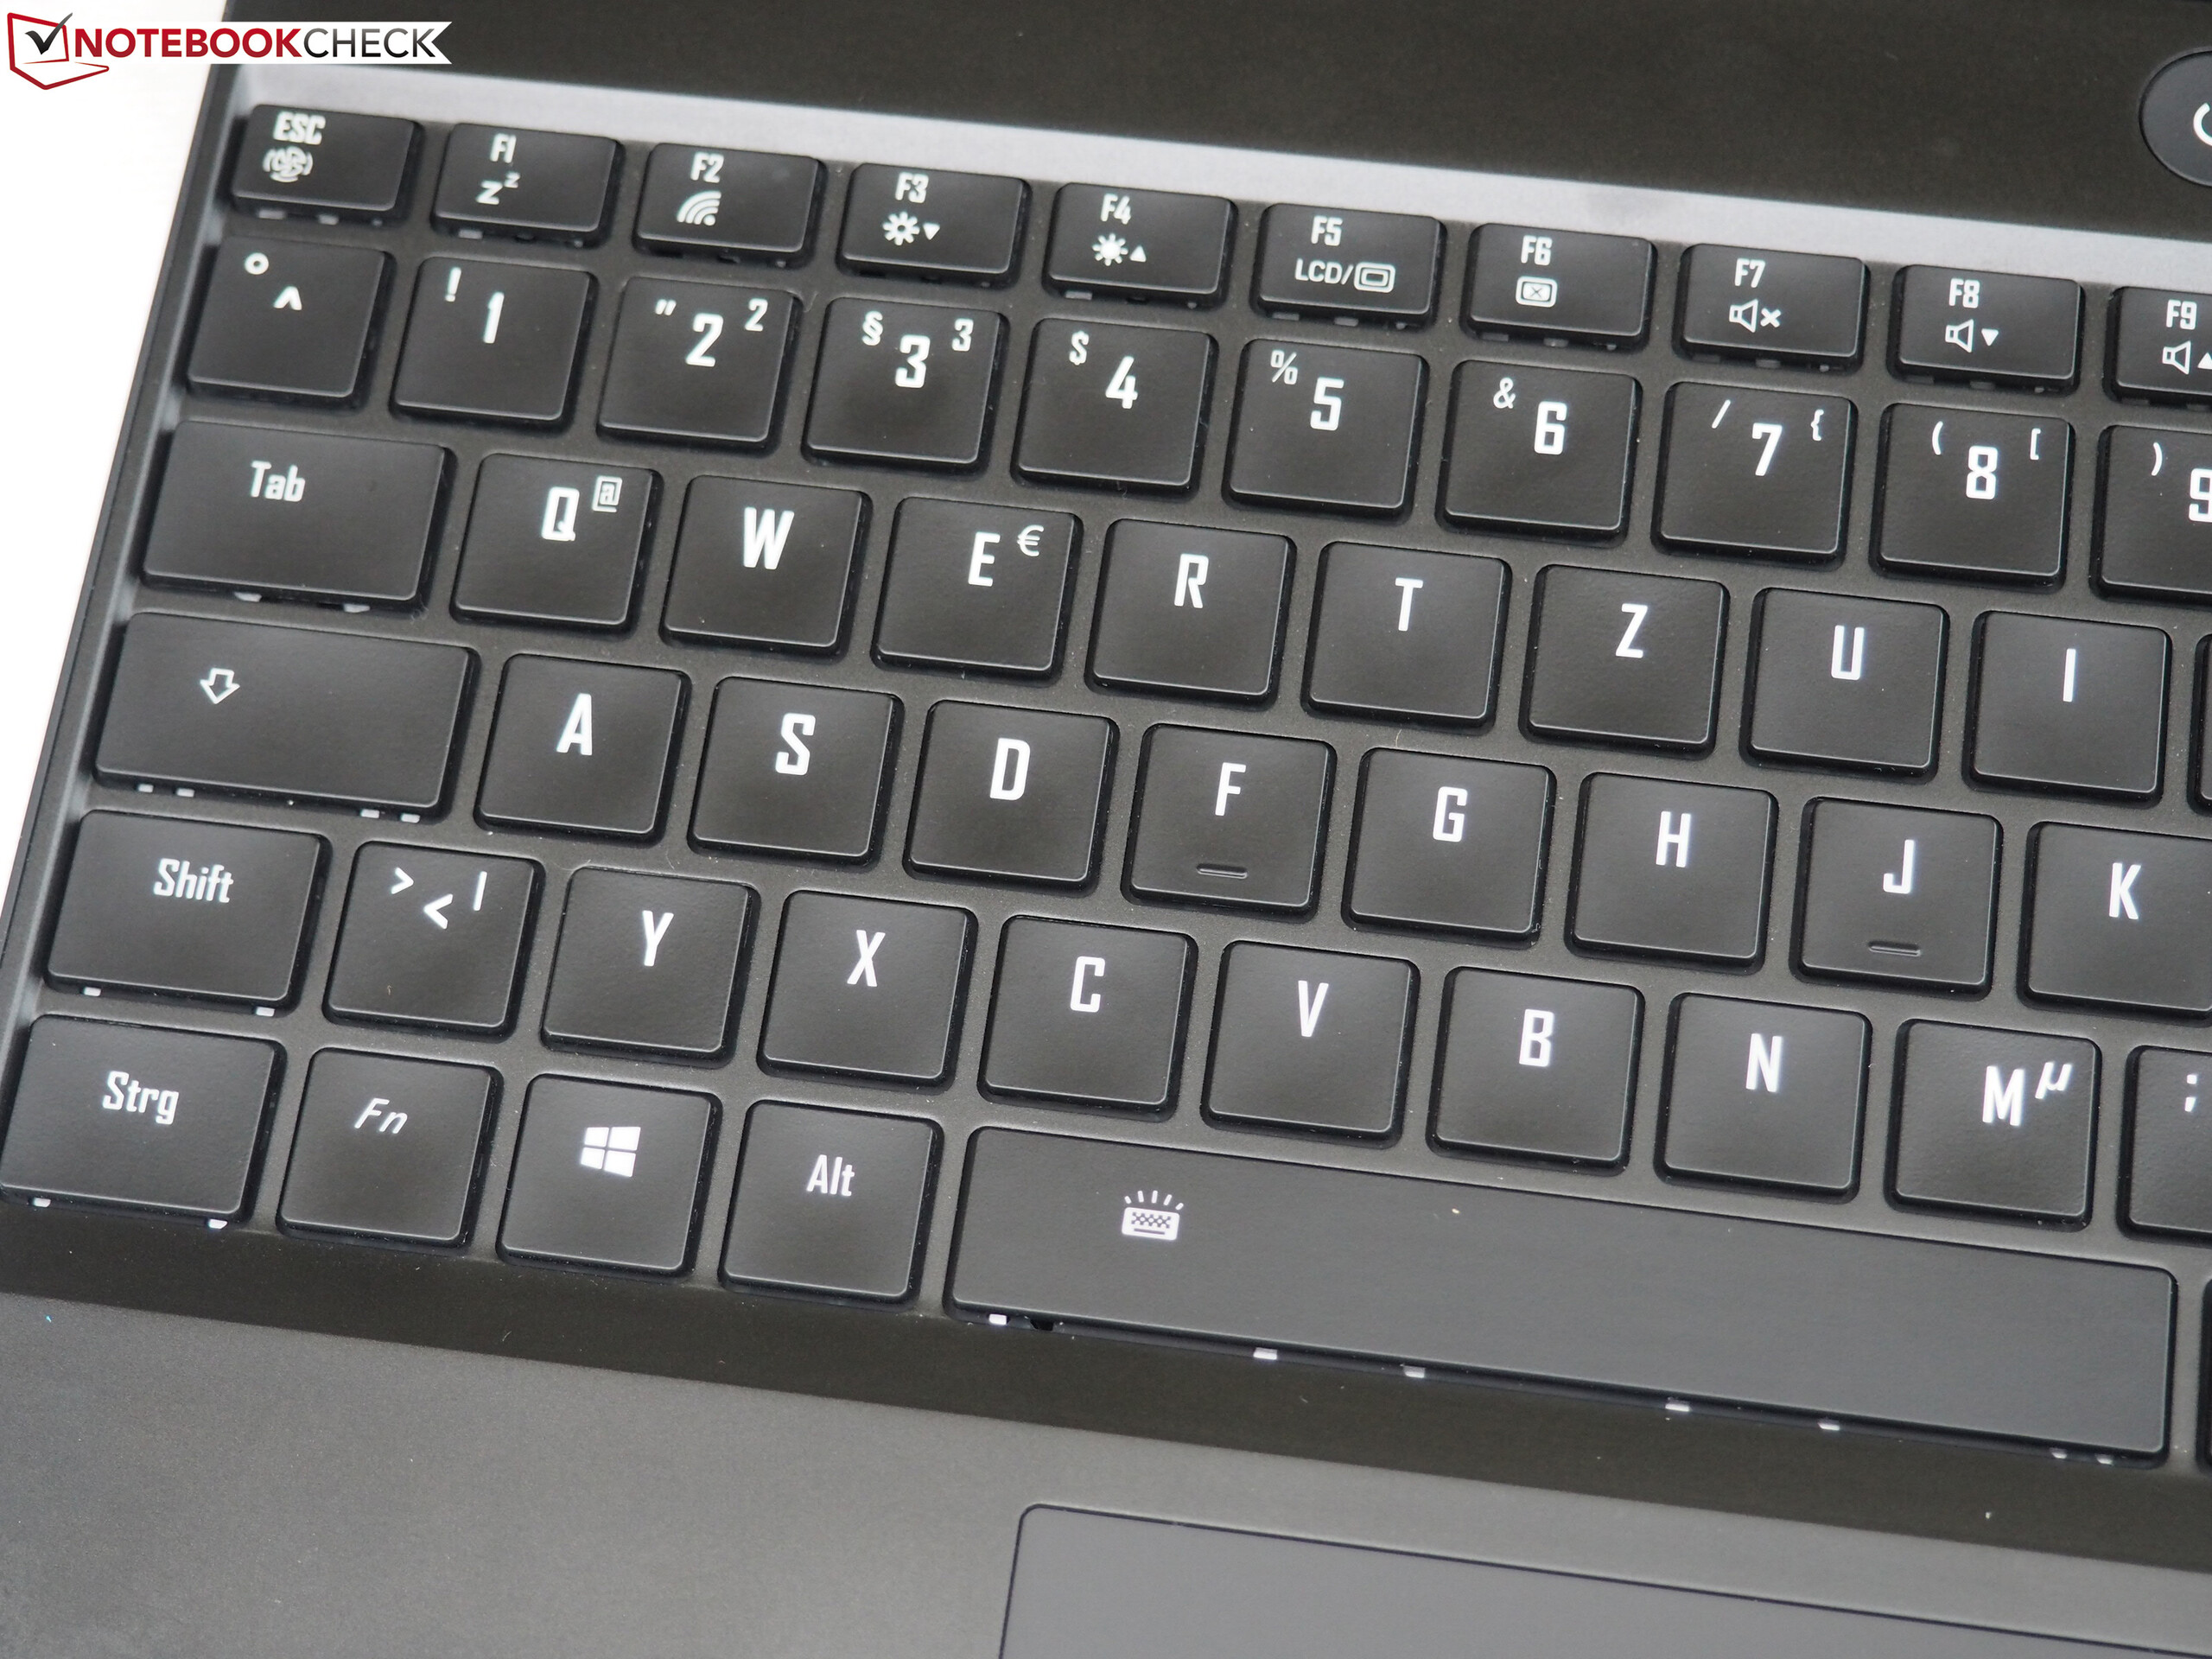
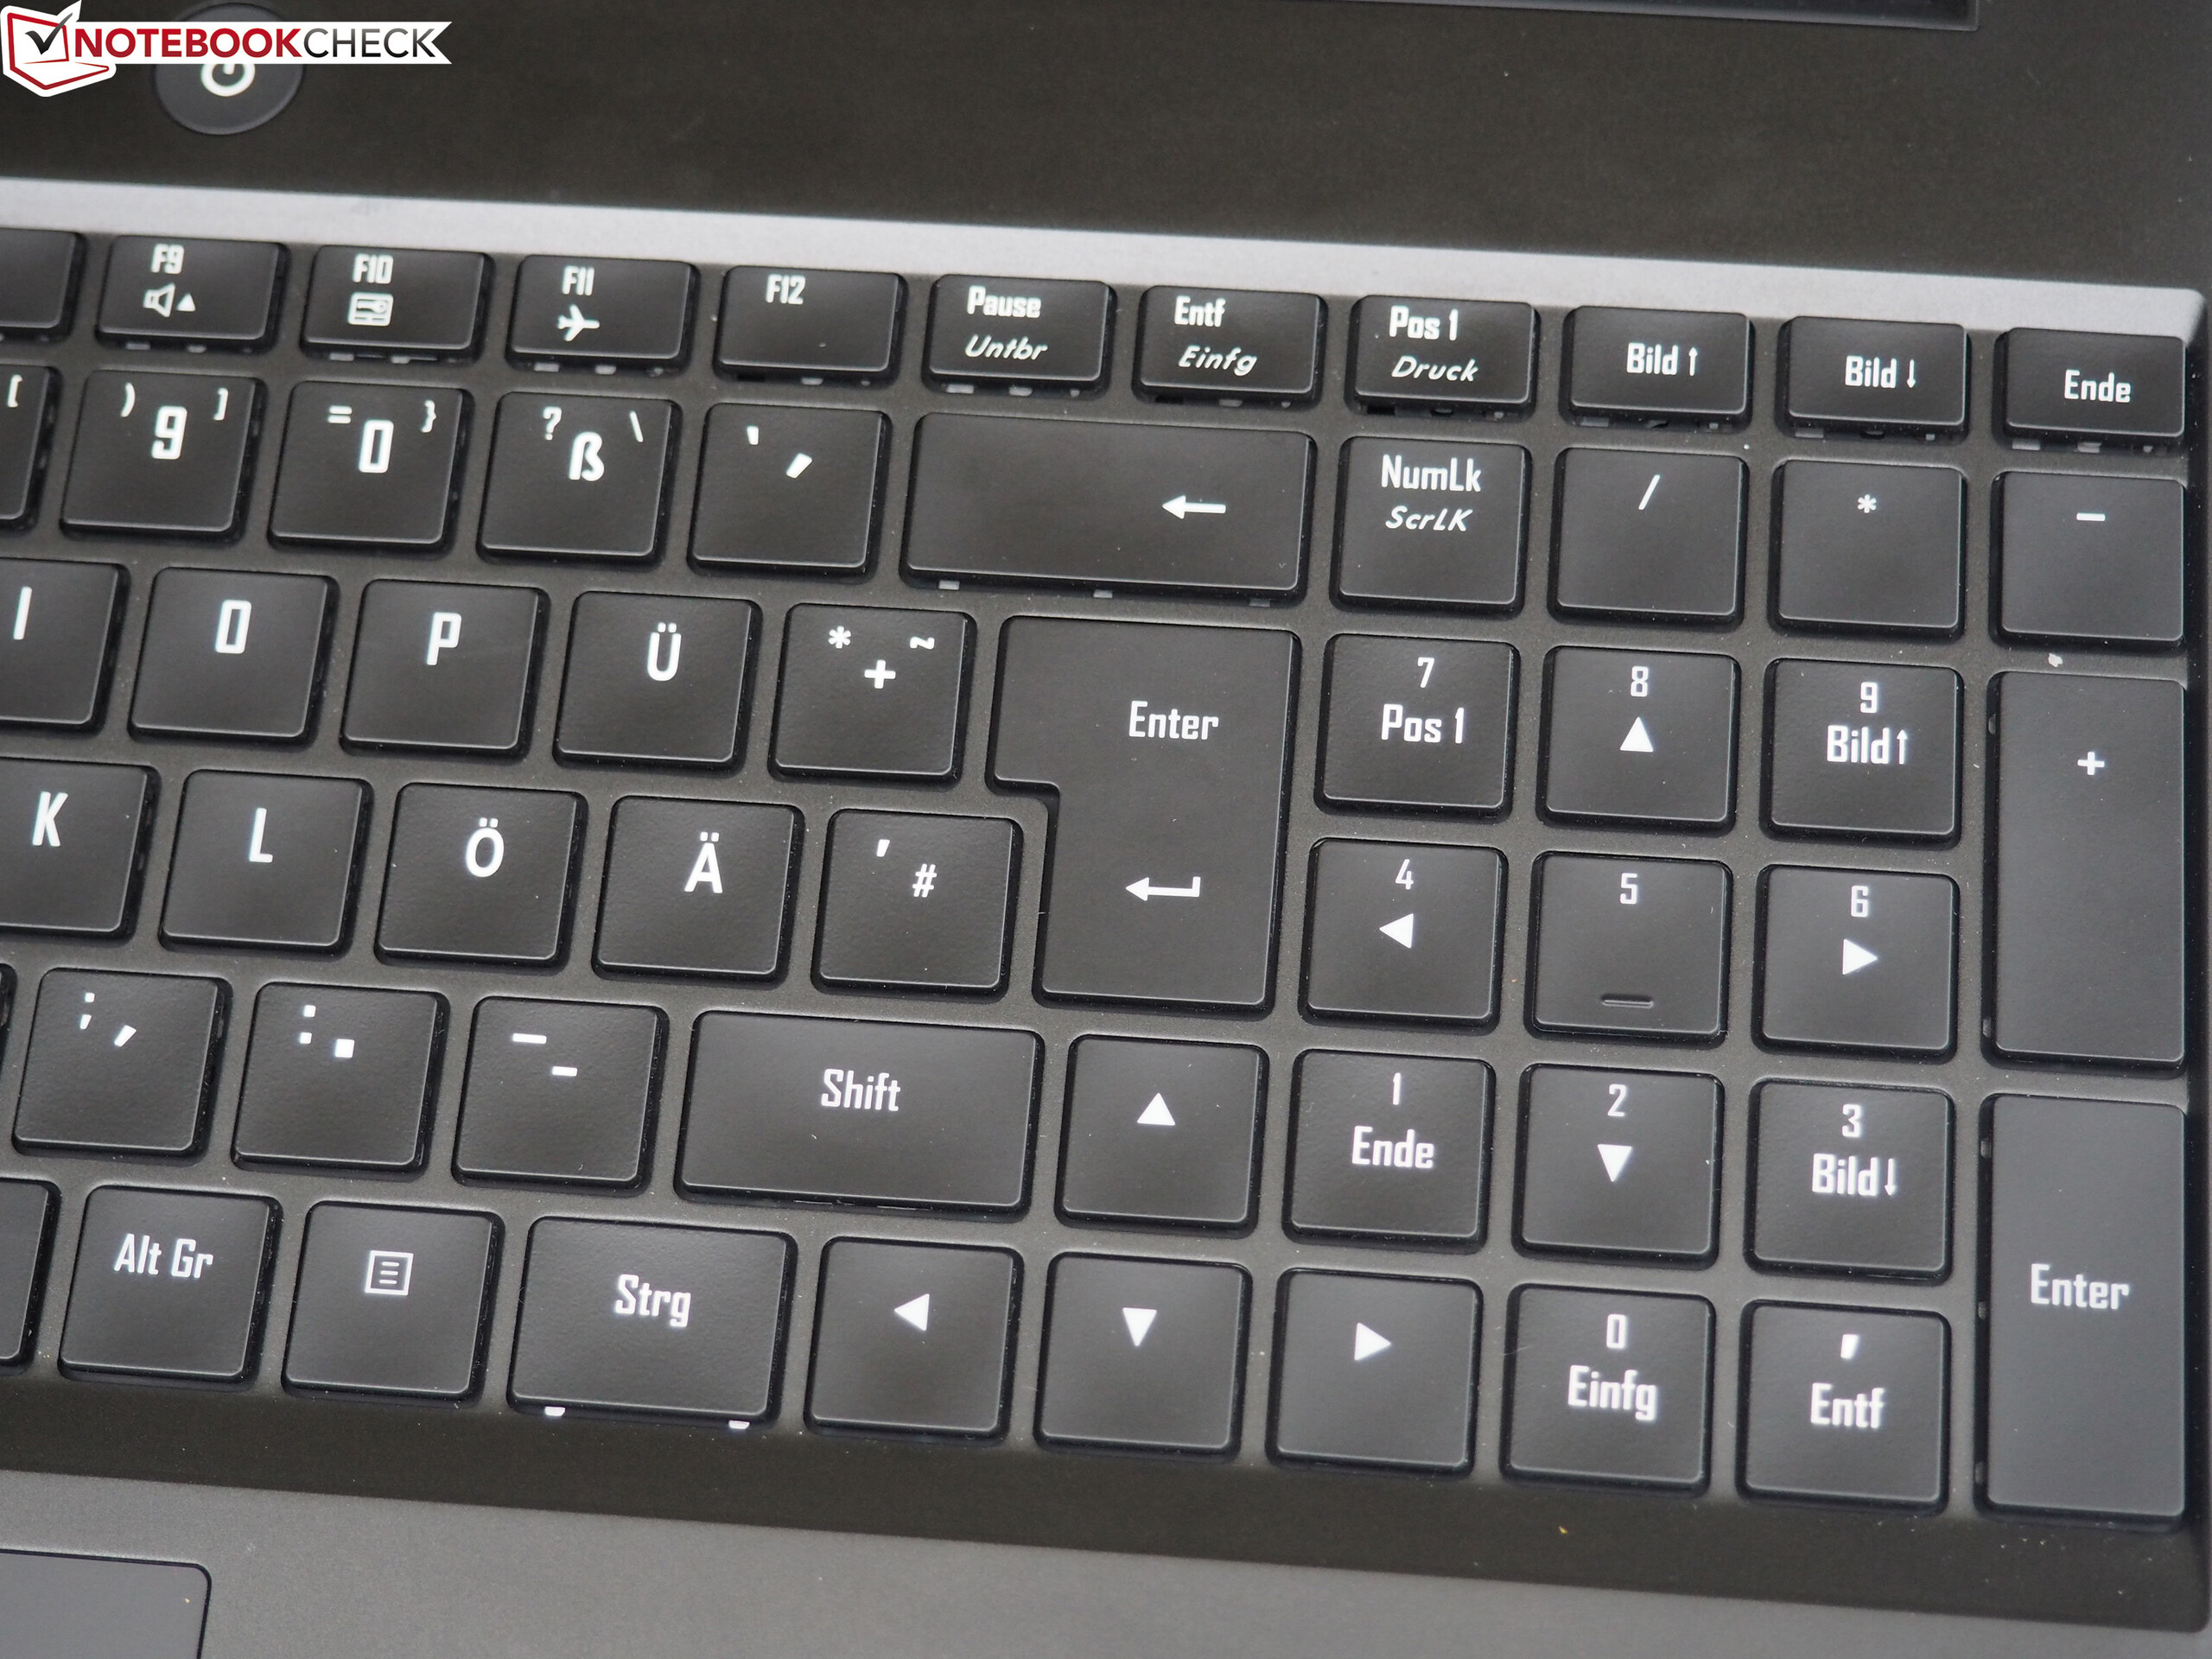
Embora o Aero 15X seja principalmente um portátil de multimídia/jogos, a Gigabyte não esqueceu os cenários de uso diário. Equipado com um teclado decente, o portátil é capaz de funcionar silenciosamente e acabou por ser surpreendentemente portátil graças à sua bateria de alta capacidade que conseguiu manter o aparelho funcionando durante 8:11 horas em nosso teste Wi-Fi realista.
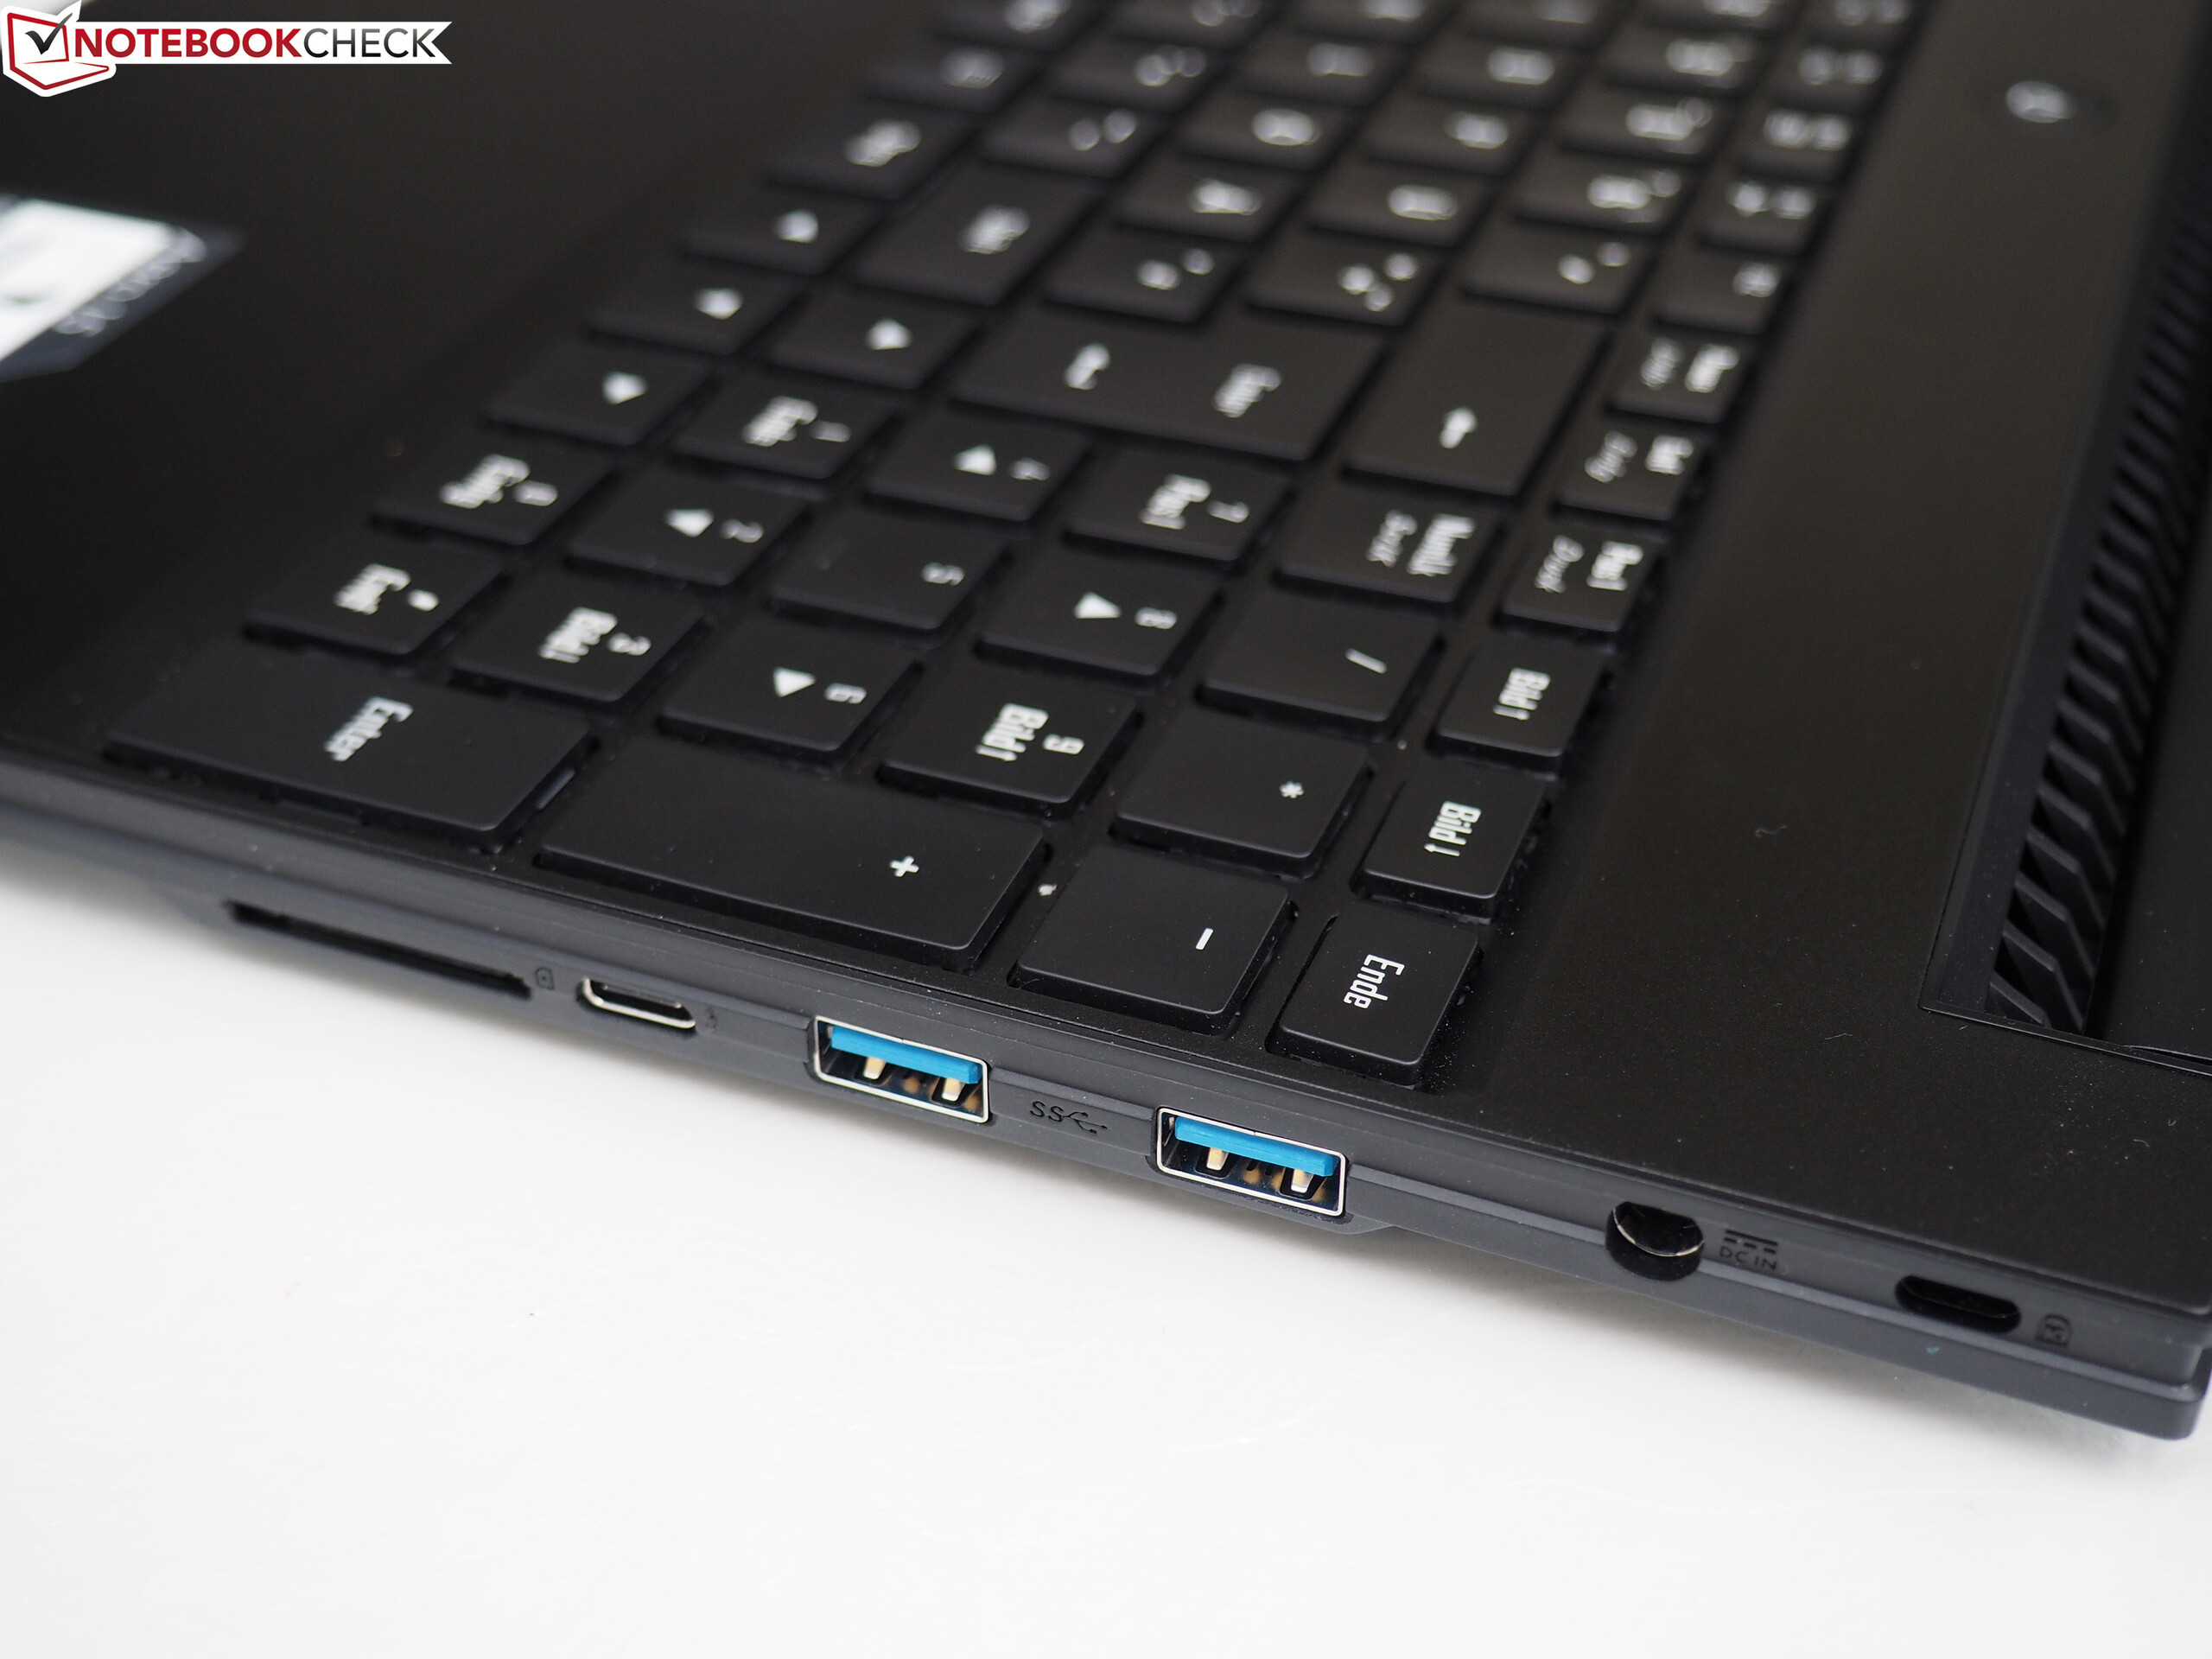
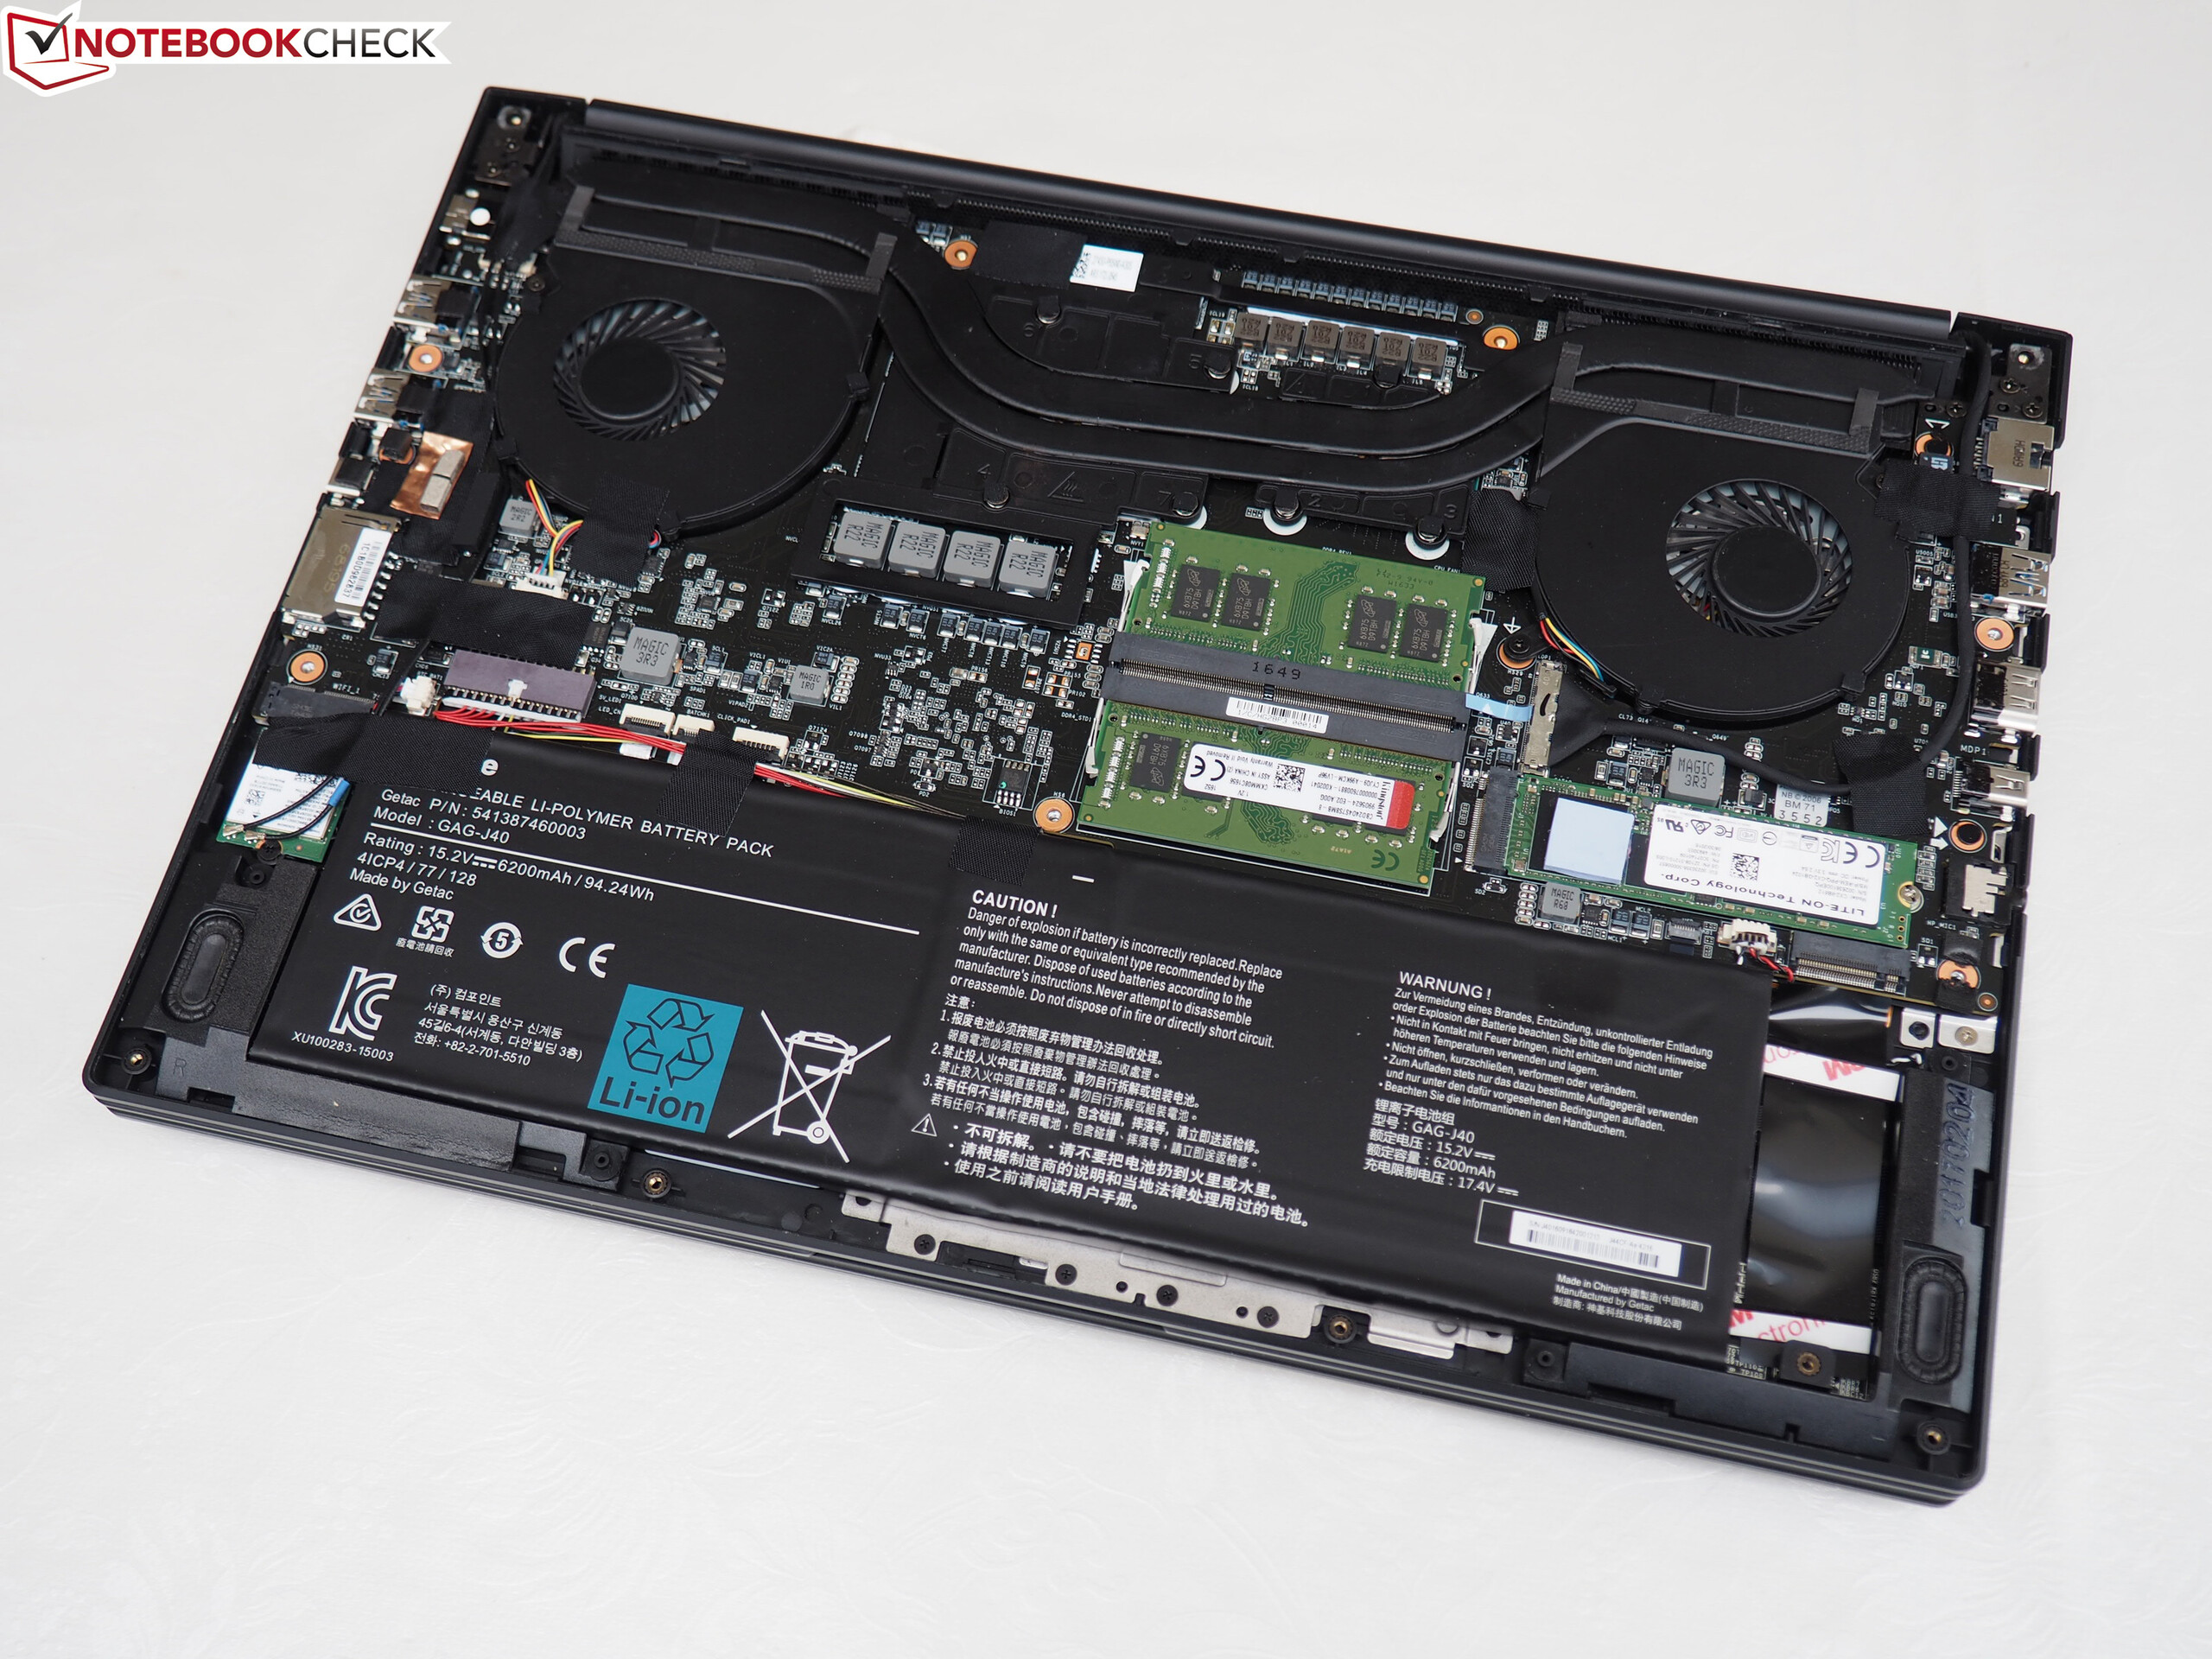
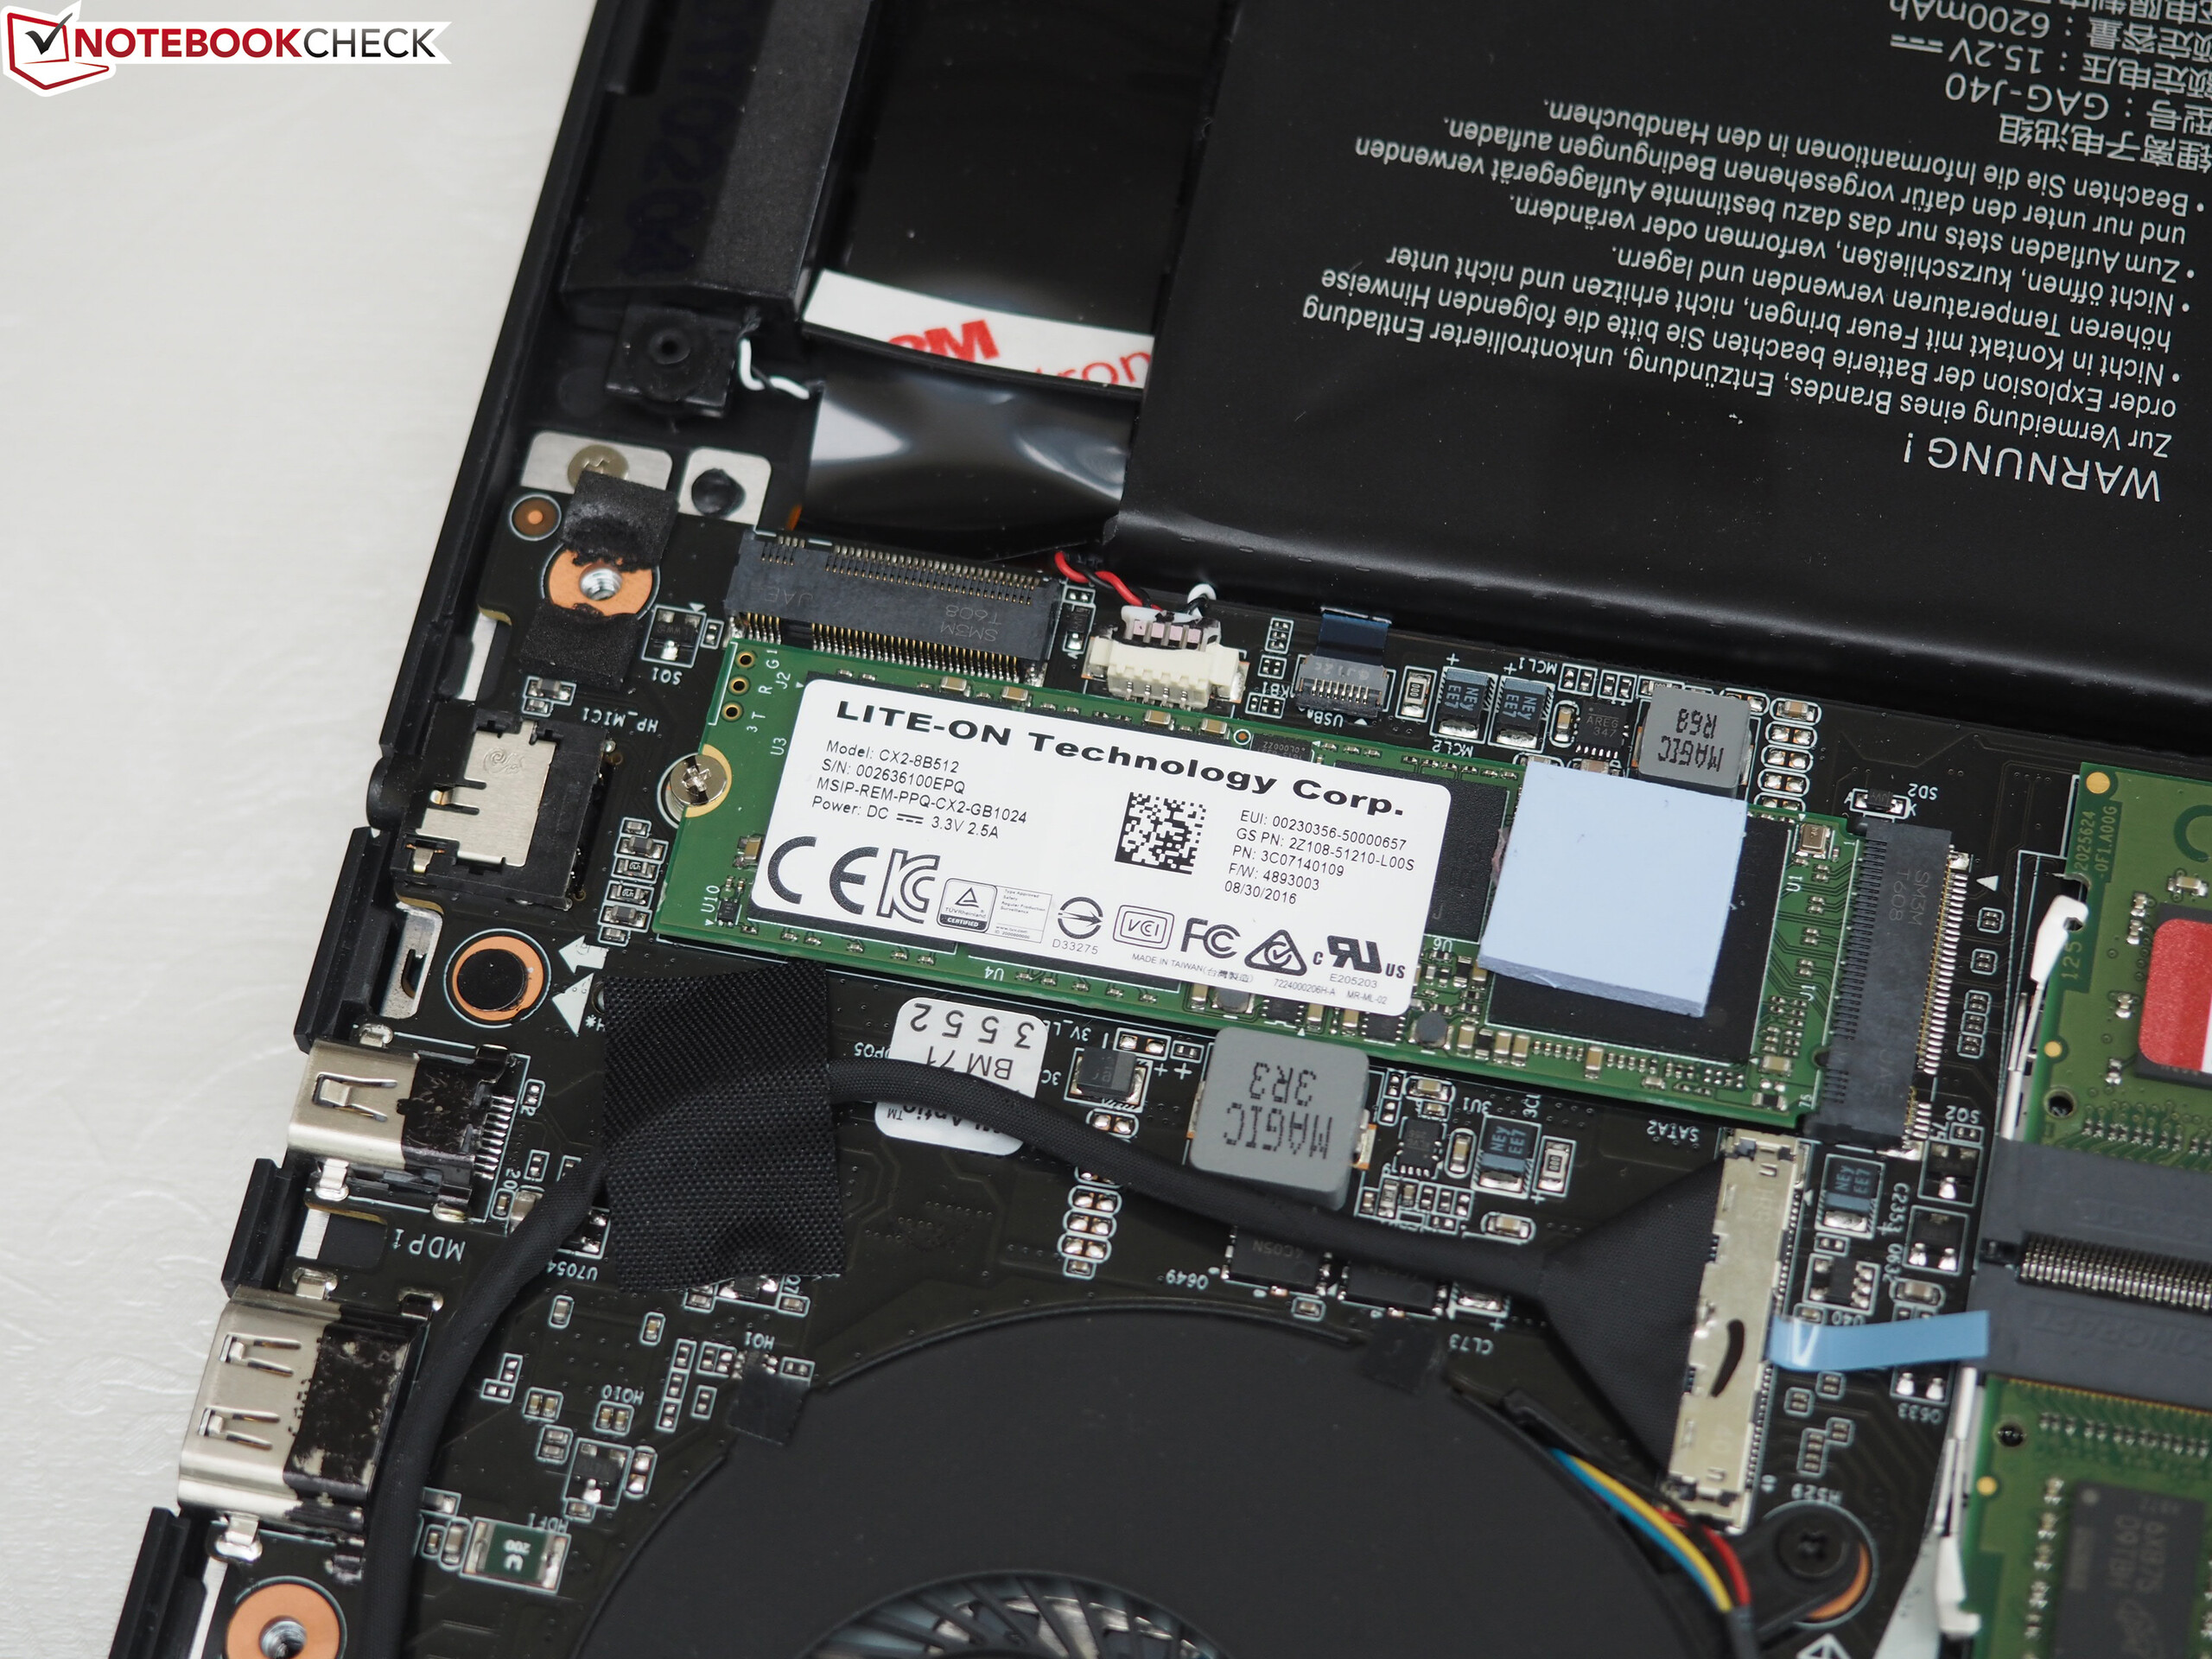
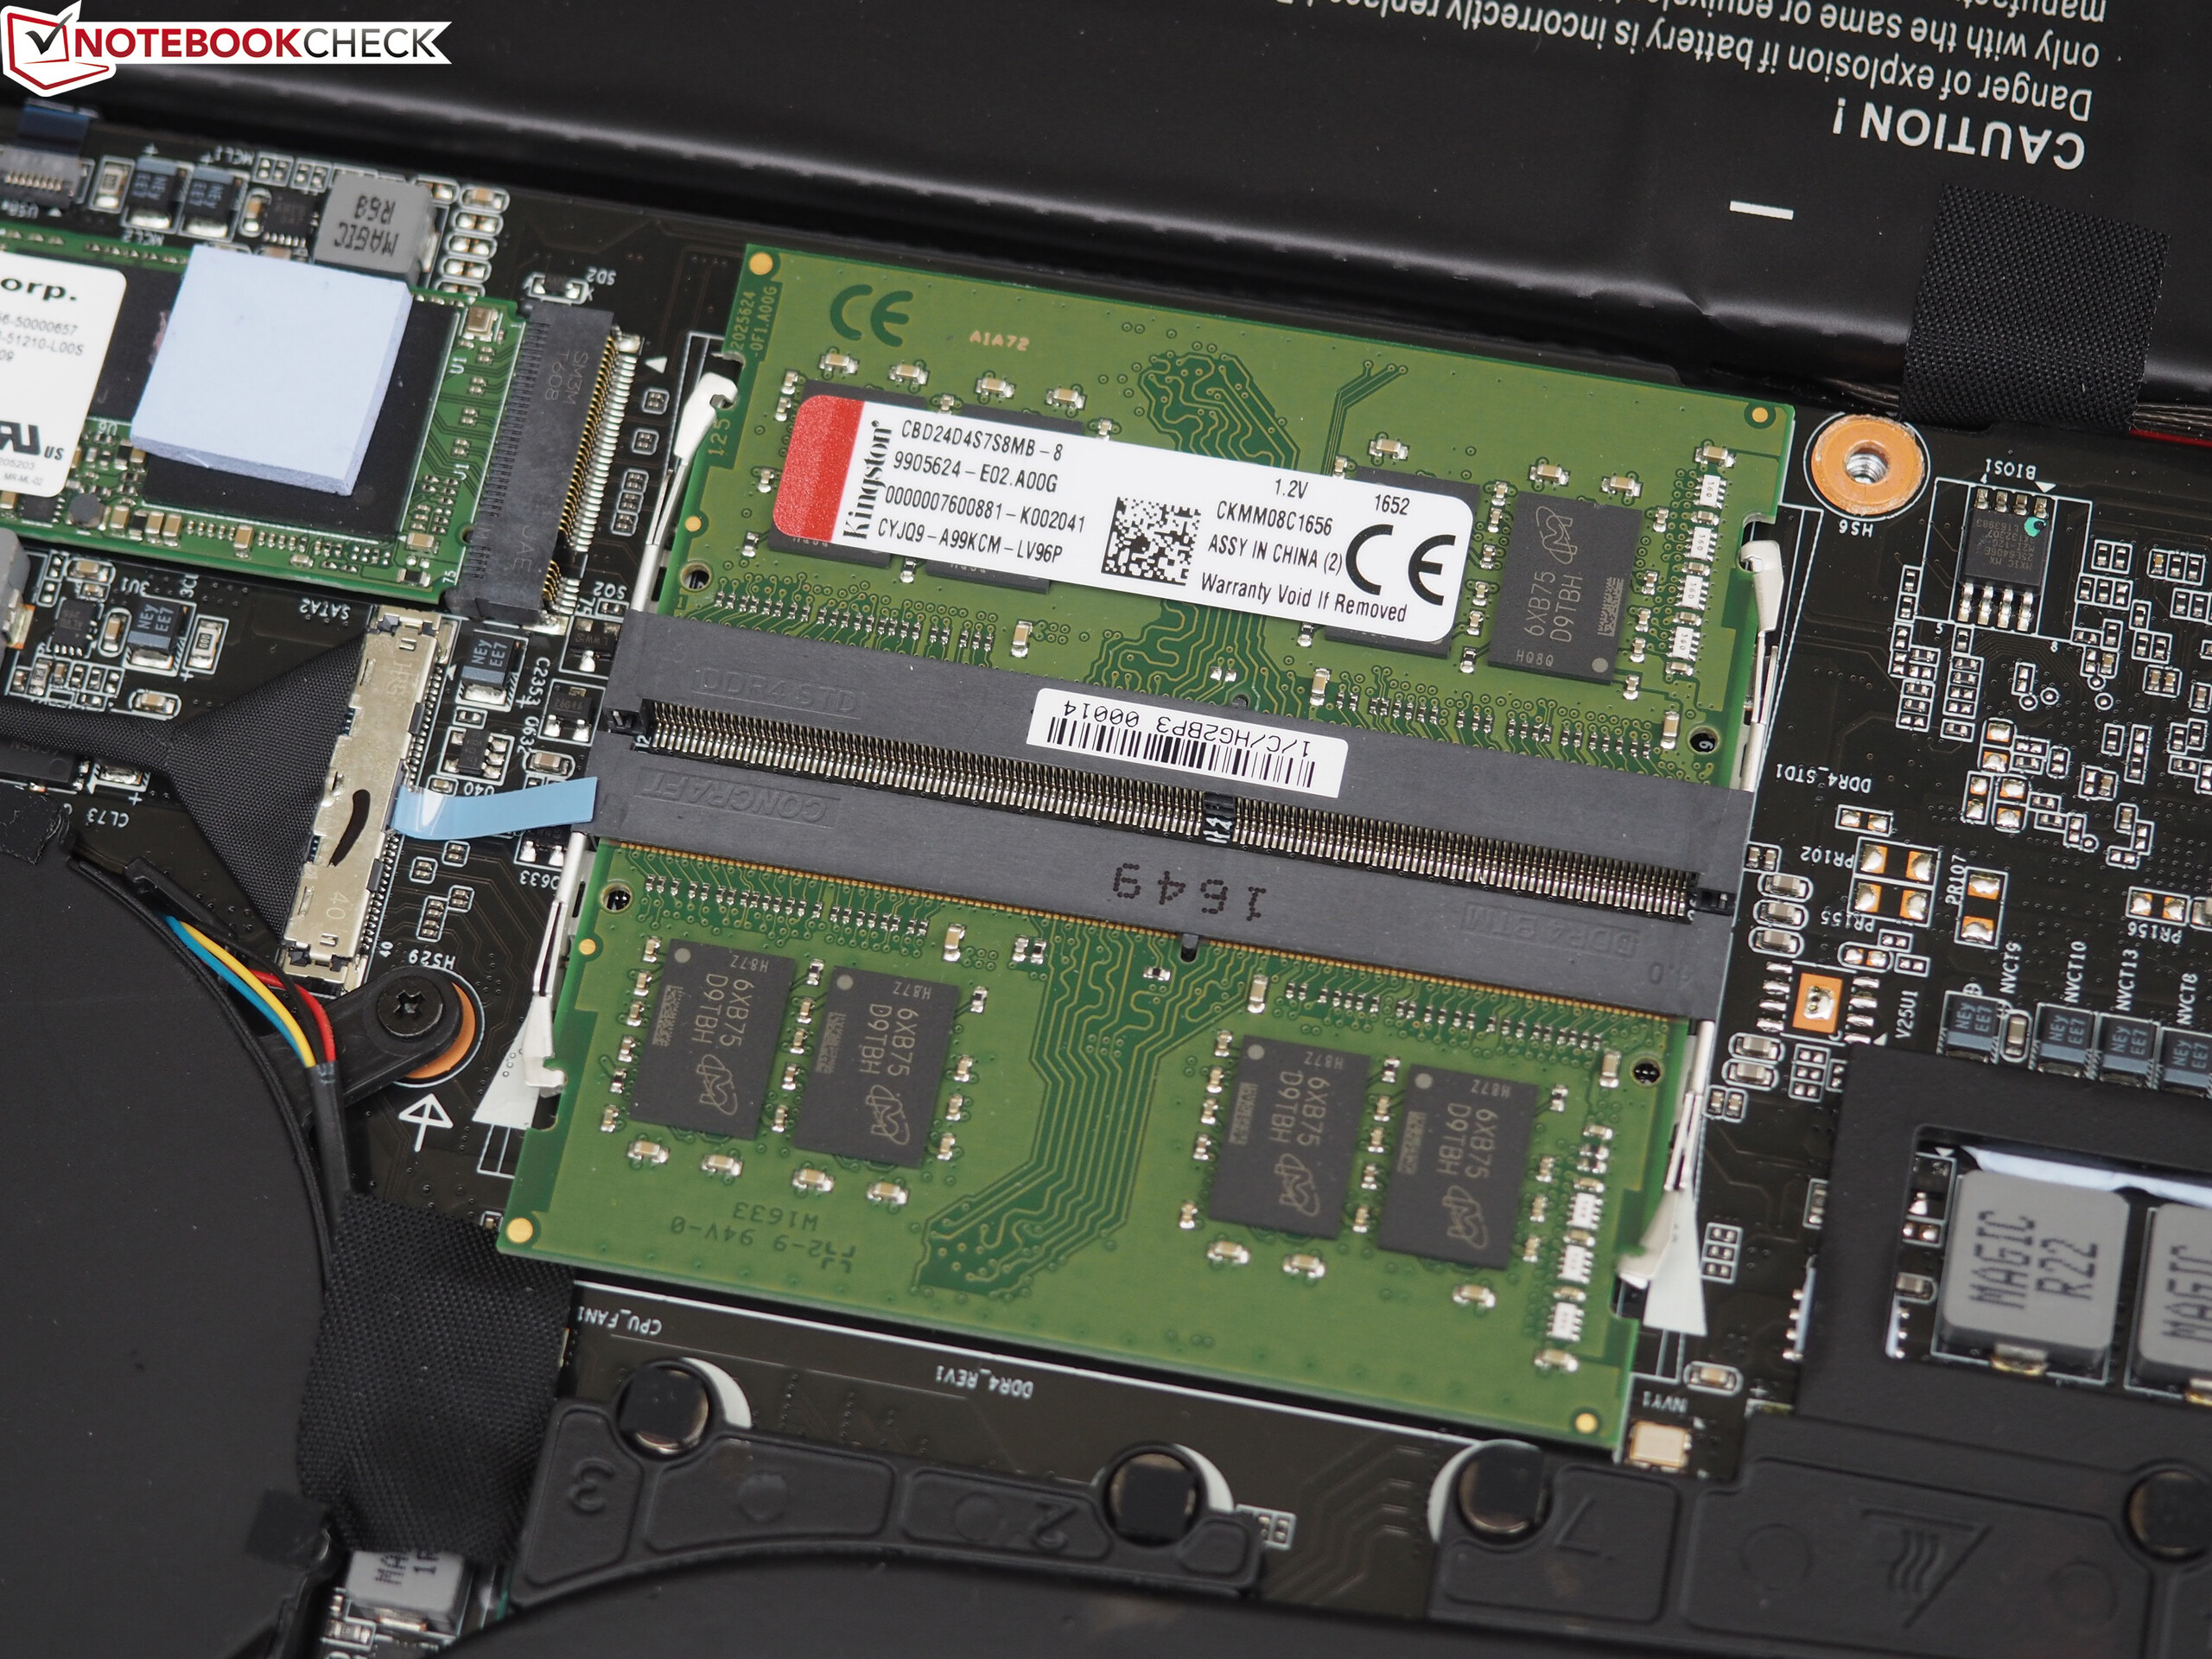
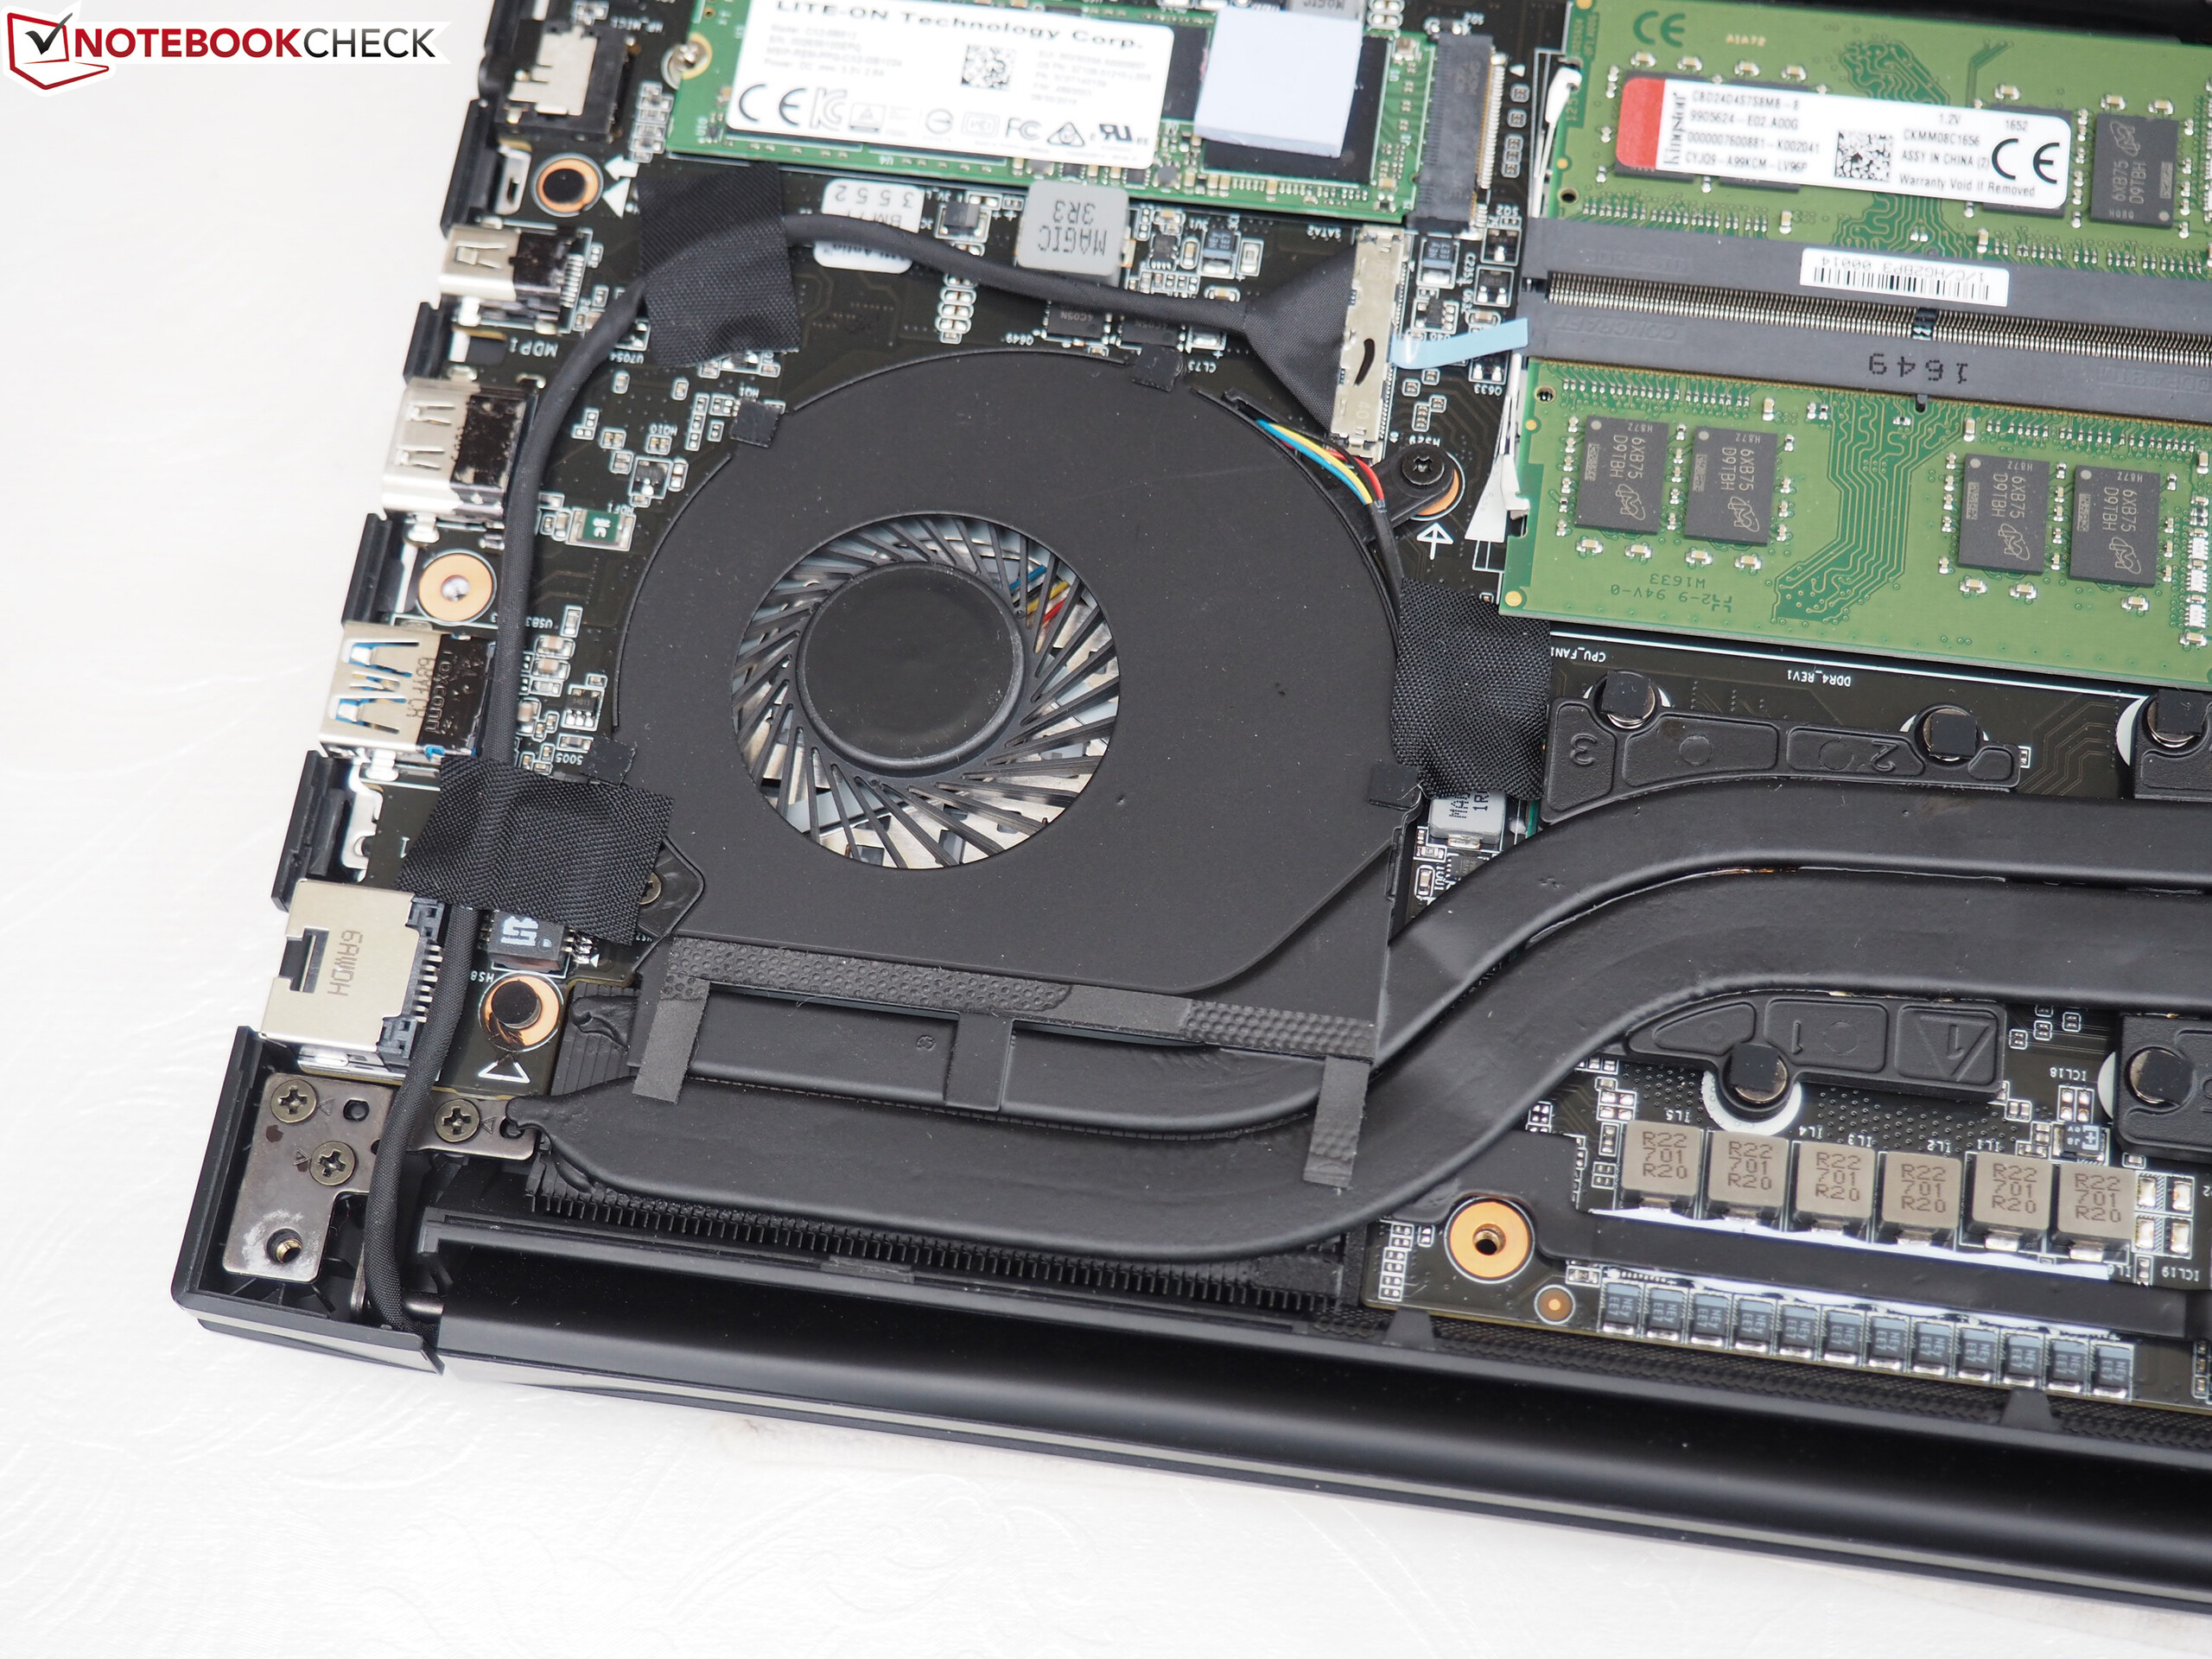
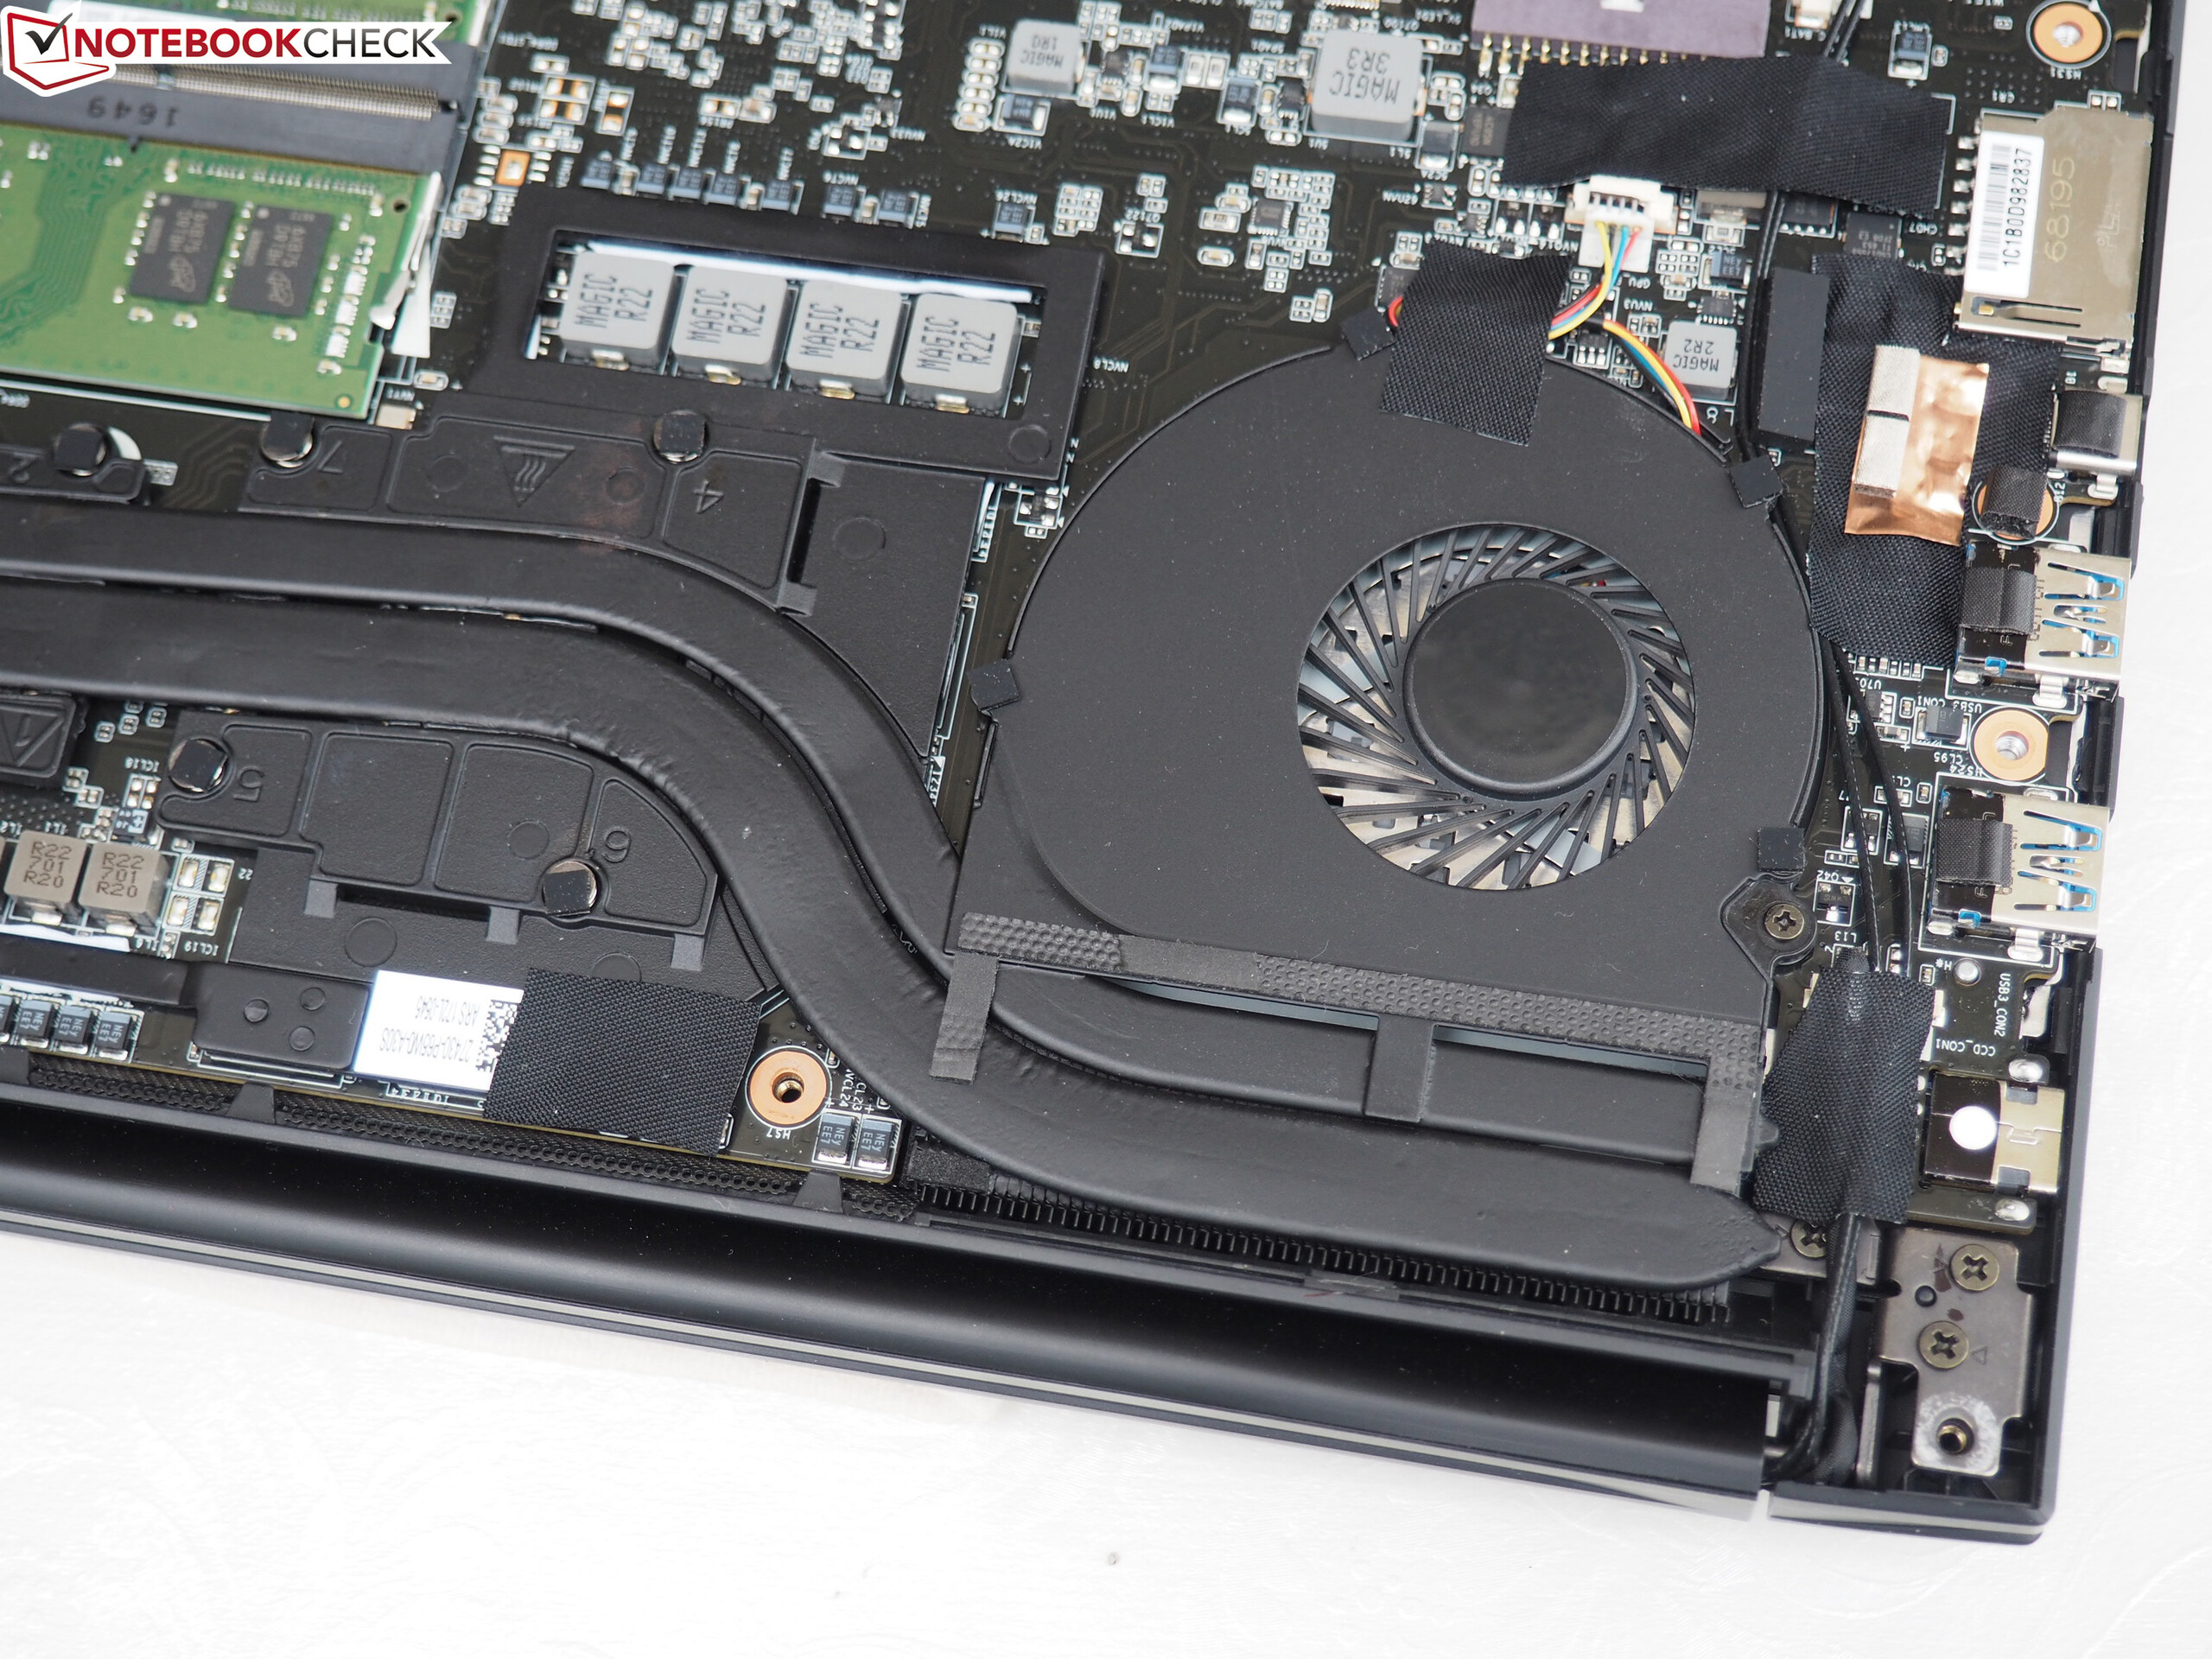
O desempenho global do sistema é muito rápido graças ao SSD NVMe, que pode ser substituído pelo usuário. O espaço de armazenamento adicional pode ser instalado no segundo slot M.2, no entanto, não há espaço para um disco rígido de 2,5 polegadas. A tela FHD mate oferece ângulos de visão decentes, brilho adequado e uma relação de contraste muito boa. Infelizmente, os tempos de resposta estão no lado lento e poderiam ser um pouco mais rápidos.
Gigabyte Aero 15X
- 11/01/2017 v6 (old)
Sascha Mölck
Price comparison
