Breve Análise do Portátil MSI GS63VR 7RG Stealth Pro (i7-7700HQ, GTX 1070 Max-Q, Full HD)

| SD Card Reader | |
| average JPG Copy Test (av. of 3 runs) | |
| Aorus X5 v7 (Toshiba Exceria Pro SDXC 64 GB UHS-II) | |
| Eurocom Q5 | |
| MSI GS63VR 7RG-005 (Toshiba Exceria Pro SDXC 64 GB UHS-II) | |
| Gigabyte Aero 15X (Toshiba Exceria Pro SDXC 64 GB UHS-II) | |
| MSI GS63VR-6RF16H22 Stealth Pro (Toshiba Exceria Pro SDXC 64 GB UHS-II) | |
| MSI GS63VR 7RF-228US (Toshiba Exceria Pro SDXC 64 GB UHS-II) | |
| maximum AS SSD Seq Read Test (1GB) | |
| Aorus X5 v7 (Toshiba Exceria Pro SDXC 64 GB UHS-II) | |
| Eurocom Q5 | |
| MSI GS63VR 7RG-005 (Toshiba Exceria Pro SDXC 64 GB UHS-II) | |
| Gigabyte Aero 15X (Toshiba Exceria Pro SDXC 64 GB UHS-II) | |
| MSI GS63VR-6RF16H22 Stealth Pro (Toshiba Exceria Pro SDXC 64 GB UHS-II) | |
| MSI GS63VR 7RF-228US (Toshiba Exceria Pro SDXC 64 GB UHS-II) | |
| Networking | |
| iperf3 transmit AX12 | |
| MSI GS63VR 7RF-228US | |
| MSI GS63VR 7RG-005 | |
| Aorus X5 v7 | |
| Eurocom Q5 | |
| Asus Zephyrus GX501VS | |
| Gigabyte Aero 15X | |
| iperf3 receive AX12 | |
| MSI GS63VR 7RG-005 | |
| Gigabyte Aero 15X | |
| Eurocom Q5 | |
| MSI GS63VR 7RF-228US | |
| Asus Zephyrus GX501VS | |
| Aorus X5 v7 | |
| |||||||||||||||||||||||||
iluminação: 85 %
iluminação com acumulador: 269 cd/m²
Contraste: 1281:1 (Preto: 0.21 cd/m²)
ΔE ColorChecker Calman: 3 | ∀{0.5-29.43 Ø4.71}
ΔE Greyscale Calman: 3.18 | ∀{0.09-98 Ø4.96}
100% sRGB (Argyll 1.6.3 3D)
77% AdobeRGB 1998 (Argyll 1.6.3 3D)
86.6% AdobeRGB 1998 (Argyll 3D)
100% sRGB (Argyll 3D)
91.6% Display P3 (Argyll 3D)
Gamma: 2.25
CCT: 7274 K
| MSI GS63VR 7RG-005 Chi Mei N156HHE-GA1 (CMN15F4), 1920x1080, 15.6" | Gigabyte Aero 15X Chi Mei N156HCA-EA1 (CMN15D7), 1920x1080, 15.6" | Asus Zephyrus GX501VS ID: AUO42ED, Name: AU Optronics B156HAN04.2, 1920x1080, 15.6" | Eurocom Q5 ID: LGD04D4, Name: LG Philips LP156UD1-SPB1, 3840x2160, 15.6" | Aorus X5 v7 AU Optronics B156ZAN02.3 (AUO23EB), 3840x2160, 15.6" | MSI GS63VR 7RF-228US 3840x2160, 15.6" | MSI GS63VR-6RF16H22 Stealth Pro Samsung 156HL01-104 (SDC324C) , 1920x1080, 15.6" | |
|---|---|---|---|---|---|---|---|
| Display | -21% | -25% | -21% | -20% | -39% | -16% | |
| Display P3 Coverage (%) | 91.6 | 64.7 -29% | 62.1 -32% | 63 -31% | 65.3 -29% | 48.21 -47% | 67.8 -26% |
| sRGB Coverage (%) | 100 | 90.4 -10% | 85.6 -14% | 92.7 -7% | 91.9 -8% | 72.6 -27% | 97.4 -3% |
| AdobeRGB 1998 Coverage (%) | 86.6 | 65.7 -24% | 62.4 -28% | 64.4 -26% | 66.3 -23% | 49.81 -42% | 69.7 -20% |
| Response Times | -323% | -272% | -274% | -312% | -214% | -294% | |
| Response Time Grey 50% / Grey 80% * (ms) | 10.4 ? | 43.2 ? -315% | 33.2 ? -219% | 32.4 ? -212% | 44 ? -323% | 28 ? -169% | |
| Response Time Black / White * (ms) | 6.6 ? | 28.4 ? -330% | 28 ? -324% | 28.8 ? -336% | 26.4 ? -300% | 23.6 ? -258% | 26 ? -294% |
| PWM Frequency (Hz) | 25510 ? | 26000 ? | 1351 ? | 202 ? | |||
| Screen | -40% | -11% | -44% | -21% | -73% | -14% | |
| Brightness middle (cd/m²) | 269 | 338 26% | 307.1 14% | 287.5 7% | 307 14% | 274.2 2% | 293 9% |
| Brightness (cd/m²) | 254 | 324 28% | 309 22% | 279 10% | 297 17% | 263 4% | 279 10% |
| Brightness Distribution (%) | 85 | 88 4% | 86 1% | 87 2% | 92 8% | 92 8% | 84 -1% |
| Black Level * (cd/m²) | 0.21 | 0.34 -62% | 0.35 -67% | 0.65 -210% | 0.3 -43% | 0.44 -110% | 0.33 -57% |
| Contrast (:1) | 1281 | 994 -22% | 877 -32% | 442 -65% | 1023 -20% | 623 -51% | 888 -31% |
| Colorchecker dE 2000 * | 3 | 5.92 -97% | 3.4 -13% | 4.5 -50% | 4.72 -57% | 8 -167% | 3.59 -20% |
| Colorchecker dE 2000 max. * | 5.62 | 11.77 -109% | 8.2 -46% | 8.9 -58% | 8.07 -44% | 14.6 -160% | 5.79 -3% |
| Greyscale dE 2000 * | 3.18 | 7.45 -134% | 1.4 56% | 4.6 -45% | 4.79 -51% | 9.1 -186% | 3.86 -21% |
| Gamma | 2.25 98% | 2.58 85% | 2.19 100% | 2.39 92% | 2.42 91% | 2.24 98% | 2.53 87% |
| CCT | 7274 89% | 6366 102% | 6558 99% | 7393 88% | 7690 85% | 5020 129% | 7229 90% |
| Color Space (Percent of AdobeRGB 1998) (%) | 77 | 59 -23% | 55.6 -28% | 59 -23% | 60 -22% | 45.7 -41% | 63 -18% |
| Color Space (Percent of sRGB) (%) | 100 | 90 -10% | 85 -15% | 92.3 -8% | 92 -8% | 72.1 -28% | 97 -3% |
| Média Total (Programa/Configurações) | -128% /
-74% | -103% /
-48% | -113% /
-70% | -118% /
-59% | -109% /
-85% | -108% /
-34% |
* ... menor é melhor
Cintilação da tela / PWM (modulação por largura de pulso)
| Tela tremeluzindo/PWM detectado | 25510 Hz | ≤ 25 % configuração de brilho | 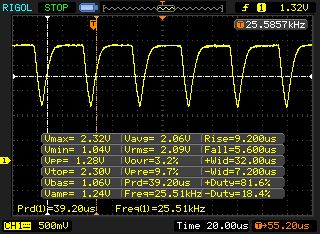 |
A luz de fundo da tela pisca em 25510 Hz (pior caso, por exemplo, utilizando PWM) Cintilação detectada em uma configuração de brilho de 25 % e abaixo. Não deve haver cintilação ou PWM acima desta configuração de brilho. A frequência de 25510 Hz é bastante alta, então a maioria dos usuários sensíveis ao PWM não deve notar nenhuma oscilação. [pwm_comparison] Em comparação: 52 % de todos os dispositivos testados não usam PWM para escurecer a tela. Se PWM foi detectado, uma média de 7757 (mínimo: 5 - máximo: 343500) Hz foi medida. | |||
Exibir tempos de resposta
| ↔ Tempo de resposta preto para branco | ||
|---|---|---|
| 6.6 ms ... ascensão ↗ e queda ↘ combinadas | ↗ 4.4 ms ascensão | 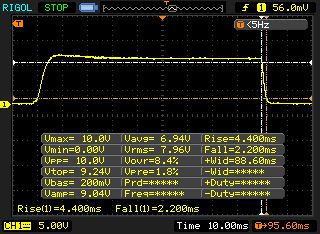 |
| ↘ 2.2 ms queda | ||
| A tela mostra taxas de resposta muito rápidas em nossos testes e deve ser muito adequada para jogos em ritmo acelerado. Em comparação, todos os dispositivos testados variam de 0.1 (mínimo) a 240 (máximo) ms. » 21 % de todos os dispositivos são melhores. Isso significa que o tempo de resposta medido é melhor que a média de todos os dispositivos testados (19.8 ms). | ||
| ↔ Tempo de resposta 50% cinza a 80% cinza | ||
| 10.4 ms ... ascensão ↗ e queda ↘ combinadas | ↗ 6 ms ascensão | 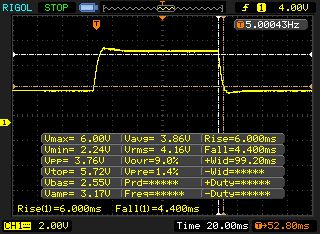 |
| ↘ 4.4 ms queda | ||
| A tela mostra boas taxas de resposta em nossos testes, mas pode ser muito lenta para jogadores competitivos. Em comparação, todos os dispositivos testados variam de 0.165 (mínimo) a 636 (máximo) ms. » 24 % de todos os dispositivos são melhores. Isso significa que o tempo de resposta medido é melhor que a média de todos os dispositivos testados (31 ms). | ||


| Cinebench R10 | |
| Rendering Multiple CPUs 32Bit | |
| Gigabyte Aero 15X | |
| MSI GS63VR 7RG-005 | |
| Asus Zephyrus GX501VS | |
| MSI GS63VR 7RF-228US | |
| Eurocom Q5 | |
| Rendering Single 32Bit | |
| Gigabyte Aero 15X | |
| MSI GS63VR 7RG-005 | |
| Eurocom Q5 | |
| Asus Zephyrus GX501VS | |
| MSI GS63VR 7RF-228US | |
| Geekbench 3 | |
| 32 Bit Multi-Core Score | |
| Gigabyte Aero 15X | |
| MSI GS63VR 7RG-005 | |
| 32 Bit Single-Core Score | |
| Gigabyte Aero 15X | |
| MSI GS63VR 7RG-005 | |
| Geekbench 4.0 | |
| 64 Bit Multi-Core Score | |
| Gigabyte Aero 15X | |
| MSI GS63VR 7RG-005 | |
| 64 Bit Single-Core Score | |
| Gigabyte Aero 15X | |
| MSI GS63VR 7RG-005 | |
| Geekbench 4.4 | |
| 64 Bit Multi-Core Score | |
| Gigabyte Aero 15X | |
| MSI GS63VR 7RG-005 | |
| 64 Bit Single-Core Score | |
| Gigabyte Aero 15X | |
| MSI GS63VR 7RG-005 | |
| JetStream 1.1 - 1.1 Total | |
| Gigabyte Aero 15X (Edge 41) | |
| MSI GS63VR 7RG-005 (Edge 41) | |
| Eurocom Q5 (Edge 40.15063.0.0) | |
| MSI GS63VR 7RF-228US (Edge 38.14393.0.0) | |
| MSI GS63VR-6RF16H22 Stealth Pro (Edge 25.10586.0.0) | |
| Asus Zephyrus GX501VS (Edge 40.15063.0.0) | |
| PCMark 7 Score | 5755 pontos | |
| PCMark 8 Home Score Accelerated v2 | 4193 pontos | |
| PCMark 8 Creative Score Accelerated v2 | 5362 pontos | |
| PCMark 8 Work Score Accelerated v2 | 5176 pontos | |
| PCMark 10 Score | 4542 pontos | |
Ajuda | ||

| MSI GS63VR 7RG-005 Samsung SM961 MZVPW256HEGL | Gigabyte Aero 15X Samsung SM961 MZVKW512HMJP m.2 PCI-e | Aorus X5 v7 Toshiba NVMe THNSN5256GPU7 | MSI GS63VR 7RF-228US Samsung SM961 MZVKW512HMJP m.2 PCI-e | MSI GS63VR-6RF16H22 Stealth Pro Samsung SM951 MZVPV256HDGL m.2 PCI-e | |
|---|---|---|---|---|---|
| CrystalDiskMark 3.0 | -7% | 11% | 9% | 17% | |
| Read Seq (MB/s) | 2065 | 1381 -33% | 1479 -28% | 2141 4% | 1973 -4% |
| Write Seq (MB/s) | 1459 | 1546 6% | 1076 -26% | 1621 11% | 1292 -11% |
| Read 512 (MB/s) | 439.4 | 418 -5% | 1086 147% | 499.7 14% | 1279 191% |
| Write 512 (MB/s) | 1283 | 1277 0% | 1101 -14% | 1531 19% | 1288 0% |
| Read 4k (MB/s) | 56.6 | 51.3 -9% | 44 -22% | 54.2 -4% | 52.3 -8% |
| Write 4k (MB/s) | 148.4 | 131 -12% | 137.8 -7% | 158.2 7% | 153.2 3% |
| Read 4k QD32 (MB/s) | 576 | 544 -6% | 697 21% | 632 10% | 464.4 -19% |
| Write 4k QD32 (MB/s) | 480.6 | 480.2 0% | 556 16% | 527 10% | 384.4 -20% |
| 3DMark 06 Standard Score | 26805 pontos | |
| 3DMark 11 Performance | 13513 pontos | |
| 3DMark Ice Storm Standard Score | 121077 pontos | |
| 3DMark Cloud Gate Standard Score | 25810 pontos | |
| 3DMark Fire Strike Score | 11857 pontos | |
| 3DMark Fire Strike Extreme Score | 6272 pontos | |
| 3DMark Time Spy Score | 4396 pontos | |
Ajuda | ||
| 3DMark - 1920x1080 Fire Strike Graphics | |
| Aorus X5 v7 | |
| Asus Zephyrus GX501VS | |
| Gigabyte Aero 15X | |
| Eurocom Q5 | |
| MSI GS63VR 7RG-005 | |
| MSI GS63VR-6RF16H22 Stealth Pro | |
| MSI GS63VR 7RF-228US | |
| 3DMark 11 - 1280x720 Performance GPU | |
| Aorus X5 v7 | |
| Asus Zephyrus GX501VS | |
| Gigabyte Aero 15X | |
| Eurocom Q5 | |
| MSI GS63VR 7RG-005 | |
| MSI GS63VR-6RF16H22 Stealth Pro | |
| MSI GS63VR 7RF-228US | |
| The Witcher 3 - 1920x1080 Ultra Graphics & Postprocessing (HBAO+) | |
| Aorus X5 v7 | |
| Gigabyte Aero 15X | |
| Asus Zephyrus GX501VS | |
| MSI GS63VR 7RG-005 | |
| Eurocom Q5 | |
| MSI GS63VR-6RF16H22 Stealth Pro | |
| MSI GS63VR 7RF-228US | |
| BioShock Infinite - 1920x1080 Ultra Preset, DX11 (DDOF) | |
| Asus Zephyrus GX501VS | |
| Eurocom Q5 | |
| Gigabyte Aero 15X | |
| MSI GS63VR 7RG-005 | |
| MSI GS63VR-6RF16H22 Stealth Pro | |
| MSI GS63VR 7RF-228US | |
| ELEX - 1920x1080 Ultra / On AA:SM AF:16x | |
| Gigabyte Aero 15X | |
| MSI GS63VR 7RG-005 | |
| Middle-earth: Shadow of War - 1920x1080 Ultra Preset AA:T | |
| Gigabyte Aero 15X | |
| MSI GS63VR 7RG-005 | |
| baixo | média | alto | ultra | |
|---|---|---|---|---|
| Tomb Raider (2013) | 407.5 | 376.4 | 339.3 | 179.1 |
| BioShock Infinite (2013) | 239.4 | 173.8 | 161.5 | 109.6 |
| The Witcher 3 (2015) | 175.7 | 140.8 | 90.3 | 50.2 |
| Middle-earth: Shadow of War (2017) | 91 | 82 | 74 | 62 |
| ELEX (2017) | 120.5 | 87.7 | 77.9 | 63.3 |
| Assassin´s Creed Origins (2017) | 63 | 53 | 52 | 44 |
| Call of Duty WWII (2017) | 163.3 | 133.5 | 97.2 | 86 |
| Need for Speed Payback (2017) | 112.4 | 95.9 | 89.9 | 87.2 |
Barulho
| Ocioso |
| 31 / 34 / 35 dB |
| HDD |
| 34 dB |
| Carga |
| 42 / 46 dB |
 | ||
30 dB silencioso 40 dB(A) audível 50 dB(A) ruidosamente alto |
||
min: | ||
| MSI GS63VR 7RG-005 i7-7700HQ, GeForce GTX 1070 Max-Q | Gigabyte Aero 15X i7-7700HQ, GeForce GTX 1070 Max-Q | Asus Zephyrus GX501VS i7-7700HQ, GeForce GTX 1070 Max-Q | Eurocom Q5 i7-7700HQ, GeForce GTX 1070 Max-Q | Aorus X5 v7 i7-7820HK, GeForce GTX 1070 Mobile | MSI GS63VR 7RF-228US i7-7700HQ, GeForce GTX 1060 Mobile | MSI GS63VR-6RF16H22 Stealth Pro 6700HQ, GeForce GTX 1060 Mobile | |
|---|---|---|---|---|---|---|---|
| Noise | -0% | 8% | -1% | -9% | 1% | 3% | |
| desligado / ambiente * (dB) | 30 | 30 -0% | 28.5 5% | 29 3% | 30 -0% | 28.8 4% | 30 -0% |
| Idle Minimum * (dB) | 31 | 31 -0% | 28.5 8% | 31.5 -2% | 35 -13% | 33.1 -7% | 32 -3% |
| Idle Average * (dB) | 34 | 32 6% | 28.5 16% | 33.8 1% | 36 -6% | 33.1 3% | 33 3% |
| Idle Maximum * (dB) | 35 | 36 -3% | 30.1 14% | 33.8 3% | 40 -14% | 34 3% | 34 3% |
| Load Average * (dB) | 42 | 39 7% | 35.2 16% | 41.7 1% | 43 -2% | 37.2 11% | 37 12% |
| Witcher 3 ultra * (dB) | 44 | 44 -0% | 41.7 5% | 41.7 5% | 49 -11% | 46.1 -5% | |
| Load Maximum * (dB) | 46 | 52 -13% | 48.8 -6% | 54.2 -18% | 55 -20% | 47.1 -2% | 46 -0% |
* ... menor é melhor
(-) A temperatura máxima no lado superior é 47 °C / 117 F, em comparação com a média de 40.4 °C / 105 F , variando de 21.2 a 68.8 °C para a classe Gaming.
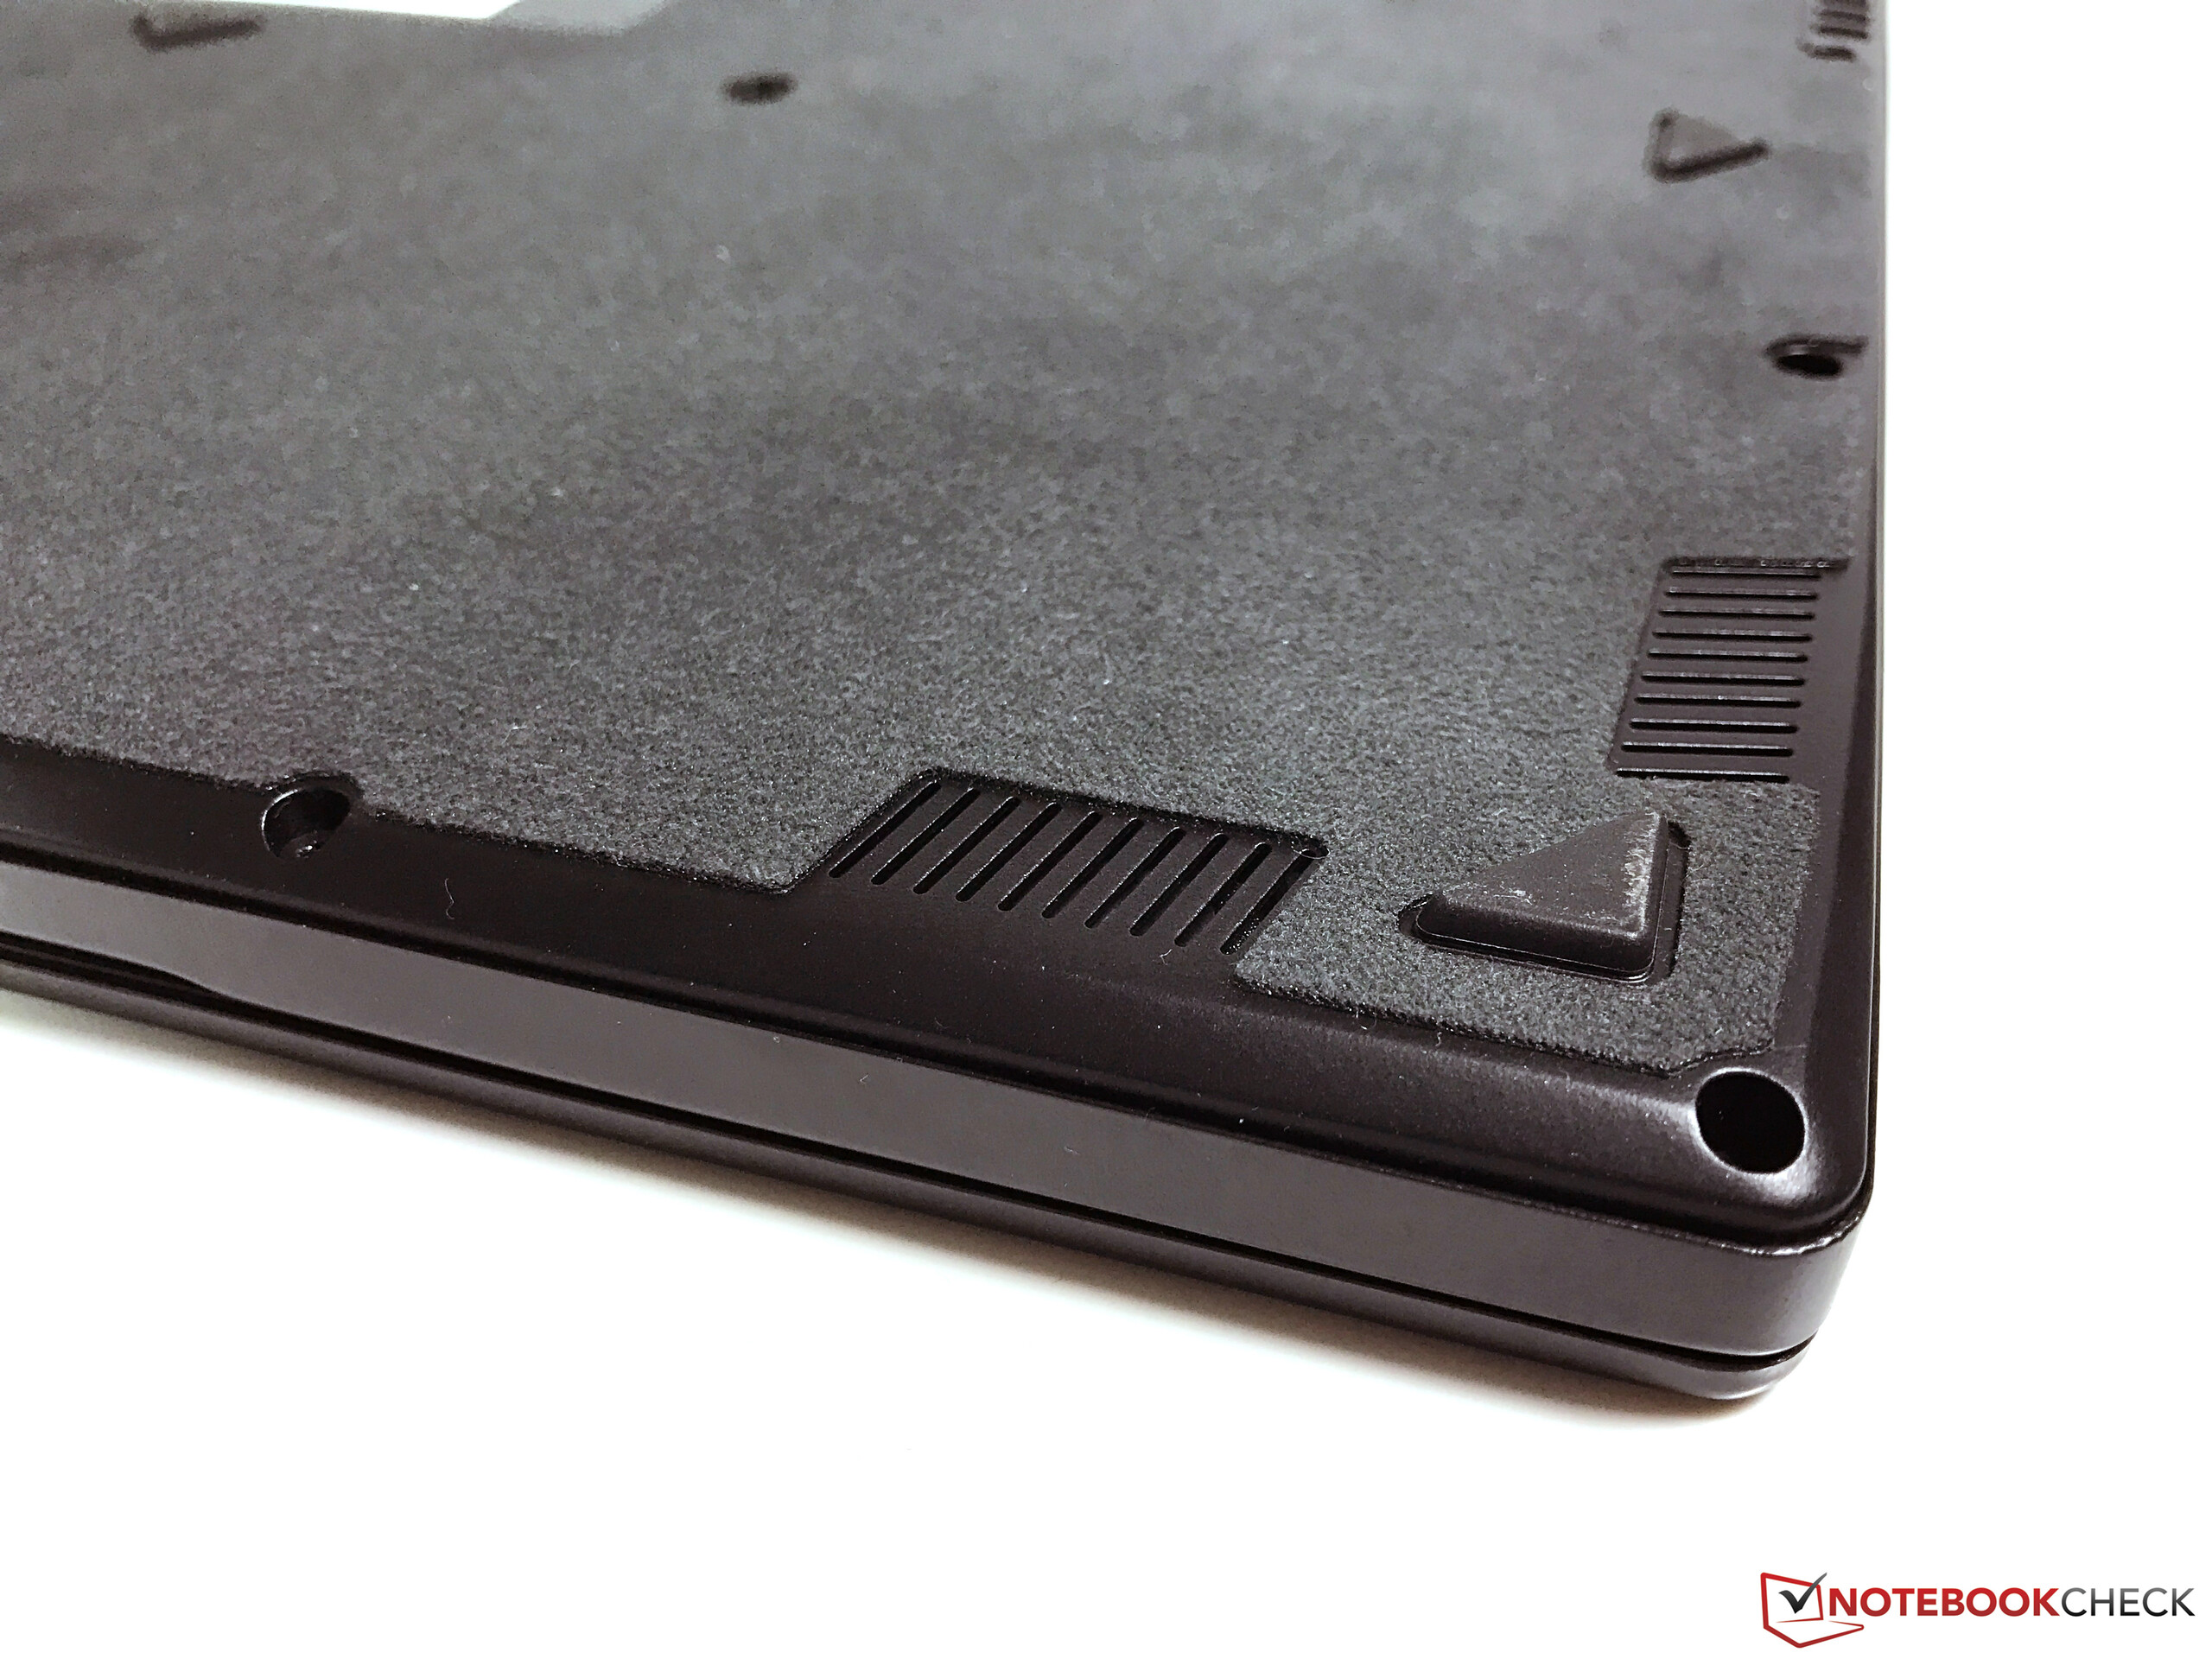
(-) A parte inferior aquece até um máximo de 63 °C / 145 F, em comparação com a média de 43.2 °C / 110 F
(+) Em uso inativo, a temperatura média para o lado superior é 24.1 °C / 75 F, em comparação com a média do dispositivo de 33.9 °C / ### class_avg_f### F.
(±) Jogando The Witcher 3, a temperatura média para o lado superior é 37.9 °C / 100 F, em comparação com a média do dispositivo de 33.9 °C / ## #class_avg_f### F.
(±) Os apoios para as mãos e o touchpad podem ficar muito quentes ao toque, com um máximo de 38 °C / 100.4 F.
(-) A temperatura média da área do apoio para as mãos de dispositivos semelhantes foi 28.8 °C / 83.8 F (-9.2 °C / -16.6 F).
| MSI GS63VR 7RG-005 i7-7700HQ, GeForce GTX 1070 Max-Q | Gigabyte Aero 15X i7-7700HQ, GeForce GTX 1070 Max-Q | Asus Zephyrus GX501VS i7-7700HQ, GeForce GTX 1070 Max-Q | Eurocom Q5 i7-7700HQ, GeForce GTX 1070 Max-Q | Aorus X5 v7 i7-7820HK, GeForce GTX 1070 Mobile | MSI GS63VR 7RF-228US i7-7700HQ, GeForce GTX 1060 Mobile | MSI GS63VR-6RF16H22 Stealth Pro 6700HQ, GeForce GTX 1060 Mobile | |
|---|---|---|---|---|---|---|---|
| Heat | 2% | -2% | -10% | -13% | -12% | 1% | |
| Maximum Upper Side * (°C) | 47 | 51 -9% | 54.4 -16% | 56.2 -20% | 64 -36% | 45.3 4% | |
| Maximum Bottom * (°C) | 63 | 58 8% | 41.2 35% | 61.2 3% | 56 11% | 62.6 1% | |
| Idle Upper Side * (°C) | 25 | 25 -0% | 31.2 -25% | 27.8 -11% | 29 -16% | 28.4 -14% | 25.3 -1% |
| Idle Bottom * (°C) | 27 | 25 7% | 27.6 -2% | 29.6 -10% | 30 -11% | 29.6 -10% | 27.3 -1% |
* ... menor é melhor
MSI GS63VR 7RG-005 análise de áudio
(+) | os alto-falantes podem tocar relativamente alto (###valor### dB)
Graves 100 - 315Hz
(-) | quase nenhum baixo - em média 21.3% menor que a mediana
(-) | graves não são lineares (15.2% delta para frequência anterior)
Médios 400 - 2.000 Hz
(±) | médios mais altos - em média 11% maior que a mediana
(±) | a linearidade dos médios é média (10% delta para frequência anterior)
Altos 2 - 16 kHz
(+) | agudos equilibrados - apenas 3.4% longe da mediana
(±) | a linearidade dos máximos é média (9.2% delta para frequência anterior)
Geral 100 - 16.000 Hz
(±) | a linearidade do som geral é média (24.2% diferença em relação à mediana)
Comparado com a mesma classe
» 87% de todos os dispositivos testados nesta classe foram melhores, 4% semelhantes, 9% piores
» O melhor teve um delta de 6%, a média foi 18%, o pior foi 132%
Comparado com todos os dispositivos testados
» 73% de todos os dispositivos testados foram melhores, 6% semelhantes, 21% piores
» O melhor teve um delta de 4%, a média foi 23%, o pior foi 134%
Aorus X5 v7 análise de áudio
(±) | o volume do alto-falante é médio, mas bom (###valor### dB)
Graves 100 - 315Hz
(-) | quase nenhum baixo - em média 19% menor que a mediana
(±) | a linearidade dos graves é média (10.6% delta para a frequência anterior)
Médios 400 - 2.000 Hz
(+) | médios equilibrados - apenas 4.2% longe da mediana
(+) | médios são lineares (5.8% delta para frequência anterior)
Altos 2 - 16 kHz
(+) | agudos equilibrados - apenas 2.1% longe da mediana
(+) | os máximos são lineares (5.4% delta da frequência anterior)
Geral 100 - 16.000 Hz
(±) | a linearidade do som geral é média (18.7% diferença em relação à mediana)
Comparado com a mesma classe
» 62% de todos os dispositivos testados nesta classe foram melhores, 8% semelhantes, 30% piores
» O melhor teve um delta de 6%, a média foi 18%, o pior foi 132%
Comparado com todos os dispositivos testados
» 43% de todos os dispositivos testados foram melhores, 8% semelhantes, 49% piores
» O melhor teve um delta de 4%, a média foi 23%, o pior foi 134%
| desligado | |
| Ocioso | |
| Carga |
|
Key:
min: | |
| MSI GS63VR 7RG-005 i7-7700HQ, GeForce GTX 1070 Max-Q | Gigabyte Aero 15X i7-7700HQ, GeForce GTX 1070 Max-Q | Asus Zephyrus GX501VS i7-7700HQ, GeForce GTX 1070 Max-Q | Eurocom Q5 i7-7700HQ, GeForce GTX 1070 Max-Q | Aorus X5 v7 i7-7820HK, GeForce GTX 1070 Mobile | MSI GS63VR 7RF-228US i7-7700HQ, GeForce GTX 1060 Mobile | MSI GS63VR-6RF16H22 Stealth Pro 6700HQ, GeForce GTX 1060 Mobile | |
|---|---|---|---|---|---|---|---|
| Power Consumption | 9% | -15% | 12% | -63% | -4% | -25% | |
| Idle Minimum * (Watt) | 12 | 10 17% | 19.1 -59% | 9 25% | 26 -117% | 14.5 -21% | 18 -50% |
| Idle Average * (Watt) | 16 | 13 19% | 20.8 -30% | 13.5 16% | 31 -94% | 17.3 -8% | 22 -38% |
| Idle Maximum * (Watt) | 21 | 20 5% | 21.8 -4% | 13.7 35% | 36 -71% | 17.4 17% | 30 -43% |
| Load Average * (Watt) | 85 | 79 7% | 73.7 13% | 87.8 -3% | 93 -9% | 93 -9% | 77 9% |
| Witcher 3 ultra * (Watt) | 128 | 120 6% | 130.2 -2% | 129 -1% | 176 -38% | 128.8 -1% | |
| Load Maximum * (Watt) | 162 | 165 -2% | 173.1 -7% | 158.6 2% | 240 -48% | 165 -2% |
* ... menor é melhor
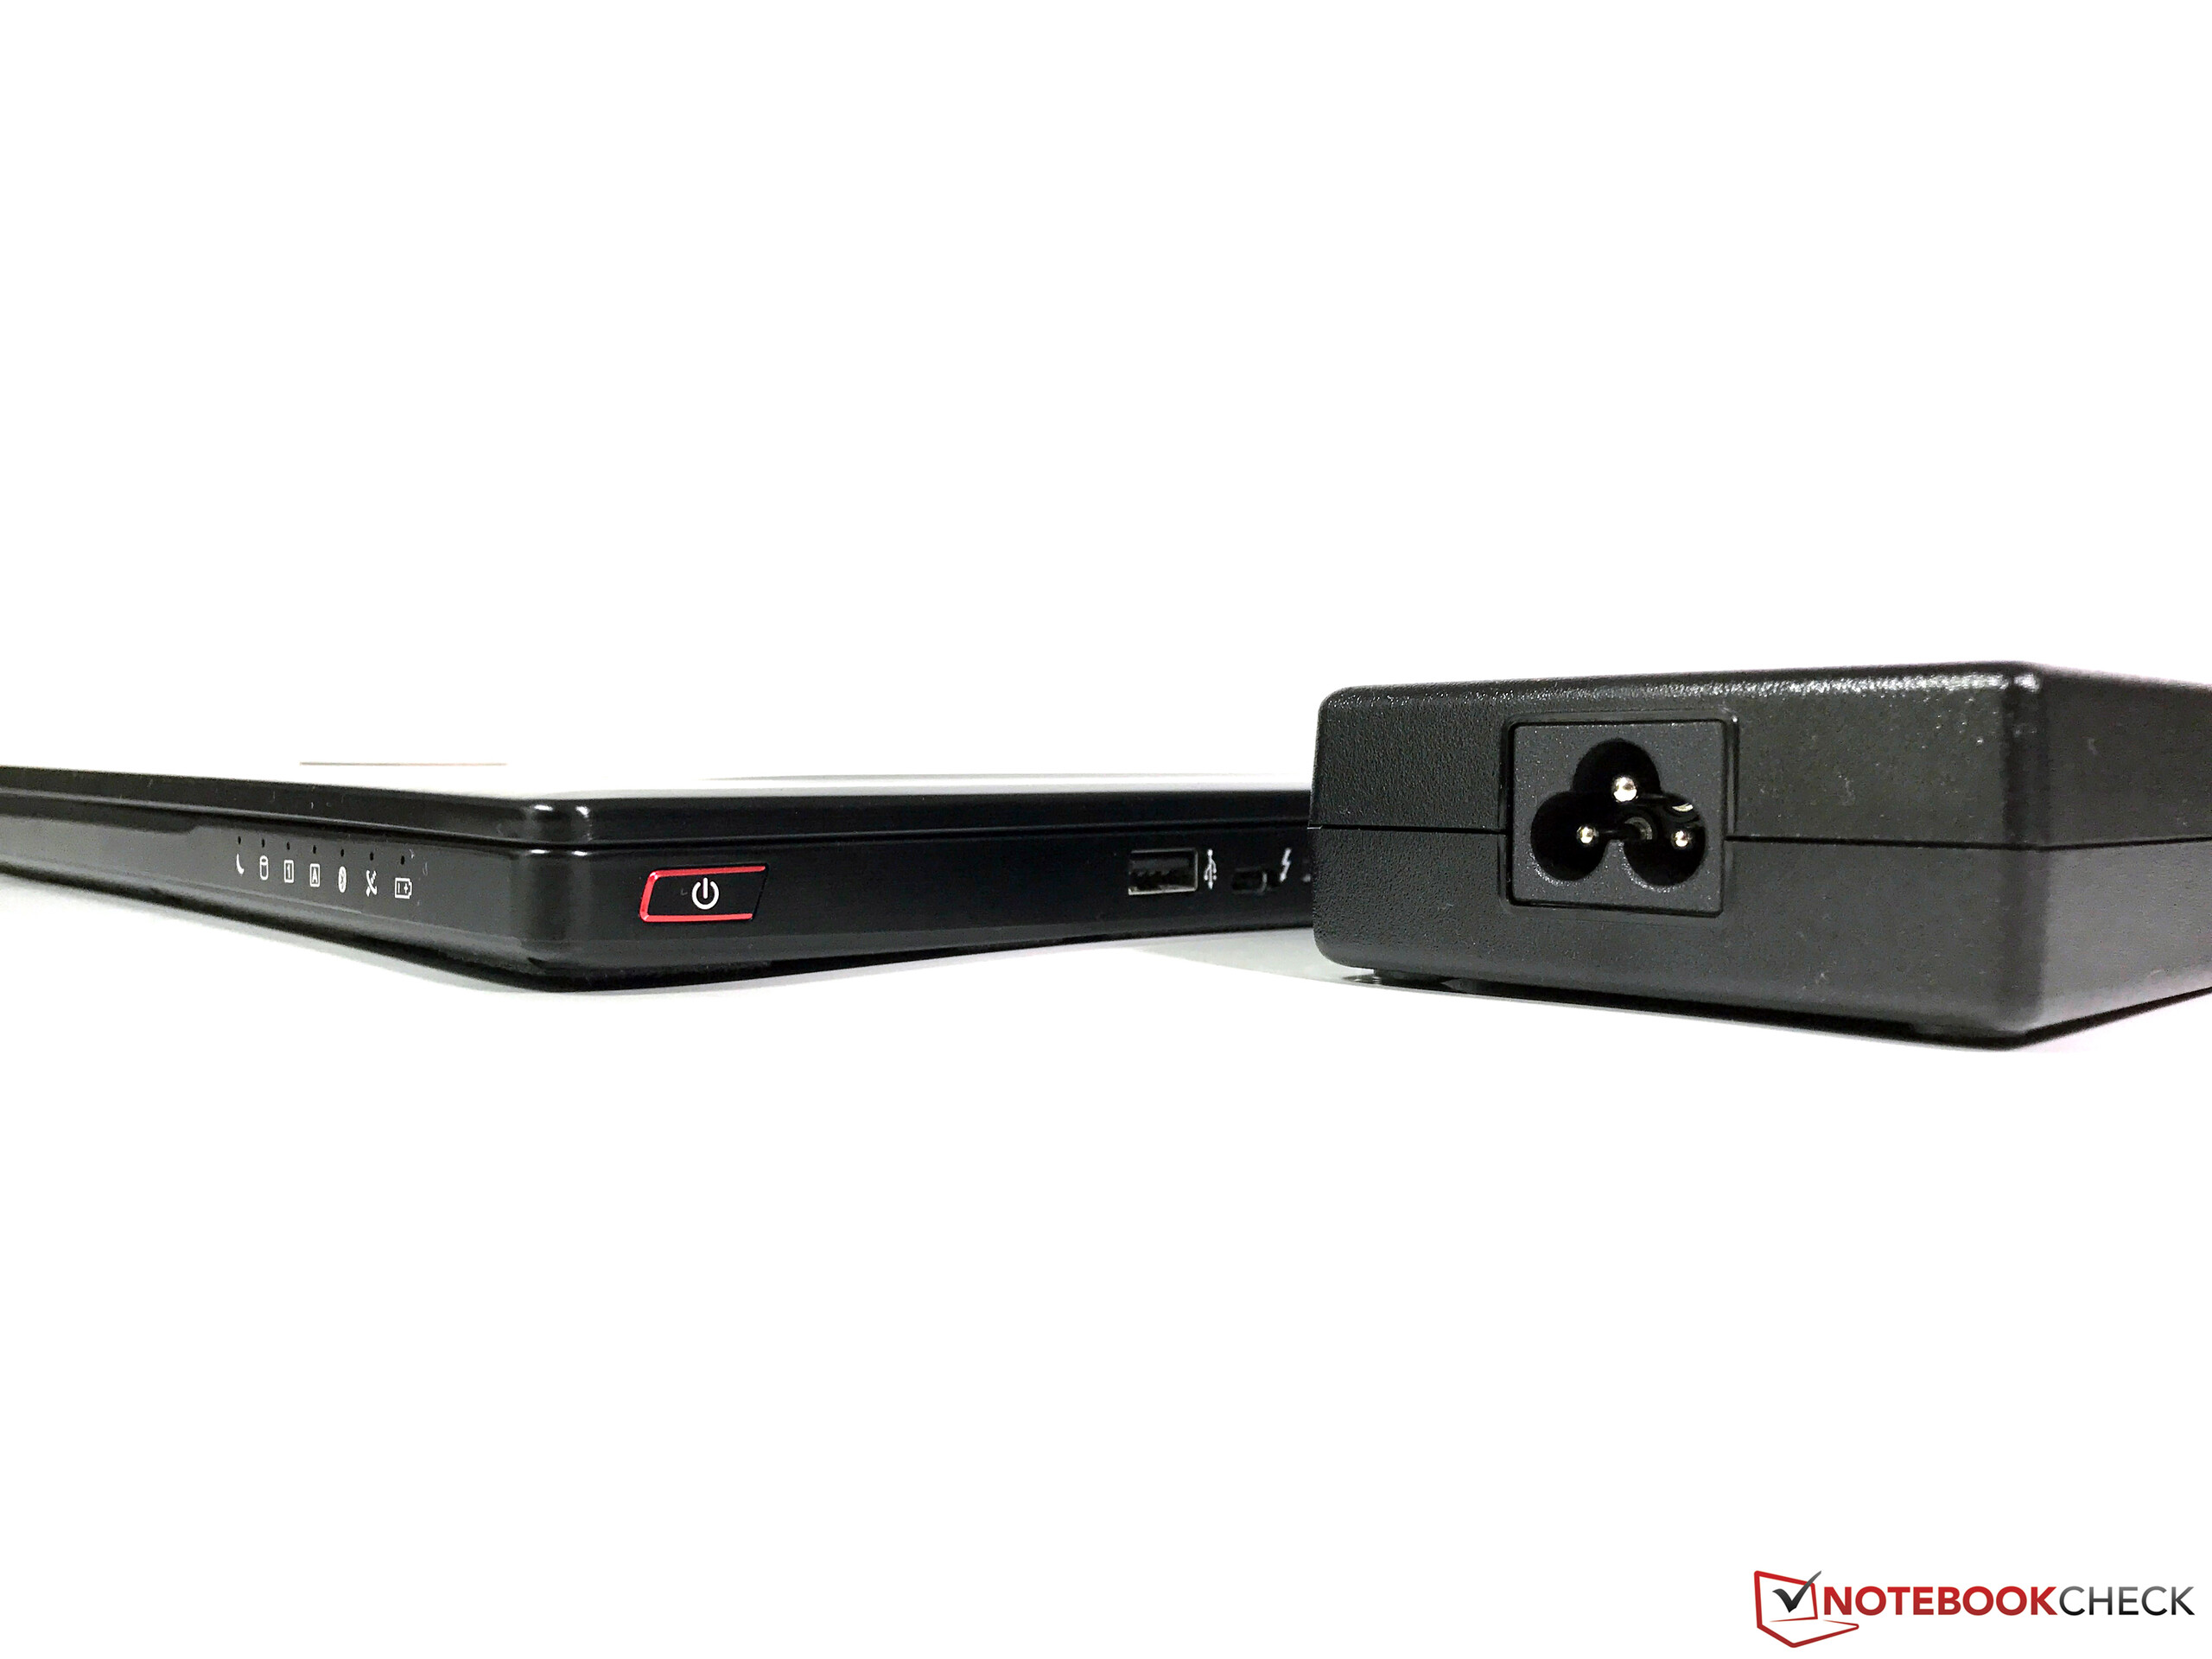
| MSI GS63VR 7RG-005 i7-7700HQ, GeForce GTX 1070 Max-Q, 52.4 Wh | Gigabyte Aero 15X i7-7700HQ, GeForce GTX 1070 Max-Q, 94.2 Wh | Asus Zephyrus GX501VS i7-7700HQ, GeForce GTX 1070 Max-Q, 50 Wh | Eurocom Q5 i7-7700HQ, GeForce GTX 1070 Max-Q, 55 Wh | Aorus X5 v7 i7-7820HK, GeForce GTX 1070 Mobile, 94 Wh | MSI GS63VR 7RF-228US i7-7700HQ, GeForce GTX 1060 Mobile, 65 Wh | MSI GS63VR-6RF16H22 Stealth Pro 6700HQ, GeForce GTX 1060 Mobile, 65 Wh | |
|---|---|---|---|---|---|---|---|
| Duração da bateria | 125% | -30% | 9% | -16% | 14% | 11% | |
| Reader / Idle (h) | 5.7 | 13 128% | 3.8 -33% | 7.8 37% | 3.5 -39% | 6.4 12% | 6 5% |
| H.264 (h) | 3.8 | 7.6 100% | 2.7 -29% | 4.5 18% | |||
| WiFi v1.3 (h) | 3.9 | 8.2 110% | 2.5 -36% | 4.3 10% | 2.5 -36% | 3.9 0% | 3.5 -10% |
| Load (h) | 1 | 2.6 160% | 0.8 -20% | 0.8 -20% | 1.4 40% | 1.3 30% | 1.3 30% |
Pro
Contra
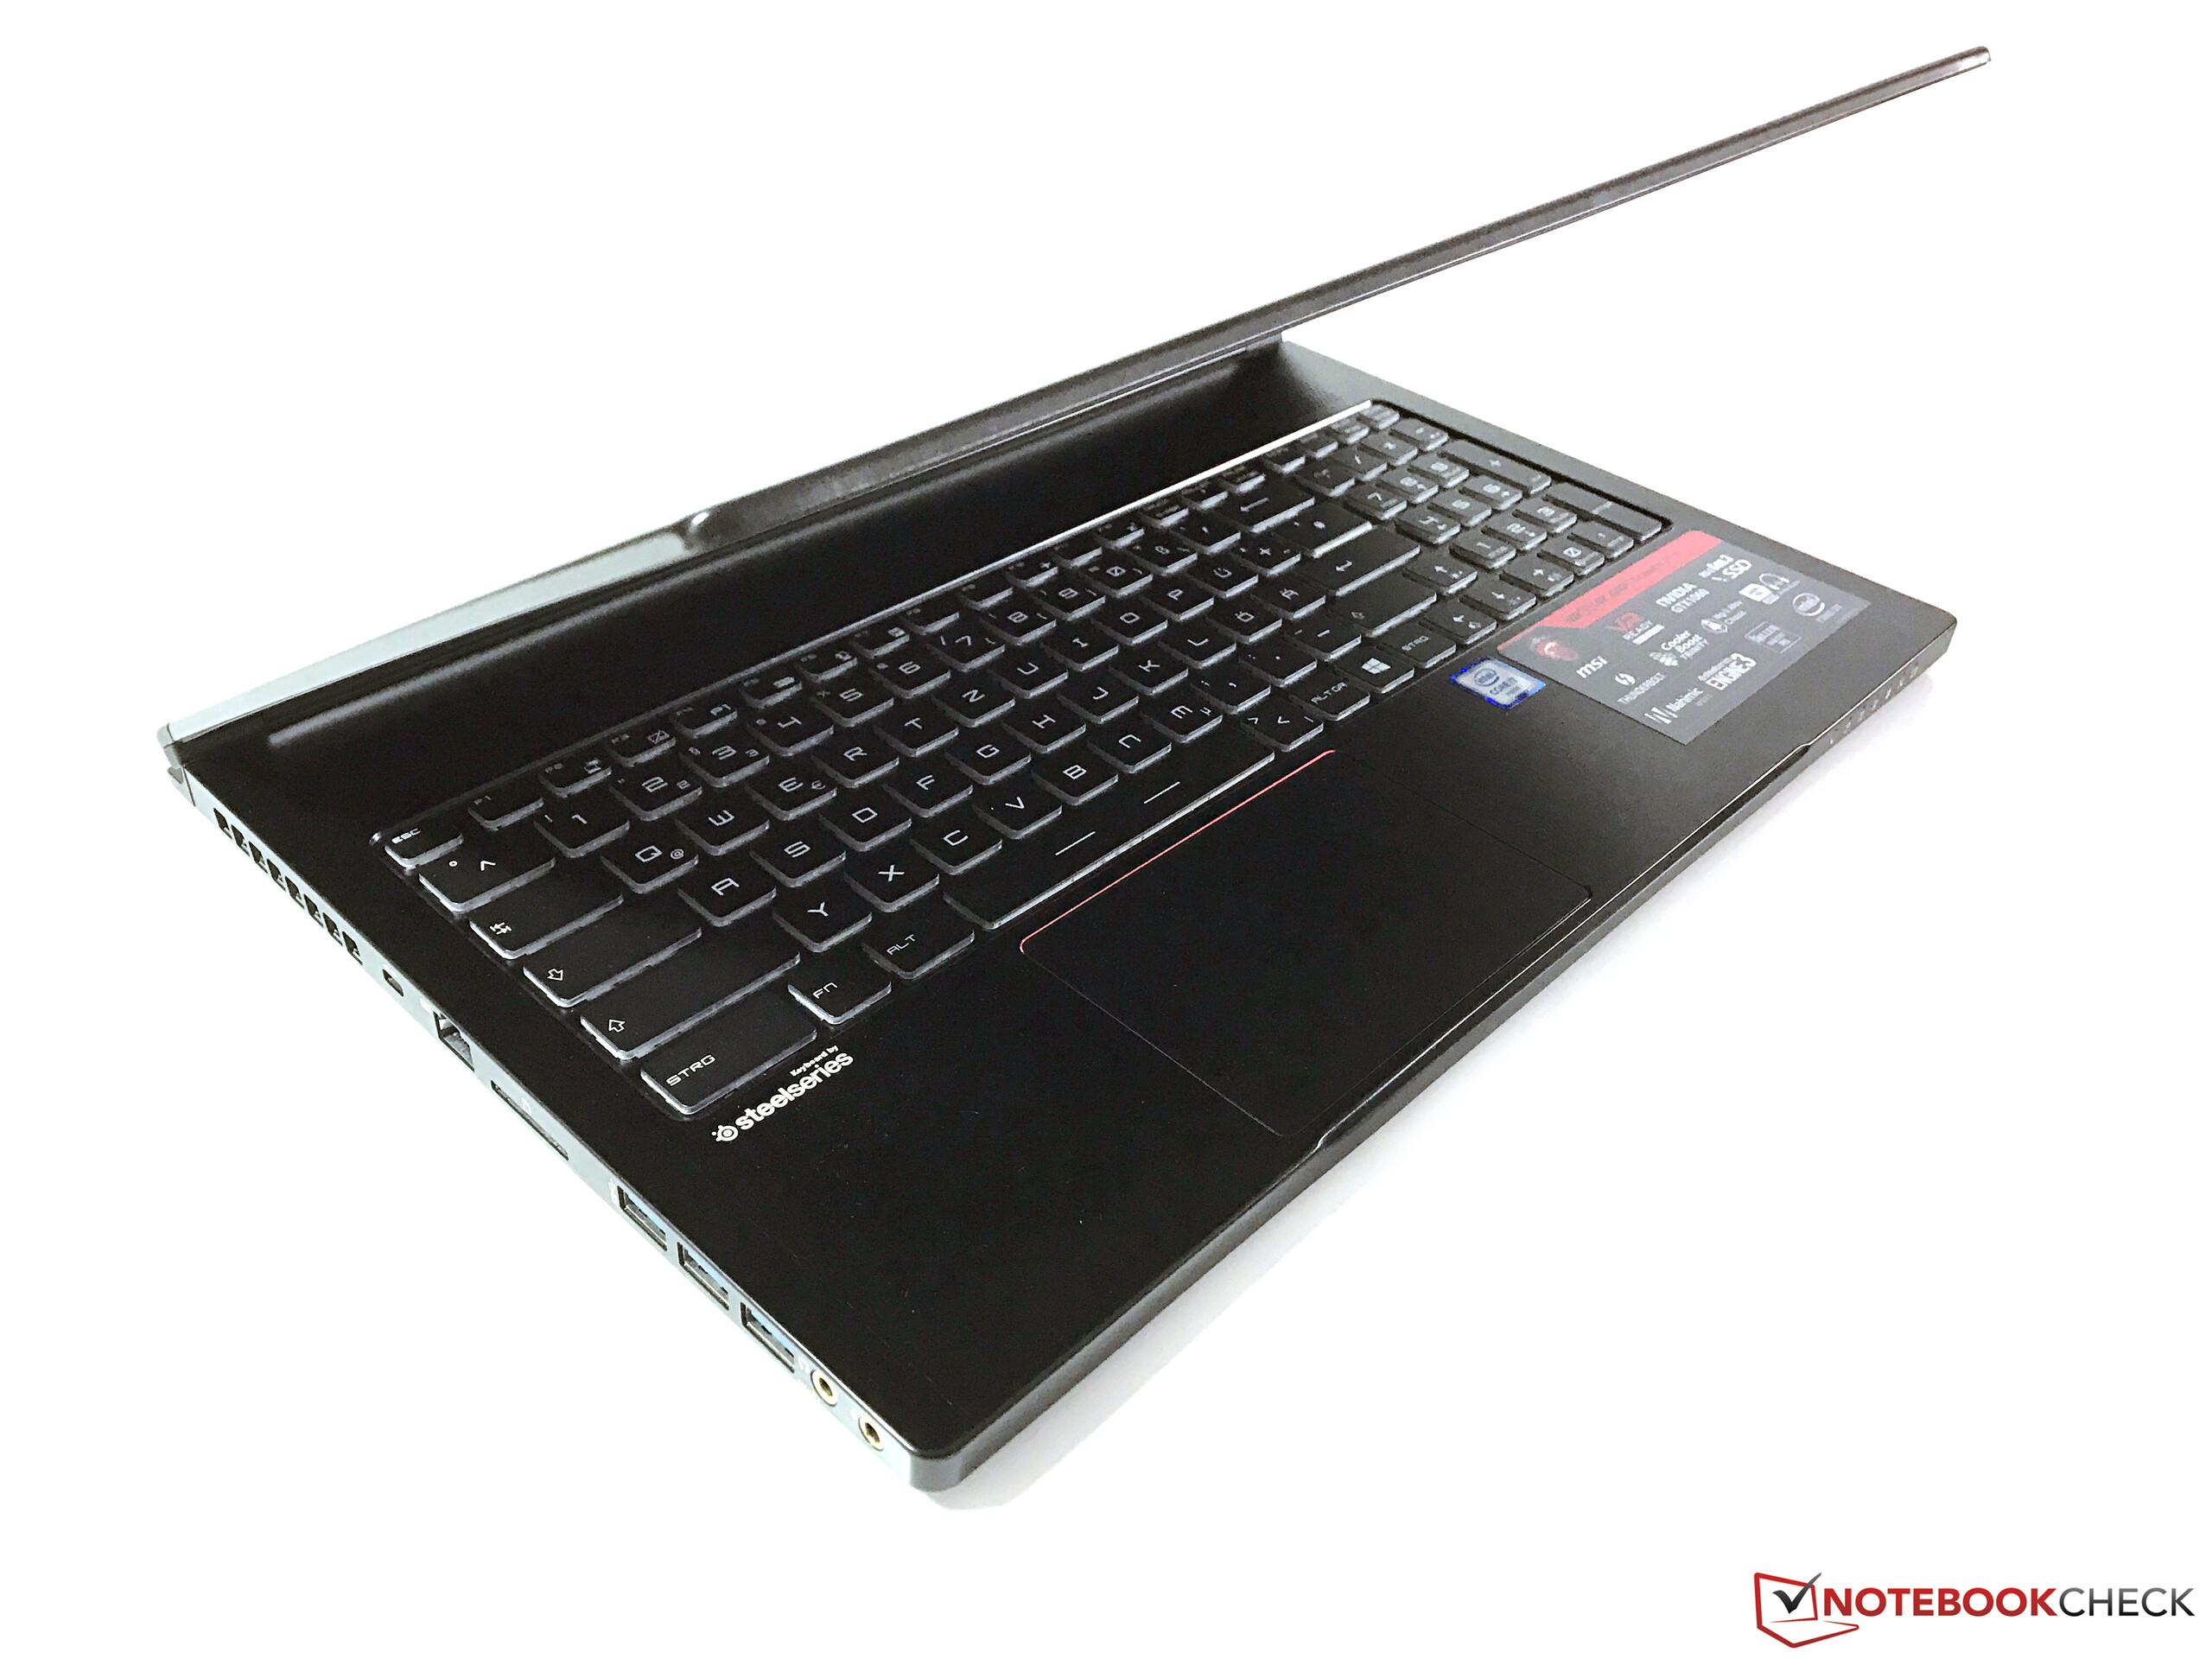
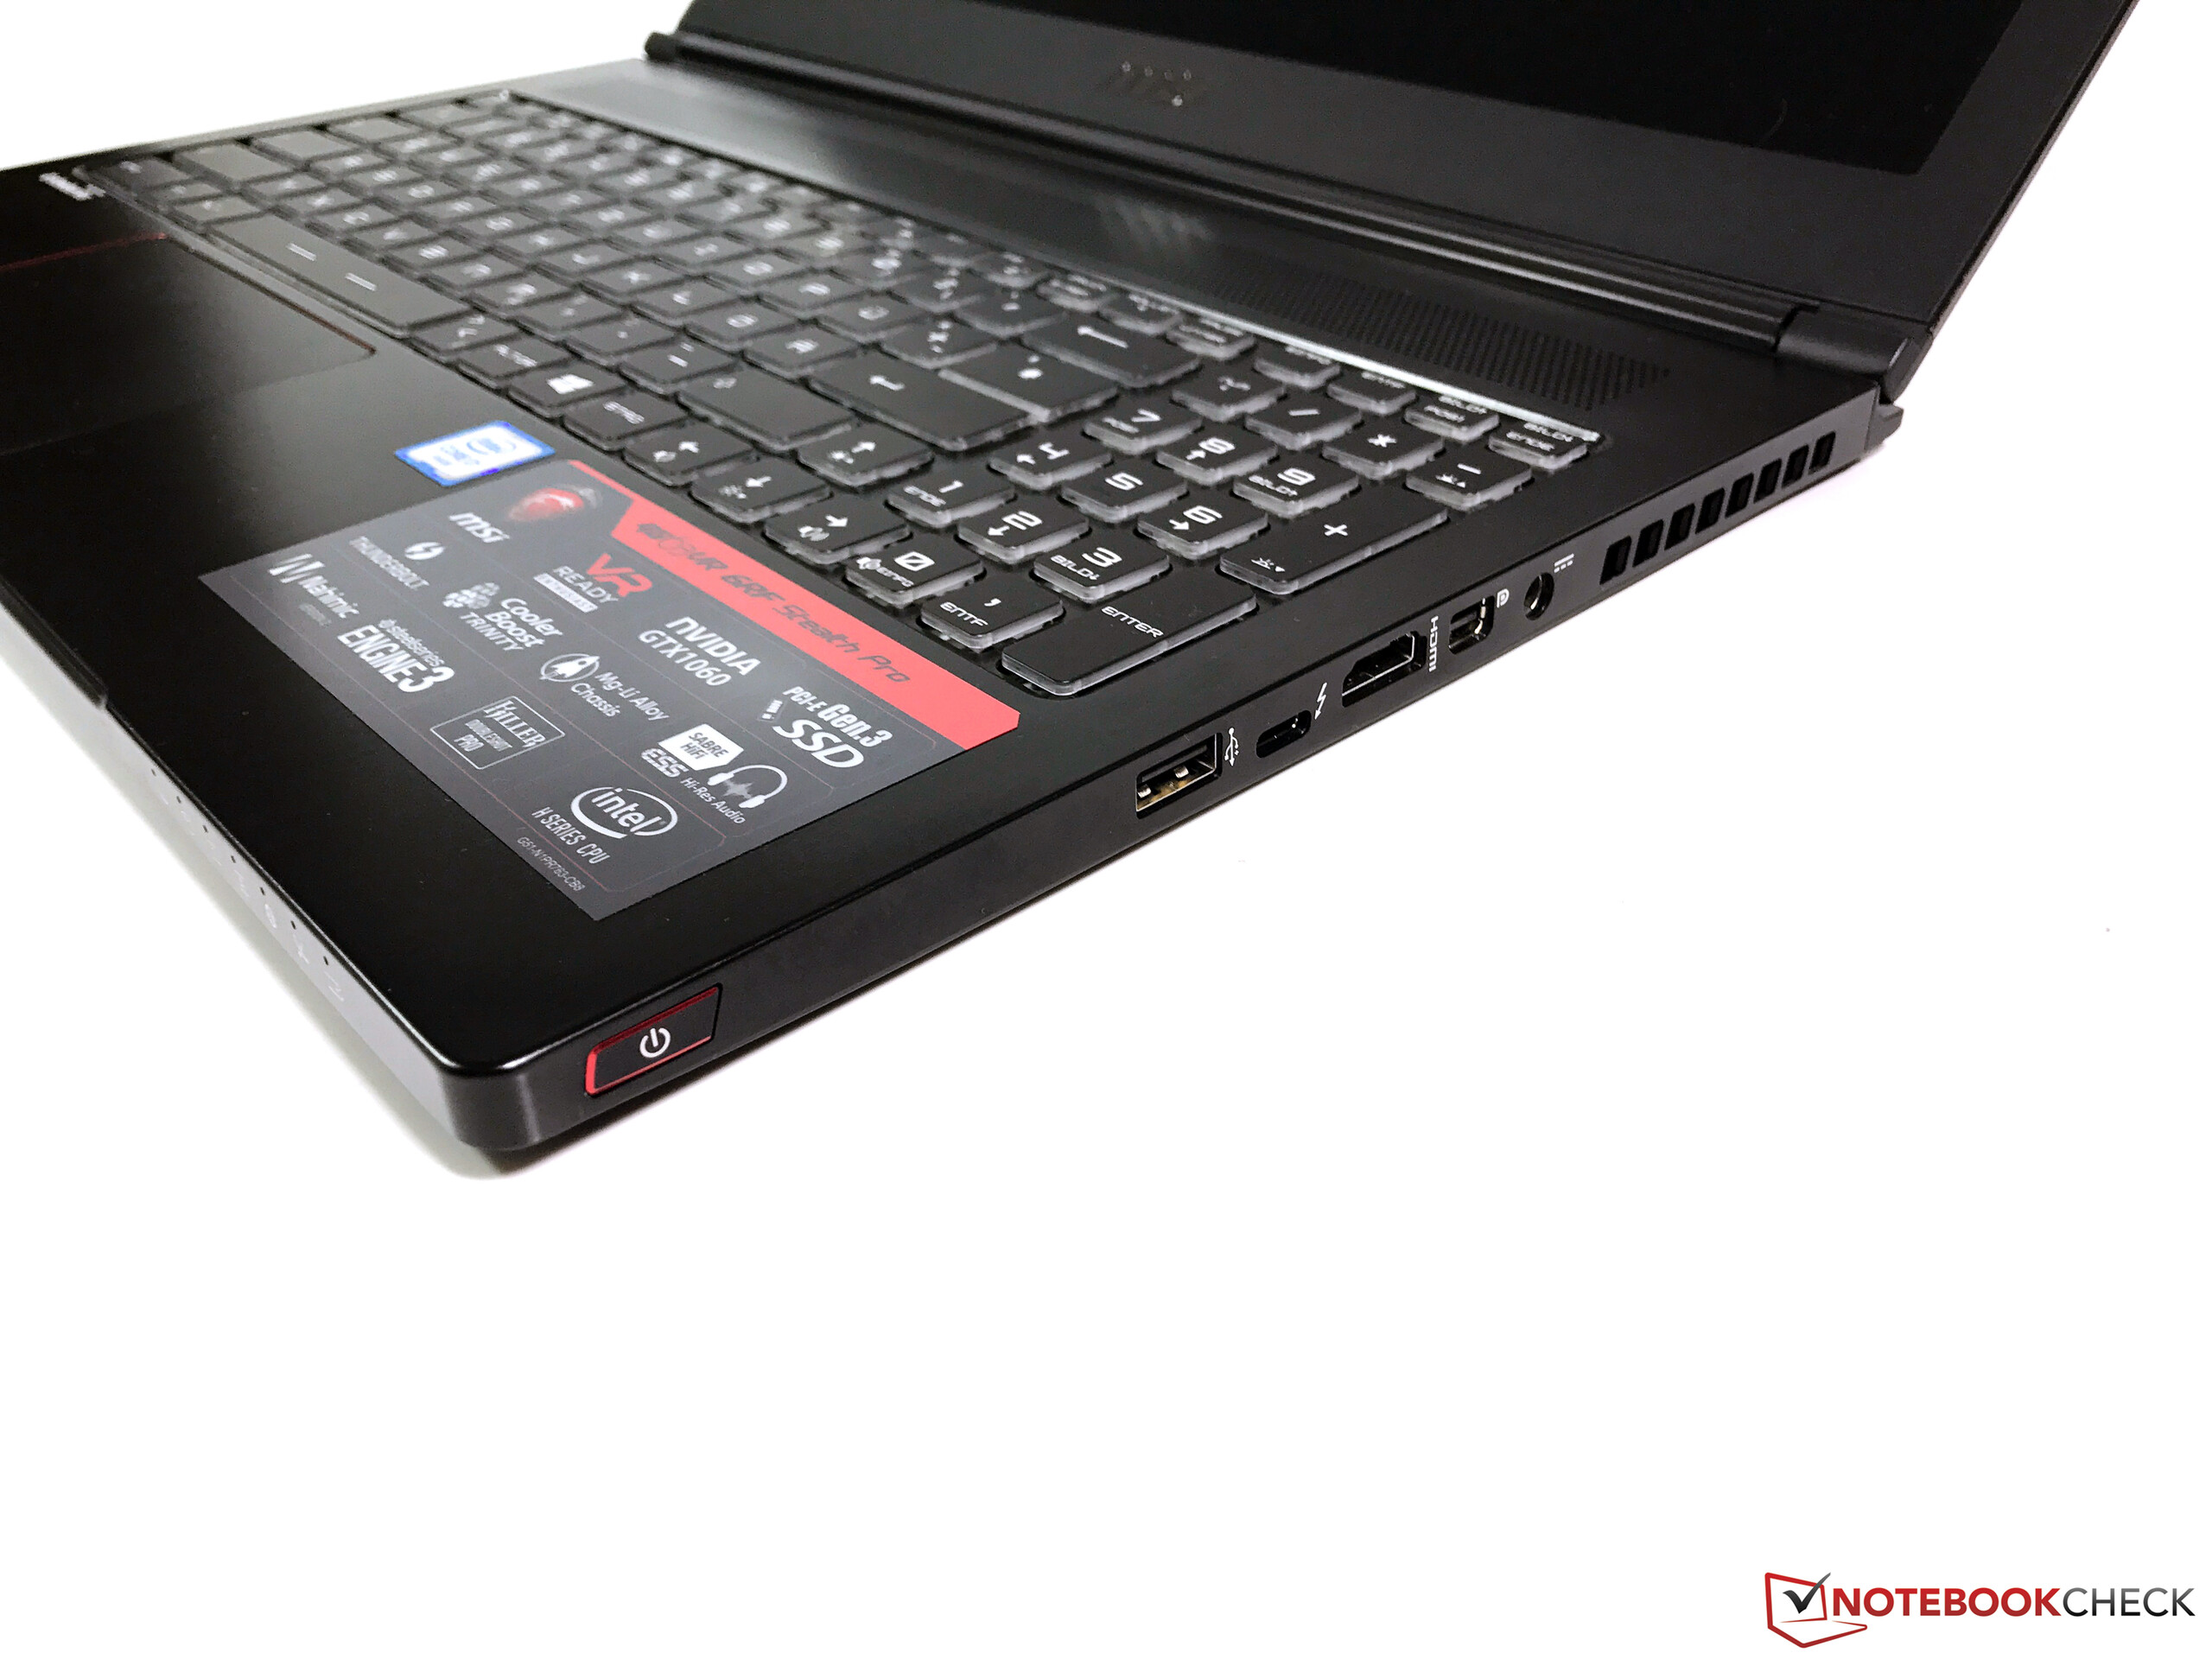
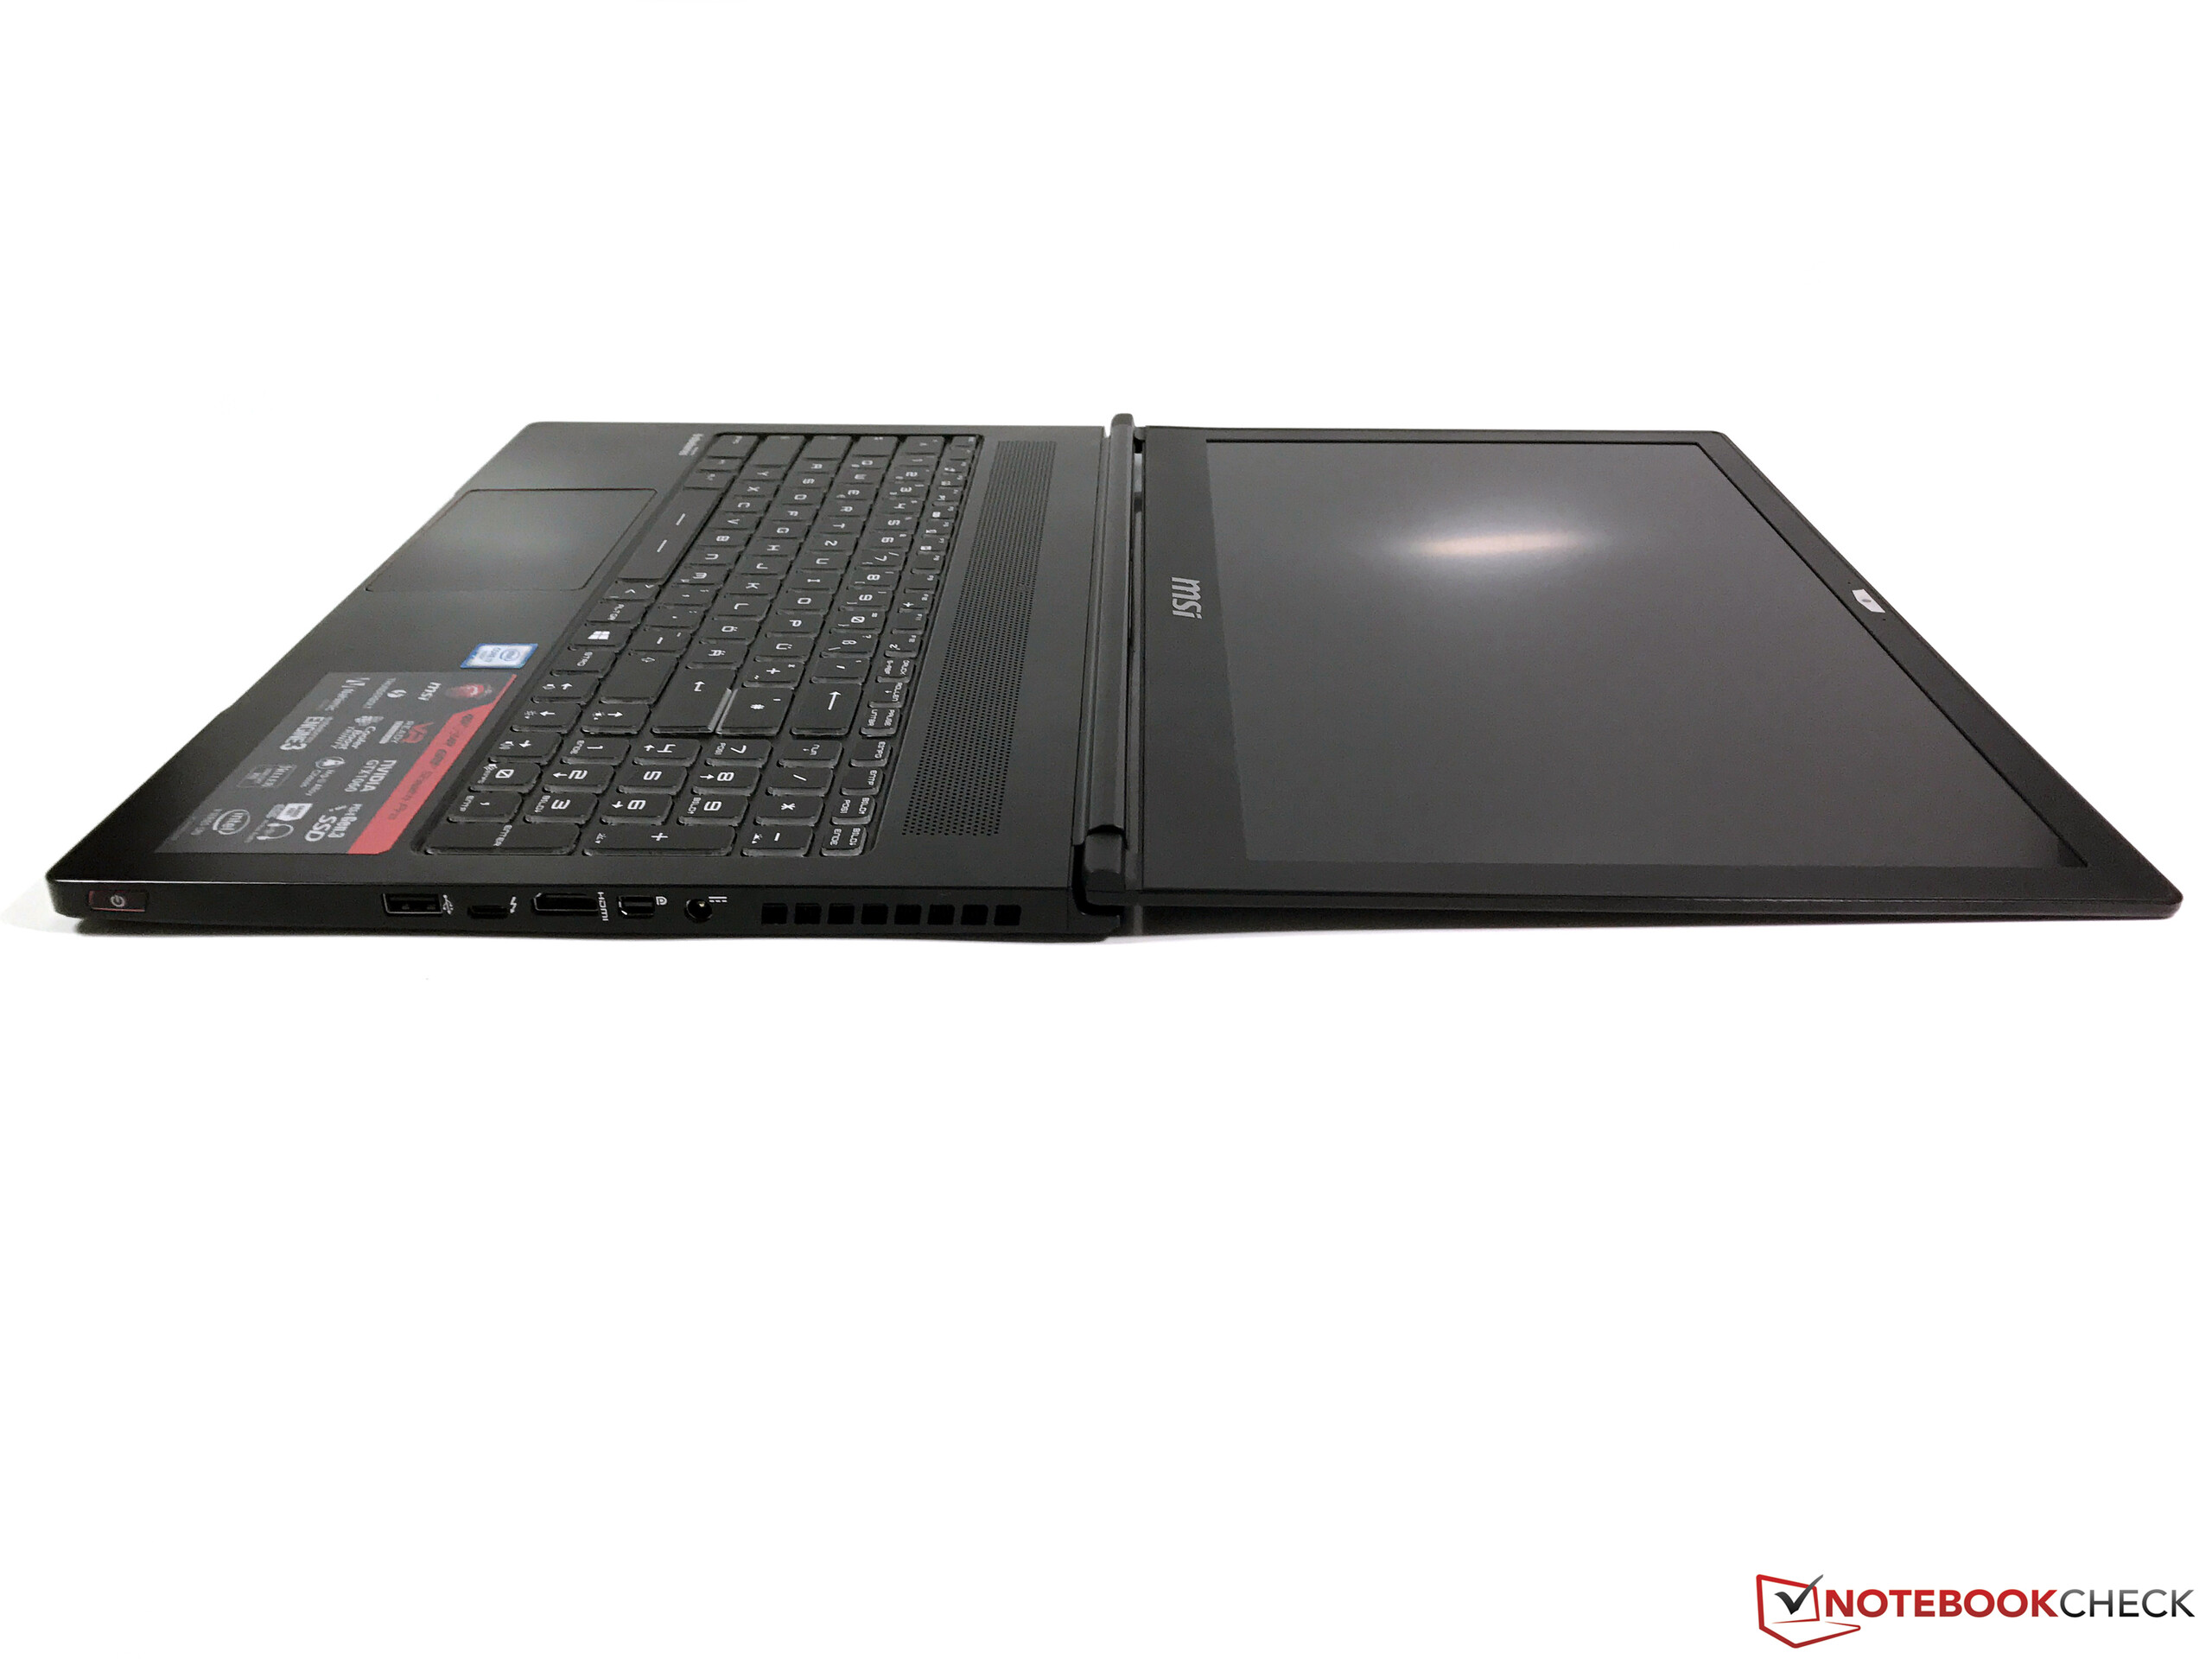
Se você segurar o MSI GS63VR em suas mãos, você não terá a impressão de que este é um portátil de jogos. O dispositivo delgado e leve tem mais semelhança com um portátil de escritório móvel. Longe disso - o hardware do dispositivo pode rodar todos os jogos mais recentes sem problemas, na tela Full HD mate com configurações gráficas altas ou até máximas. No entanto, as taxas de quadros ficam um pouco acima das dos portáteis comparáveis.
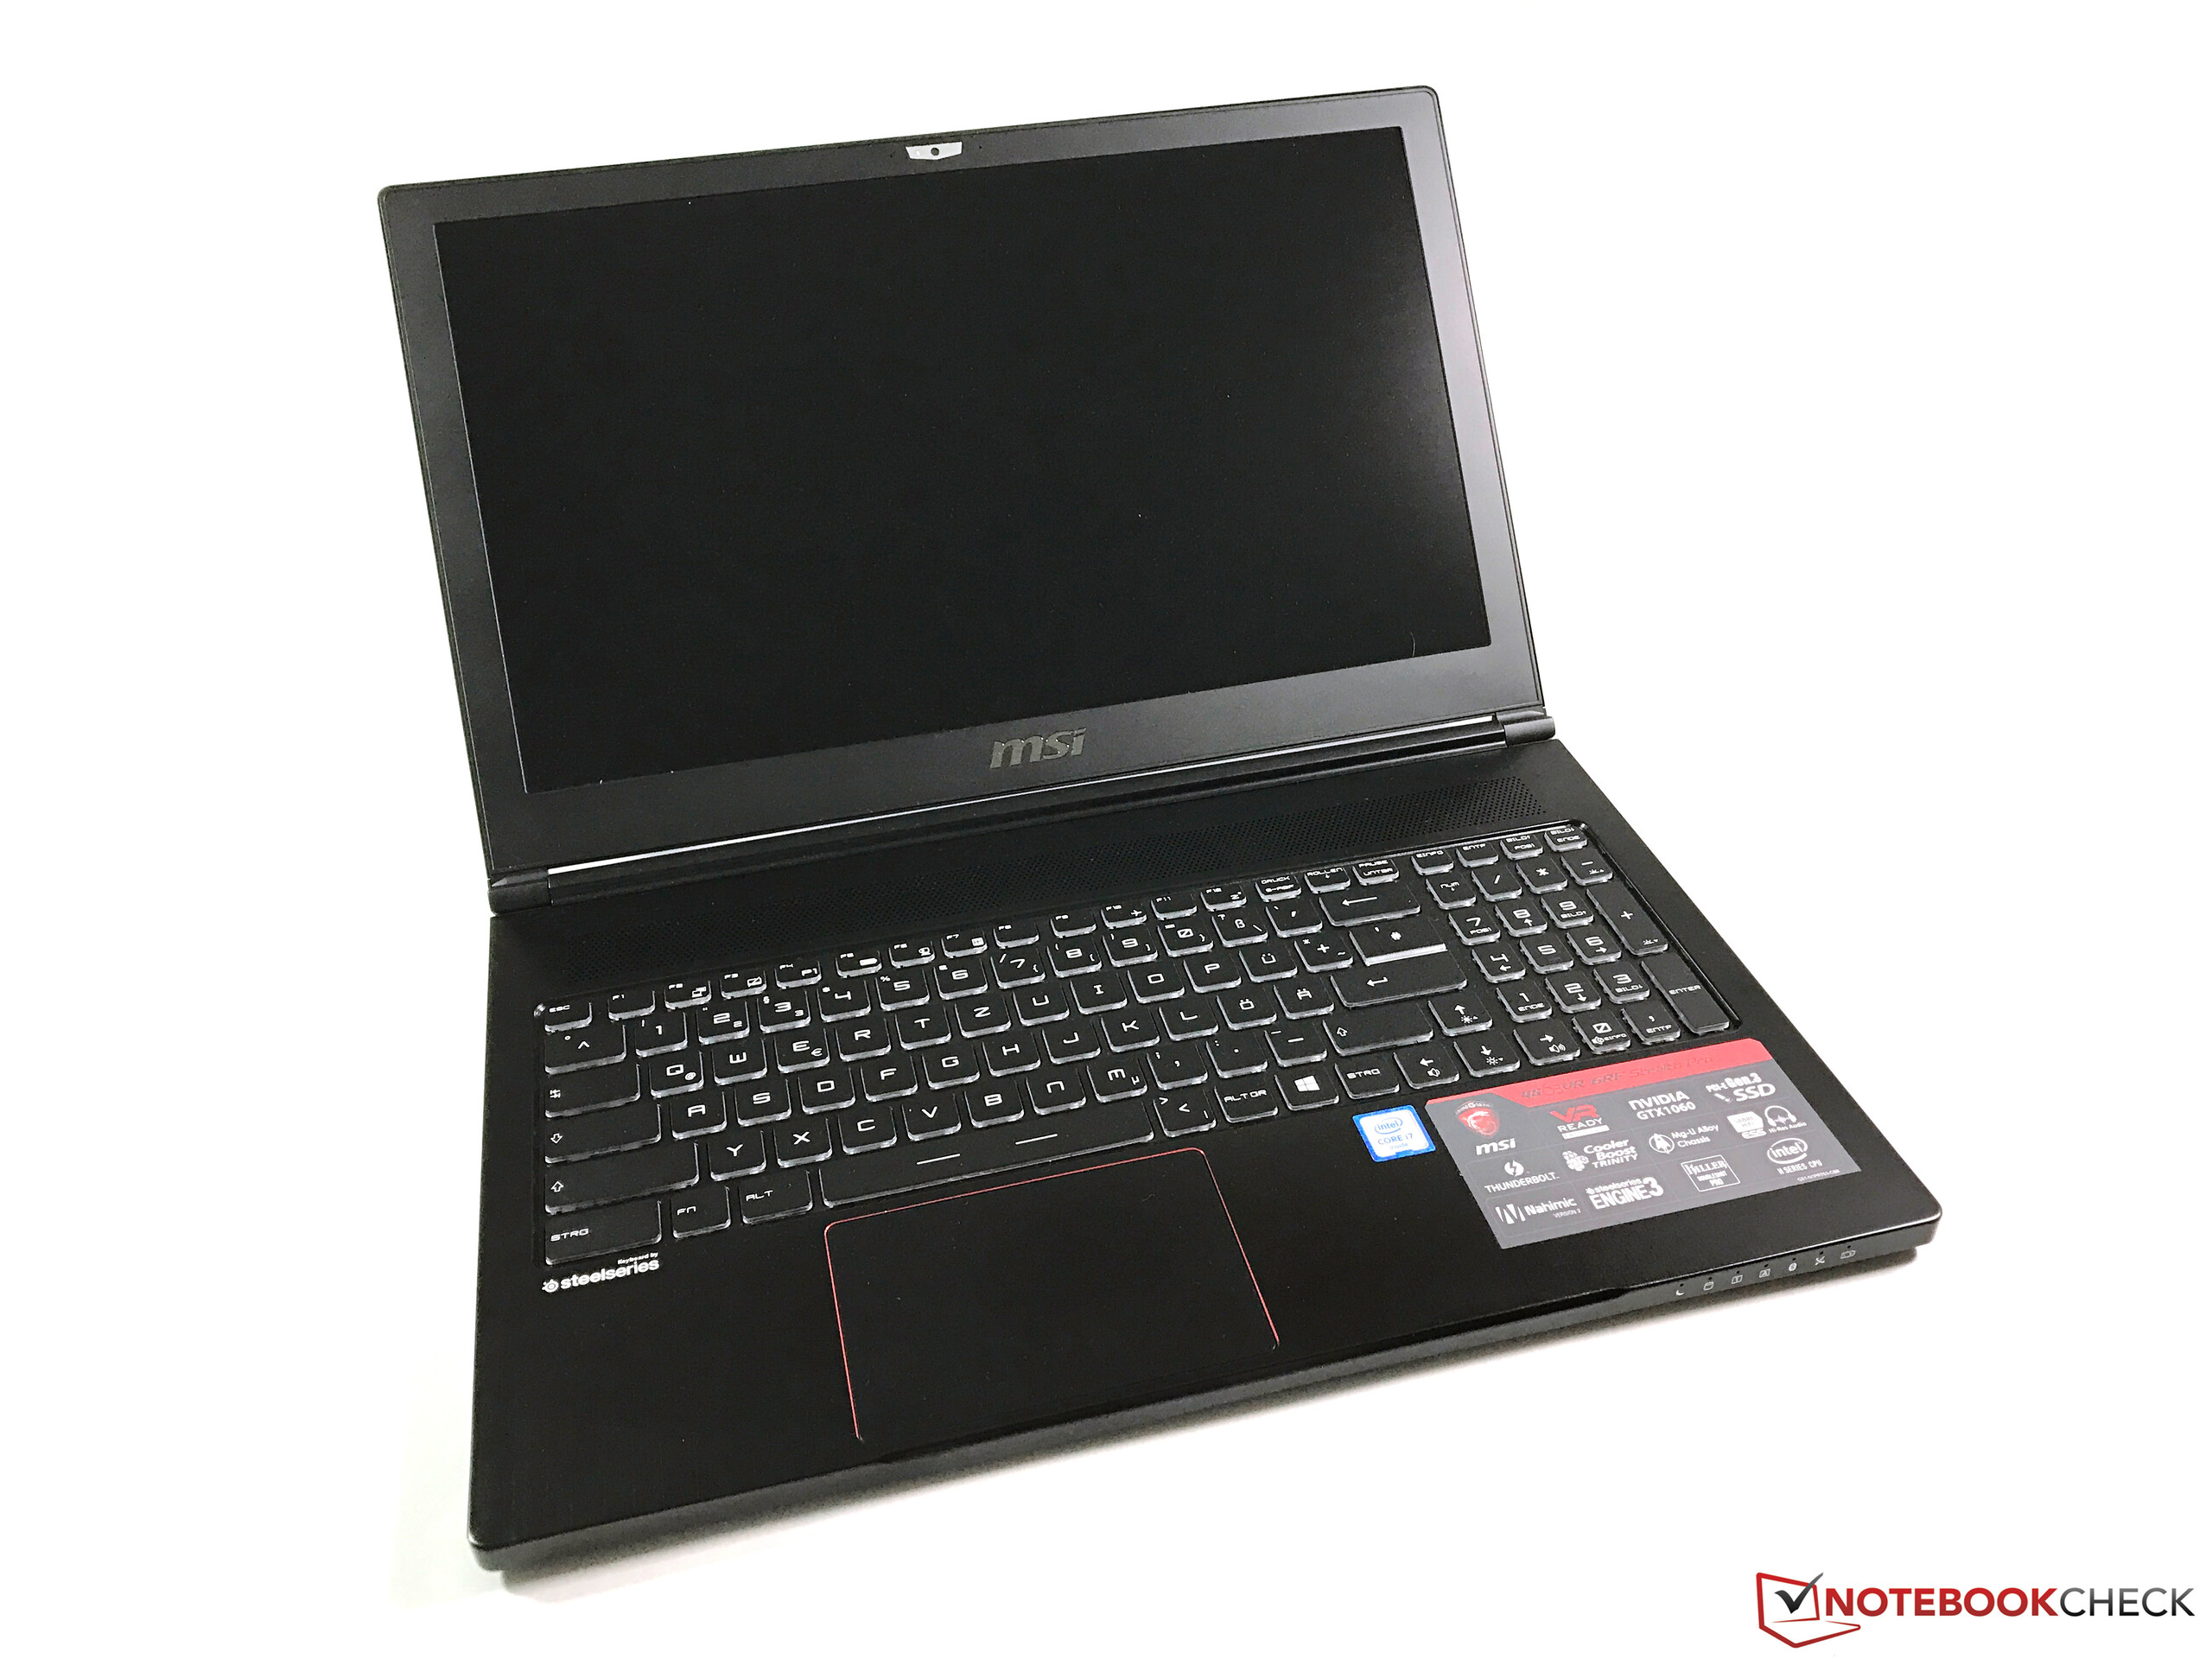
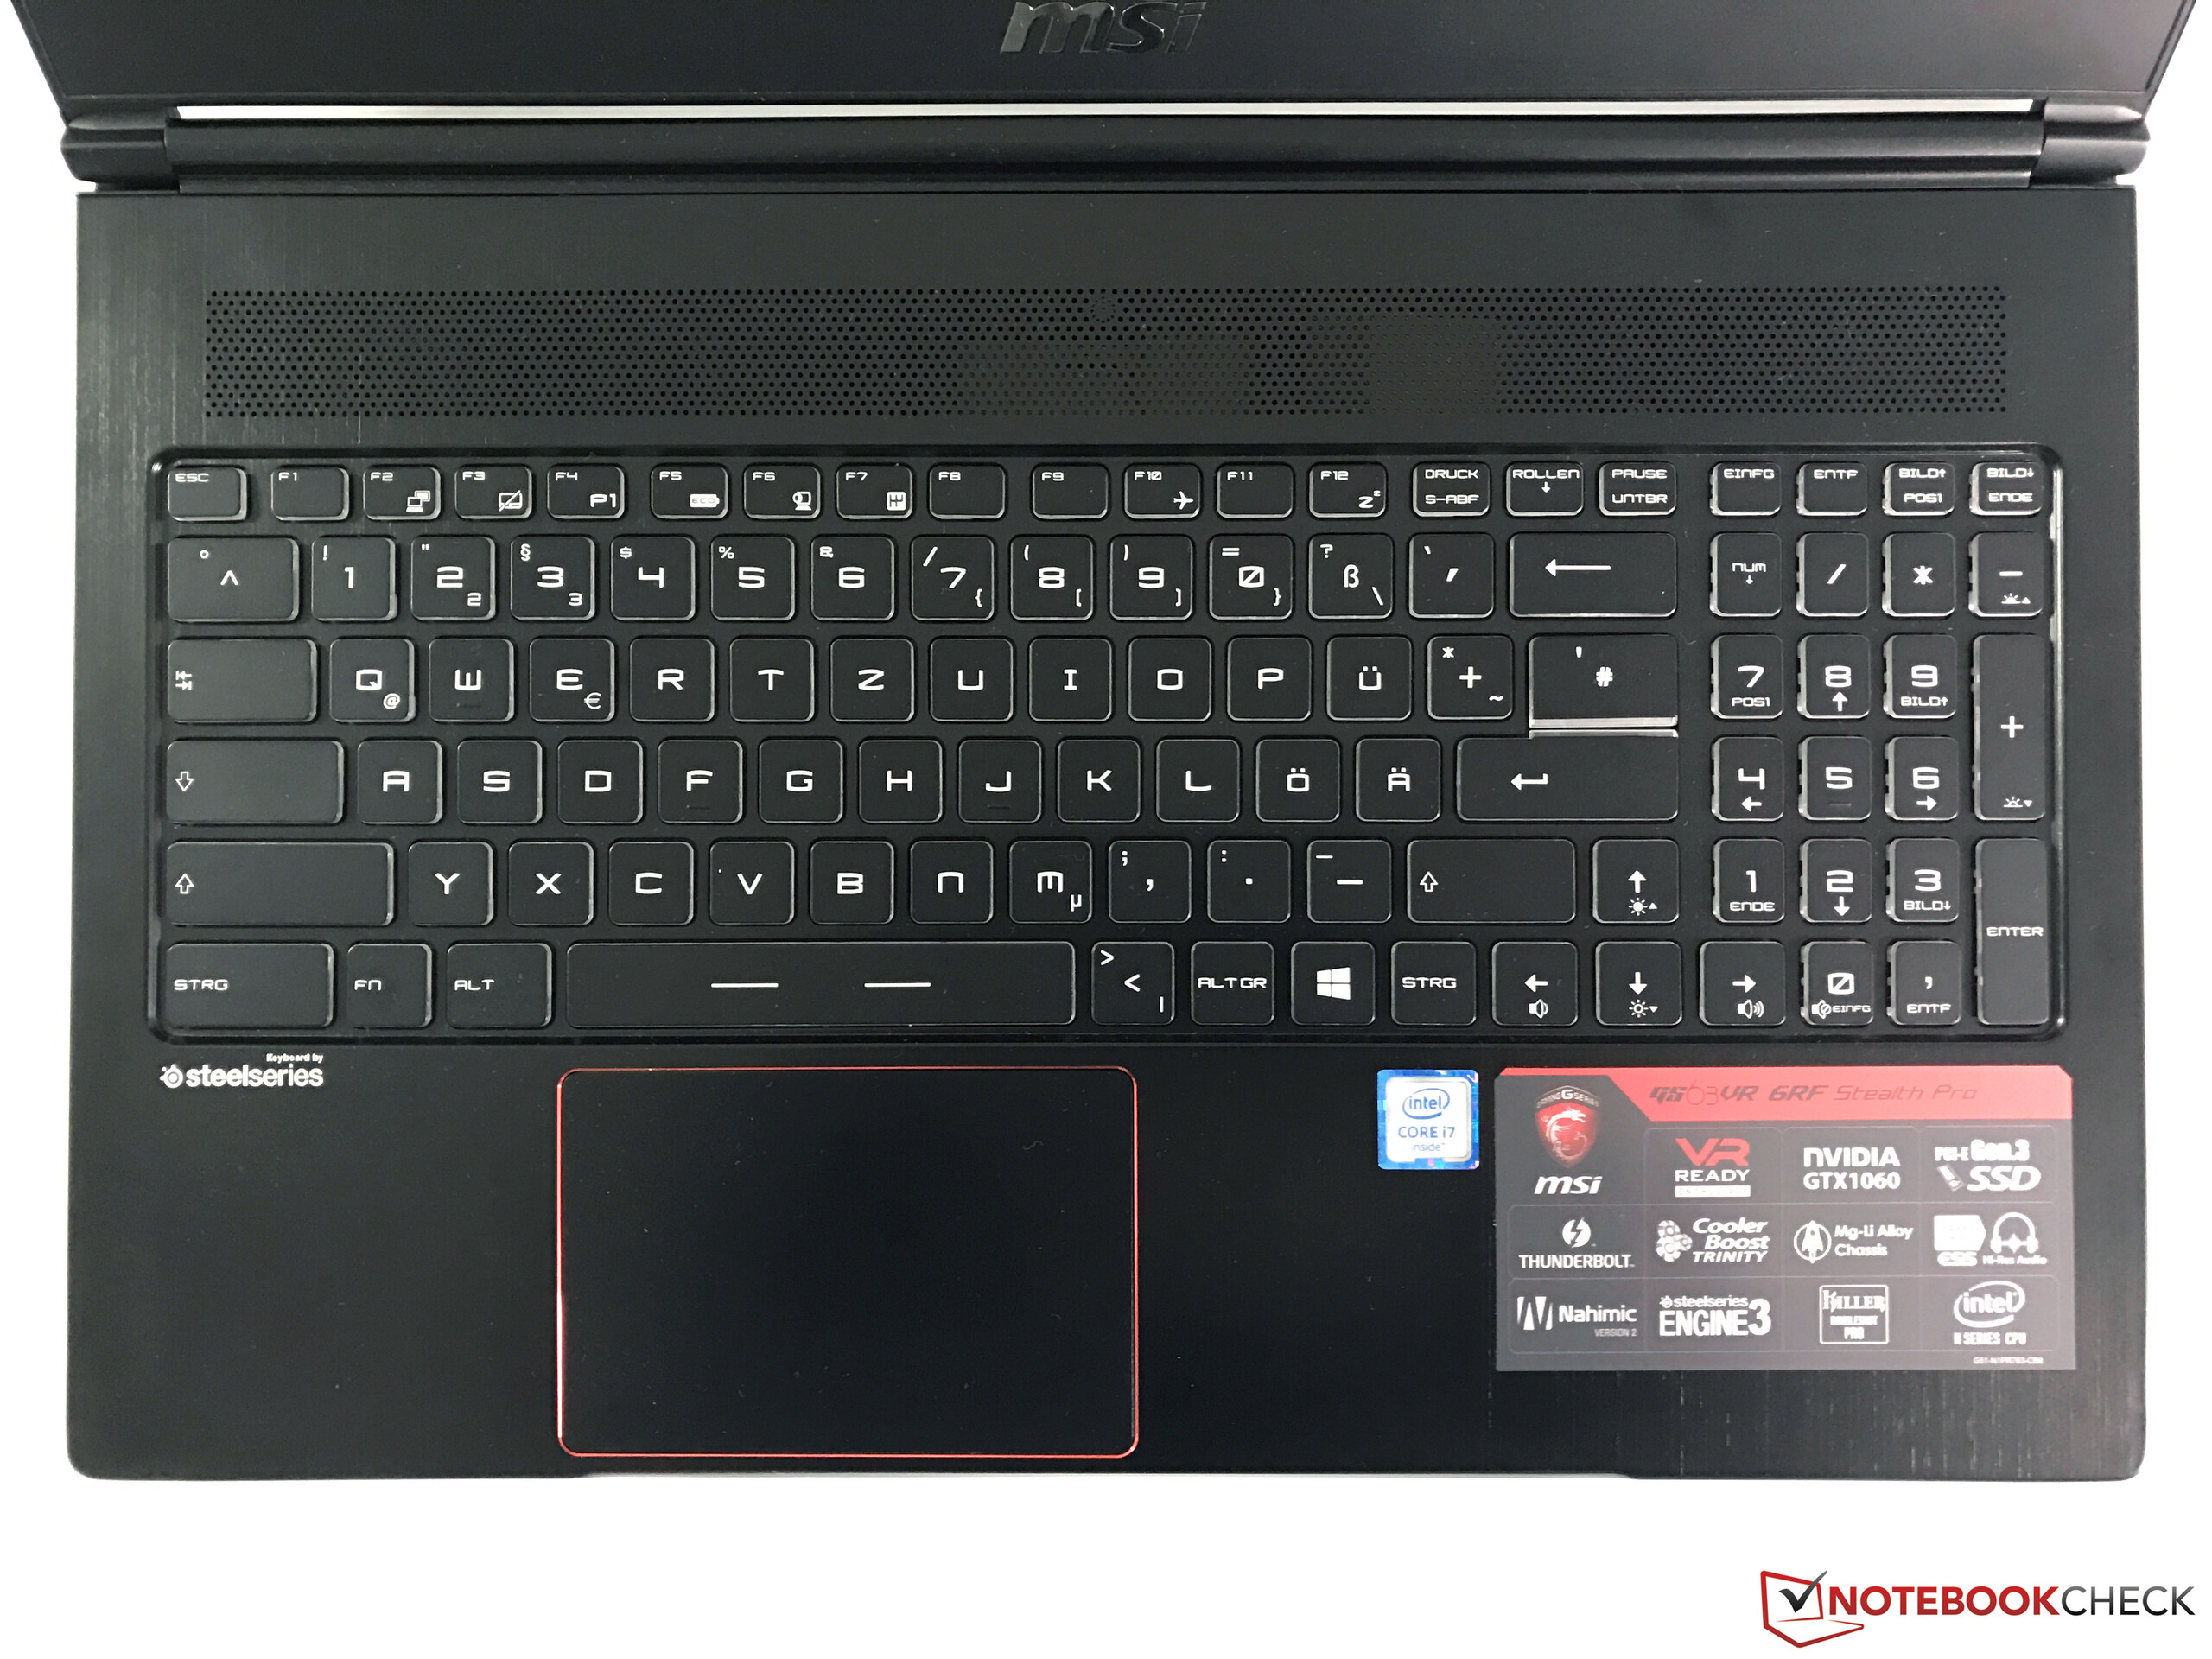
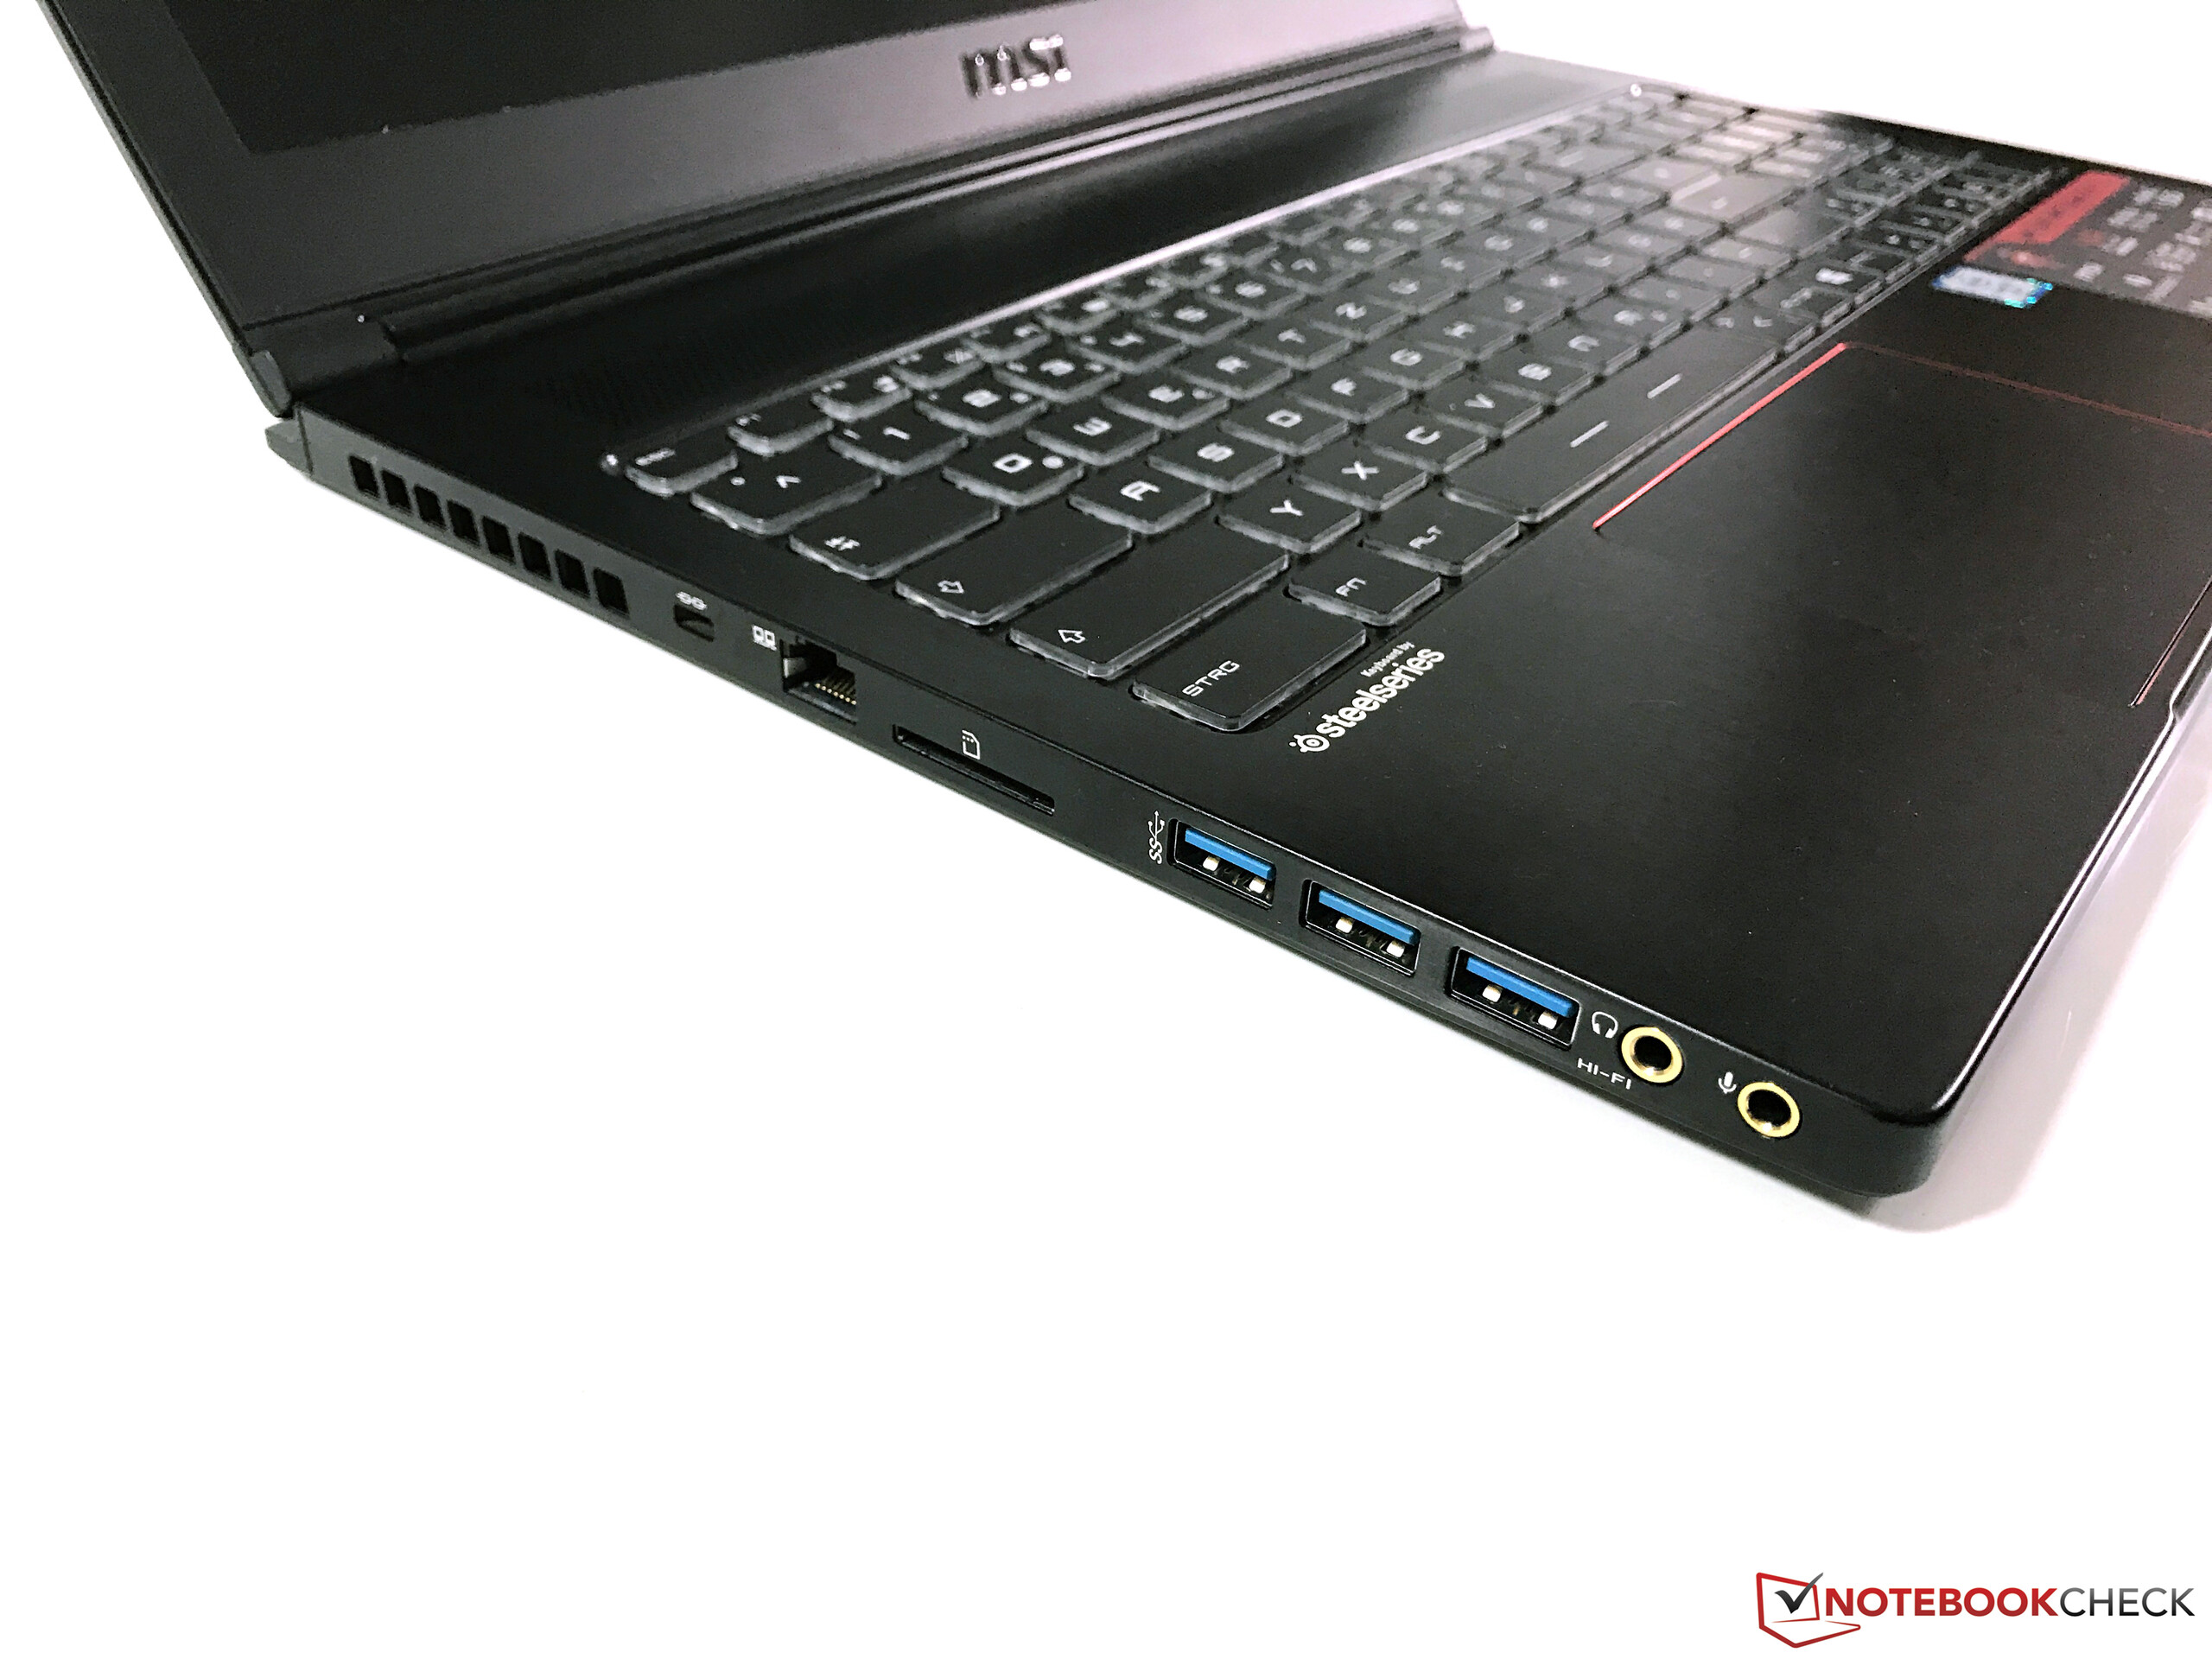
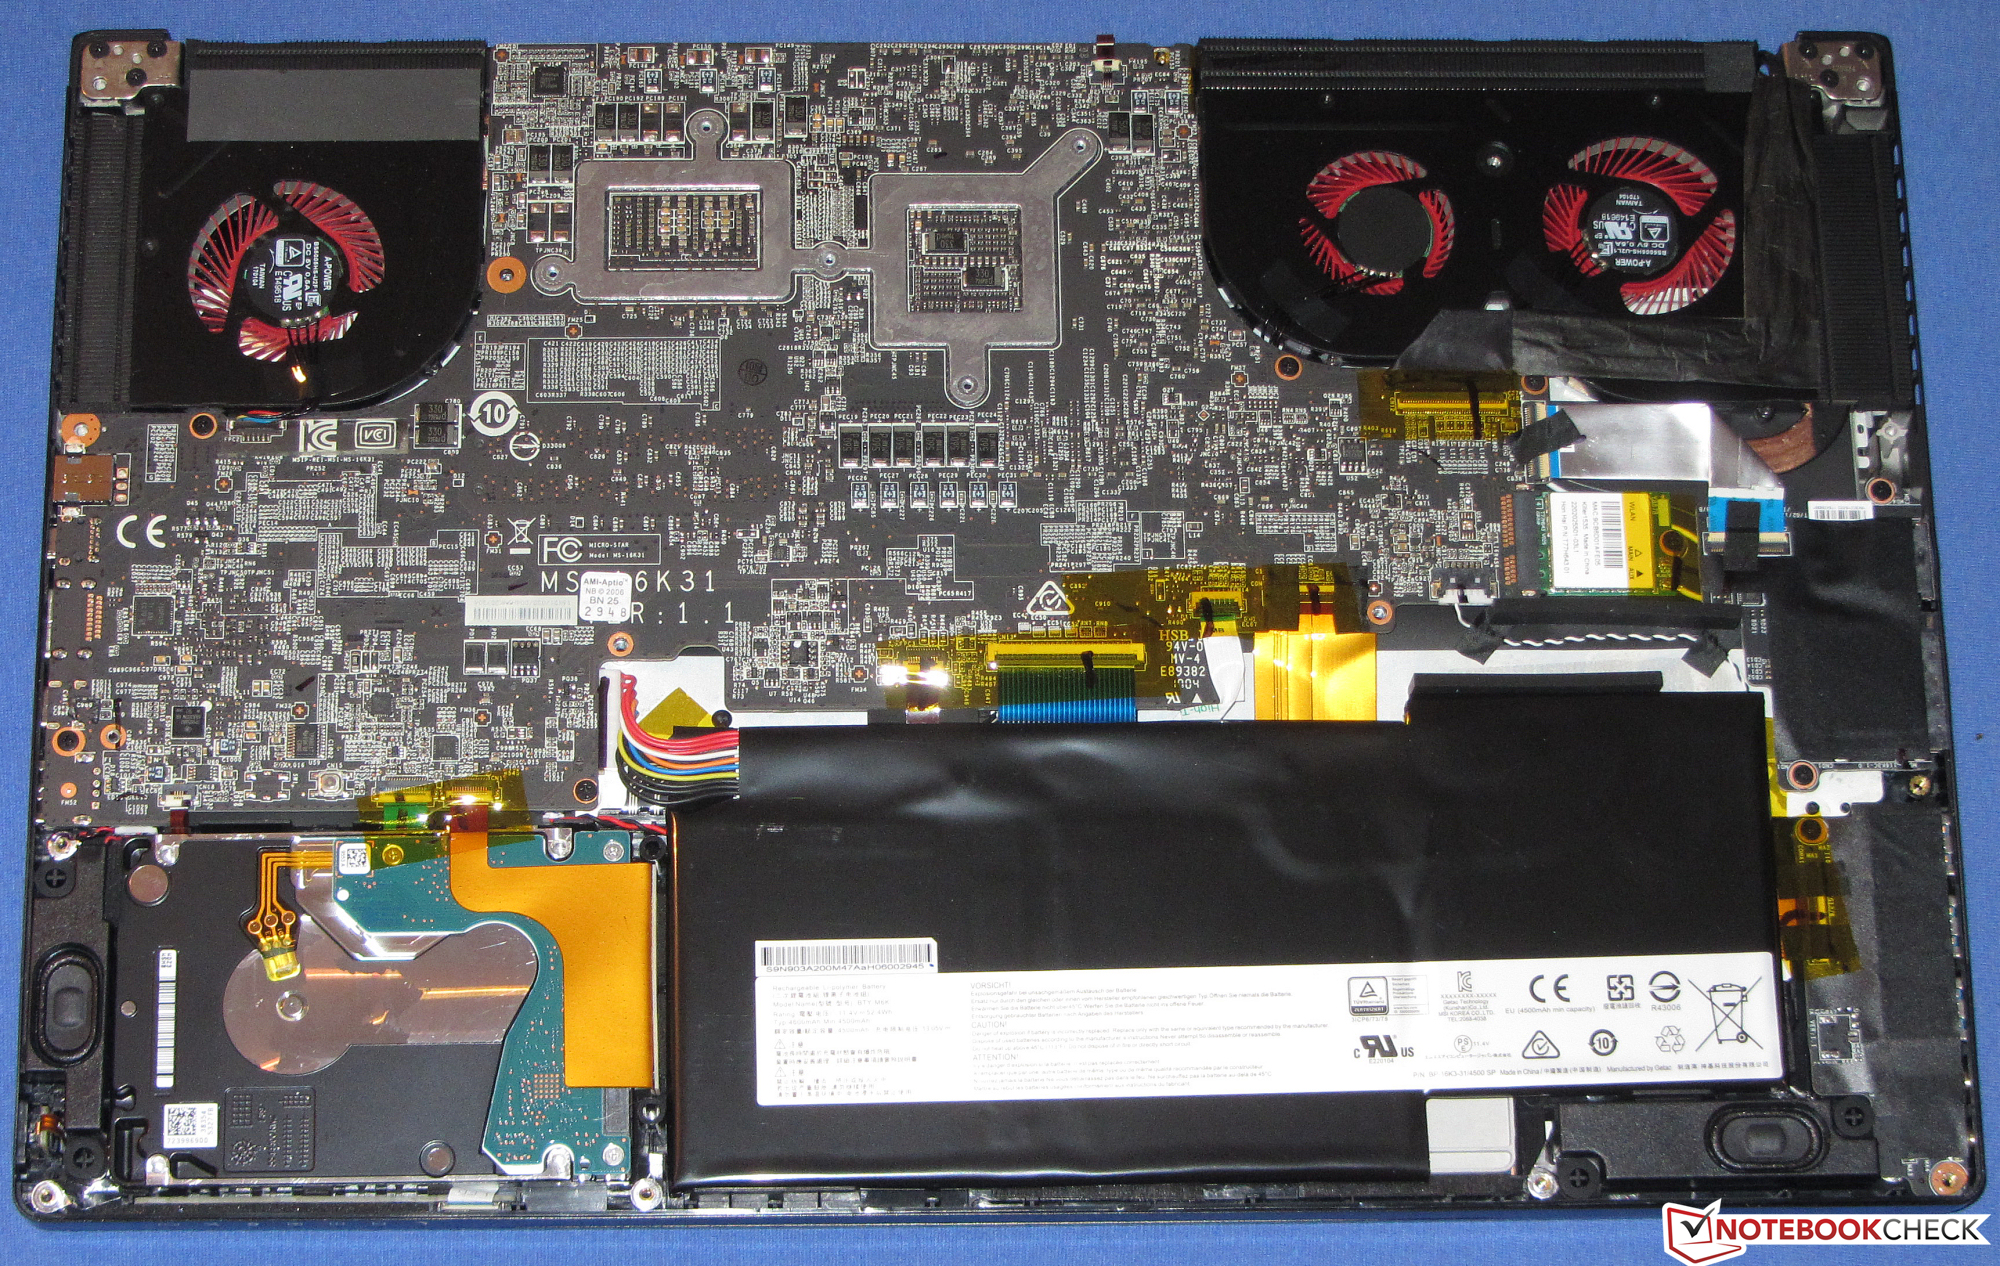
Um SSD NVMe muito veloz, possibilita um sistema muito responsivo. O SSD não pode ser facilmente substituído. Para isso, um terá que remover toda a placa-mãe. A substituição do HD de 2,5 polegadas é muito mais fácil. O bom teclado deve satisfazer qualquer pessoa que tenha que digitar muito. A bateria é boa. O leitor de cartões SD rápido e a porta Thunderbolt 3 também merecem destaque.
A MSI aposta por tempos de resposta rápidos em vez de estabilidade dos ângulos de visão.
A tela mate Full HD deleita com uma excelente relação de contraste e tempos de resposta rápidos. O brilho de um portátil com este preço deveria ter sido maior. Com o que estamos lidando aqui é uma tela TN com ângulos de visão ruins. No entanto, A MSI usa um painel TN de um tipo melhor, que tem melhores ângulos de visão do que muitos modelos que podem ser encontrados em portáteis de baixo custo.
MSI GS63VR 7RG-005
- 11/17/2017 v6 (old)
Sascha Mölck