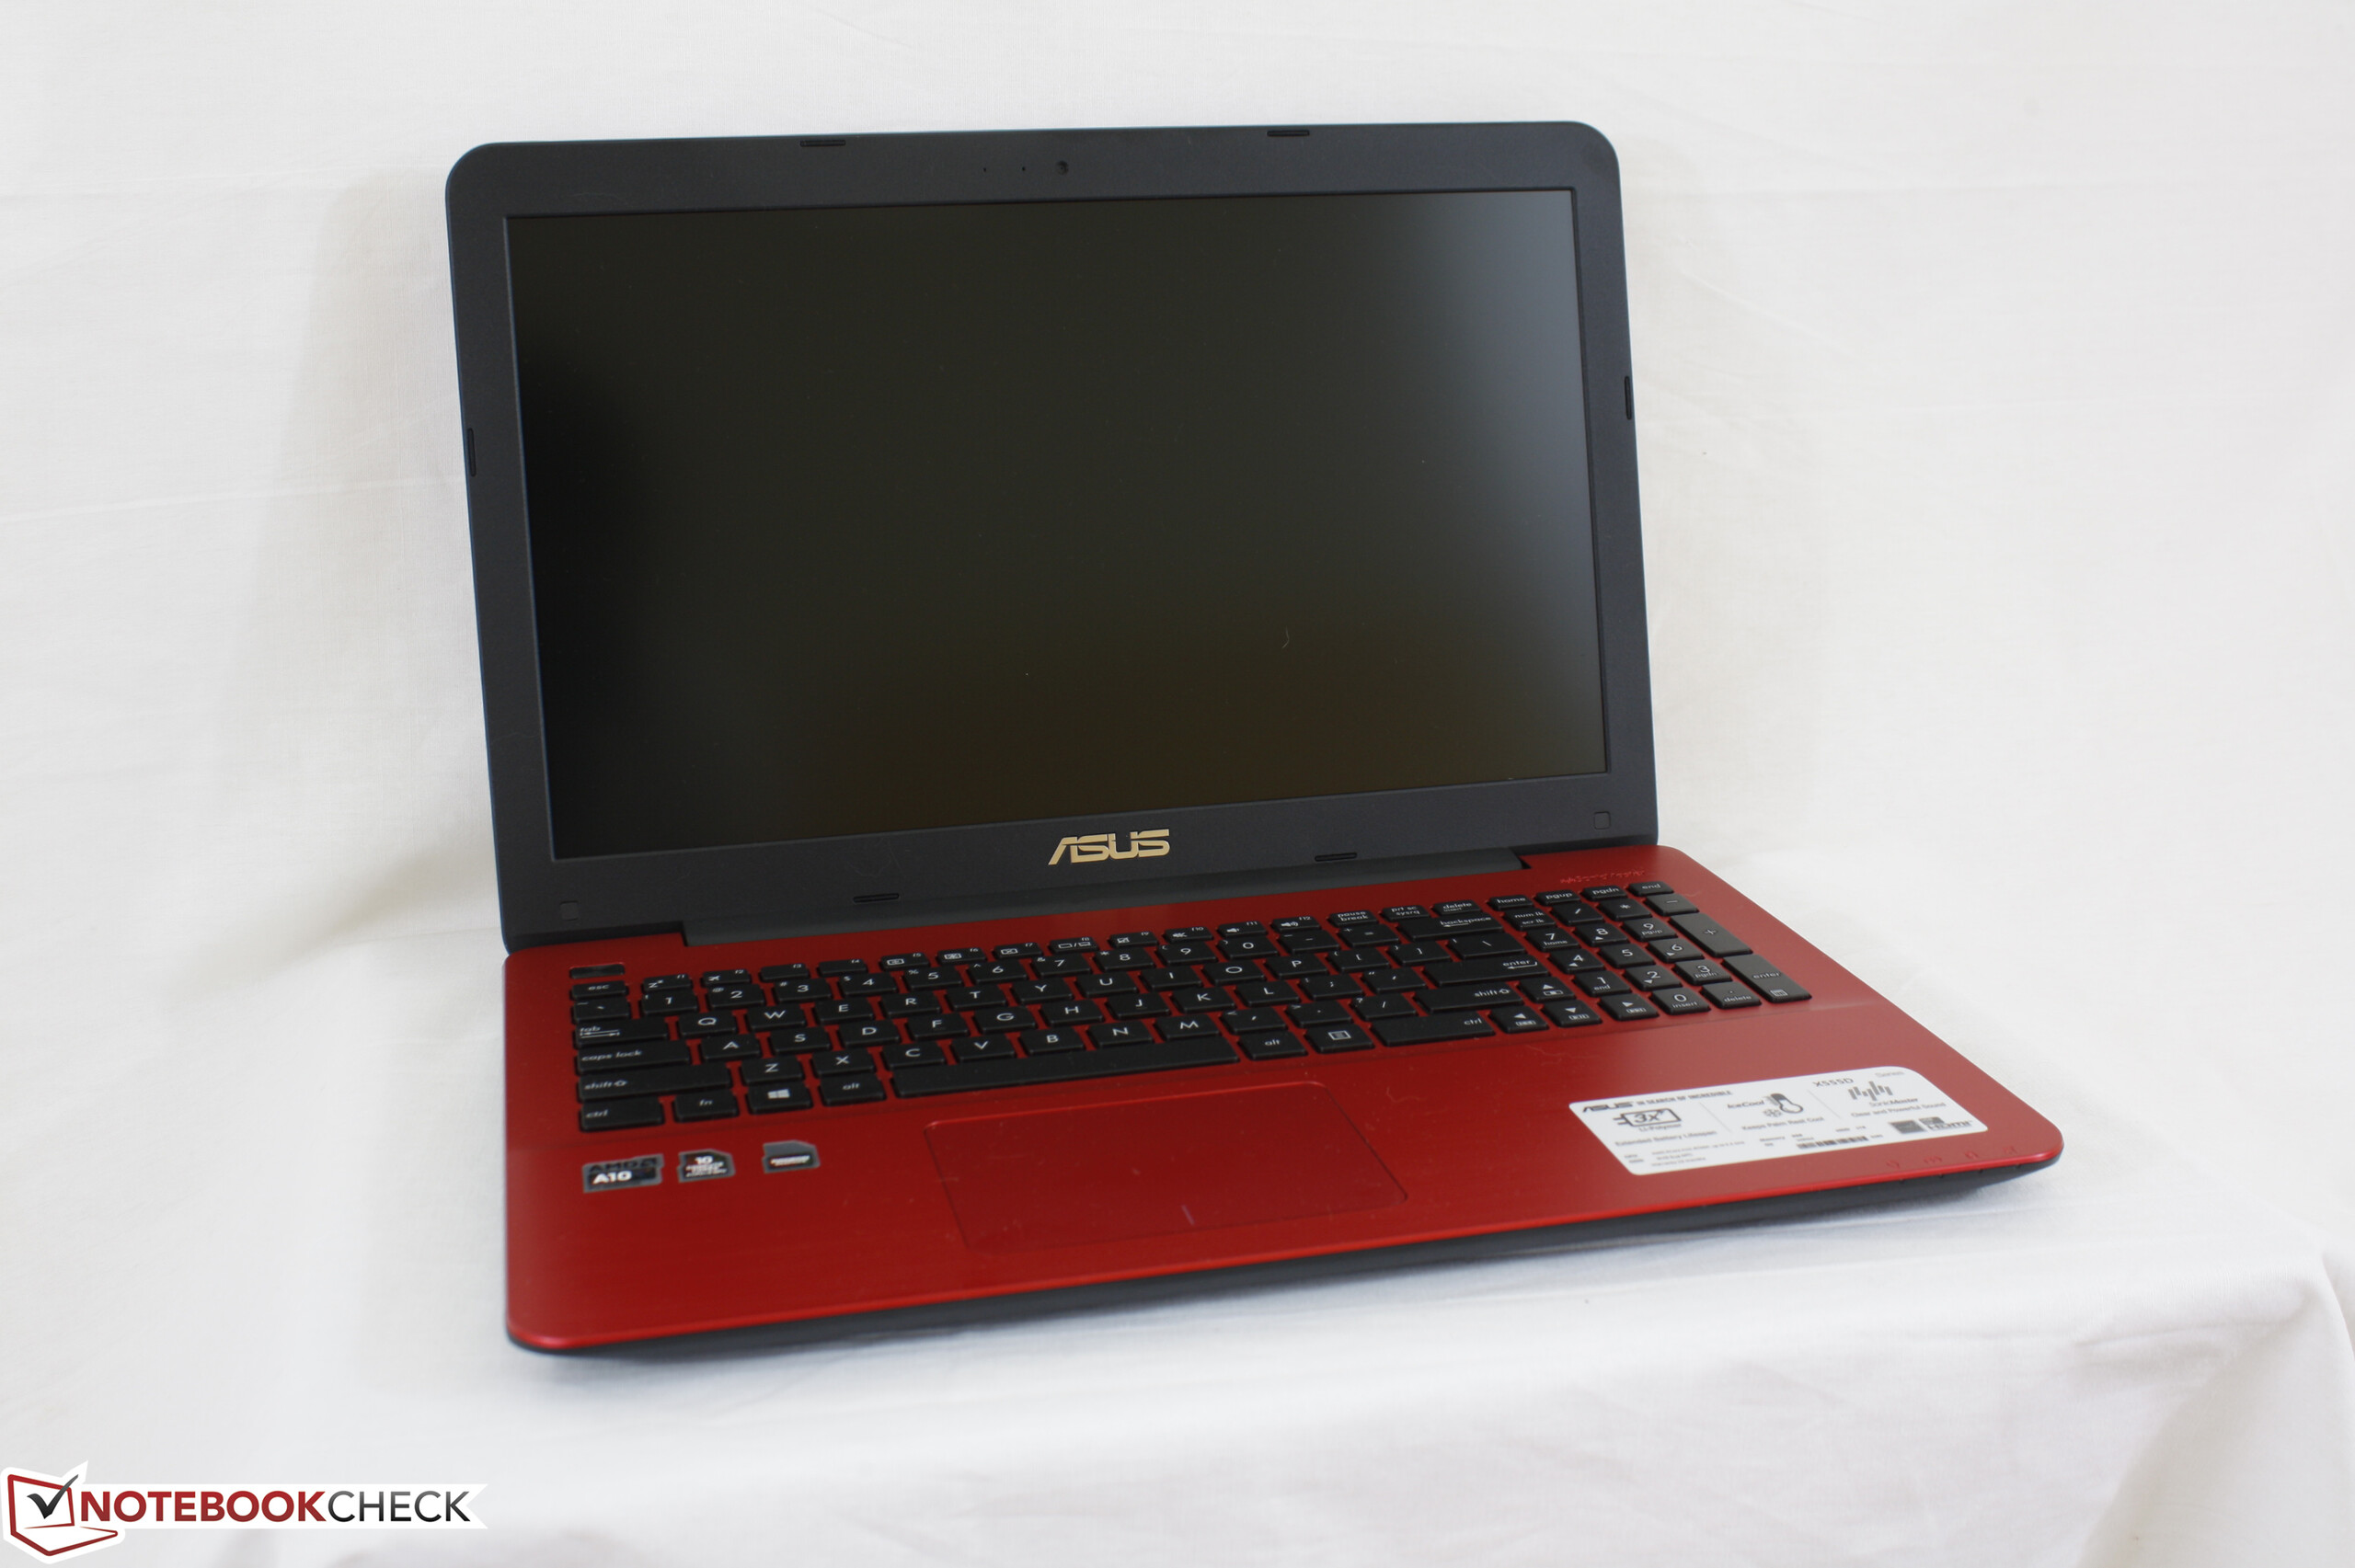
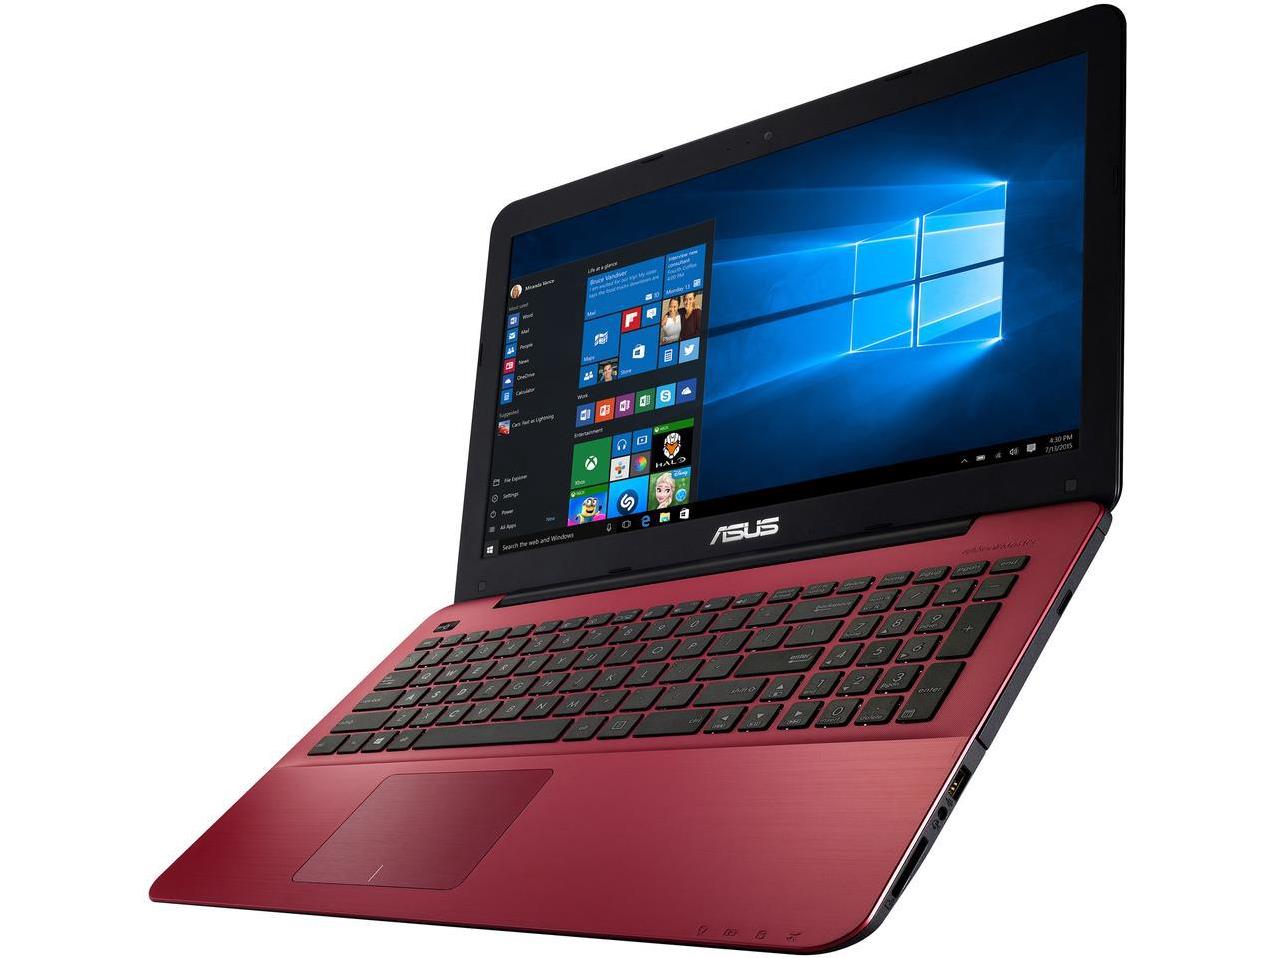
Breve Análise do Portátil Asus X555DA (A10-8700P, FHD)
| SD Card Reader | |
| average JPG Copy Test (av. of 3 runs) | |
| HP Pavilion 15t-X7P42AV | |
| Asus X555DA-BB11 | |
| Toshiba Satellite Pro R50-C-16V | |
| maximum AS SSD Seq Read Test (1GB) | |
| HP Pavilion 15t-X7P42AV | |
| Asus X555DA-BB11 | |
| Toshiba Satellite Pro R50-C-16V | |
| Networking | |
| iperf3 transmit AX12 | |
| HP Pavilion 15t-X7P42AV | |
| Toshiba Satellite Pro R50-C-16V | |
| Asus X555DA-BB11 | |
| iperf3 receive AX12 | |
| HP Pavilion 15t-X7P42AV | |
| Asus X555DA-BB11 | |
| Toshiba Satellite Pro R50-C-16V | |
| |||||||||||||||||||||||||
iluminação: 88 %
iluminação com acumulador: 242.7 cd/m²
Contraste: 467:1 (Preto: 0.52 cd/m²)
ΔE ColorChecker Calman: 4.9 | ∀{0.5-29.43 Ø4.71}
ΔE Greyscale Calman: 2.7 | ∀{0.09-98 Ø4.96}
52.5% sRGB (Argyll 1.6.3 3D)
33.5% AdobeRGB 1998 (Argyll 1.6.3 3D)
36.29% AdobeRGB 1998 (Argyll 3D)
52.7% sRGB (Argyll 3D)
35.12% Display P3 (Argyll 3D)
Gamma: 2.34
CCT: 6876 K
| Asus X555DA-BB11 TN LED, 15.6", 1920x1080 | Toshiba Satellite Pro R50-C-16V Toshiba, TN LED, 15.6", 1366x768 | Lenovo Ideapad 110-15ACL 80TJ00H0GE BOE NT156WHM-N32, TN LED, 15.6", 1366x768 | HP Pavilion 15t-X7P42AV AU Optronics AUO41ED, IPS, 15.6", 1920x1080 | Asus X555LN-XO112H AU Optronics B156XW04 V6, TN LED, 15.6", 1366x768 | |
|---|---|---|---|---|---|
| Display | 16% | 6% | 8% | 41% | |
| Display P3 Coverage (%) | 35.12 | 40.6 16% | 37.39 6% | 38.03 8% | 49.95 42% |
| sRGB Coverage (%) | 52.7 | 61.2 16% | 56.2 7% | 56.5 7% | 73.9 40% |
| AdobeRGB 1998 Coverage (%) | 36.29 | 41.95 16% | 38.63 6% | 39.29 8% | 51.7 42% |
| Response Times | -39% | -21% | -14% | ||
| Response Time Grey 50% / Grey 80% * (ms) | 42 ? | 68 ? -62% | 58 -38% | 44.4 ? -6% | |
| Response Time Black / White * (ms) | 22.4 ? | 26 ? -16% | 23 -3% | 27.2 ? -21% | |
| PWM Frequency (Hz) | 217 ? | 200 ? | |||
| Screen | -40% | -32% | -7% | -86% | |
| Brightness middle (cd/m²) | 242.7 | 226 -7% | 253 4% | 209.7 -14% | 189 -22% |
| Brightness (cd/m²) | 232 | 217 -6% | 246 6% | 193 -17% | 184 -21% |
| Brightness Distribution (%) | 88 | 91 3% | 86 -2% | 75 -15% | 92 5% |
| Black Level * (cd/m²) | 0.52 | 0.58 -12% | 0.44 15% | 0.19 63% | 2.2 -323% |
| Contrast (:1) | 467 | 390 -16% | 575 23% | 1104 136% | 86 -82% |
| Colorchecker dE 2000 * | 4.9 | 9.84 -101% | 9.2 -88% | 7.8 -59% | 7.77 -59% |
| Colorchecker dE 2000 max. * | 20.3 | 16.77 17% | 17.68 13% | 24.1 -19% | |
| Greyscale dE 2000 * | 2.7 | 11.1 -311% | 11.05 -309% | 7.3 -170% | 8.82 -227% |
| Gamma | 2.34 94% | 2.35 94% | 2.55 86% | 2.39 92% | 2.43 91% |
| CCT | 6876 95% | 11979 54% | 11451 57% | 5771 113% | 9275 70% |
| Color Space (Percent of AdobeRGB 1998) (%) | 33.5 | 39 16% | 36 7% | 39.3 17% | 48 43% |
| Color Space (Percent of sRGB) (%) | 52.5 | 61 16% | 56 7% | 56.5 8% | |
| Média Total (Programa/Configurações) | -21% /
-29% | -16% /
-23% | -4% /
-5% | -23% /
-51% |
* ... menor é melhor
Exibir tempos de resposta
| ↔ Tempo de resposta preto para branco | ||
|---|---|---|
| 22.4 ms ... ascensão ↗ e queda ↘ combinadas | ↗ 14.4 ms ascensão | 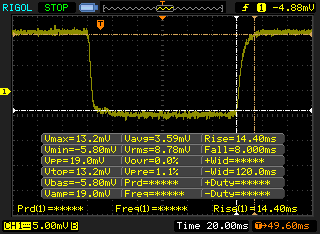 |
| ↘ 8 ms queda | ||
| A tela mostra boas taxas de resposta em nossos testes, mas pode ser muito lenta para jogadores competitivos. Em comparação, todos os dispositivos testados variam de 0.1 (mínimo) a 240 (máximo) ms. » 51 % de todos os dispositivos são melhores. Isso significa que o tempo de resposta medido é pior que a média de todos os dispositivos testados (19.8 ms). | ||
| ↔ Tempo de resposta 50% cinza a 80% cinza | ||
| 42 ms ... ascensão ↗ e queda ↘ combinadas | ↗ 23.6 ms ascensão | 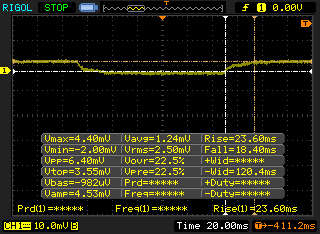 |
| ↘ 18.4 ms queda | ||
| A tela mostra taxas de resposta lentas em nossos testes e será insatisfatória para os jogadores. Em comparação, todos os dispositivos testados variam de 0.165 (mínimo) a 636 (máximo) ms. » 67 % de todos os dispositivos são melhores. Isso significa que o tempo de resposta medido é pior que a média de todos os dispositivos testados (31 ms). | ||
Cintilação da tela / PWM (modulação por largura de pulso)
| Tela tremeluzindo / PWM não detectado | 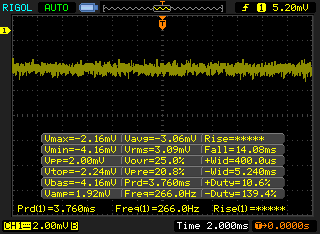 | ||
[pwm_comparison] Em comparação: 52 % de todos os dispositivos testados não usam PWM para escurecer a tela. Se PWM foi detectado, uma média de 7757 (mínimo: 5 - máximo: 343500) Hz foi medida. | |||
| Cinebench R10 | |
| Rendering Multiple CPUs 32Bit | |
| HP ProBook 640 G2-T9X60ET | |
| HP 250 G4 T6P08ES | |
| Lenovo IdeaPad Z40-59422614 | |
| Microsoft Surface Pro 4, Core m3 | |
| Asus X555DA-BB11 | |
| Dell Venue 10 Pro 5056 | |
| Toshiba Satellite Click 10 LX0W-C-104 | |
| Rendering Single 32Bit | |
| HP ProBook 640 G2-T9X60ET | |
| HP 250 G4 T6P08ES | |
| Lenovo IdeaPad Z40-59422614 | |
| Microsoft Surface Pro 4, Core m3 | |
| Asus X555DA-BB11 | |
| Dell Venue 10 Pro 5056 | |
| Toshiba Satellite Click 10 LX0W-C-104 | |
| wPrime 2.10 - 1024m | |
| Lenovo IdeaPad Z40-59422614 | |
| Microsoft Surface Pro 4, Core m3 | |
| Lenovo ThinkPad X1 Tablet | |
| Asus X555DA-BB11 | |
* ... menor é melhor
| PCMark 8 | |
| Home Score Accelerated v2 | |
| HP Pavilion 15t-X7P42AV | |
| Asus Vivobook F556UQ-XO626D | |
| Toshiba Satellite Pro R50-C-16V | |
| Asus X555DA-BB11 | |
| Lenovo Ideapad 110-15ACL 80TJ00H0GE | |
| Work Score Accelerated v2 | |
| Asus Vivobook F556UQ-XO626D | |
| Toshiba Satellite Pro R50-C-16V | |
| Asus X555DA-BB11 | |
| HP Pavilion 15t-X7P42AV | |
| Creative Score Accelerated v2 | |
| HP Pavilion 15t-X7P42AV | |
| Asus Vivobook F556UQ-XO626D | |
| Toshiba Satellite Pro R50-C-16V | |
| Asus X555DA-BB11 | |
| PCMark 8 Home Score Accelerated v2 | 2335 pontos | |
| PCMark 8 Creative Score Accelerated v2 | 2856 pontos | |
| PCMark 8 Work Score Accelerated v2 | 3246 pontos | |
Ajuda | ||
| Asus X555DA-BB11 Seagate Momentus SpinPoint M8 ST1000LM024 HN-M101MBB | Toshiba Satellite Pro R50-C-16V TOSHIBA MQ01ABD075 | Lenovo Ideapad 110-15ACL 80TJ00H0GE Seagate Mobile HDD 1TB ST1000LM035 | HP Pavilion 15t-X7P42AV Samsung CM871a MZNTY128HDHP | Asus X555LN-XO112H Toshiba MQ01ABF050 | |
|---|---|---|---|---|---|
| CrystalDiskMark 3.0 | -12% | -13% | 12908% | 28% | |
| Read Seq (MB/s) | 106.9 | 96.5 -10% | 92.1 -14% | 522 388% | 105.8 -1% |
| Write Seq (MB/s) | 97.5 | 77.9 -20% | 88.5 -9% | 476.6 389% | 104 7% |
| Read 512 (MB/s) | 32.28 | 20.82 -36% | 32.94 2% | 399.7 1138% | 35.72 11% |
| Write 512 (MB/s) | 35.39 | 19.83 -44% | 26.71 -25% | 185.4 424% | 44.85 27% |
| Read 4k (MB/s) | 0.373 | 0.342 -8% | 0.372 0% | 33.12 8779% | 0.47 26% |
| Write 4k (MB/s) | 0.636 | 0.836 31% | 0.283 -56% | 89.8 14019% | 1.044 64% |
| Read 4k QD32 (MB/s) | 0.694 | 0.595 -14% | 0.921 33% | 400.9 57667% | 0.894 29% |
| Write 4k QD32 (MB/s) | 0.682 | 0.706 4% | 0.473 -31% | 140.2 20457% | 1.099 61% |

| 3DMark 11 | |
| 1280x720 Performance GPU | |
| HP Pavilion 15t-X7P42AV | |
| Asus X555LN-XO112H | |
| HP 250 G4 T6P08ES | |
| HP ProBook 640 G2-T9X60ET | |
| Asus X555DA-BB11 | |
| Lenovo IdeaPad Z40-59422614 | |
| Microsoft Surface Pro 4, Core m3 | |
| Lenovo ThinkPad X1 Tablet | |
| Toshiba Satellite Pro R50-C-16V | |
| Lenovo Ideapad 110-15ACL 80TJ00H0GE | |
| Dell Venue 10 Pro 5056 | |
| Toshiba Satellite Click 10 LX0W-C-104 | |
| 1280x720 Performance Combined | |
| HP Pavilion 15t-X7P42AV | |
| Asus X555LN-XO112H | |
| HP 250 G4 T6P08ES | |
| Microsoft Surface Pro 4, Core m3 | |
| HP ProBook 640 G2-T9X60ET | |
| Lenovo IdeaPad Z40-59422614 | |
| Lenovo ThinkPad X1 Tablet | |
| Toshiba Satellite Pro R50-C-16V | |
| Asus X555DA-BB11 | |
| Lenovo Ideapad 110-15ACL 80TJ00H0GE | |
| Dell Venue 10 Pro 5056 | |
| Toshiba Satellite Click 10 LX0W-C-104 | |
| 3DMark 11 Performance | 1297 pontos | |
| 3DMark Ice Storm Standard Score | 31586 pontos | |
| 3DMark Cloud Gate Standard Score | 3248 pontos | |
| 3DMark Fire Strike Score | 666 pontos | |
| 3DMark Fire Strike Extreme Score | 337 pontos | |
Ajuda | ||
| BioShock Infinite - 1280x720 Very Low Preset | |
| Asus X555LD-XX283H | |
| Microsoft Surface Pro 4, Core m3 | |
| Lenovo ThinkPad L470-20J5S00C00 | |
| Asus X555DA-BB11 | |
| Lenovo Ideapad 110-15ACL 80TJ00H0GE | |
| Toshiba Satellite Pro R50-C-16V | |
| HP Split x2 13-m210eg | |
| Dell Venue 10 Pro 5056 | |
| baixo | média | alto | ultra | |
|---|---|---|---|---|
| BioShock Infinite (2013) | 36.3 | |||
| Dota 2 Reborn (2015) | 28.2 | |||
| Rise of the Tomb Raider (2016) | 17 |
Barulho
| Ocioso |
| 31.6 / 32 / 32.4 dB |
| Carga |
| 33.3 / 35.5 dB |
 | ||
30 dB silencioso 40 dB(A) audível 50 dB(A) ruidosamente alto |
||
min: | ||
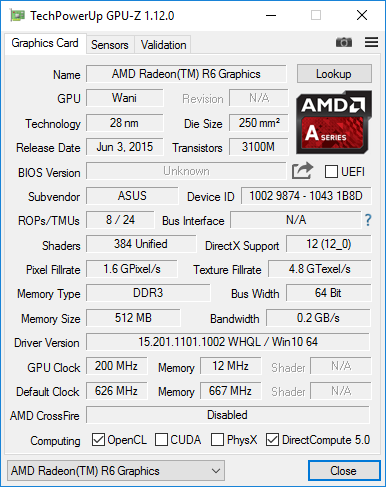
| Asus X555DA-BB11 Radeon R6 (Carrizo), A10-8700P, Seagate Momentus SpinPoint M8 ST1000LM024 HN-M101MBB | Toshiba Satellite Pro R50-C-16V HD Graphics 520, 6006U, TOSHIBA MQ01ABD075 | Lenovo Ideapad 110-15ACL 80TJ00H0GE Radeon R5 (Beema/Carrizo-L), A8-7410, Seagate Mobile HDD 1TB ST1000LM035 | HP Pavilion 15t-X7P42AV GeForce GTX 1050 Mobile, i7-7700HQ, Samsung CM871a MZNTY128HDHP | Asus X555LN-XO112H GeForce 840M, 4210U, Toshiba MQ01ABF050 | Asus Vivobook F556UQ-XO626D GeForce 940MX, 6198DU, Toshiba MQ01ABF050 | |
|---|---|---|---|---|---|---|
| Noise | 2% | 3% | -13% | -8% | -6% | |
| desligado / ambiente * (dB) | 28.9 | 30.4 -5% | 30.4 -5% | 29.3 -1% | 30.7 -6% | |
| Idle Minimum * (dB) | 31.6 | 31.8 -1% | 30.9 2% | 32.3 -2% | 31.7 -0% | 32 -1% |
| Idle Average * (dB) | 32 | 31.8 1% | 30.9 3% | 32.3 -1% | 31.7 1% | 32 -0% |
| Idle Maximum * (dB) | 32.4 | 31.8 2% | 31 4% | 32.4 -0% | 31.8 2% | 32.2 1% |
| Load Average * (dB) | 33.3 | 31.9 4% | 31.8 5% | 44.4 -33% | 40.8 -23% | 37.3 -12% |
| Load Maximum * (dB) | 35.5 | 31.8 10% | 31.9 10% | 49.2 -39% | 43.2 -22% | 42.6 -20% |
* ... menor é melhor
(+) A temperatura máxima no lado superior é 36.8 °C / 98 F, em comparação com a média de 36.8 °C / 98 F , variando de 21 a 71 °C para a classe Multimedia.
(±) A parte inferior aquece até um máximo de 45 °C / 113 F, em comparação com a média de 39.1 °C / 102 F
(+) Em uso inativo, a temperatura média para o lado superior é 27 °C / 81 F, em comparação com a média do dispositivo de 31.3 °C / ### class_avg_f### F.
(+) Os apoios para as mãos e o touchpad são mais frios que a temperatura da pele, com um máximo de 30 °C / 86 F e, portanto, são frios ao toque.
(±) A temperatura média da área do apoio para as mãos de dispositivos semelhantes foi 28.7 °C / 83.7 F (-1.3 °C / -2.3 F).
Asus X555DA-BB11 análise de áudio
(±) | o volume do alto-falante é médio, mas bom (###valor### dB)
Graves 100 - 315Hz
(-) | quase nenhum baixo - em média 21.4% menor que a mediana
(±) | a linearidade dos graves é média (13.5% delta para a frequência anterior)
Médios 400 - 2.000 Hz
(±) | médios reduzidos - em média 5.1% menor que a mediana
(±) | a linearidade dos médios é média (14.6% delta para frequência anterior)
Altos 2 - 16 kHz
(±) | máximos mais altos - em média 7.2% maior que a mediana
(±) | a linearidade dos máximos é média (14.6% delta para frequência anterior)
Geral 100 - 16.000 Hz
(±) | a linearidade do som geral é média (29% diferença em relação à mediana)
Comparado com a mesma classe
» 95% de todos os dispositivos testados nesta classe foram melhores, 1% semelhantes, 4% piores
» O melhor teve um delta de 5%, a média foi 17%, o pior foi 45%
Comparado com todos os dispositivos testados
» 87% de todos os dispositivos testados foram melhores, 2% semelhantes, 11% piores
» O melhor teve um delta de 4%, a média foi 23%, o pior foi 134%
Apple MacBook 12 (Early 2016) 1.1 GHz análise de áudio
(+) | os alto-falantes podem tocar relativamente alto (###valor### dB)
Graves 100 - 315Hz
(±) | graves reduzidos - em média 11.3% menor que a mediana
(±) | a linearidade dos graves é média (14.2% delta para a frequência anterior)
Médios 400 - 2.000 Hz
(+) | médios equilibrados - apenas 2.4% longe da mediana
(+) | médios são lineares (5.5% delta para frequência anterior)
Altos 2 - 16 kHz
(+) | agudos equilibrados - apenas 2% longe da mediana
(+) | os máximos são lineares (4.5% delta da frequência anterior)
Geral 100 - 16.000 Hz
(+) | o som geral é linear (10.2% diferença em relação à mediana)
Comparado com a mesma classe
» 7% de todos os dispositivos testados nesta classe foram melhores, 2% semelhantes, 90% piores
» O melhor teve um delta de 5%, a média foi 18%, o pior foi 53%
Comparado com todos os dispositivos testados
» 5% de todos os dispositivos testados foram melhores, 1% semelhantes, 94% piores
» O melhor teve um delta de 4%, a média foi 23%, o pior foi 134%
| desligado | |
| Ocioso | |
| Carga |
|
Key:
min: | |
| Asus X555DA-BB11 A10-8700P, Radeon R6 (Carrizo), Seagate Momentus SpinPoint M8 ST1000LM024 HN-M101MBB, TN LED, 1920x1080, 15.6" | Toshiba Satellite Pro R50-C-16V 6006U, HD Graphics 520, TOSHIBA MQ01ABD075, TN LED, 1366x768, 15.6" | Lenovo Ideapad 110-15ACL 80TJ00H0GE A8-7410, Radeon R5 (Beema/Carrizo-L), Seagate Mobile HDD 1TB ST1000LM035, TN LED, 1366x768, 15.6" | HP Pavilion 15t-X7P42AV i7-7700HQ, GeForce GTX 1050 Mobile, Samsung CM871a MZNTY128HDHP, IPS, 1920x1080, 15.6" | Asus X555LN-XO112H 4210U, GeForce 840M, Toshiba MQ01ABF050, TN LED, 1366x768, 15.6" | |
|---|---|---|---|---|---|
| Power Consumption | 29% | 35% | -68% | 19% | |
| Idle Minimum * (Watt) | 8.3 | 6 28% | 5.4 35% | 8.29 -0% | 4.2 49% |
| Idle Average * (Watt) | 8.6 | 8.7 -1% | 6.8 21% | 8.9 -3% | 6.3 27% |
| Idle Maximum * (Watt) | 13.1 | 9.2 30% | 7.3 44% | 10.2 22% | 7.1 46% |
| Load Average * (Watt) | 31.2 | 18.6 40% | 21.1 32% | 77.1 -147% | 35.2 -13% |
| Load Maximum * (Watt) | 43.9 | 23.8 46% | 25.5 42% | 136.6 -211% | 49.2 -12% |
* ... menor é melhor
| Asus X555DA-BB11 A10-8700P, Radeon R6 (Carrizo), 37 Wh | Toshiba Satellite Pro R50-C-16V 6006U, HD Graphics 520, 44 Wh | Lenovo Ideapad 110-15ACL 80TJ00H0GE A8-7410, Radeon R5 (Beema/Carrizo-L), 24 Wh | HP Pavilion 15t-X7P42AV i7-7700HQ, GeForce GTX 1050 Mobile, 63.3 Wh | Asus X555LN-XO112H 4210U, GeForce 840M, 37 Wh | |
|---|---|---|---|---|---|
| Duração da bateria | 103% | 17% | 100% | ||
| Reader / Idle (h) | 7.3 | 16 119% | |||
| WiFi v1.3 (h) | 2.9 | 5.9 103% | 3.4 17% | 6.5 124% | |
| Load (h) | 1.2 | 1.9 58% | |||
| WiFi (h) | 4.3 |
Pro
Contra
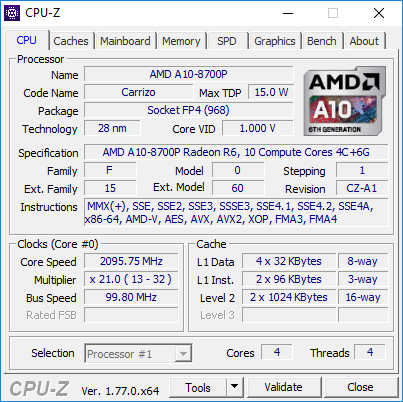
O X555DA é uma recomendação difícil, especialmente quando o antigo SKU X555LN ou X555LD equipados com Intel podem superar o nosso equivalente AMD. Normalmente quando o hardware é mais lento e mais econômico, os usuários têm mais probabilidades de esperar durações de bateria mais longas e temperaturas mais baixas, para compensar. O X555DA é o pior de ambos os mundos, dado que o desempenho e a duração da bateria estão abaixo da média.
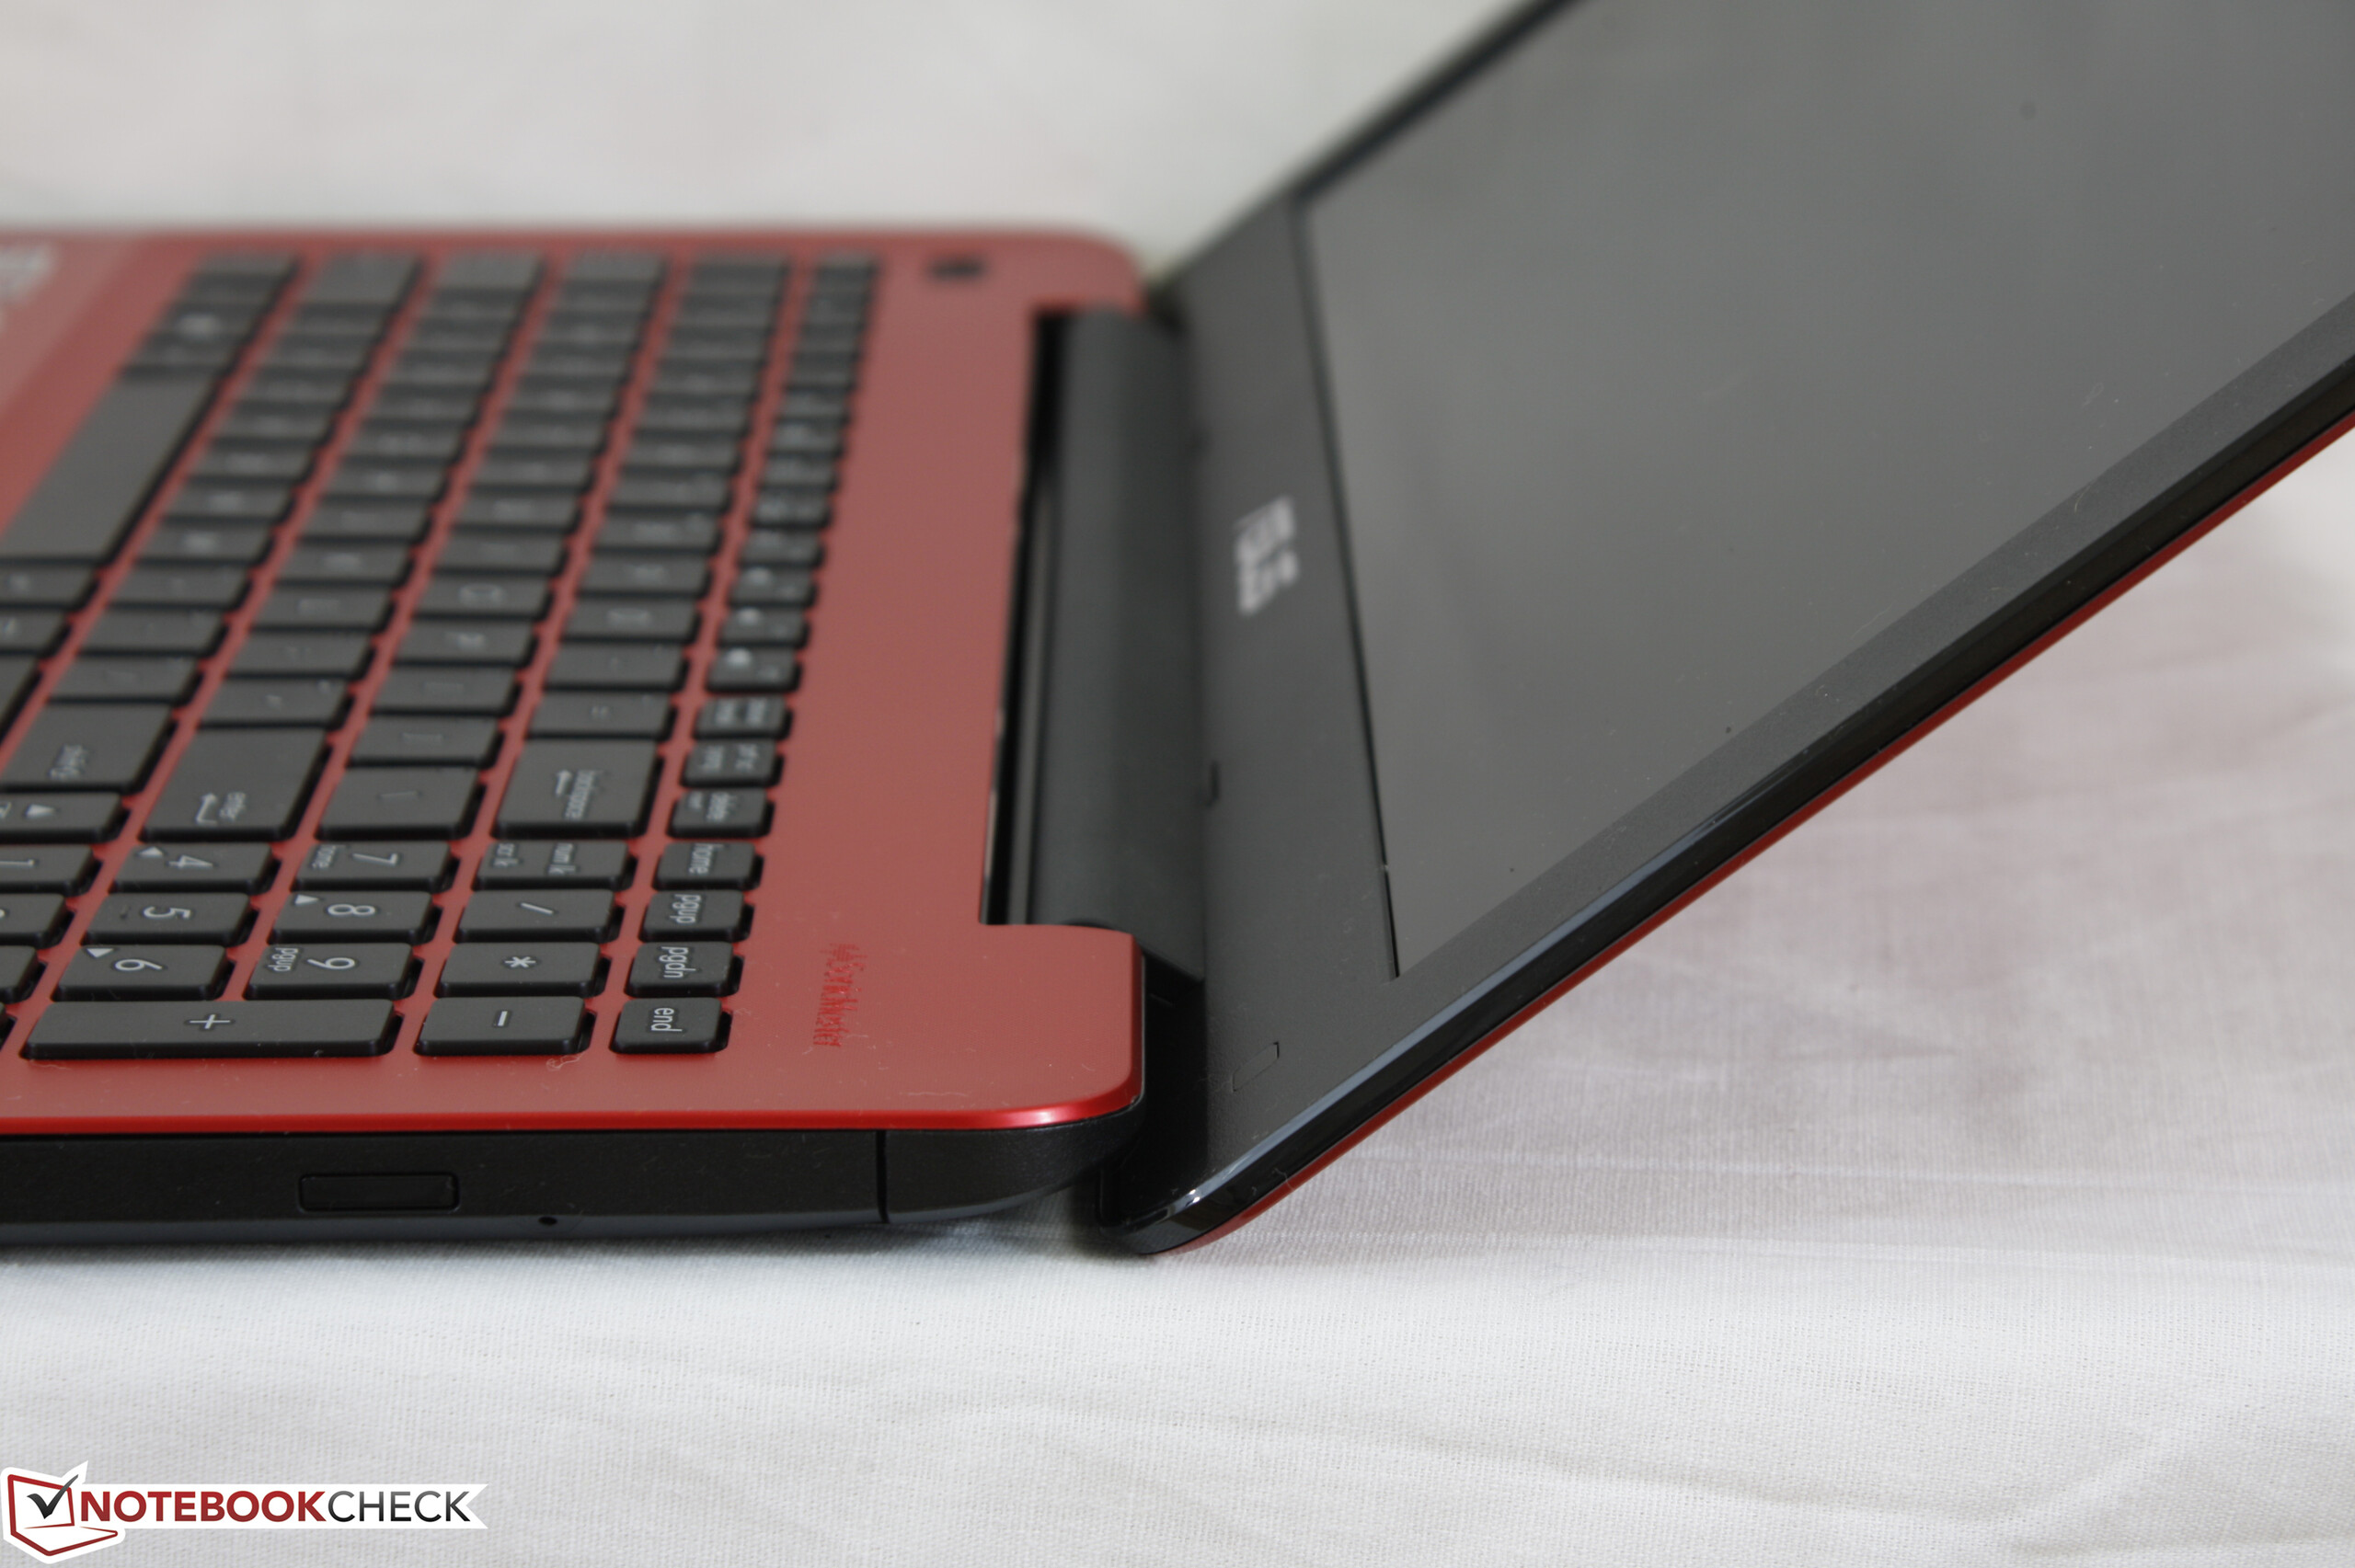
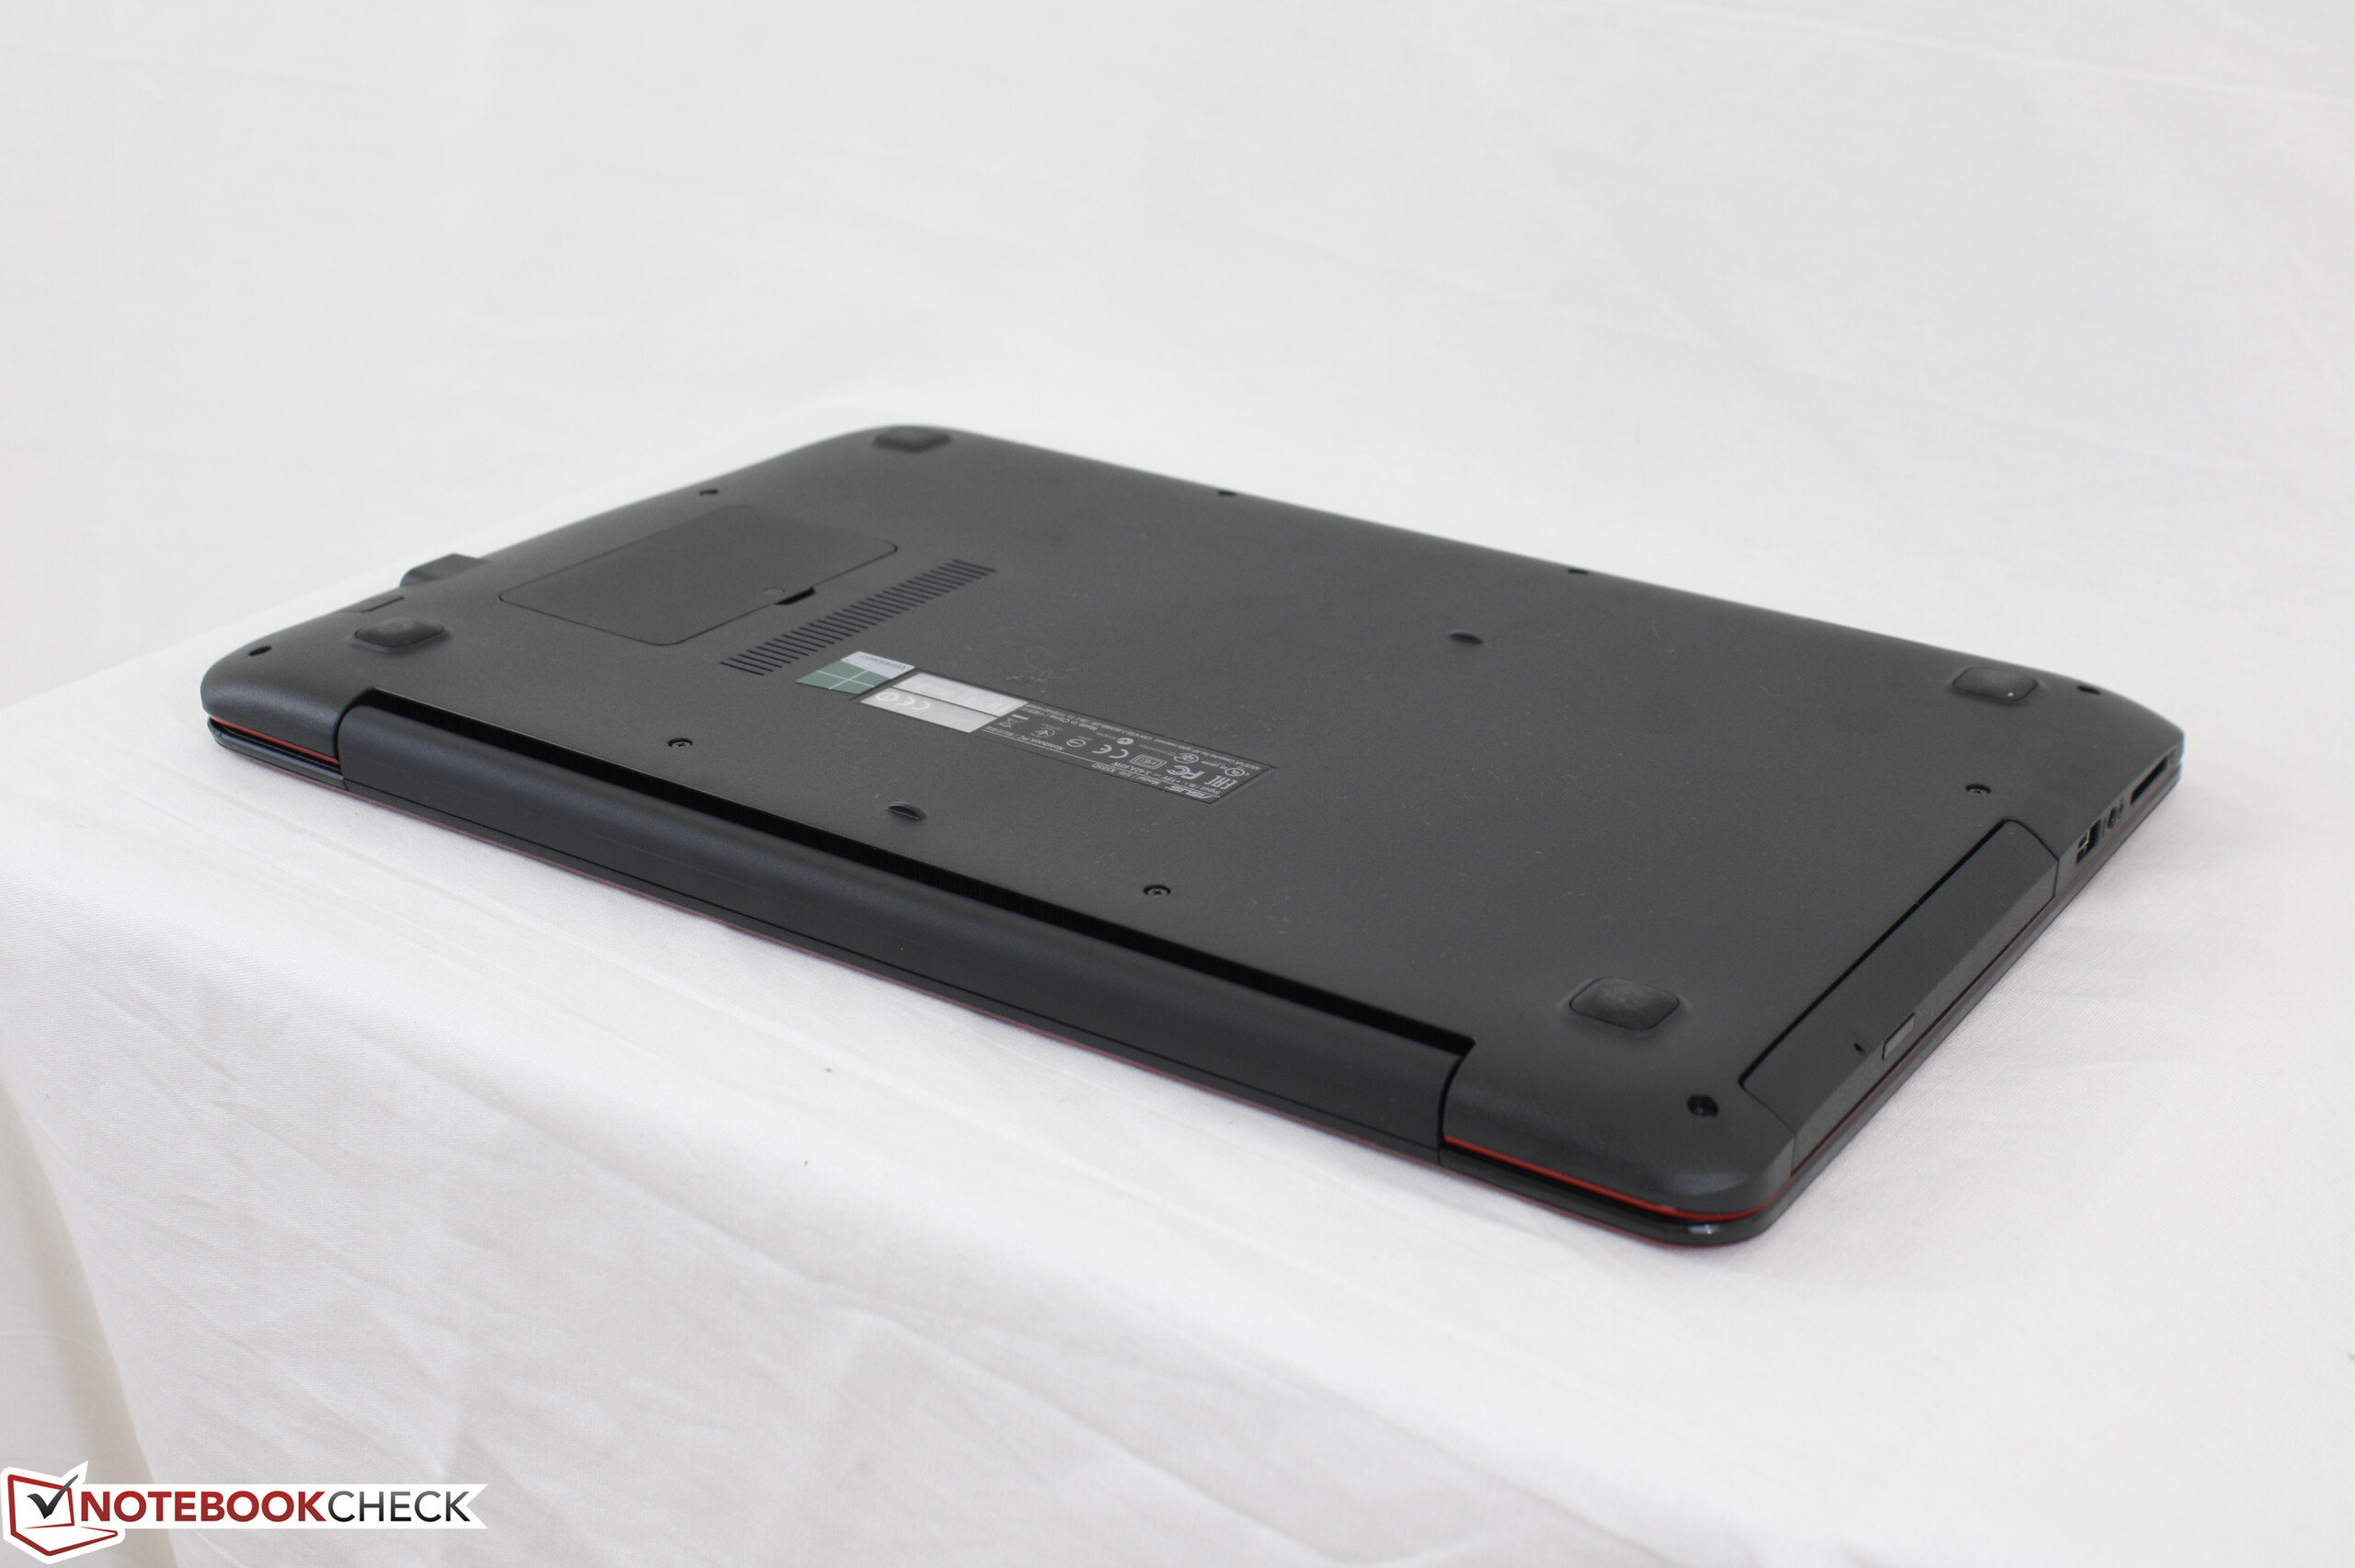
Fora a lenta APU AMD, o hardware da Asus sofre de sua própria série de problemas. A base da tampa e do teclado se flexiona muito facilmente para o nosso gosto e a tela TN 1080p TN tem uma reprodução de cores muito pobre. Os usuários interessados estarão melhor com os portáteis ULV Broadwell ou inclusive Haswell que com o que a Asus tem a oferecer neste SKU AMD.
Este portátil falha como um PC de consumo econômico por causa de sua curta duração da bateria, tela pobre, e desempenho lento. As alternativas da Intel datadas há três ou quatro anos ainda fornecerão mais poder pelo dinheiro, em quase todos os aspectos que ha para oferecer.
Asus X555DA-BB11
- 04/13/2017 v6 (old)
Allen Ngo
Price comparison
