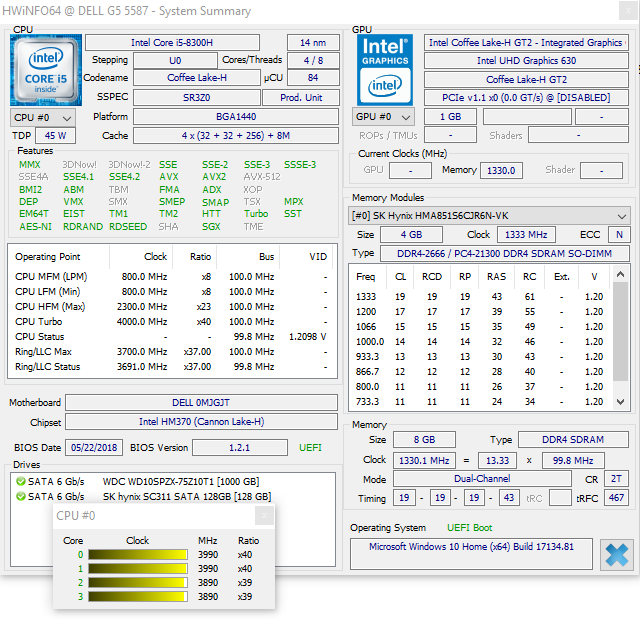
Breve Análise do Portátil Dell G5 15 5587 (i5-8300H, GTX 1060 Max-Q, SSD, IPS)

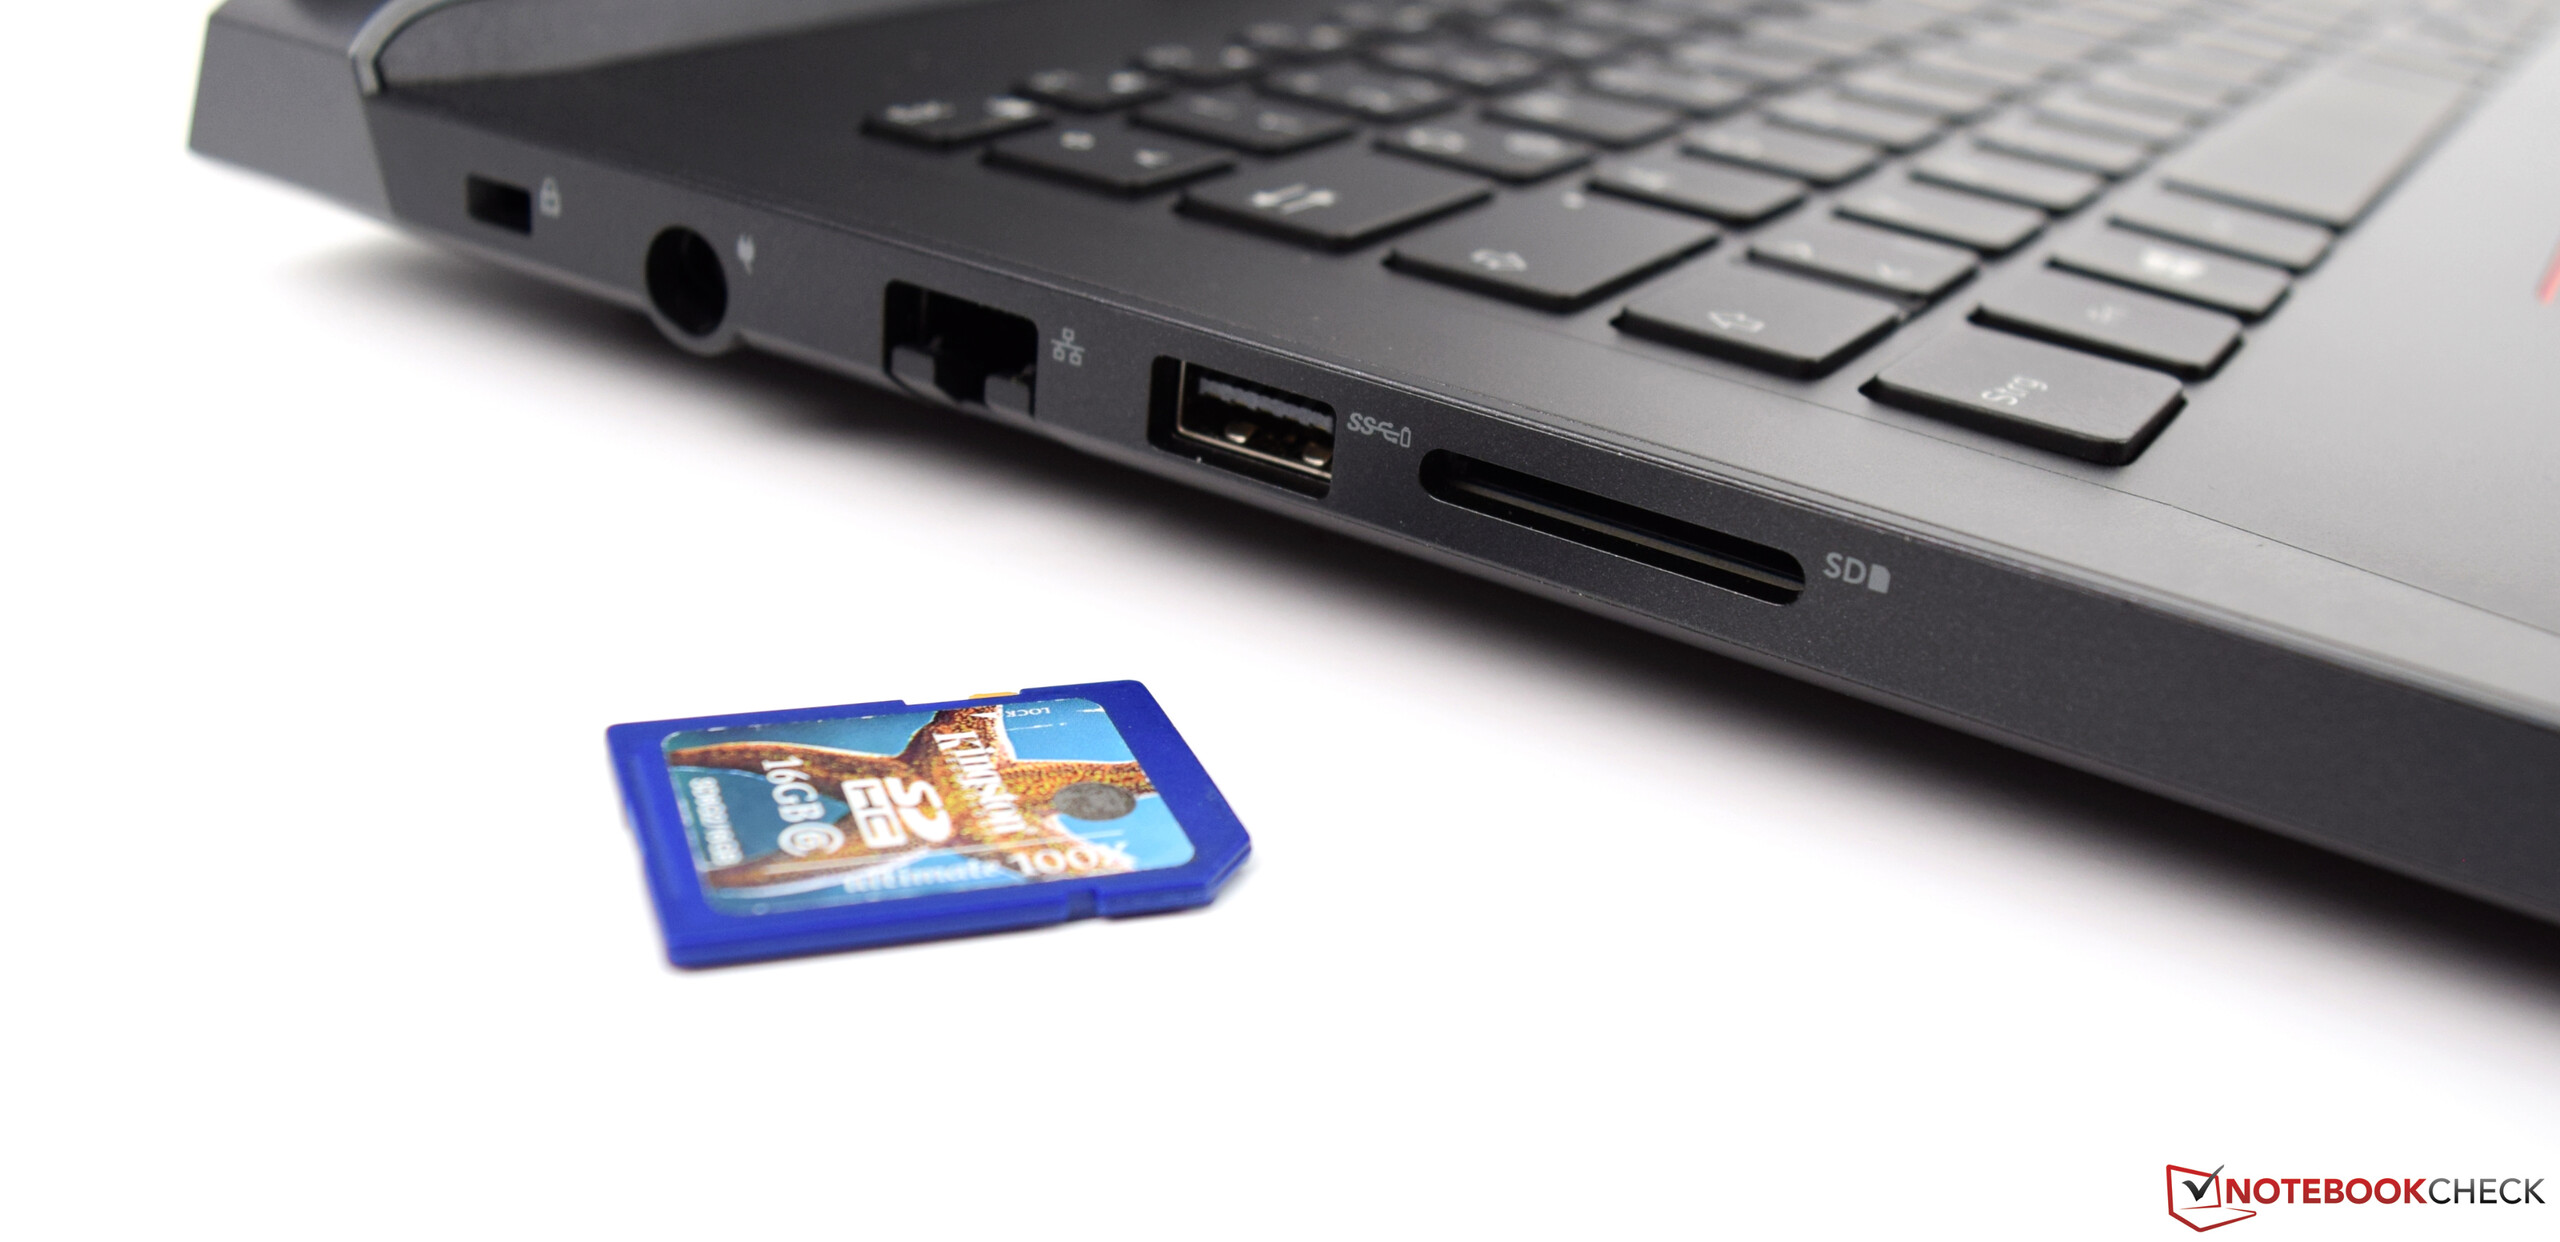
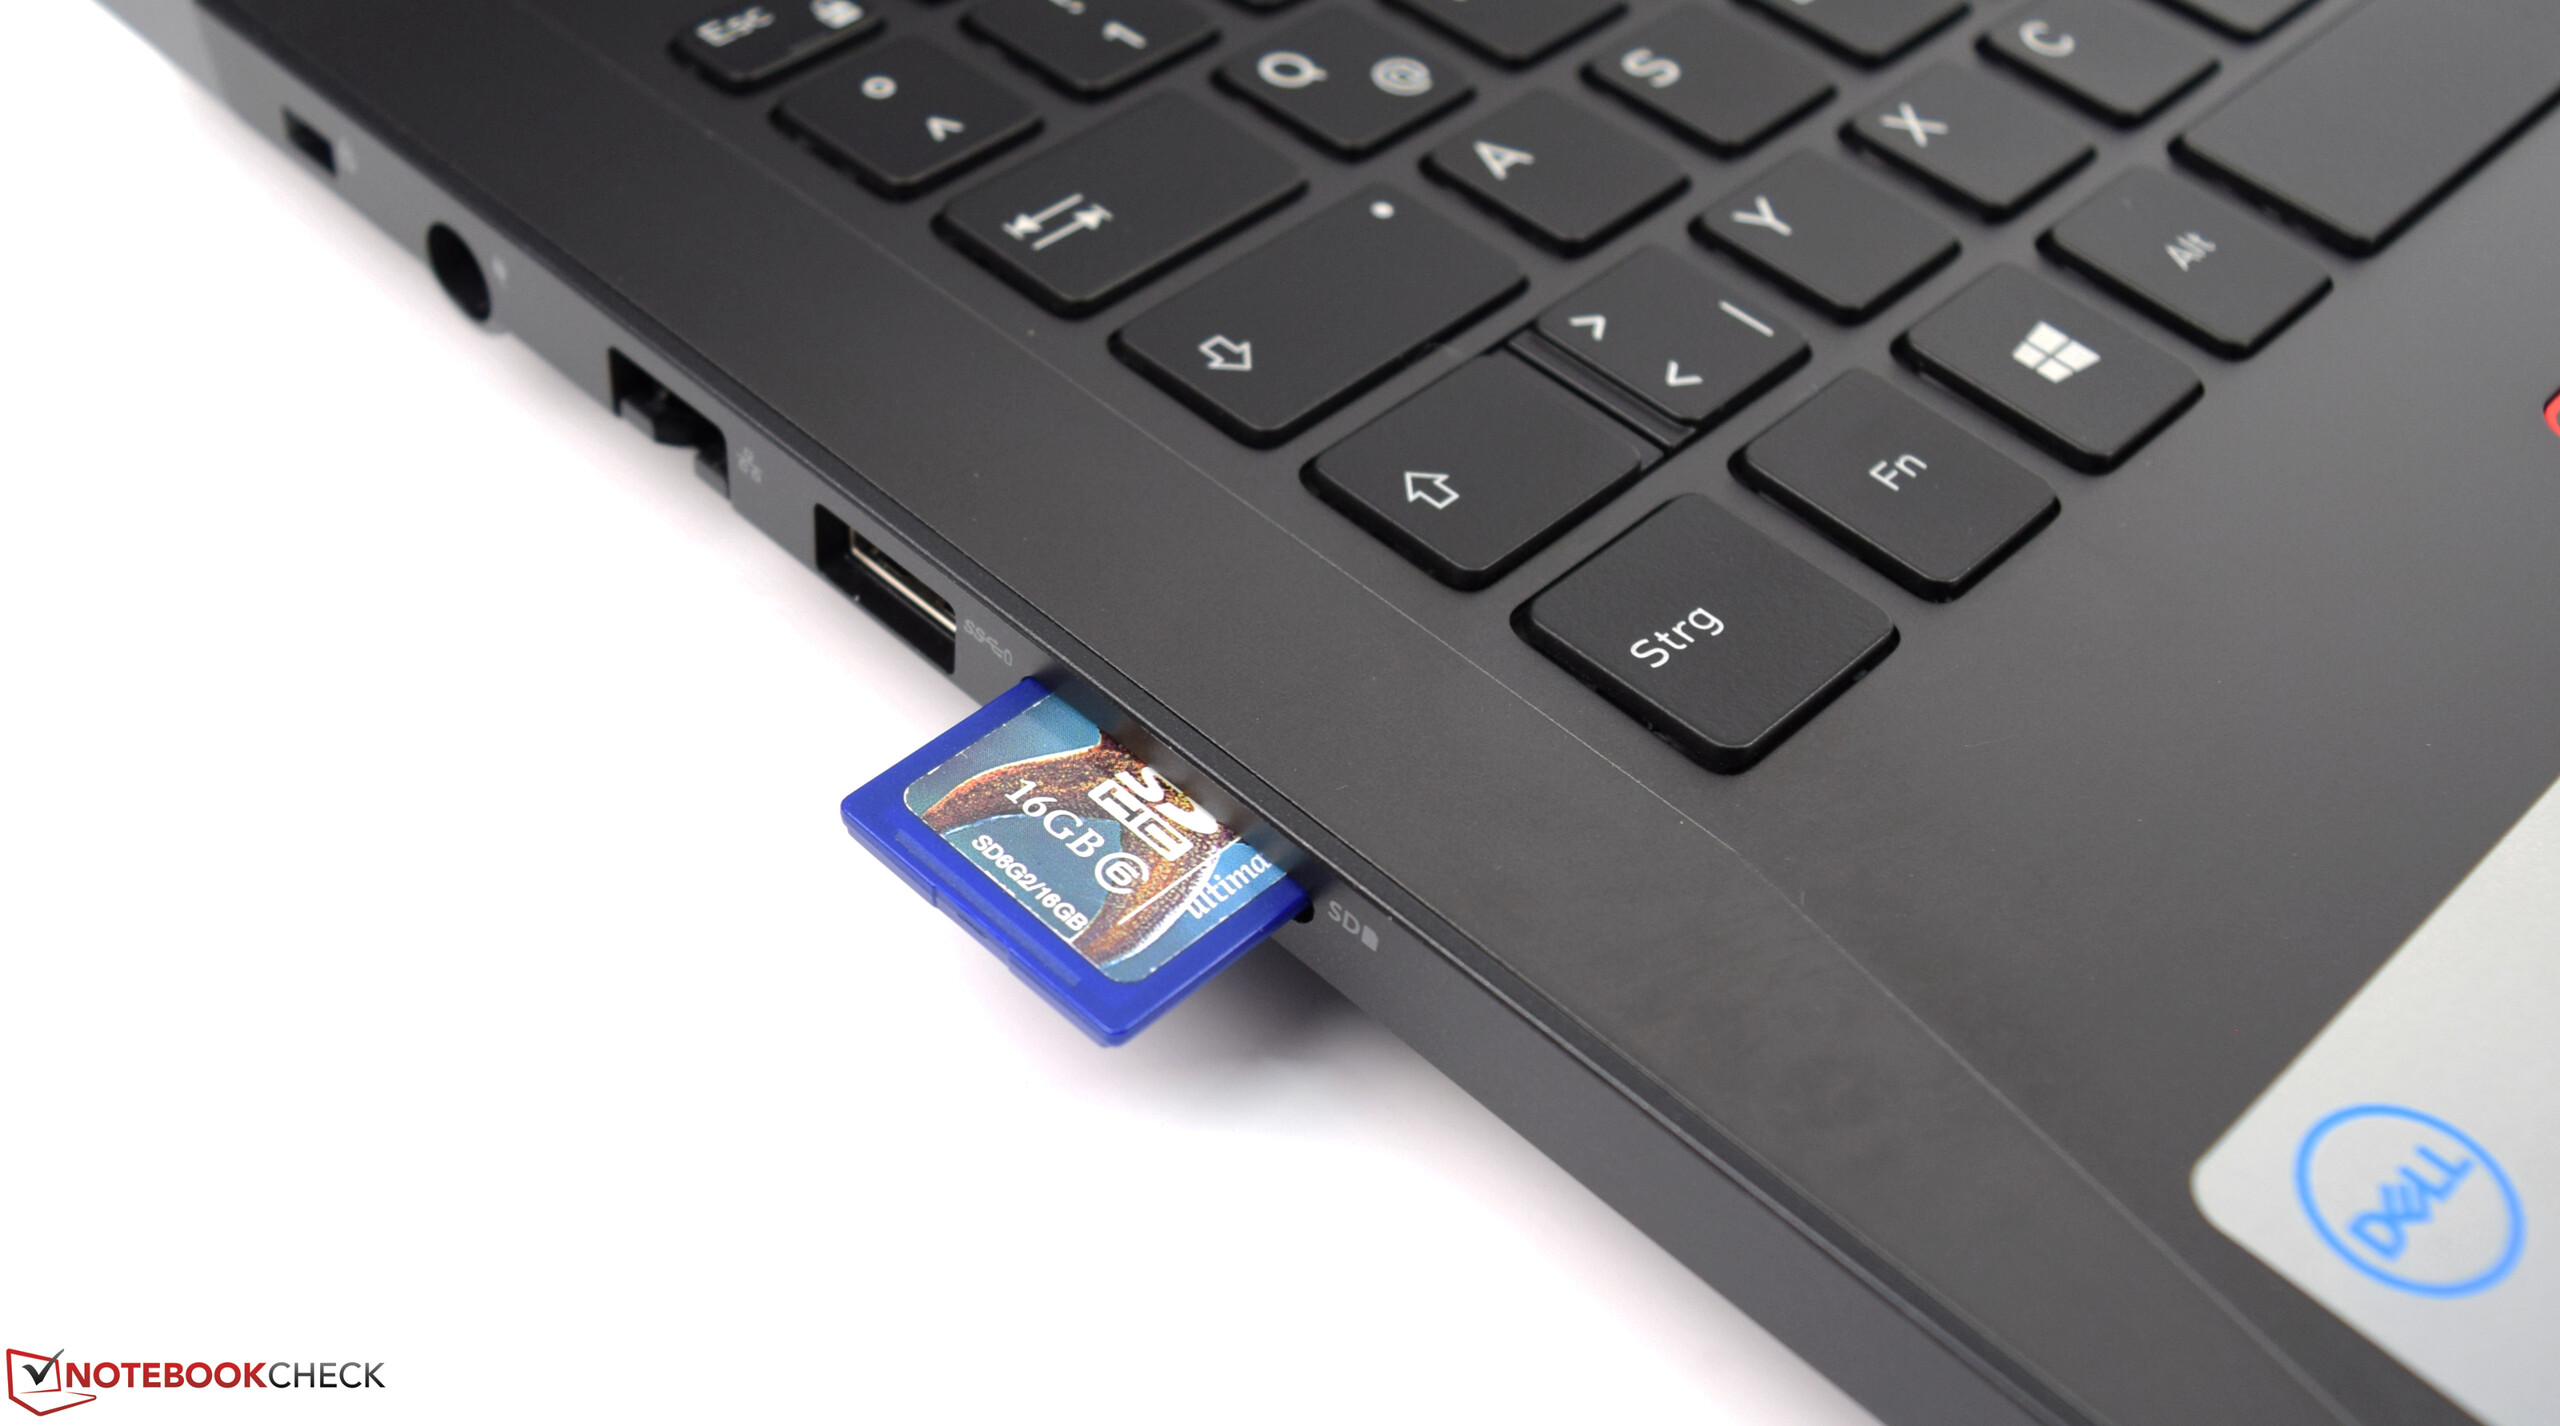
| SD Card Reader | |
| average JPG Copy Test (av. of 3 runs) | |
| Média da turma Gaming (20.9 - 210, n=54, últimos 2 anos) | |
| PC Zentrum Proteus V (Toshiba Exceria Pro SDXC 64 GB UHS-II) | |
| Asus FX503VM-EH73 (Toshiba Exceria Pro SDXC 64 GB UHS-II) | |
| Acer Predator Helios 300 PH317-52-51M6 (Toshiba Exceria Pro SDXC 64 GB UHS-II) | |
| Dell Inspiron 15 7000 7577 (Toshiba Exceria Pro SDXC 64 GB UHS-II) | |
| Acer Nitro 5 Spin NP515-51-86CX (Toshiba Exceria Pro SDXC 64 GB UHS-II) | |
| Dell G5 15 5587 (Toshiba Exceria Pro SDXC 64 GB UHS-II) | |
| Dell Inspiron 15 7000 7577 (Toshiba Exceria Pro SDXC 64 GB UHS-II) | |
| maximum AS SSD Seq Read Test (1GB) | |
| Média da turma Gaming (25.5 - 261, n=51, últimos 2 anos) | |
| PC Zentrum Proteus V (Toshiba Exceria Pro SDXC 64 GB UHS-II) | |
| Asus FX503VM-EH73 (Toshiba Exceria Pro SDXC 64 GB UHS-II) | |
| Acer Predator Helios 300 PH317-52-51M6 (Toshiba Exceria Pro SDXC 64 GB UHS-II) | |
| Dell G5 15 5587 (Toshiba Exceria Pro SDXC 64 GB UHS-II) | |
| Dell Inspiron 15 7000 7577 (Toshiba Exceria Pro SDXC 64 GB UHS-II) | |
| Dell Inspiron 15 7000 7577 (Toshiba Exceria Pro SDXC 64 GB UHS-II) | |
| Acer Nitro 5 Spin NP515-51-86CX (Toshiba Exceria Pro SDXC 64 GB UHS-II) | |
| |||||||||||||||||||||||||
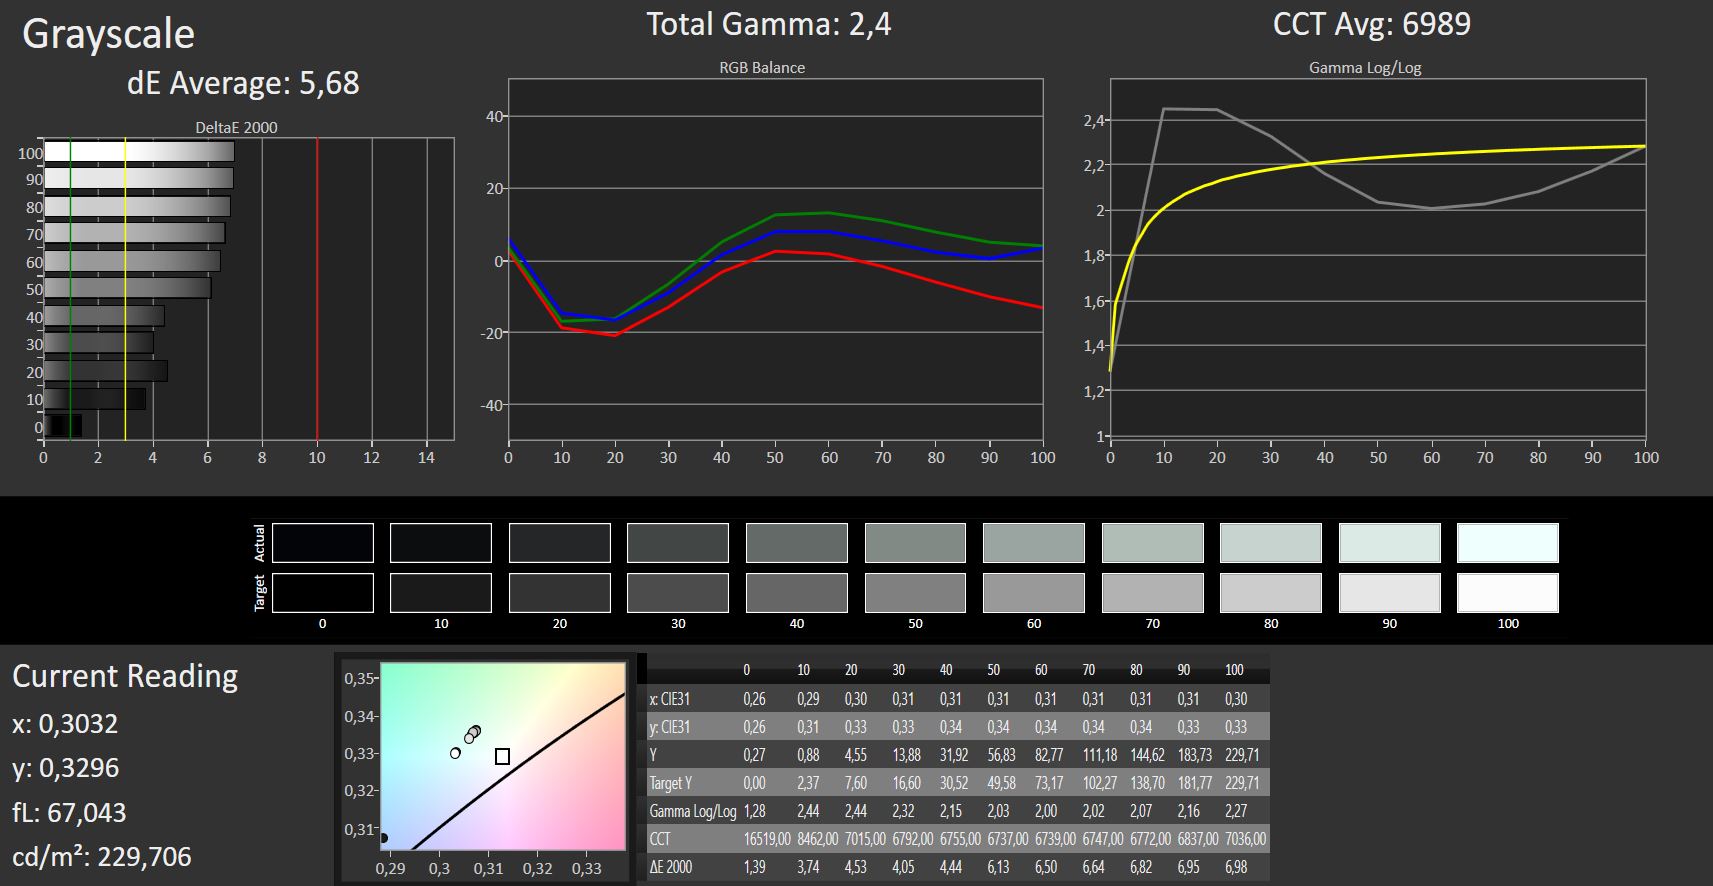
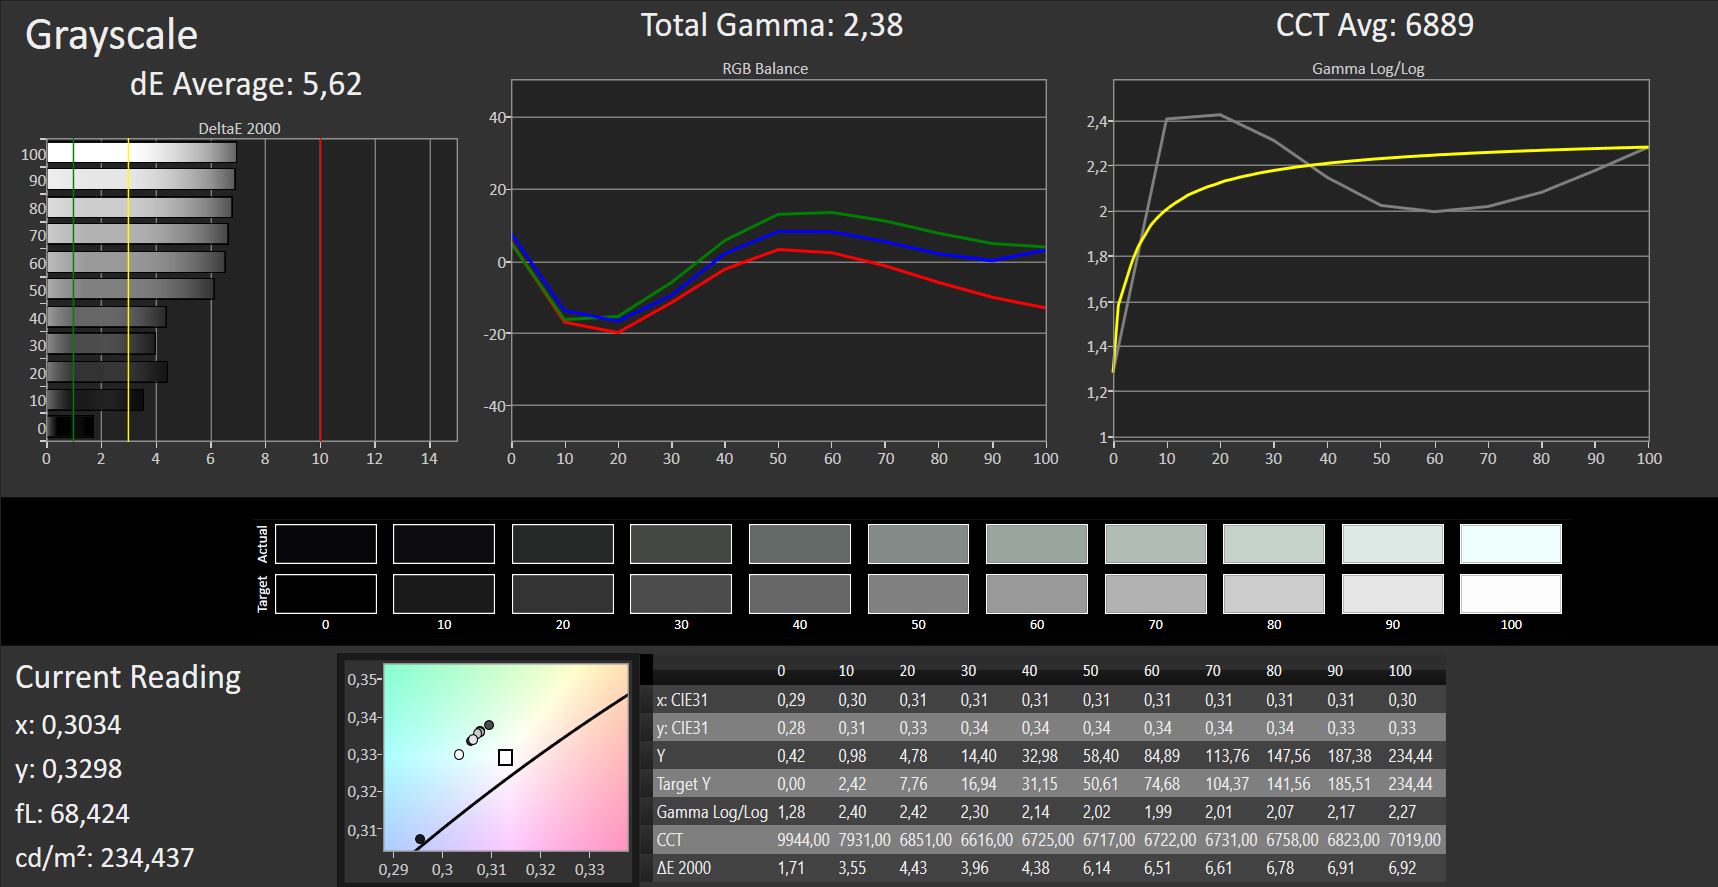
iluminação: 87 %
iluminação com acumulador: 229 cd/m²
Contraste: 818:1 (Preto: 0.28 cd/m²)
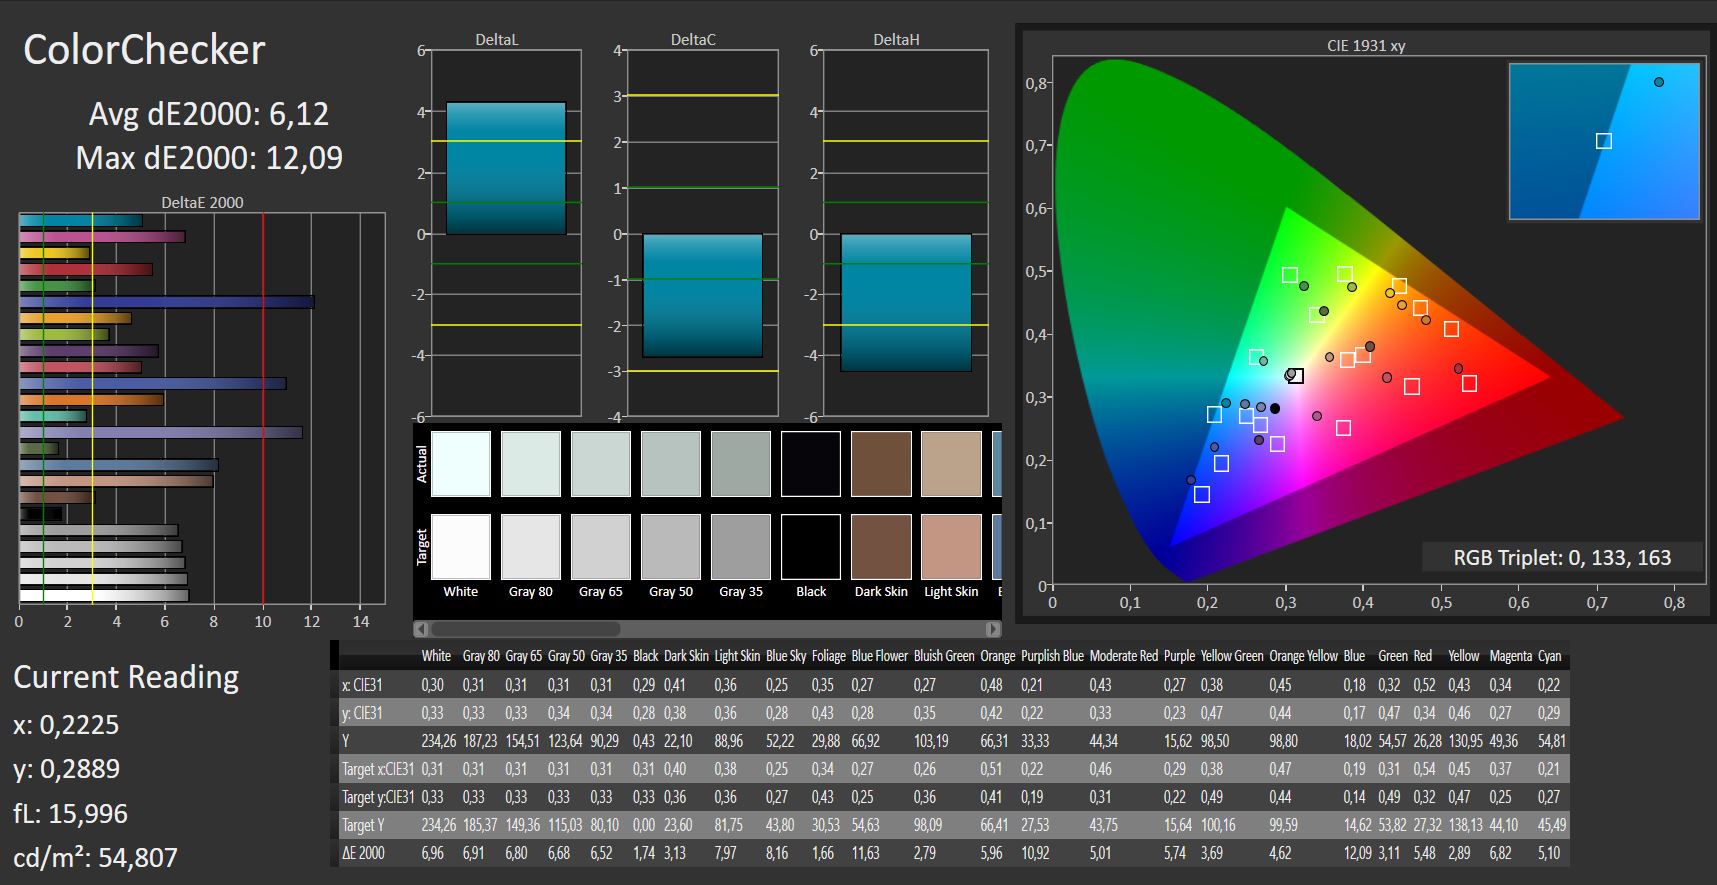
ΔE ColorChecker Calman: 6.1 | ∀{0.5-29.43 Ø4.71}
calibrated: 6.12
ΔE Greyscale Calman: 5.68 | ∀{0.09-98 Ø4.96}
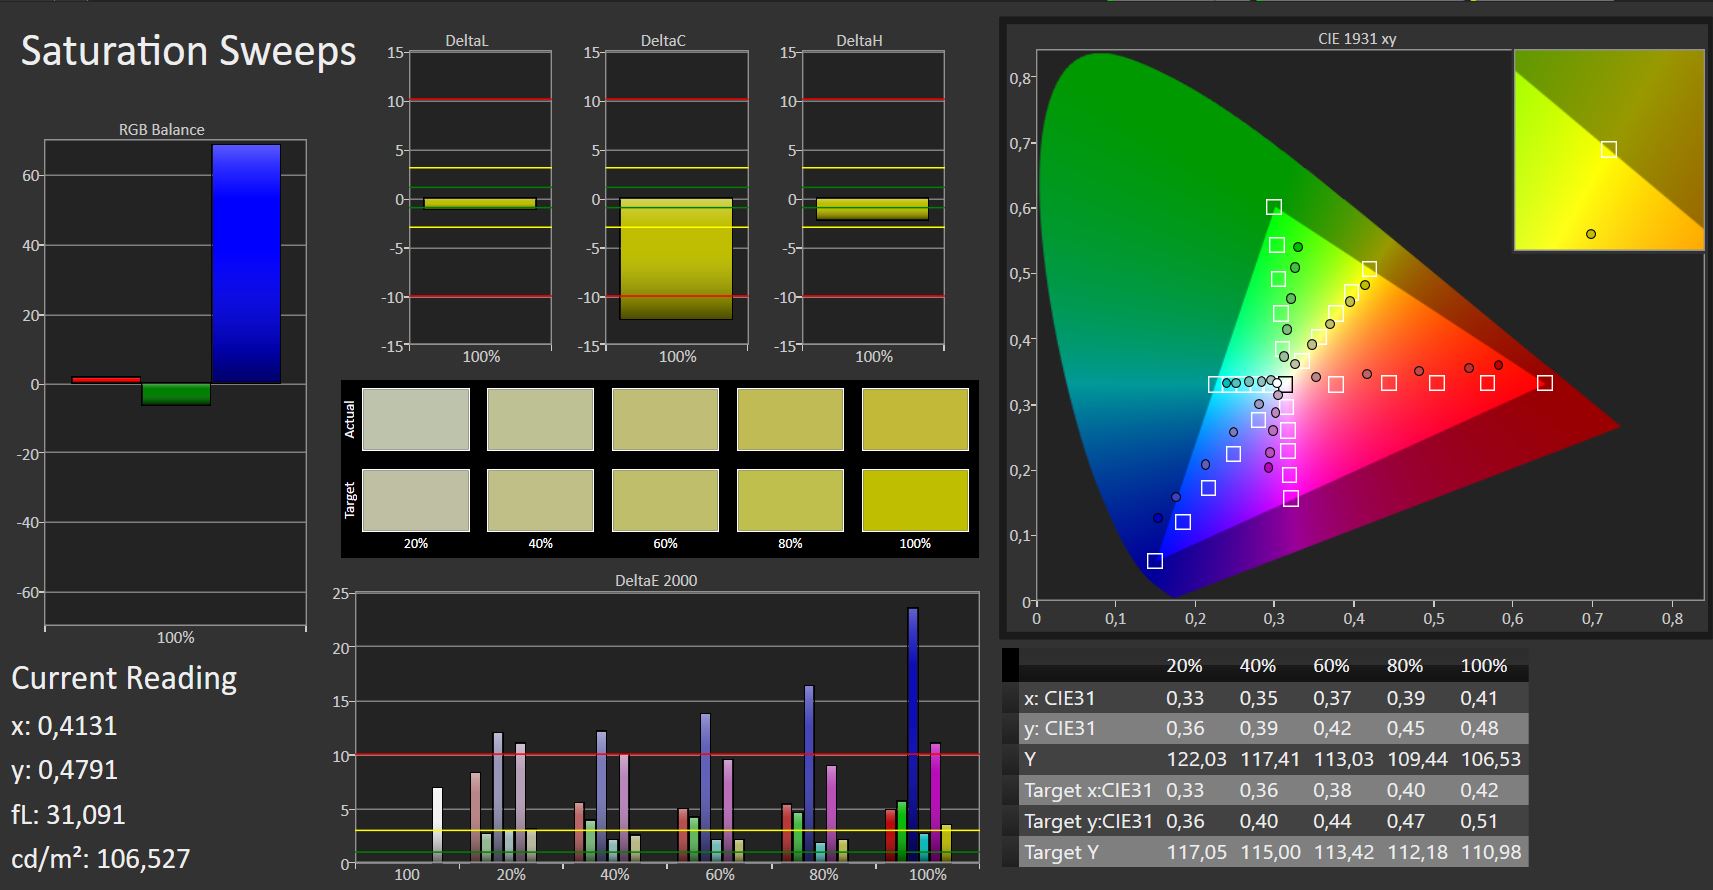
57% sRGB (Argyll 1.6.3 3D)
36% AdobeRGB 1998 (Argyll 1.6.3 3D)
39.47% AdobeRGB 1998 (Argyll 3D)
56.8% sRGB (Argyll 3D)
38.13% Display P3 (Argyll 3D)
Gamma: 2.4
CCT: 6989 K
| Dell G5 15 5587 LGD053F, 156WF6, 1920x1080, 15.6" | Dell Inspiron 15 7000 7577 ID: LG Philips LGD053F, Name: 156WF6, Dell P/N: 4XK13, 1920x1080, 15.6" | Dell Inspiron 15 7000 7577 ID: LG Philips LGD053F, Name: 156WF6, Dell P/N: 4XK13, 1920x1080, 15.6" | PC Zentrum Proteus V BOEhydis NV156FHM-N42 (BOE06C6), 1920x1080, 15.6" | Asus FX503VM-EH73 AU Optronics B156HAN06.1, 1920x1080, 15.6" | Acer Nitro 5 Spin NP515-51-86CX Chi Mei CMN15D7, 1920x1080, 15.6" | Acer Predator Helios 300 PH317-52-51M6 LG Philips LP173WF4-SPF5 (LGD056D), 1920x1080, 17.3" | |
|---|---|---|---|---|---|---|---|
| Display | 6% | -3% | 2% | -2% | 67% | 63% | |
| Display P3 Coverage (%) | 38.13 | 40.4 6% | 37.07 -3% | 39.13 3% | 37.48 -2% | 64.9 70% | 67.1 76% |
| sRGB Coverage (%) | 56.8 | 60.5 7% | 55.6 -2% | 58 2% | 56.3 -1% | 92.6 63% | 86.1 52% |
| AdobeRGB 1998 Coverage (%) | 39.47 | 41.77 6% | 38.32 -3% | 40.42 2% | 38.72 -2% | 66.3 68% | 63 60% |
| Response Times | -21% | -12% | -63% | -22% | -9% | -1% | |
| Response Time Grey 50% / Grey 80% * (ms) | 33 ? | 41 ? -24% | 35.6 ? -8% | 52.8 ? -60% | 36.8 ? -12% | 36 ? -9% | 36 ? -9% |
| Response Time Black / White * (ms) | 24 ? | 28 ? -17% | 27.6 ? -15% | 39.6 ? -65% | 31.6 ? -32% | 26 ? -8% | 22 ? 8% |
| PWM Frequency (Hz) | 21930 ? | 122000 ? | |||||
| Screen | 19% | -2% | 21% | 1% | 25% | 23% | |
| Brightness middle (cd/m²) | 229 | 257 12% | 235.4 3% | 242 6% | 235.9 3% | 345 51% | 365 59% |
| Brightness (cd/m²) | 224 | 229 2% | 223 0% | 235 5% | 235 5% | 332 48% | 341 52% |
| Brightness Distribution (%) | 87 | 84 -3% | 91 5% | 85 -2% | 91 5% | 92 6% | 89 2% |
| Black Level * (cd/m²) | 0.28 | 0.17 39% | 0.28 -0% | 0.21 25% | 0.27 4% | 0.28 -0% | 0.32 -14% |
| Contrast (:1) | 818 | 1512 85% | 841 3% | 1152 41% | 874 7% | 1232 51% | 1141 39% |
| Colorchecker dE 2000 * | 6.1 | 5.34 12% | 5.6 8% | 4.27 30% | 4.81 21% | 5.85 4% | 6.51 -7% |
| Colorchecker dE 2000 max. * | 12.2 | 9.99 18% | 20.3 -66% | 7.09 42% | 21.55 -77% | 11.87 3% | 12.32 -1% |
| Colorchecker dE 2000 calibrated * | 6.12 | 2.9 53% | |||||
| Greyscale dE 2000 * | 5.68 | 4.82 15% | 3.6 37% | 2.17 62% | 3.1 45% | 8.11 -43% | 7.65 -35% |
| Gamma | 2.4 92% | 2.46 89% | 2.23 99% | 2.38 92% | 2.31 95% | 2.48 89% | 2.64 83% |
| CCT | 6989 93% | 6587 99% | 7214 90% | 6912 94% | 6984 93% | 6741 96% | 8066 81% |
| Color Space (Percent of AdobeRGB 1998) (%) | 36 | 38 6% | 35.2 -2% | 37 3% | 36 0% | 60 67% | 56 56% |
| Color Space (Percent of sRGB) (%) | 57 | 60 5% | 55.4 -3% | 58 2% | 56 -2% | 93 63% | 86 51% |
| Média Total (Programa/Configurações) | 1% /
11% | -6% /
-3% | -13% /
6% | -8% /
-3% | 28% /
29% | 28% /
28% |
* ... menor é melhor


Exibir tempos de resposta
| ↔ Tempo de resposta preto para branco | ||
|---|---|---|
| 24 ms ... ascensão ↗ e queda ↘ combinadas | ↗ 14 ms ascensão | 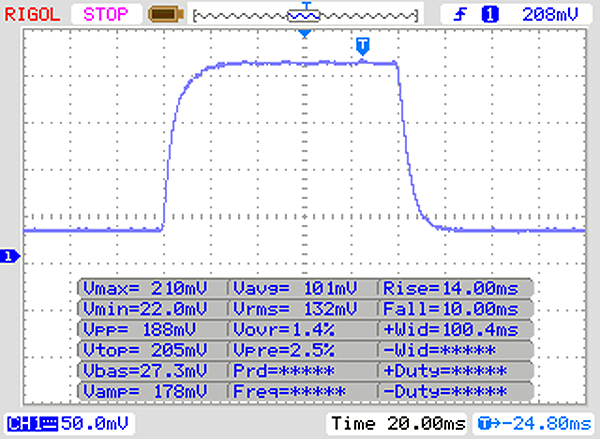 |
| ↘ 10 ms queda | ||
| A tela mostra boas taxas de resposta em nossos testes, mas pode ser muito lenta para jogadores competitivos. Em comparação, todos os dispositivos testados variam de 0.1 (mínimo) a 240 (máximo) ms. » 54 % de todos os dispositivos são melhores. Isso significa que o tempo de resposta medido é pior que a média de todos os dispositivos testados (19.8 ms). | ||
| ↔ Tempo de resposta 50% cinza a 80% cinza | ||
| 33 ms ... ascensão ↗ e queda ↘ combinadas | ↗ 16 ms ascensão | 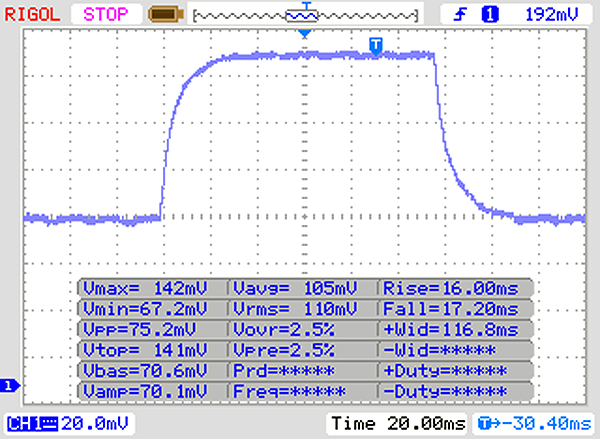 |
| ↘ 17 ms queda | ||
| A tela mostra taxas de resposta lentas em nossos testes e será insatisfatória para os jogadores. Em comparação, todos os dispositivos testados variam de 0.165 (mínimo) a 636 (máximo) ms. » 45 % de todos os dispositivos são melhores. Isso significa que o tempo de resposta medido é semelhante à média de todos os dispositivos testados (31 ms). | ||
Cintilação da tela / PWM (modulação por largura de pulso)
| Tela tremeluzindo / PWM não detectado | 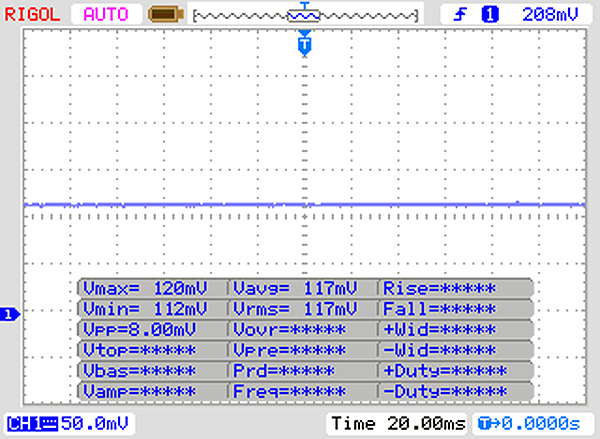 | ||
[pwm_comparison] Em comparação: 52 % de todos os dispositivos testados não usam PWM para escurecer a tela. Se PWM foi detectado, uma média de 7754 (mínimo: 5 - máximo: 343500) Hz foi medida. | |||
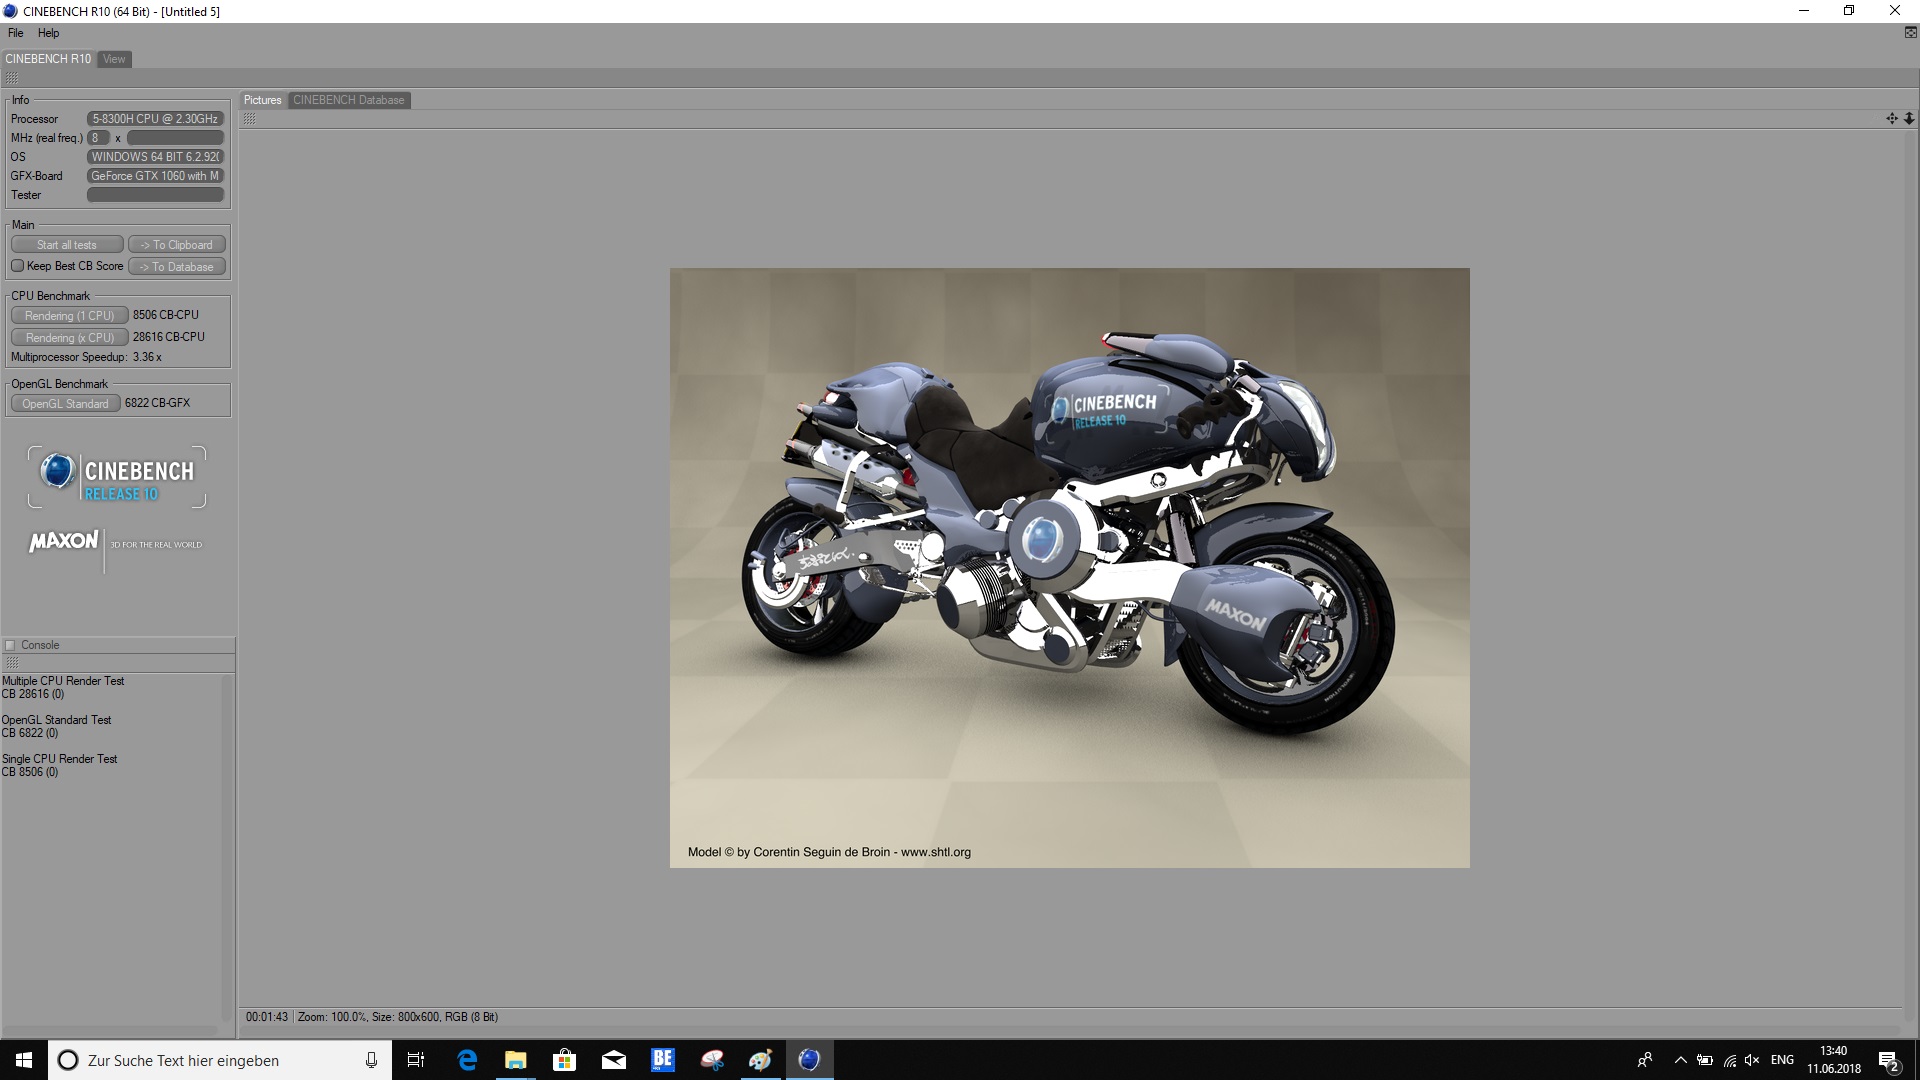
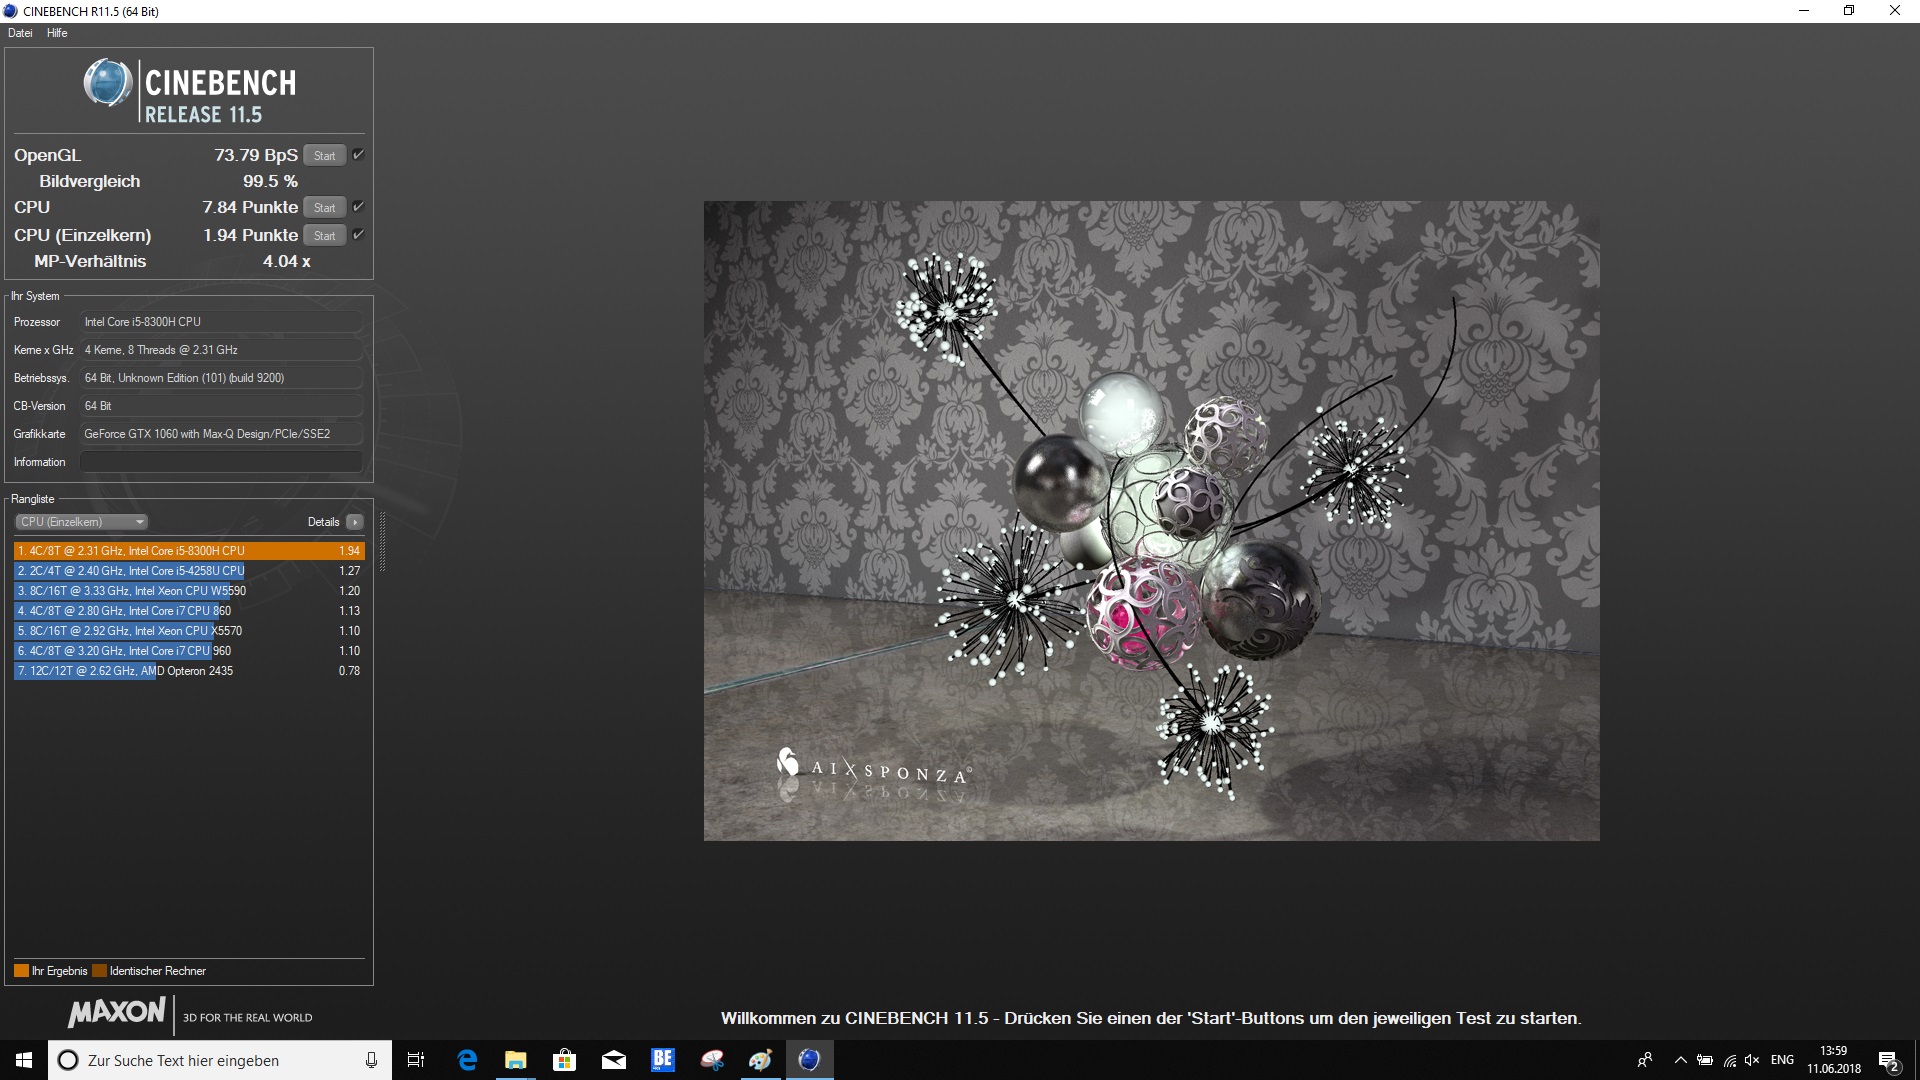
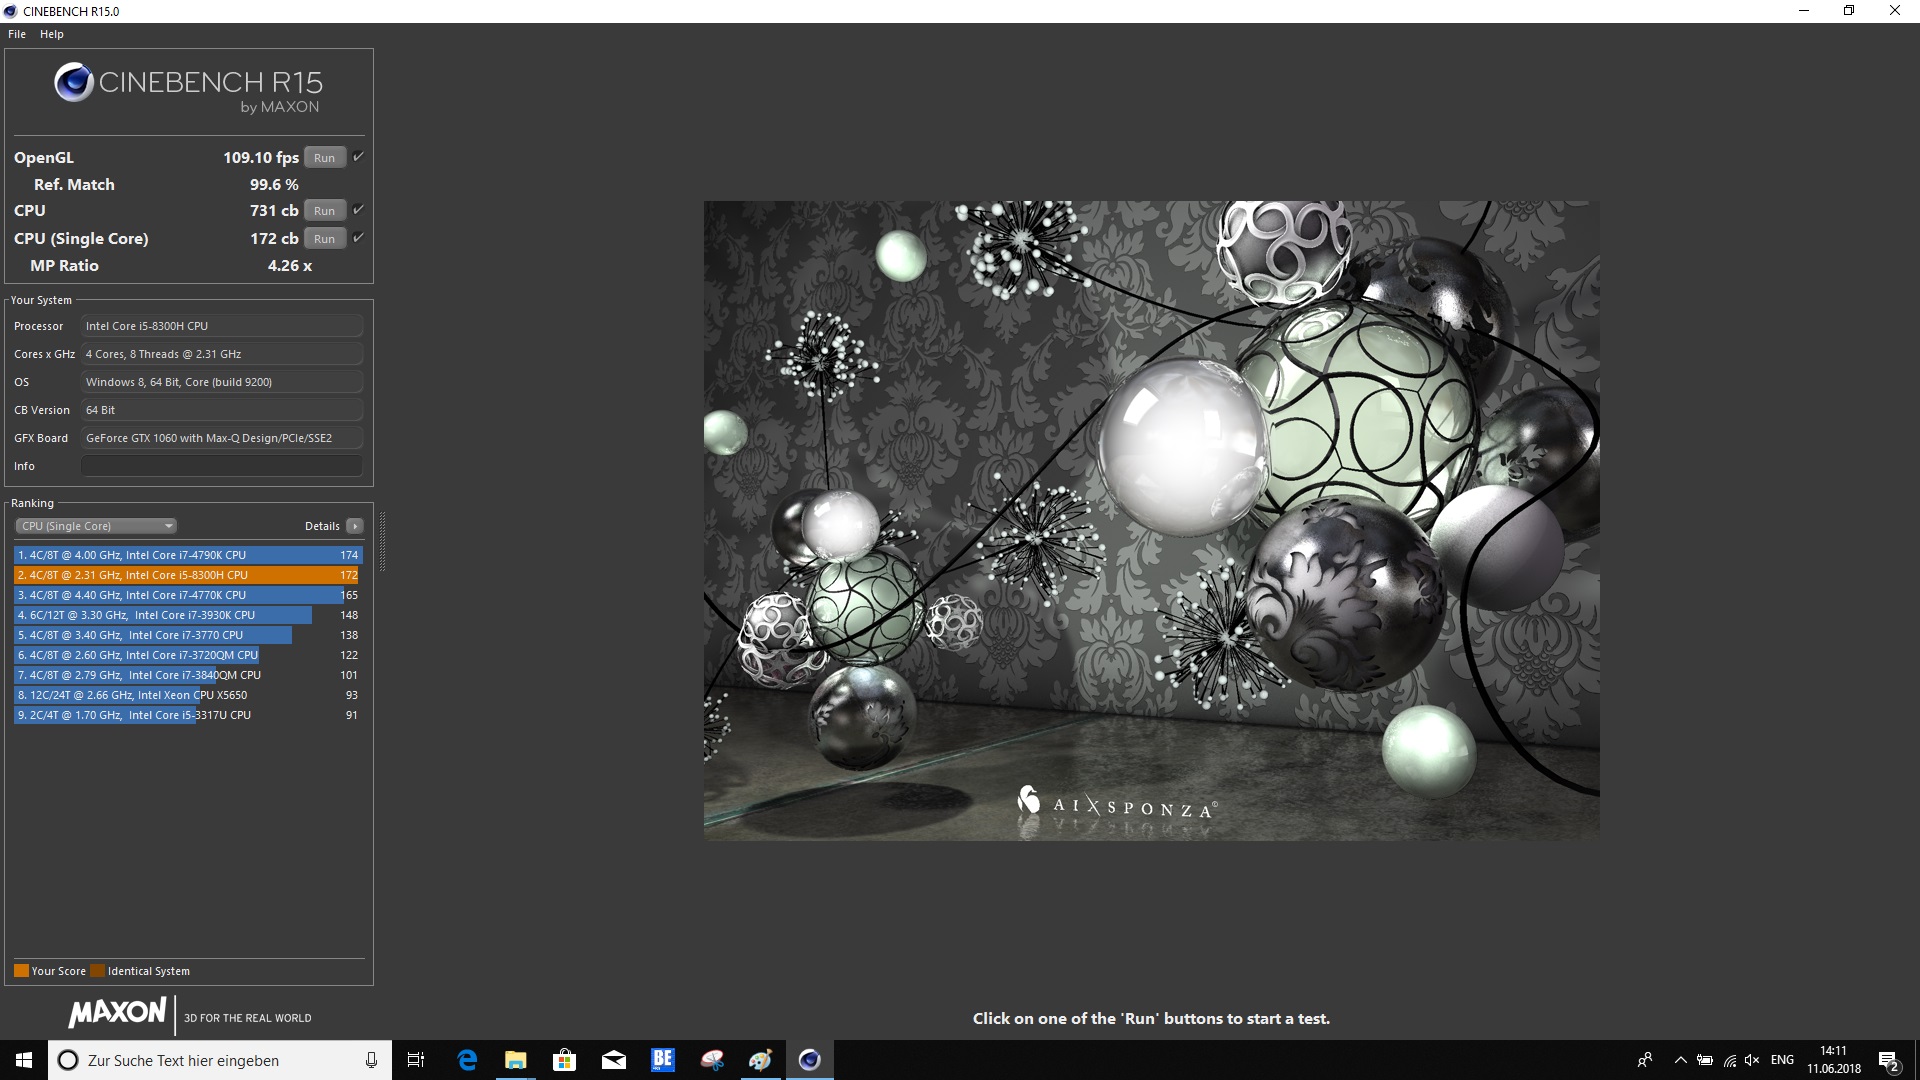
| Cinebench R10 | |
| Rendering Single CPUs 64Bit | |
| Média da turma Gaming (17067 - 19487, n=3, últimos 2 anos) | |
| Dell G5 15 5587 | |
| Média Intel Core i5-8300H (8277 - 8506, n=2) | |
| Dell Inspiron 15 7000 7577 | |
| Rendering Multiple CPUs 64Bit | |
| Média da turma Gaming (14159 - 165835, n=3, últimos 2 anos) | |
| Média Intel Core i5-8300H (28616 - 32021, n=2) | |
| Dell G5 15 5587 | |
| Dell Inspiron 15 7000 7577 | |
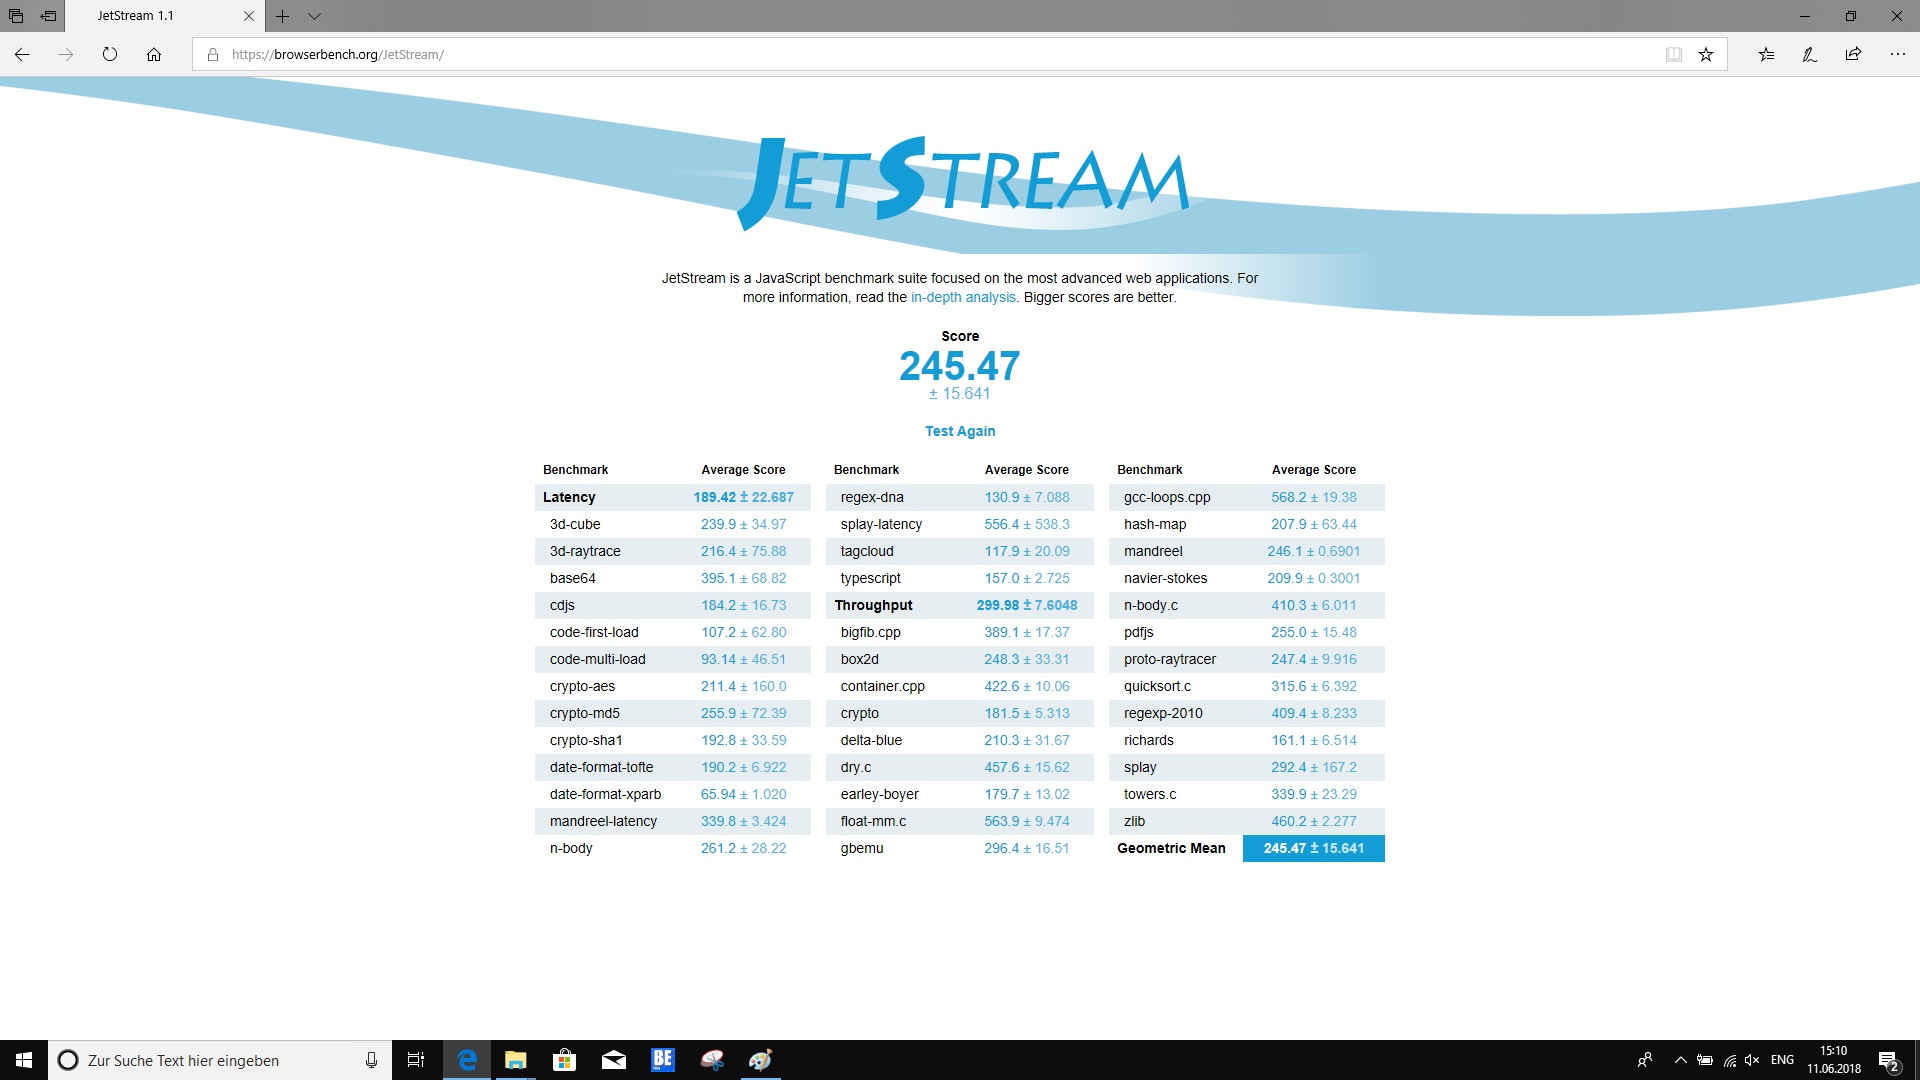
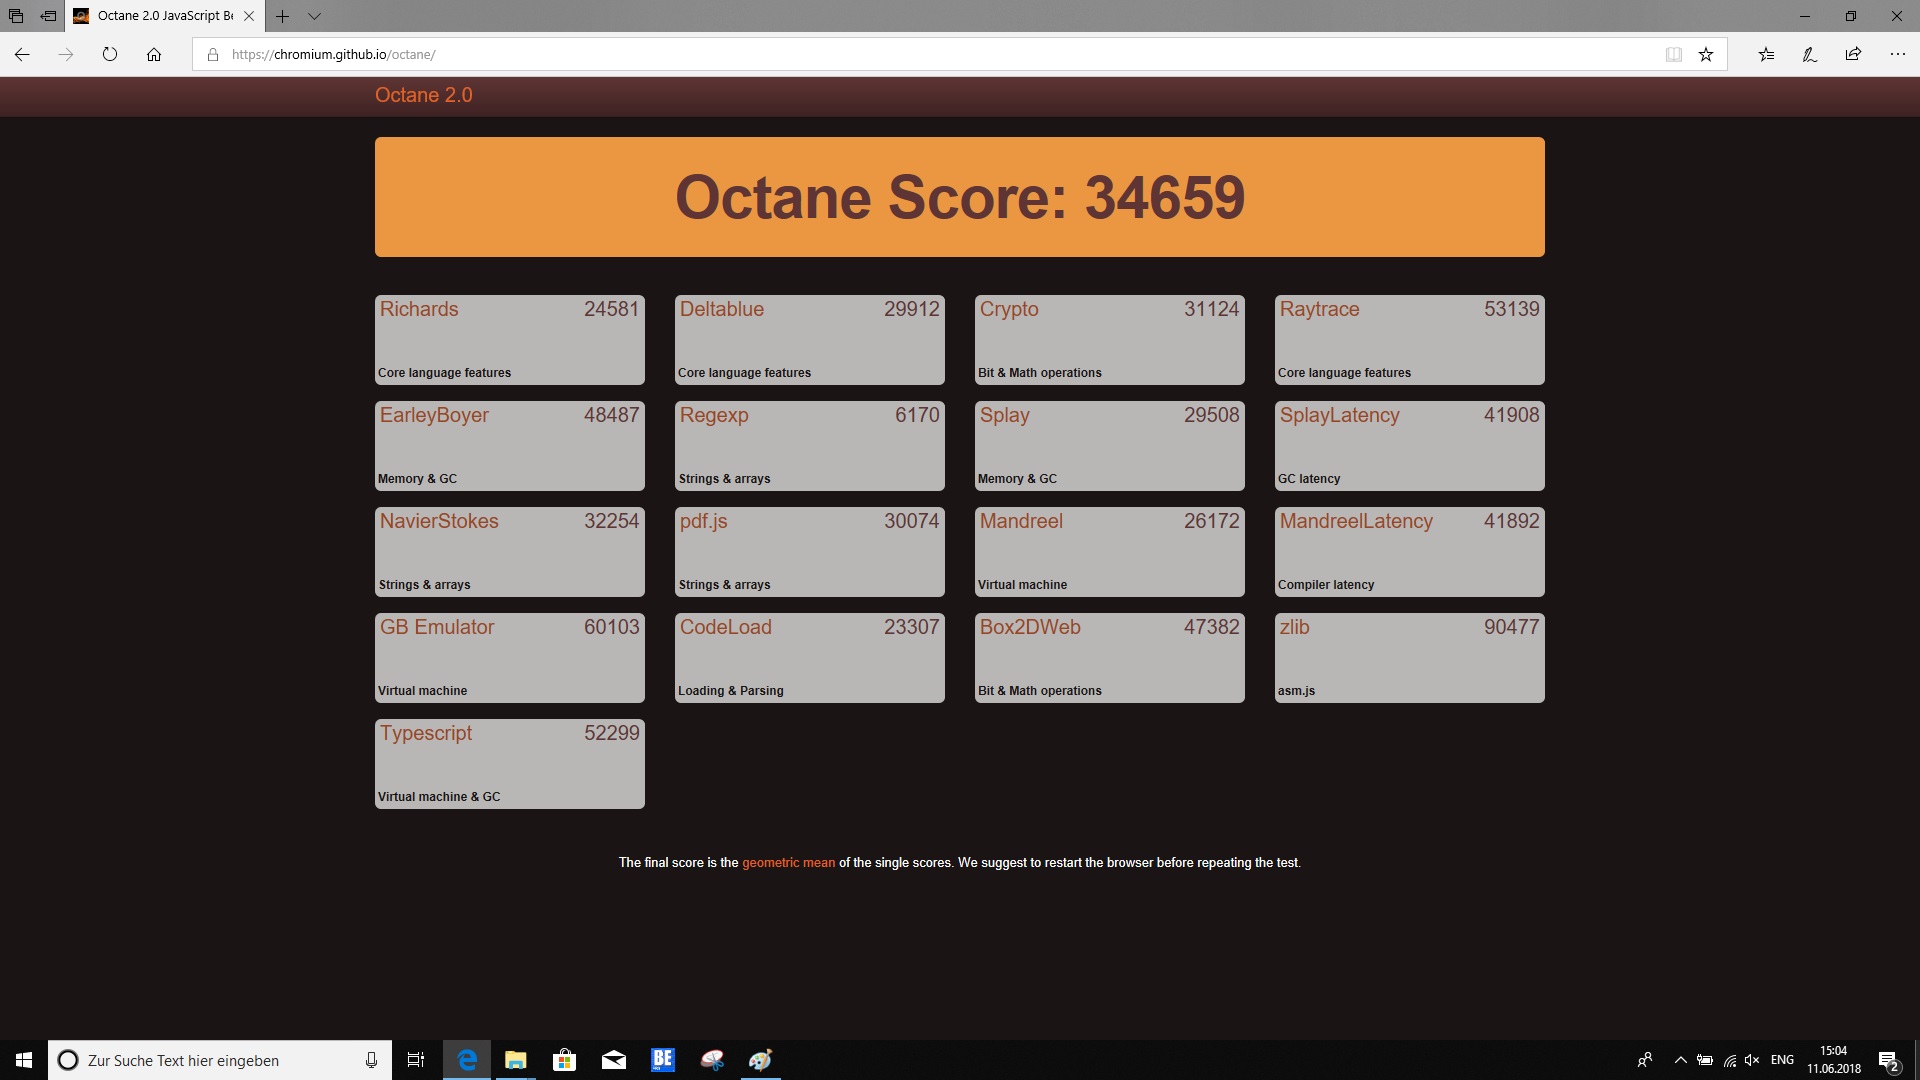
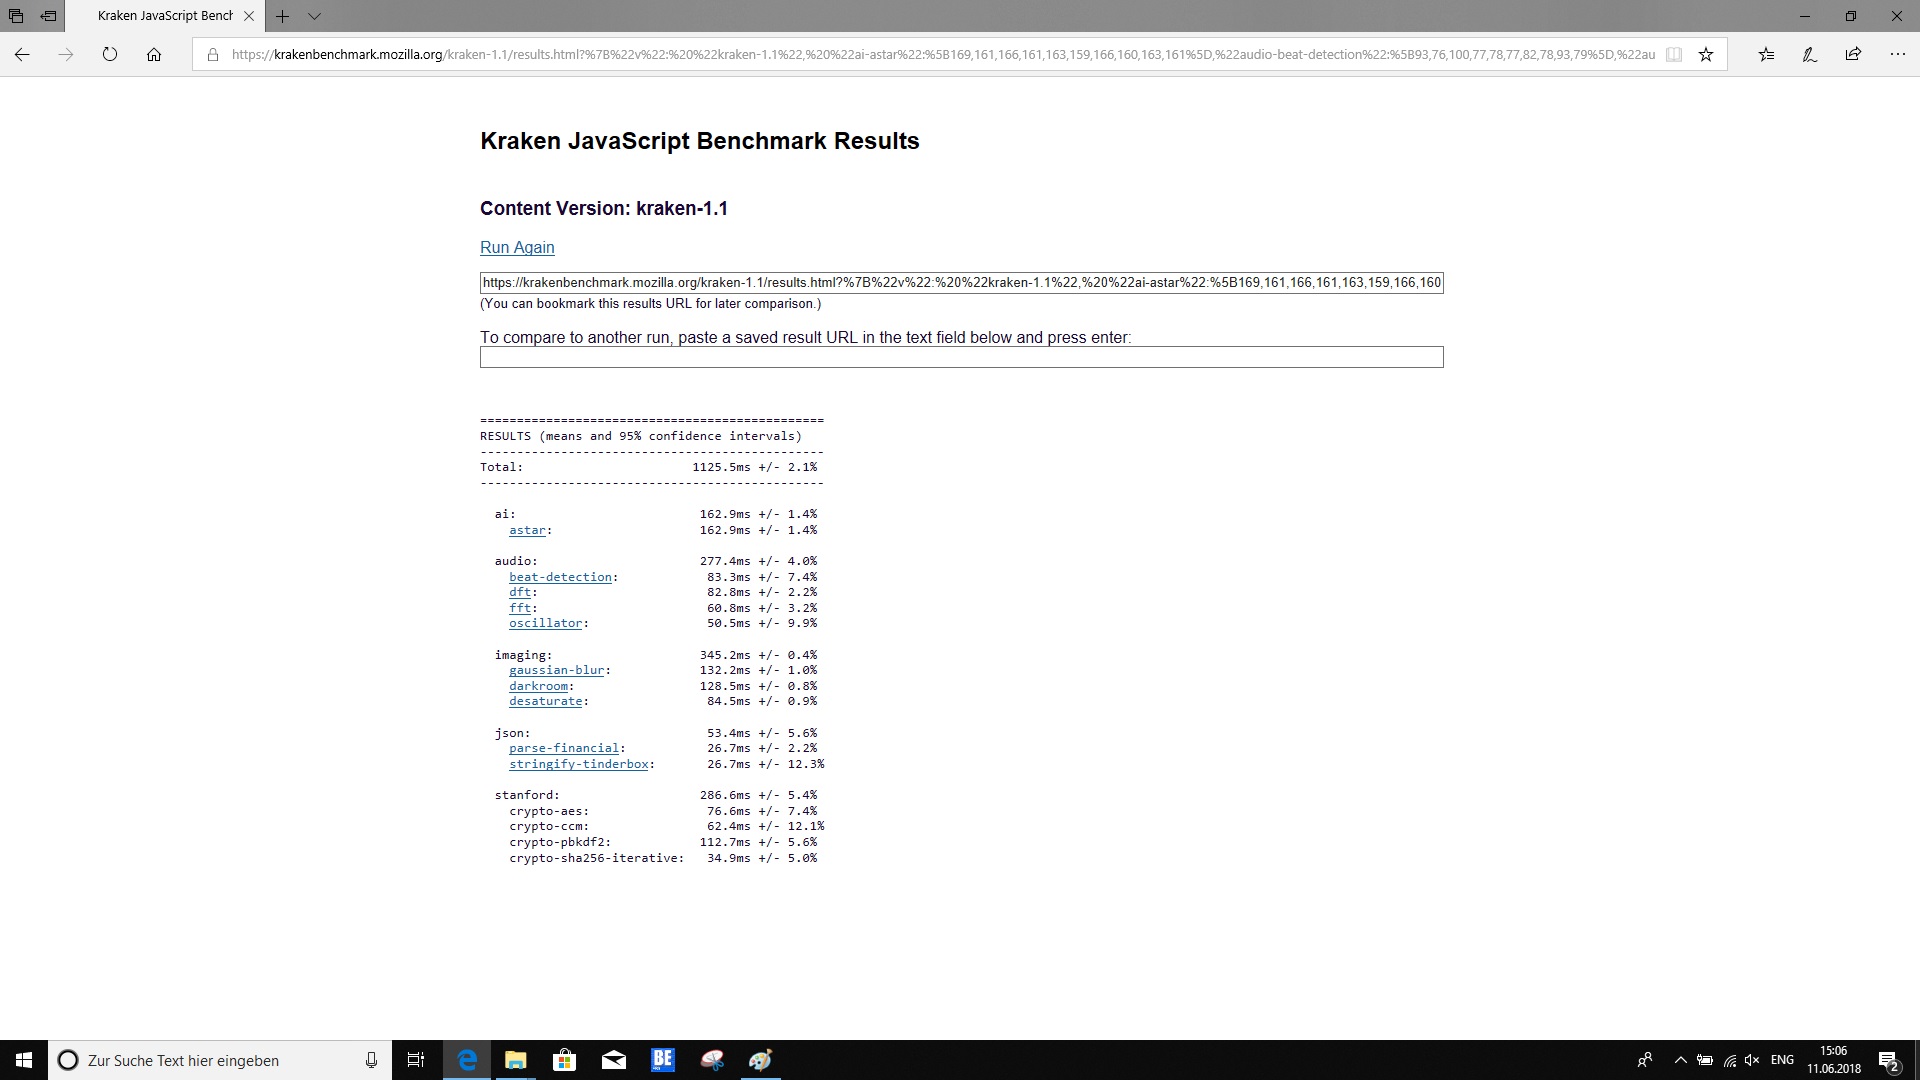
| Octane V2 - Total Score | |
| Média da turma Gaming (93292 - 139447, n=27, últimos 2 anos) | |
| Dell G5 15 5587 | |
| Média Intel Core i5-8300H (30806 - 34659, n=10) | |
| Dell Inspiron 15 7000 7577 | |
| Asus FX503VM-EH73 | |
* ... menor é melhor
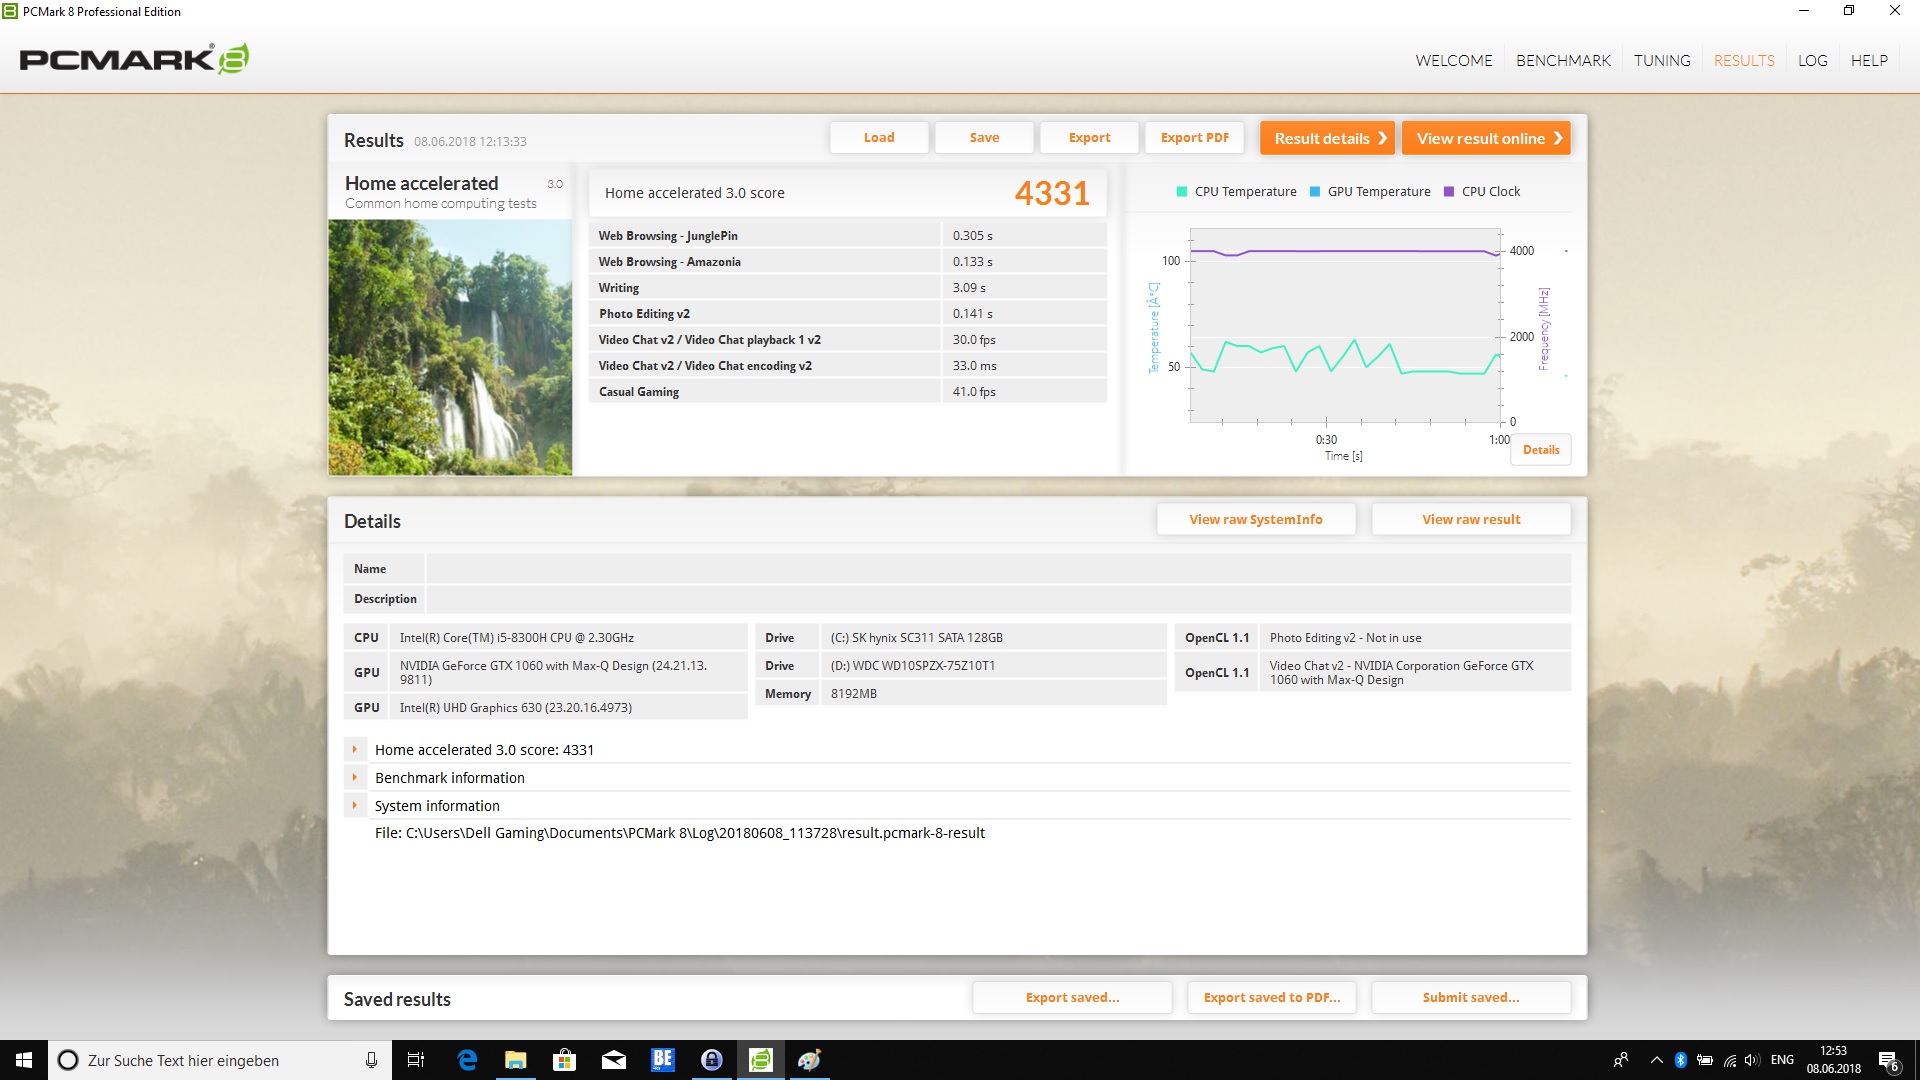
| PCMark 8 Home Score Accelerated v2 | 4331 pontos | |
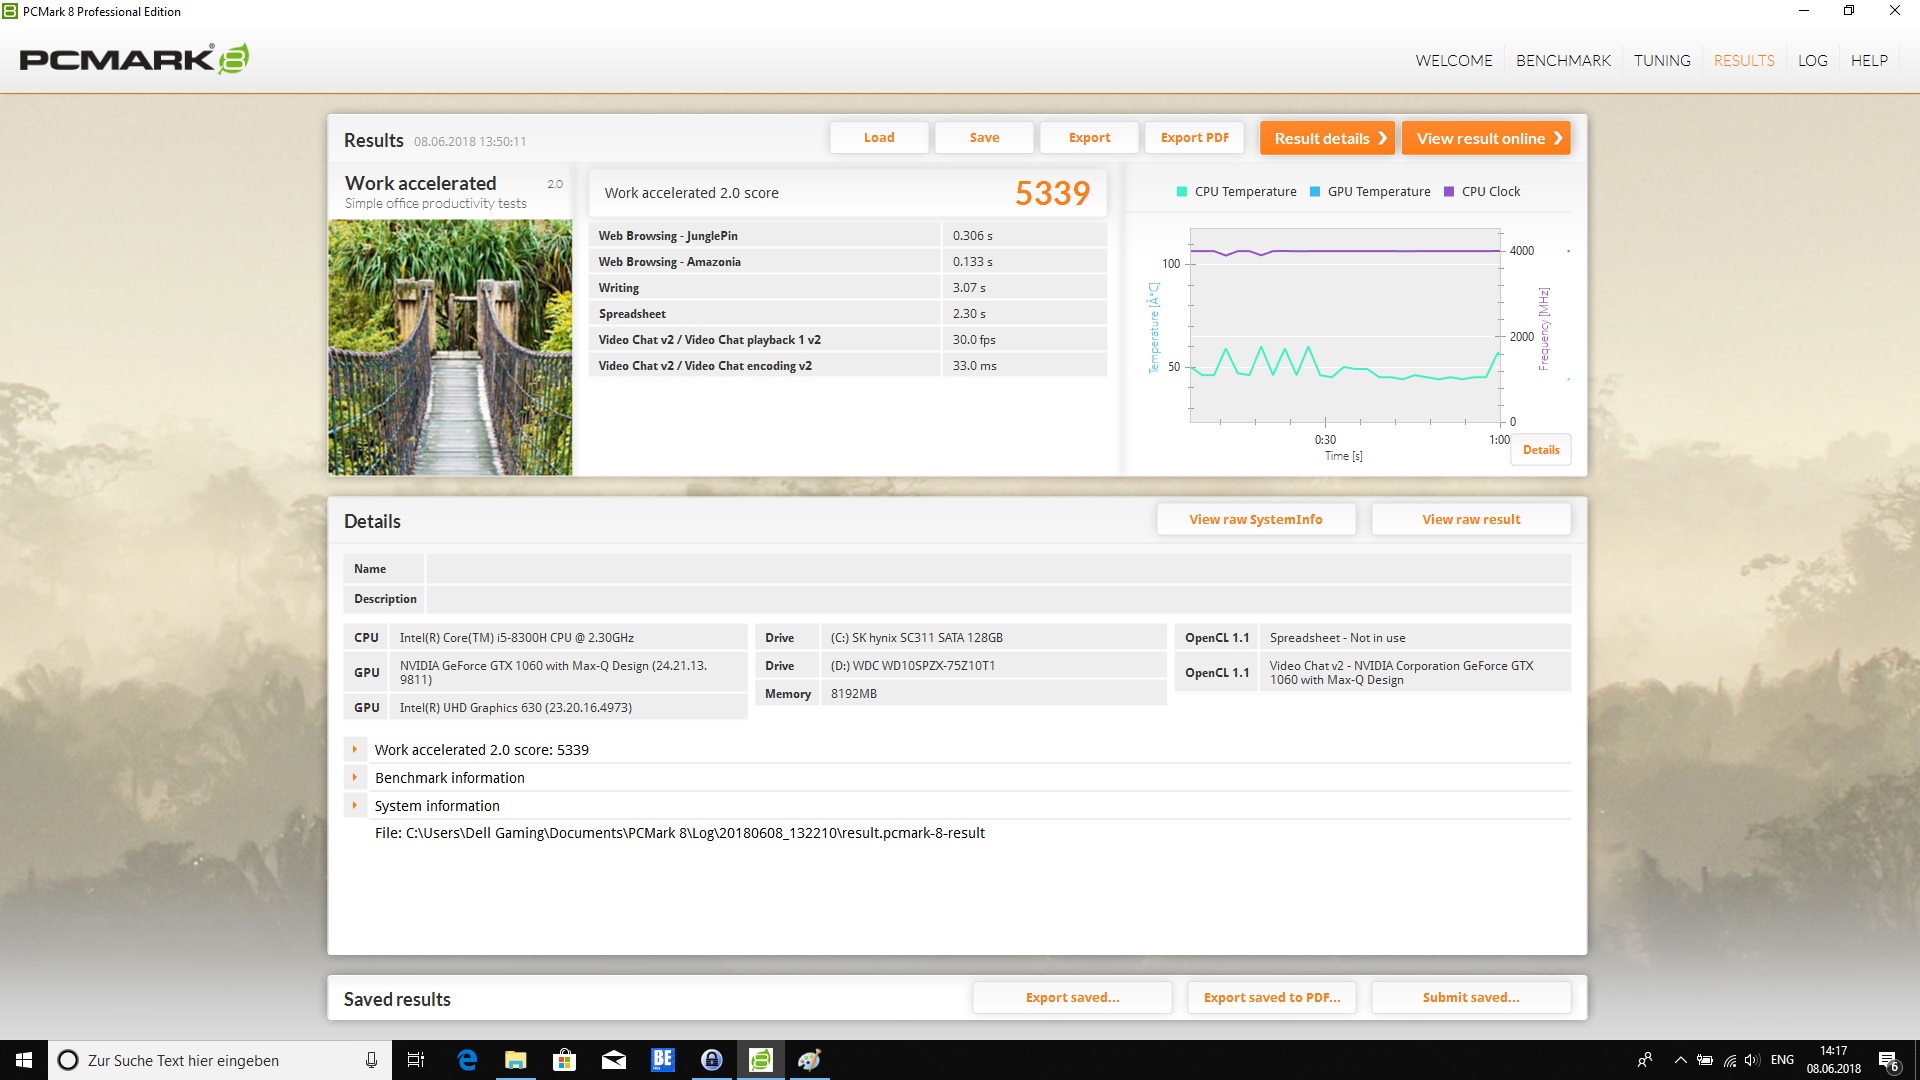
| PCMark 8 Work Score Accelerated v2 | 5339 pontos | |
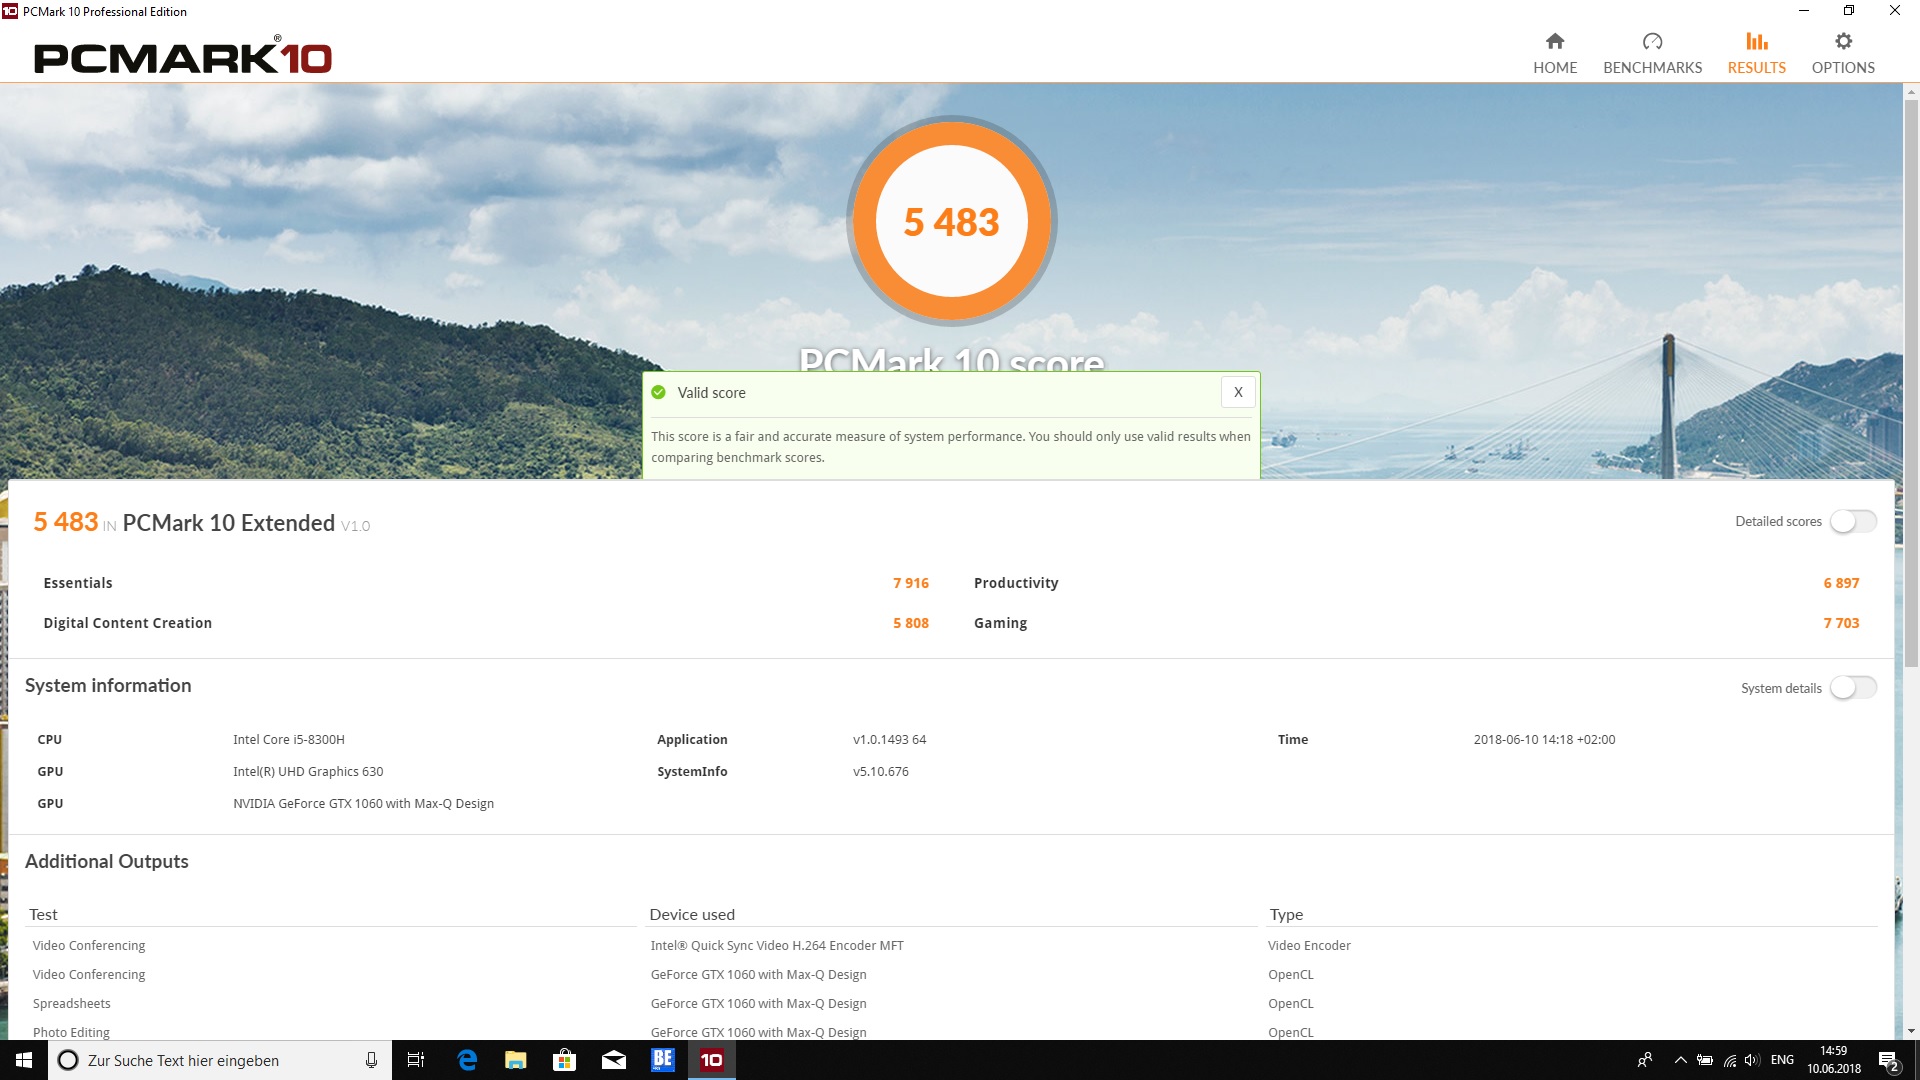
| PCMark 10 Score | 5483 pontos | |
Ajuda | ||
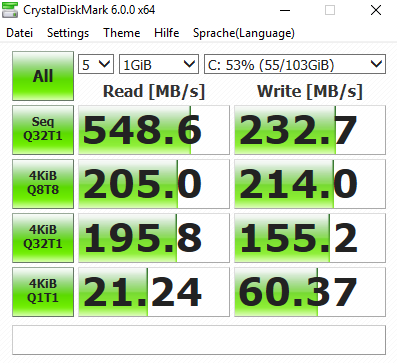

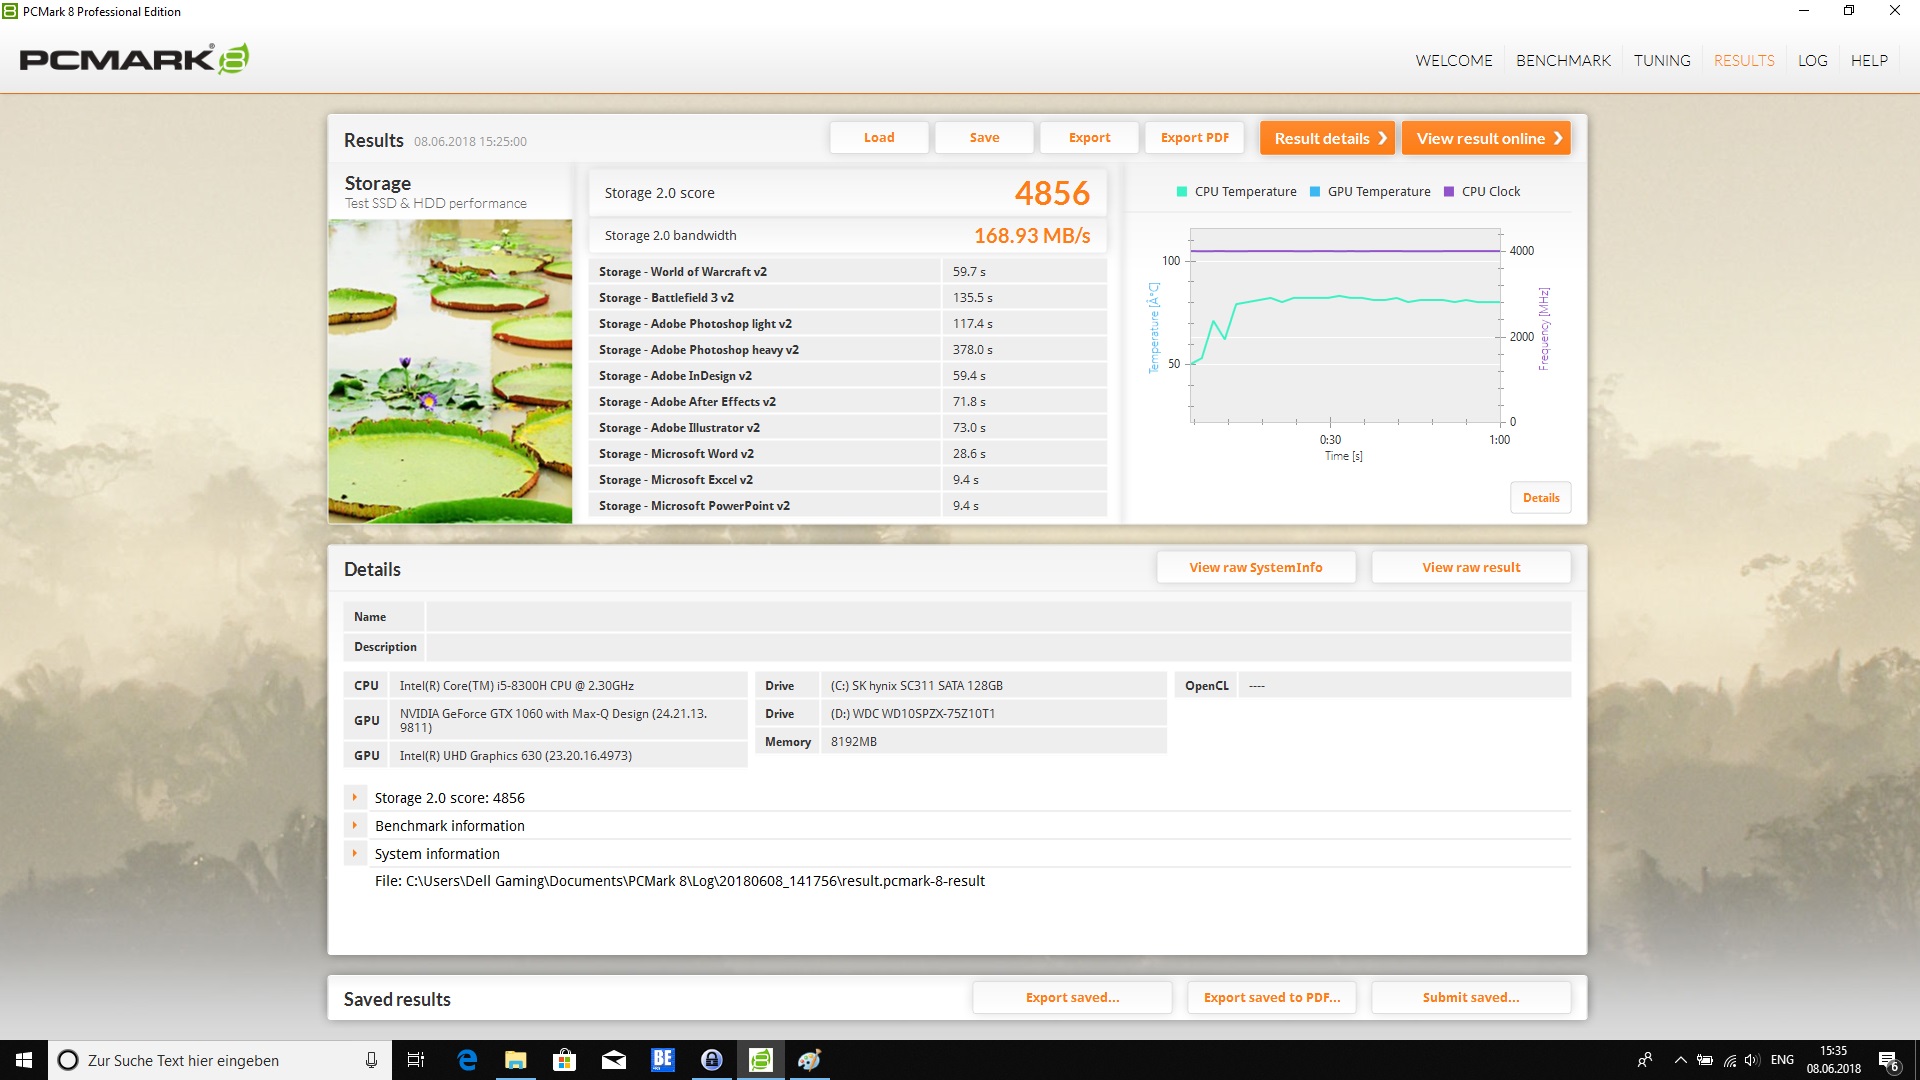
| Dell G5 15 5587 SK hynix SC311 M.2 | Dell Inspiron 15 7000 7577 Samsung PM961 MZVLW256HEHP | PC Zentrum Proteus V Samsung PM961 MZVLW256HEHP | Asus FX503VM-EH73 SanDisk SD8SN8U128G1002 | Acer Nitro 5 Spin NP515-51-86CX Micron 1100 MTFDDAV256TBN | Acer Predator Helios 300 PH317-52-51M6 Hynix HFS128G39TND | |
|---|---|---|---|---|---|---|
| AS SSD | 198% | 220% | -6% | 22% | -47% | |
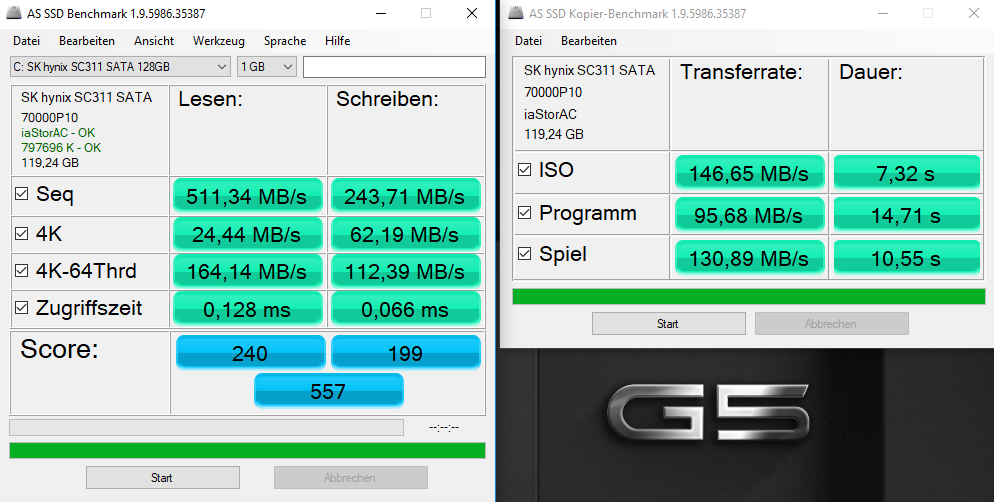
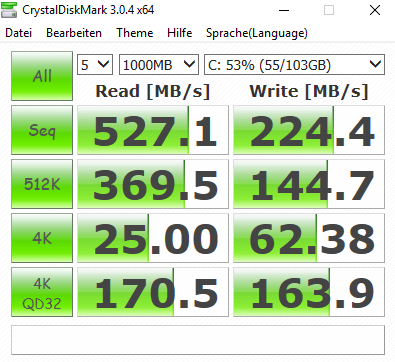
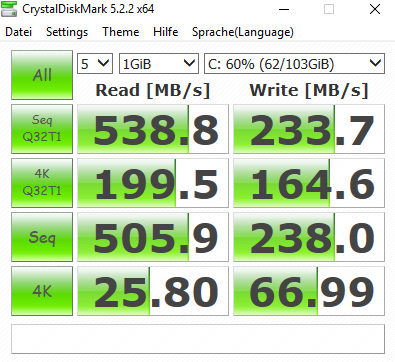
| Seq Read (MB/s) | 511 | 2652 419% | 2541 397% | 476.3 -7% | 490.1 -4% | 513 0% |
| Seq Write (MB/s) | 243.7 | 1181 385% | 1180 384% | 328.4 35% | 335.2 38% | 128.2 -47% |
| 4K Read (MB/s) | 24.44 | 46.95 92% | 51 109% | 20.44 -16% | 25.86 6% | 26.5 8% |
| 4K Write (MB/s) | 62.2 | 100.2 61% | 136.4 119% | 46.48 -25% | 78.1 26% | 62.7 1% |
| Access Time Read * (ms) | 0.128 | 0.058 55% | 0.045 65% | 0.17 -33% | 0.085 34% | |
| Access Time Write * (ms) | 0.066 | 0.037 44% | 0.028 58% | 0.09 -36% | 0.065 2% | 0.259 -292% |
| Score Total (Points) | 557 | 2405 332% | 2842 410% | 798 43% | 835 50% | 811 46% |
* ... menor é melhor

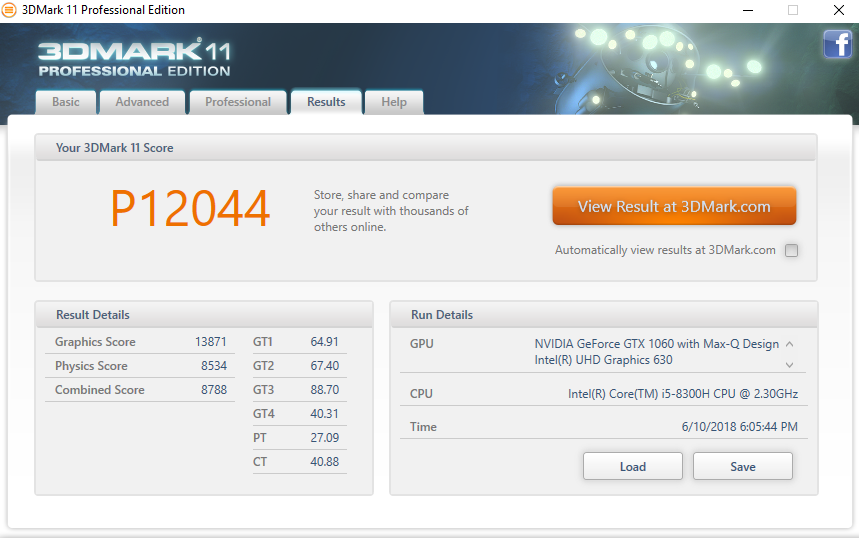
| 3DMark 11 Performance | 12044 pontos | |
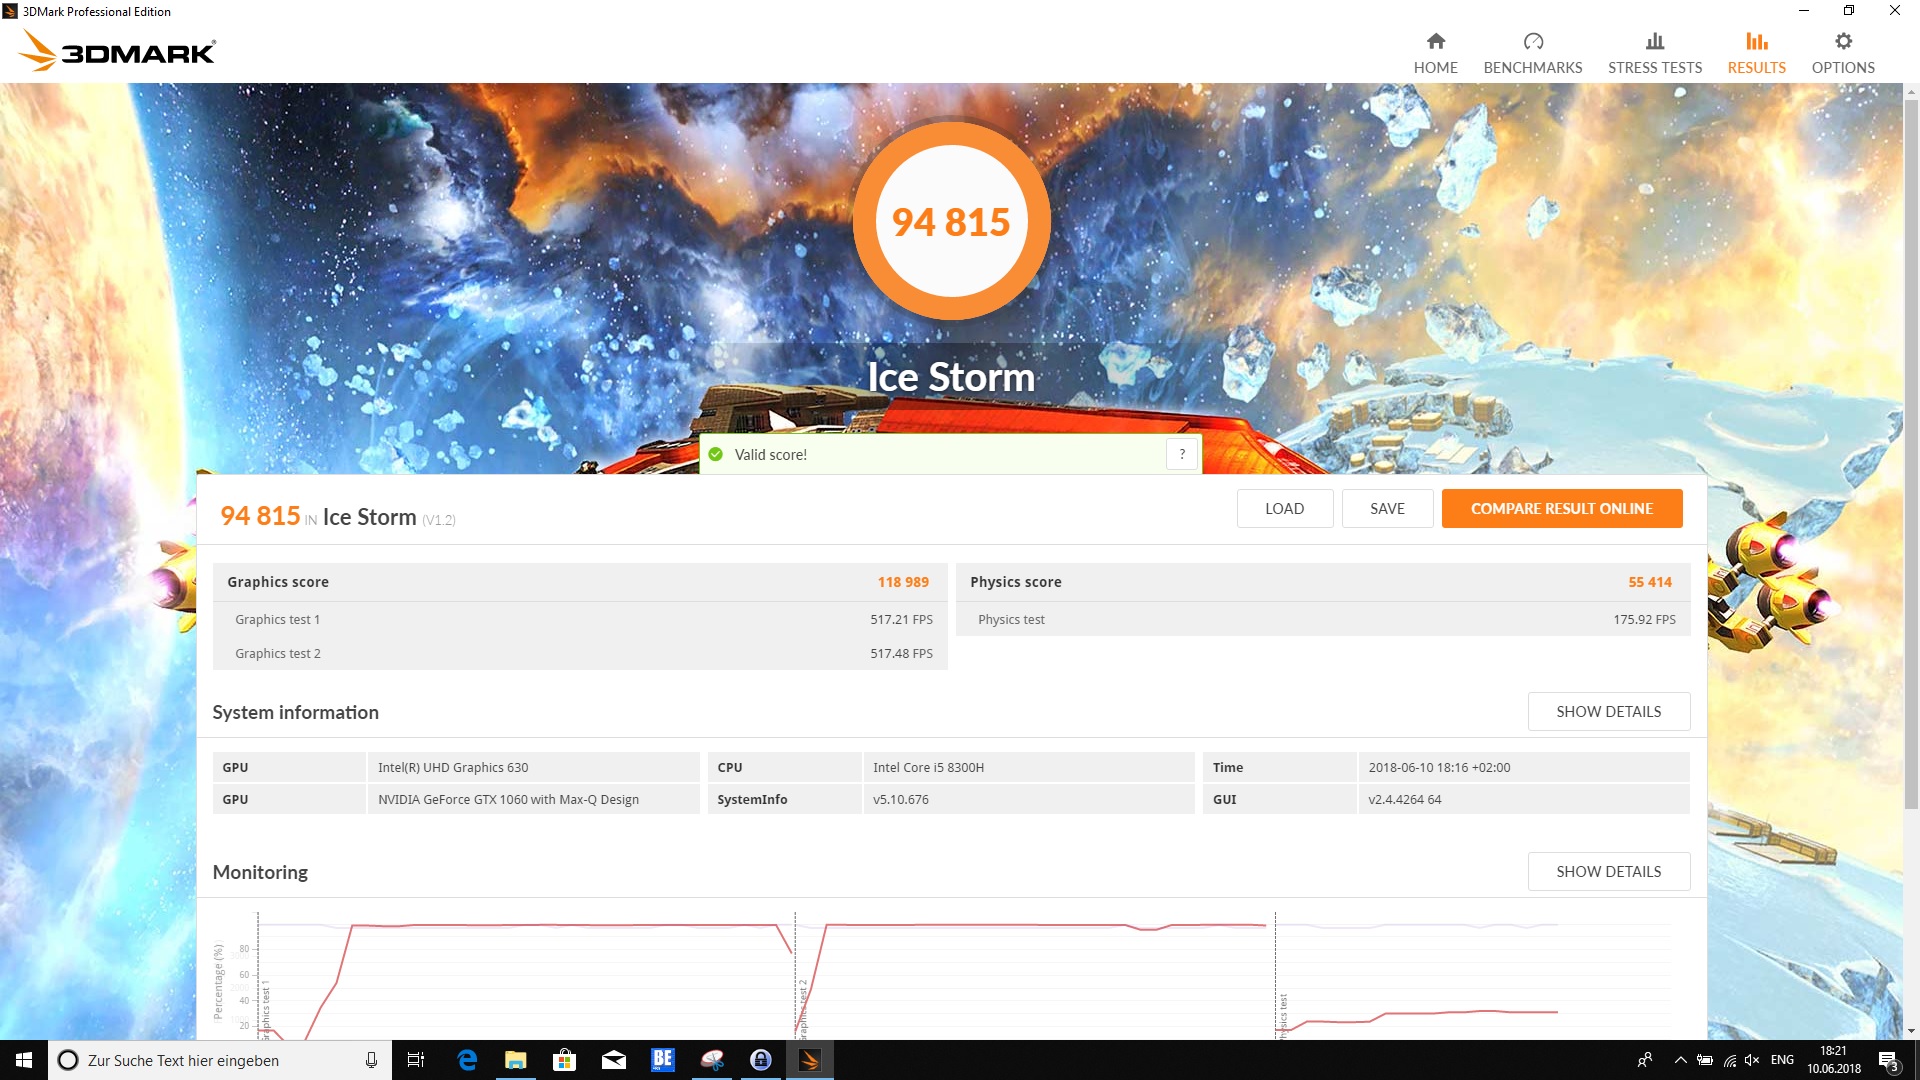
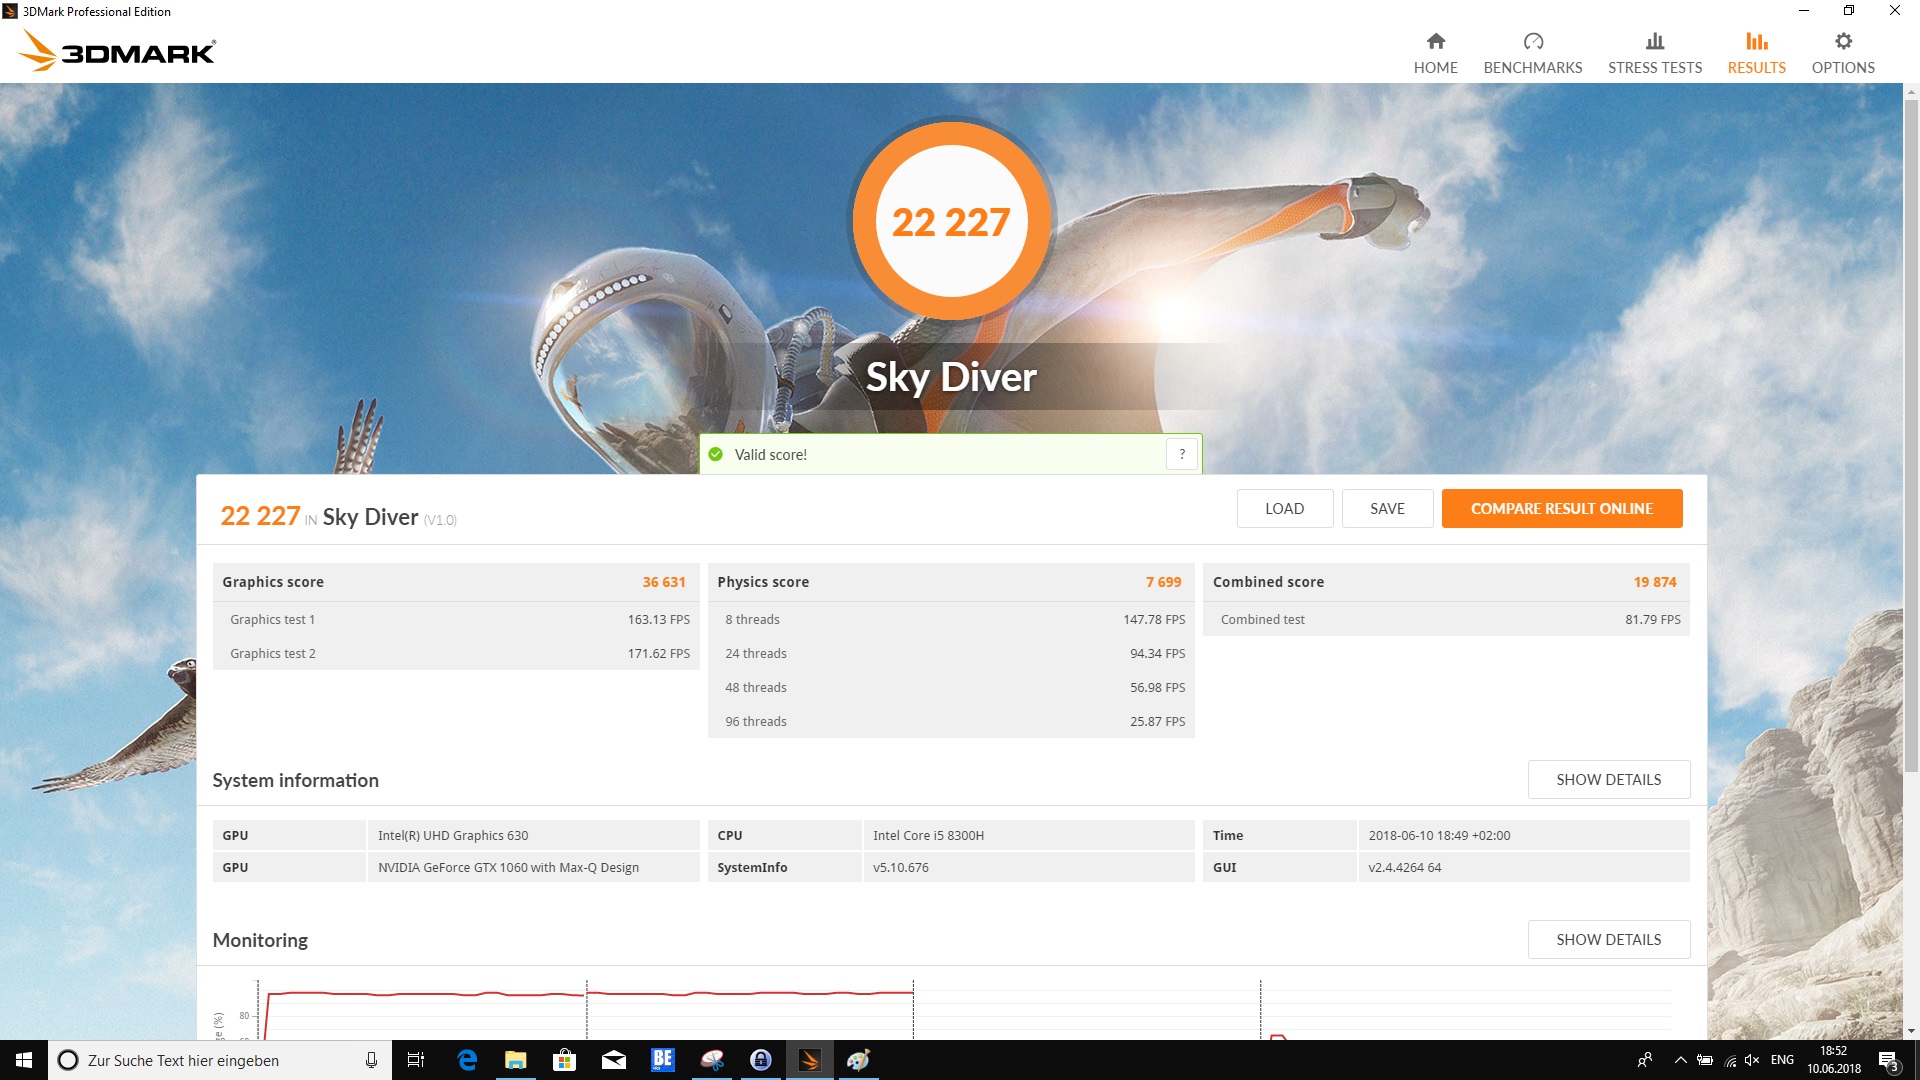
| 3DMark Ice Storm Standard Score | 94815 pontos | |
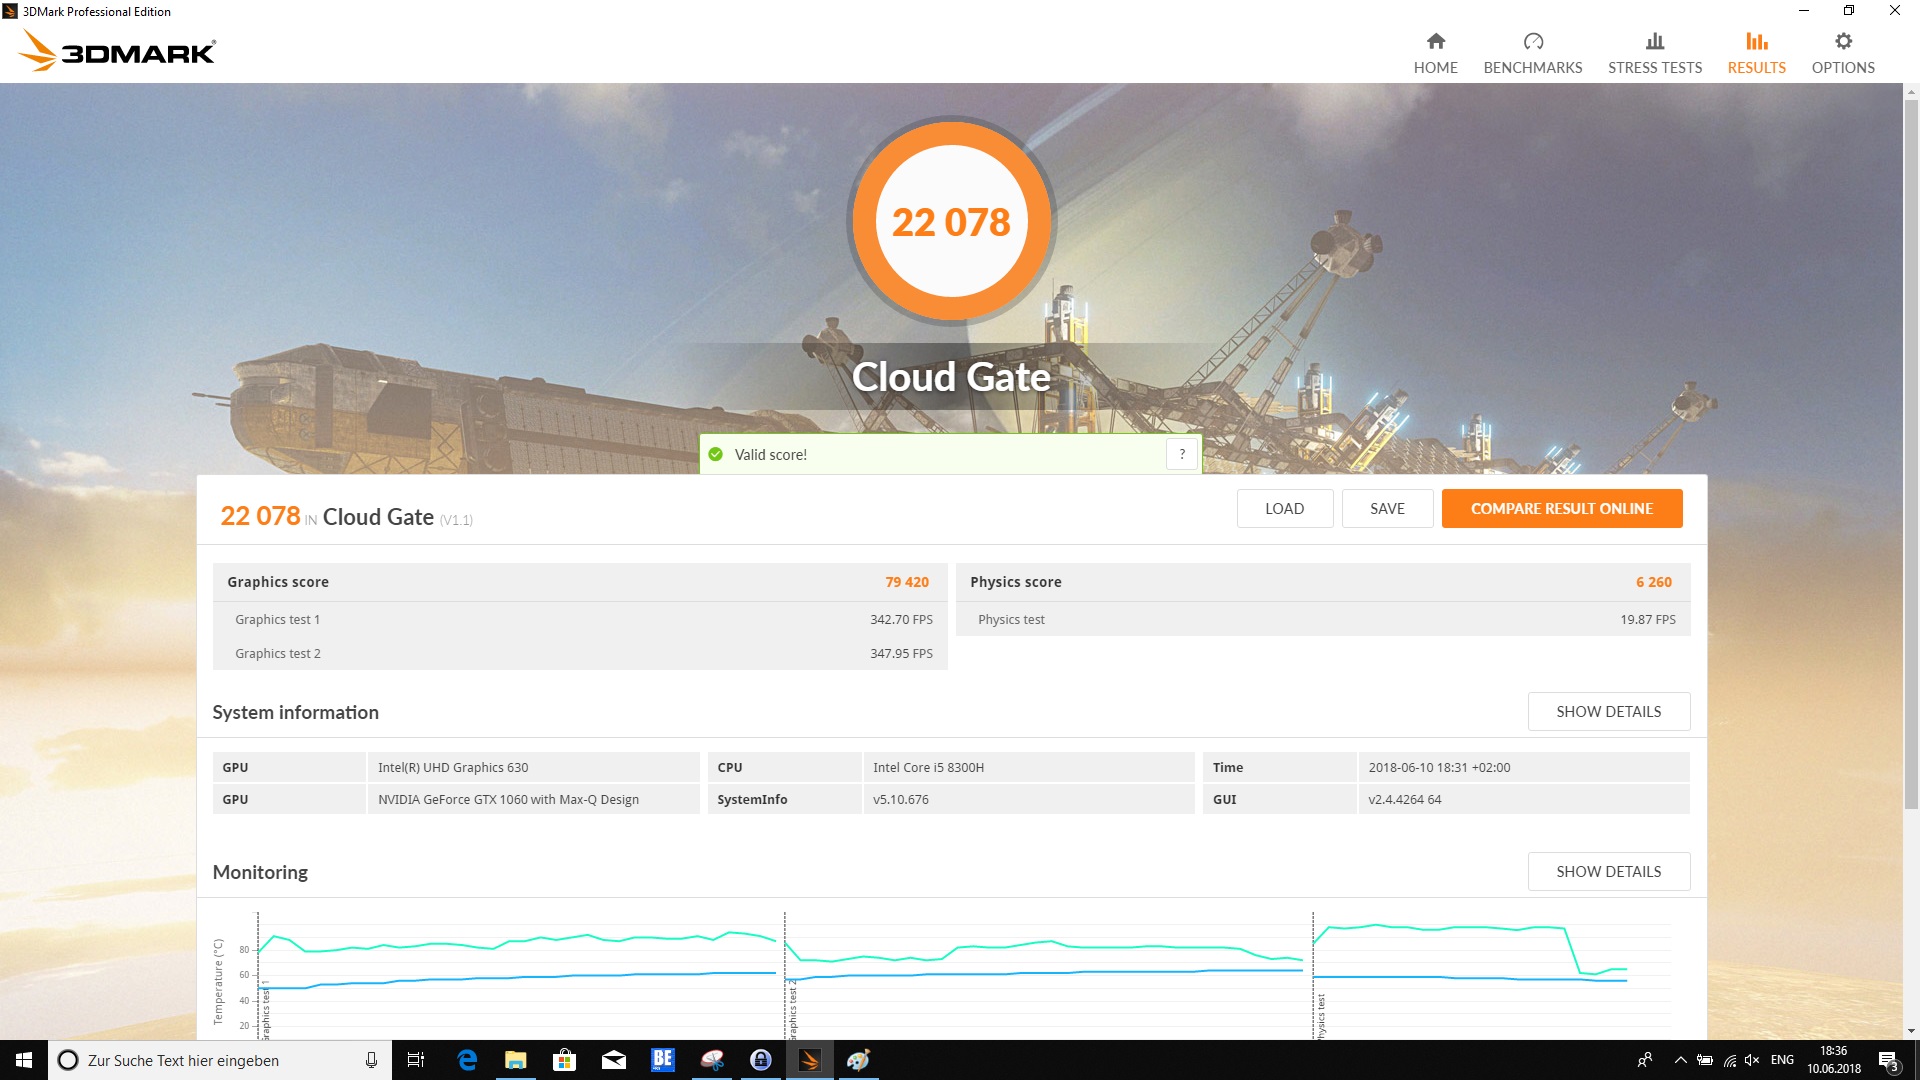
| 3DMark Cloud Gate Standard Score | 22078 pontos | |
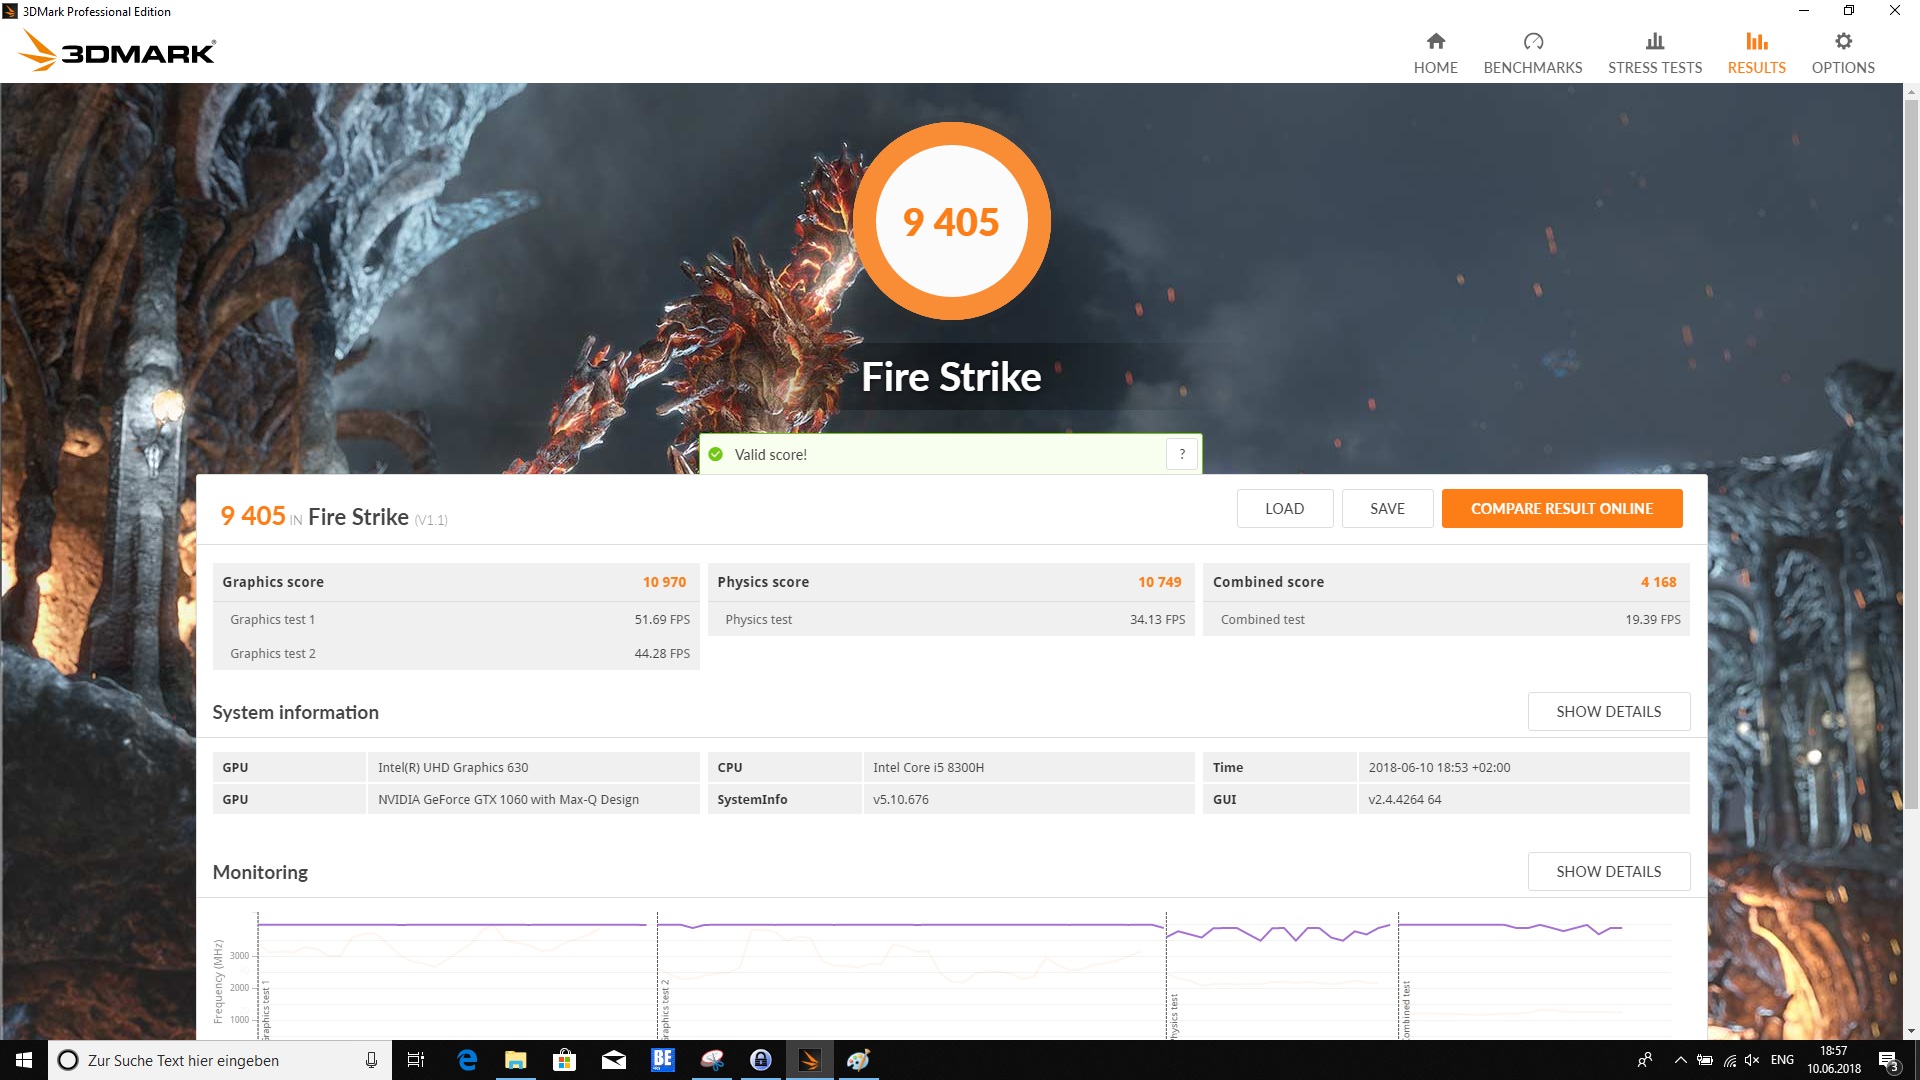
| 3DMark Fire Strike Score | 9405 pontos | |
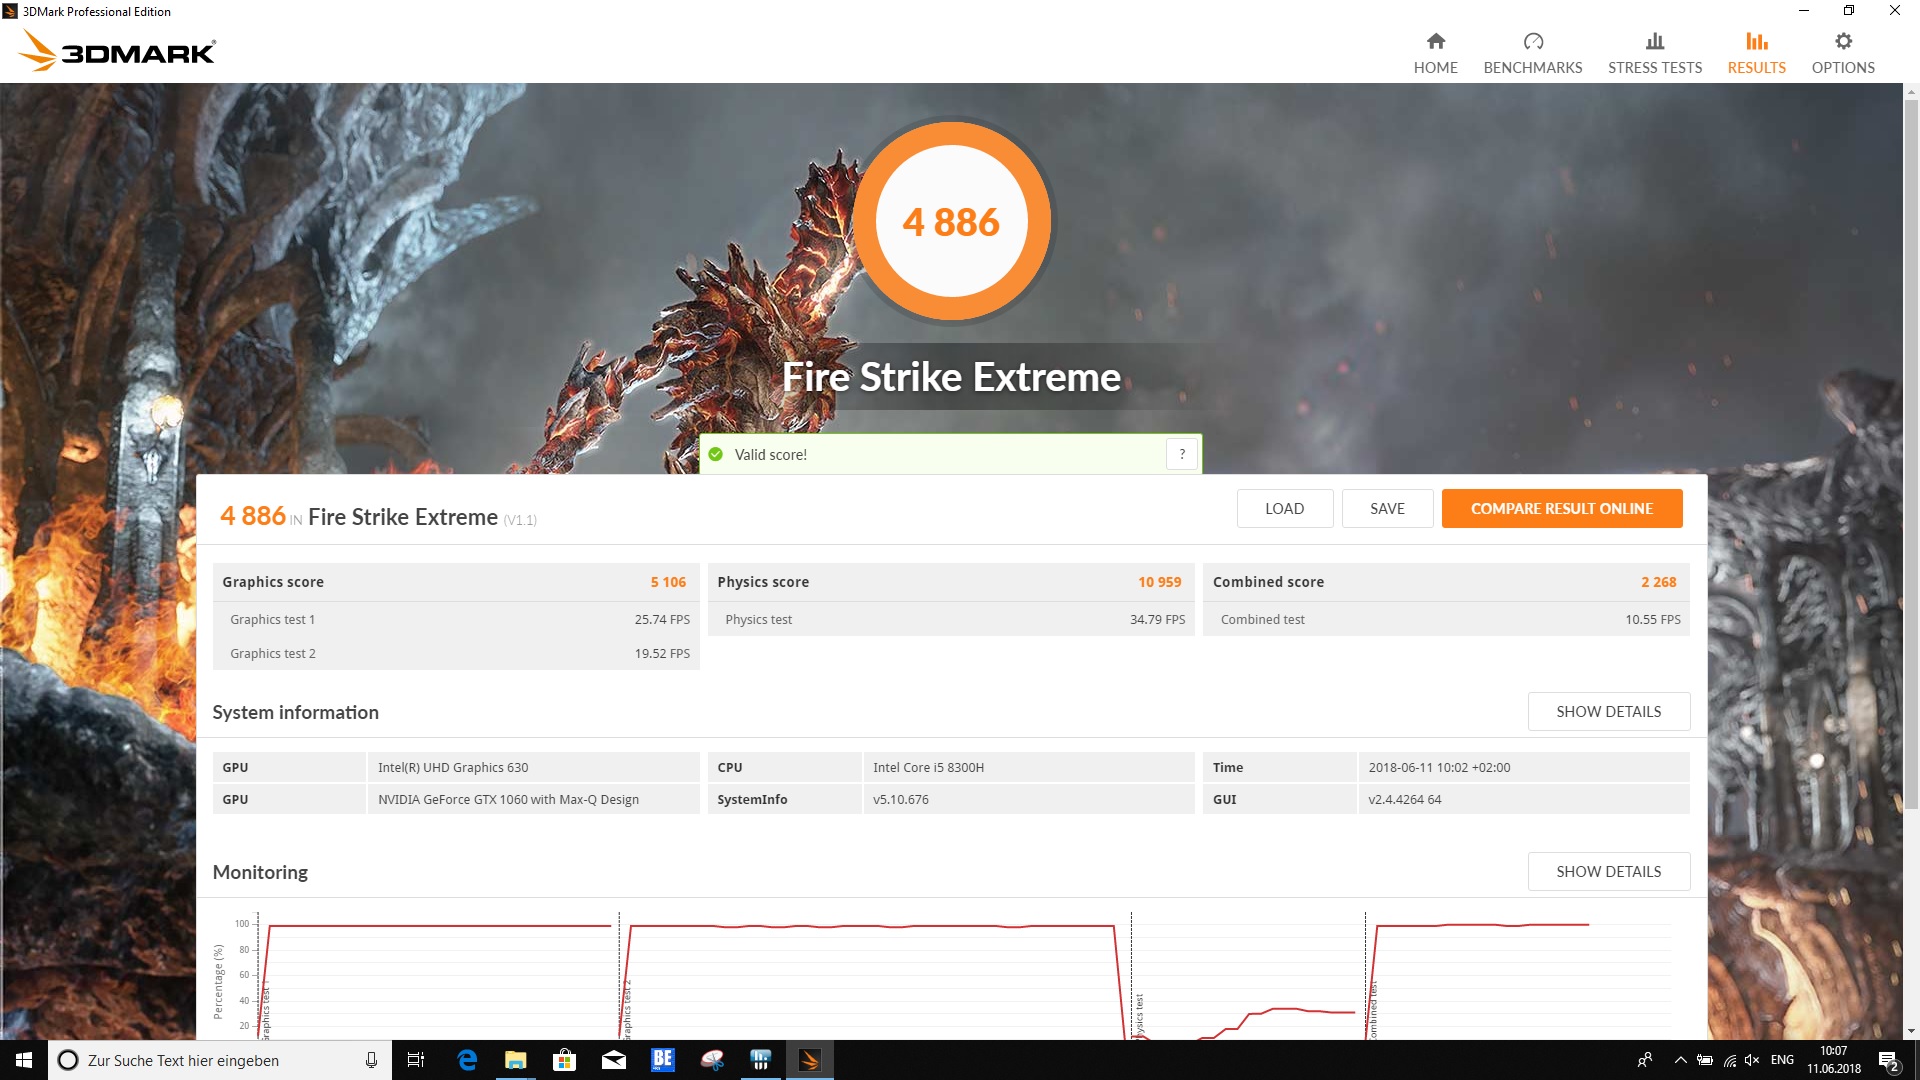
| 3DMark Fire Strike Extreme Score | 4886 pontos | |
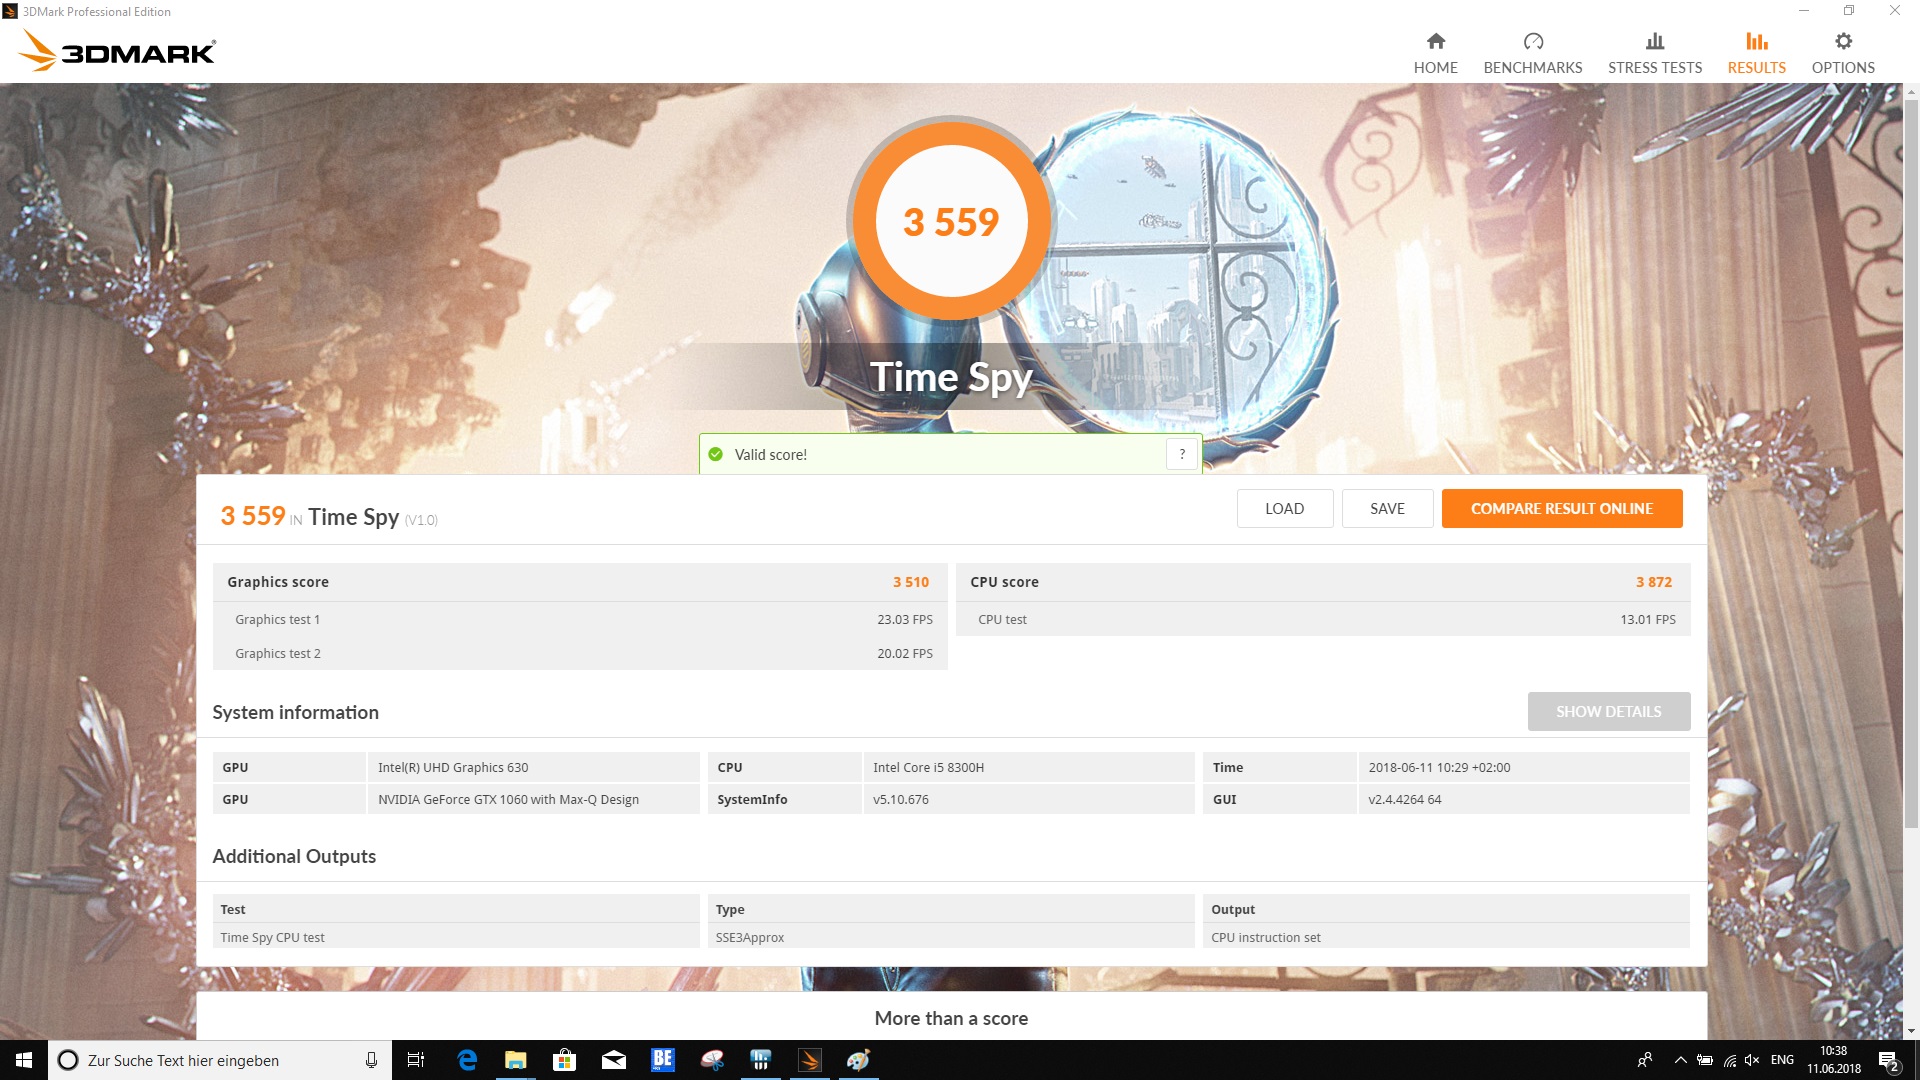
| 3DMark Time Spy Score | 3559 pontos | |
Ajuda | ||
| BioShock Infinite - 1920x1080 Ultra Preset, DX11 (DDOF) | |
| Dell G5 15 5587 | |
| Média NVIDIA GeForce GTX 1060 Max-Q (87.2 - 112, n=8) | |
| Dell Inspiron 15 7000 7577 | |
| Dell Inspiron 15 7000 7577 | |
| Rise of the Tomb Raider - 1920x1080 Very High Preset AA:FX AF:16x | |
| Dell G5 15 5587 | |
| Asus FX503VM-EH73 | |
| Média NVIDIA GeForce GTX 1060 Max-Q (45.3 - 66.4, n=8) | |
| Dell Inspiron 15 7000 7577 | |
| Dell Inspiron 15 7000 7577 | |
| Acer Nitro 5 Spin NP515-51-86CX | |
| The Witcher 3 - 1920x1080 Ultra Graphics & Postprocessing (HBAO+) | |
| Média da turma Gaming (104.7 - 240, n=7, últimos 2 anos) | |
| PC Zentrum Proteus V | |
| Asus FX503VM-EH73 | |
| Média NVIDIA GeForce GTX 1060 Max-Q (34.6 - 38.5, n=9) | |
| Dell Inspiron 15 7000 7577 | |
| Dell G5 15 5587 | |
| Acer Predator Helios 300 PH317-52-51M6 | |
| Dell Inspiron 15 7000 7577 | |
| baixo | média | alto | ultra | 4K | |
|---|---|---|---|---|---|
| BioShock Infinite (2013) | 264 | 233.1 | 213.3 | 107.5 | |
| GTA V (2015) | 156.8 | 151.6 | 106.5 | 61.8 | 53.7 |
| The Witcher 3 (2015) | 172.2 | 122.3 | 58.3 | 34.9 | 23.3 |
| Rise of the Tomb Raider (2016) | 160.9 | 128.1 | 72.7 | 60.5 | 24.6 |
| Playerunknown's Battlegrounds (PUBG) (2017) | 141.9 | 92.5 | 85.6 | 63.3 | 12.9 |
| FIFA 18 (2017) | 290.6 | 277.9 | 252.3 | 245.7 | 130 |
| Assassin´s Creed Origins (2017) | 77 | 67 | 62 | 52 | 21 |
| Call of Duty WWII (2017) | 174.9 | 163.3 | 91.9 | 70.9 | 31.3 |
| Need for Speed Payback (2017) | 117.9 | 89.1 | 78.5 | 66.6 | 23.8 |
| Star Wars Battlefront 2 (2017) | 135.5 | 93.4 | 81.5 | 62.2 | |
| Fortnite (2018) | 178 | 132.6 | 115.7 | 72.8 | |
| Kingdom Come: Deliverance (2018) | 110 | 66.8 | 52.7 | 38 | 12 |
| Far Cry 5 (2018) | 110 | 70 | 65 | 48 | 20 |
Barulho
| Ocioso |
| 31.1 / 31.1 / 34.2 dB |
| Carga |
| 34.9 / 44 dB |
 | ||
30 dB silencioso 40 dB(A) audível 50 dB(A) ruidosamente alto |
||
min: | ||
| Dell G5 15 5587 GeForce GTX 1060 Max-Q, i5-8300H, SK hynix SC311 M.2 | Dell Inspiron 15 7000 7577 GeForce GTX 1050 Mobile, i5-7300HQ, Seagate Mobile HDD 1TB ST1000LX015-1U7172 | Dell Inspiron 15 7000 7577 GeForce GTX 1060 Max-Q, i5-7300HQ, Samsung PM961 MZVLW256HEHP | PC Zentrum Proteus V GeForce GTX 1060 Mobile, i7-7700HQ, Samsung PM961 MZVLW256HEHP | Asus FX503VM-EH73 GeForce GTX 1060 Mobile, i7-7700HQ, SanDisk SD8SN8U128G1002 | Acer Nitro 5 Spin NP515-51-86CX GeForce GTX 1050 Mobile, i5-8550U, Micron 1100 MTFDDAV256TBN | Acer Predator Helios 300 PH317-52-51M6 GeForce GTX 1050 Ti Mobile, i5-8300H, Hynix HFS128G39TND | |
|---|---|---|---|---|---|---|---|
| Noise | -2% | 9% | -16% | -2% | -2% | -5% | |
| desligado / ambiente * (dB) | 30.3 | 31 -2% | 28 8% | 31 -2% | 27.8 8% | 30.4 -0% | 29 4% |
| Idle Minimum * (dB) | 31.1 | 32.7 -5% | 28 10% | 37 -19% | 29.6 5% | 30.9 1% | 29 7% |
| Idle Average * (dB) | 31.1 | 32.7 -5% | 28 10% | 38 -22% | 29.6 5% | 30.9 1% | 31 -0% |
| Idle Maximum * (dB) | 34.2 | 32.7 4% | 28 18% | 39 -14% | 29.6 13% | 30.9 10% | 33 4% |
| Load Average * (dB) | 34.9 | 38.7 -11% | 30.3 13% | 47 -35% | 37.3 -7% | 42.6 -22% | 45 -29% |
| Witcher 3 ultra * (dB) | 42.7 | 39 9% | 39.5 7% | 43 -1% | 49.8 -17% | 45 -5% | |
| Load Maximum * (dB) | 44 | 44.6 -1% | 46.5 -6% | 52 -18% | 53.7 -22% | 45 -2% | 51 -16% |
* ... menor é melhor
(-) A temperatura máxima no lado superior é 50.2 °C / 122 F, em comparação com a média de 40.4 °C / 105 F , variando de 21.2 a 68.8 °C para a classe Gaming.
(-) A parte inferior aquece até um máximo de 57 °C / 135 F, em comparação com a média de 43.2 °C / 110 F
(+) Em uso inativo, a temperatura média para o lado superior é 27.3 °C / 81 F, em comparação com a média do dispositivo de 33.9 °C / ### class_avg_f### F.
(-) Jogando The Witcher 3, a temperatura média para o lado superior é 38.5 °C / 101 F, em comparação com a média do dispositivo de 33.9 °C / ## #class_avg_f### F.
(+) Os apoios para as mãos e o touchpad estão atingindo a temperatura máxima da pele (33.7 °C / 92.7 F) e, portanto, não estão quentes.
(-) A temperatura média da área do apoio para as mãos de dispositivos semelhantes foi 28.8 °C / 83.8 F (-4.9 °C / -8.9 F).
| Dell G5 15 5587 GeForce GTX 1060 Max-Q, i5-8300H, SK hynix SC311 M.2 | Dell Inspiron 15 7000 7577 GeForce GTX 1050 Mobile, i5-7300HQ, Seagate Mobile HDD 1TB ST1000LX015-1U7172 | Dell Inspiron 15 7000 7577 GeForce GTX 1060 Max-Q, i5-7300HQ, Samsung PM961 MZVLW256HEHP | PC Zentrum Proteus V GeForce GTX 1060 Mobile, i7-7700HQ, Samsung PM961 MZVLW256HEHP | Asus FX503VM-EH73 GeForce GTX 1060 Mobile, i7-7700HQ, SanDisk SD8SN8U128G1002 | Acer Nitro 5 Spin NP515-51-86CX GeForce GTX 1050 Mobile, i5-8550U, Micron 1100 MTFDDAV256TBN | Acer Predator Helios 300 PH317-52-51M6 GeForce GTX 1050 Ti Mobile, i5-8300H, Hynix HFS128G39TND | |
|---|---|---|---|---|---|---|---|
| Heat | 13% | 12% | 5% | -20% | 10% | -3% | |
| Maximum Upper Side * (°C) | 50.2 | 35.9 28% | 44 12% | 44 12% | 59.6 -19% | 46 8% | 50 -0% |
| Maximum Bottom * (°C) | 57 | 41.6 27% | 43.8 23% | 53 7% | 56 2% | 47 18% | 52 9% |
| Idle Upper Side * (°C) | 28.6 | 27.9 2% | 26 9% | 29 -1% | 37 -29% | 29.6 -3% | 33 -15% |
| Idle Bottom * (°C) | 28.9 | 30.5 -6% | 28 3% | 29 -0% | 38.6 -34% | 24.6 15% | 30 -4% |
* ... menor é melhor
Dell G5 15 5587 análise de áudio
(-) | alto-falantes não muito altos (###valor### dB)
Graves 100 - 315Hz
(±) | graves reduzidos - em média 12.5% menor que a mediana
(+) | o baixo é linear (5.9% delta para a frequência anterior)
Médios 400 - 2.000 Hz
(+) | médios equilibrados - apenas 4.6% longe da mediana
(+) | médios são lineares (5.1% delta para frequência anterior)
Altos 2 - 16 kHz
(+) | agudos equilibrados - apenas 1.1% longe da mediana
(+) | os máximos são lineares (3.6% delta da frequência anterior)
Geral 100 - 16.000 Hz
(+) | o som geral é linear (14.9% diferença em relação à mediana)
Comparado com a mesma classe
» 30% de todos os dispositivos testados nesta classe foram melhores, 7% semelhantes, 63% piores
» O melhor teve um delta de 6%, a média foi 18%, o pior foi 132%
Comparado com todos os dispositivos testados
» 20% de todos os dispositivos testados foram melhores, 4% semelhantes, 76% piores
» O melhor teve um delta de 4%, a média foi 23%, o pior foi 134%
Asus FX503VM-EH73 análise de áudio
(-) | alto-falantes não muito altos (###valor### dB)
Graves 100 - 315Hz
(±) | graves reduzidos - em média 11.5% menor que a mediana
(±) | a linearidade dos graves é média (14.8% delta para a frequência anterior)
Médios 400 - 2.000 Hz
(+) | médios equilibrados - apenas 1.9% longe da mediana
(+) | médios são lineares (6.7% delta para frequência anterior)
Altos 2 - 16 kHz
(+) | agudos equilibrados - apenas 4.2% longe da mediana
(±) | a linearidade dos máximos é média (7.6% delta para frequência anterior)
Geral 100 - 16.000 Hz
(±) | a linearidade do som geral é média (19.4% diferença em relação à mediana)
Comparado com a mesma classe
» 67% de todos os dispositivos testados nesta classe foram melhores, 7% semelhantes, 26% piores
» O melhor teve um delta de 6%, a média foi 18%, o pior foi 132%
Comparado com todos os dispositivos testados
» 48% de todos os dispositivos testados foram melhores, 7% semelhantes, 45% piores
» O melhor teve um delta de 4%, a média foi 23%, o pior foi 134%
| desligado | |
| Ocioso | |
| Carga |
|
Key:
min: | |
| Dell G5 15 5587 i5-8300H, GeForce GTX 1060 Max-Q, SK hynix SC311 M.2, IPS, 1920x1080, 15.6" | Dell Inspiron 15 7000 7577 i5-7300HQ, GeForce GTX 1050 Mobile, Seagate Mobile HDD 1TB ST1000LX015-1U7172, IPS, 1920x1080, 15.6" | Dell Inspiron 15 7000 7577 i5-7300HQ, GeForce GTX 1060 Max-Q, Samsung PM961 MZVLW256HEHP, IPS, 1920x1080, 15.6" | PC Zentrum Proteus V i7-7700HQ, GeForce GTX 1060 Mobile, Samsung PM961 MZVLW256HEHP, IPS, 1920x1080, 15.6" | Asus FX503VM-EH73 i7-7700HQ, GeForce GTX 1060 Mobile, SanDisk SD8SN8U128G1002, IPS, 1920x1080, 15.6" | Acer Nitro 5 Spin NP515-51-86CX i5-8550U, GeForce GTX 1050 Mobile, Micron 1100 MTFDDAV256TBN, IPS, 1920x1080, 15.6" | Acer Predator Helios 300 PH317-52-51M6 i5-8300H, GeForce GTX 1050 Ti Mobile, Hynix HFS128G39TND, IPS, 1920x1080, 17.3" | Média NVIDIA GeForce GTX 1060 Max-Q | Média da turma Gaming | |
|---|---|---|---|---|---|---|---|---|---|
| Power Consumption | 3% | 8% | -181% | -50% | 20% | -10% | -40% | -112% | |
| Idle Minimum * (Watt) | 4.9 | 5.3 -8% | 7.1 -45% | 28 -471% | 12.8 -161% | 4.1 16% | 6 -22% | 9.14 ? -87% | 13 ? -165% |
| Idle Average * (Watt) | 8.5 | 8.8 -4% | 7.6 11% | 32 -276% | 15.4 -81% | 7.4 13% | 9 -6% | 13.2 ? -55% | 19 ? -124% |
| Idle Maximum * (Watt) | 9.1 | 9.7 -7% | 8.6 5% | 38 -318% | 15.9 -75% | 8.6 5% | 13 -43% | 15.1 ? -66% | 24.6 ? -170% |
| Load Average * (Watt) | 90.7 | 100 -10% | 59.5 34% | 91 -0% | 78 14% | 66 27% | 95 -5% | 88.3 ? 3% | 110.7 ? -22% |
| Witcher 3 ultra * (Watt) | 110 | 87 21% | 89 19% | 124 -13% | 107.3 2% | 102 7% | |||
| Load Maximum * (Watt) | 144 | 109 24% | 112.8 22% | 152 -6% | 143.4 -0% | 87 40% | 134 7% | 134.9 ? 6% | 259 ? -80% |
* ... menor é melhor
| Dell G5 15 5587 i5-8300H, GeForce GTX 1060 Max-Q, 56 Wh | Dell Inspiron 15 7000 7577 i5-7300HQ, GeForce GTX 1050 Mobile, 56 Wh | Dell Inspiron 15 7000 7577 i5-7300HQ, GeForce GTX 1060 Max-Q, 56 Wh | PC Zentrum Proteus V i7-7700HQ, GeForce GTX 1060 Mobile, Wh | Asus FX503VM-EH73 i7-7700HQ, GeForce GTX 1060 Mobile, 64 Wh | Acer Nitro 5 Spin NP515-51-86CX i5-8550U, GeForce GTX 1050 Mobile, 48 Wh | Acer Predator Helios 300 PH317-52-51M6 i5-8300H, GeForce GTX 1050 Ti Mobile, 48 Wh | Média da turma Gaming | |
|---|---|---|---|---|---|---|---|---|
| Duração da bateria | -6% | -9% | -47% | -44% | 2% | -11% | 0% | |
| Reader / Idle (h) | 11.8 | 11.1 -6% | 11 -7% | 3.7 -69% | 5.7 -52% | 12.5 6% | 11.8 0% | 8.27 ? -30% |
| H.264 (h) | 5.4 | 5.2 -4% | 3.3 -39% | 6.2 15% | 8.32 ? 54% | |||
| WiFi v1.3 (h) | 6.5 | 6.8 5% | 6.9 6% | 3.3 -49% | 4.6 -29% | 6.6 2% | 5.9 -9% | 7.11 ? 9% |
| Load (h) | 2.2 | 1.8 -18% | 1.6 -27% | 1.5 -32% | 1.1 -50% | 1.9 -14% | 1.7 -23% | 1.502 ? -32% |
Pro
Contra
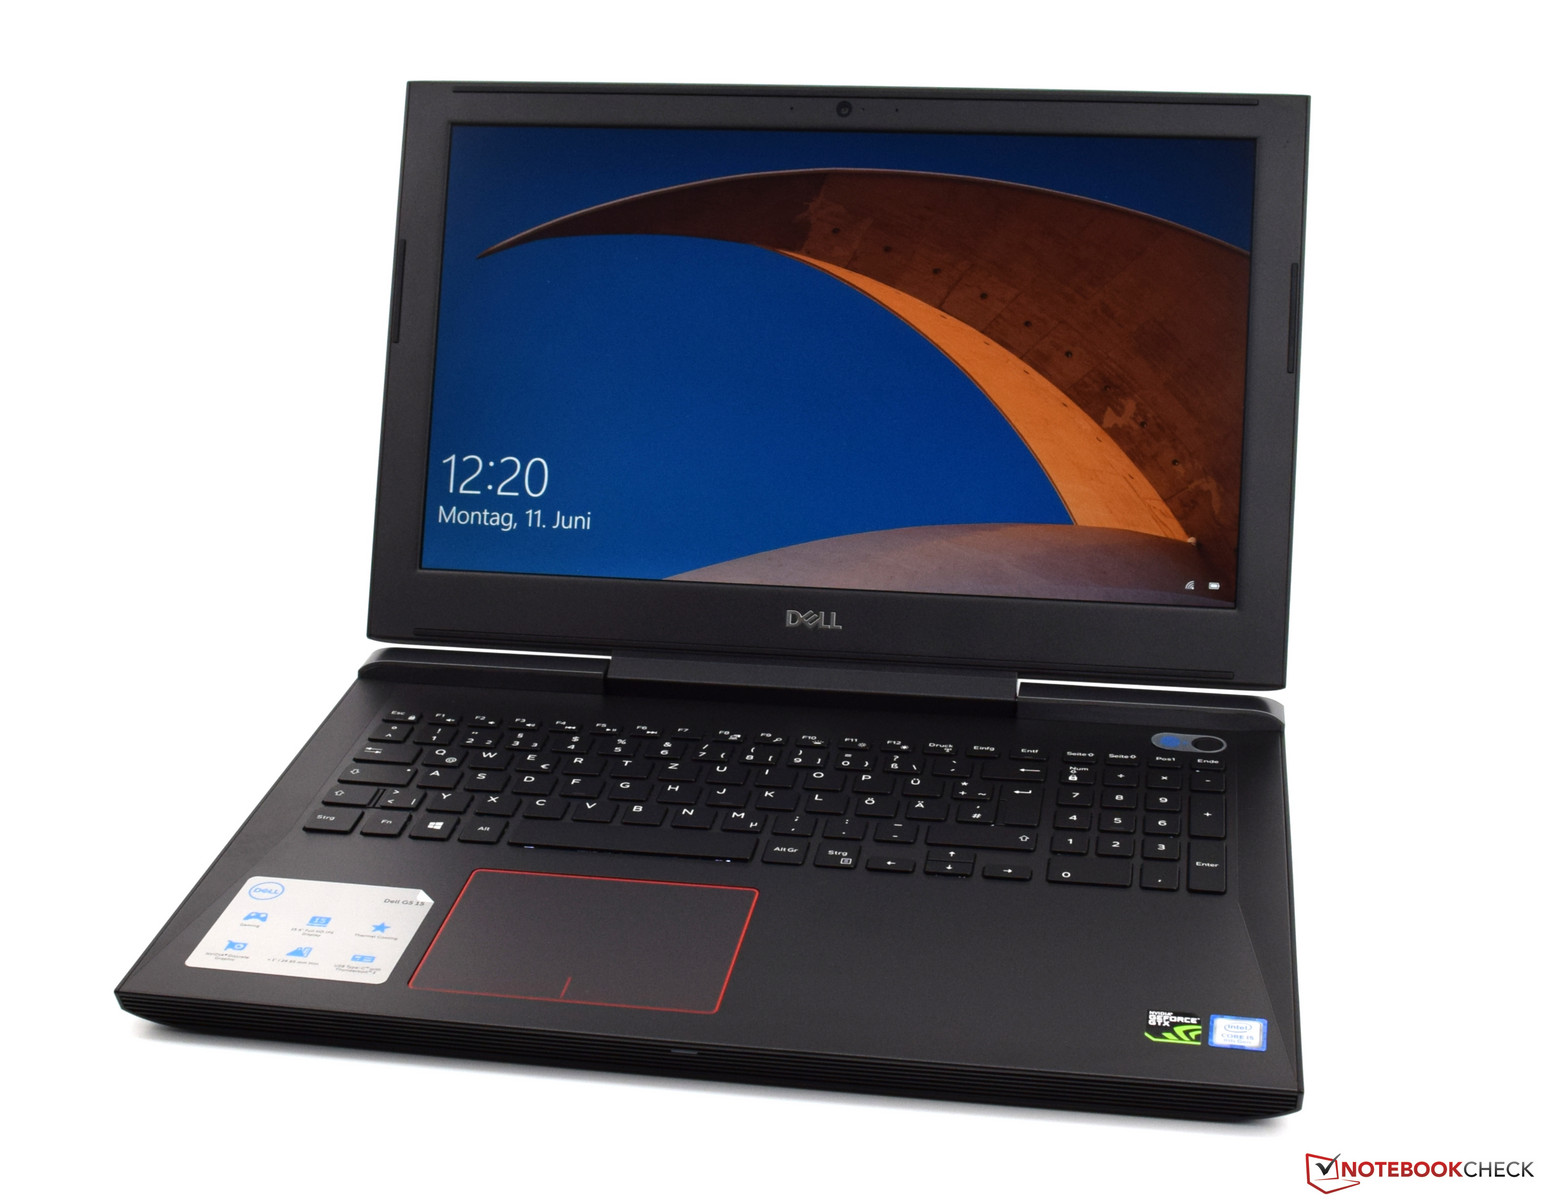
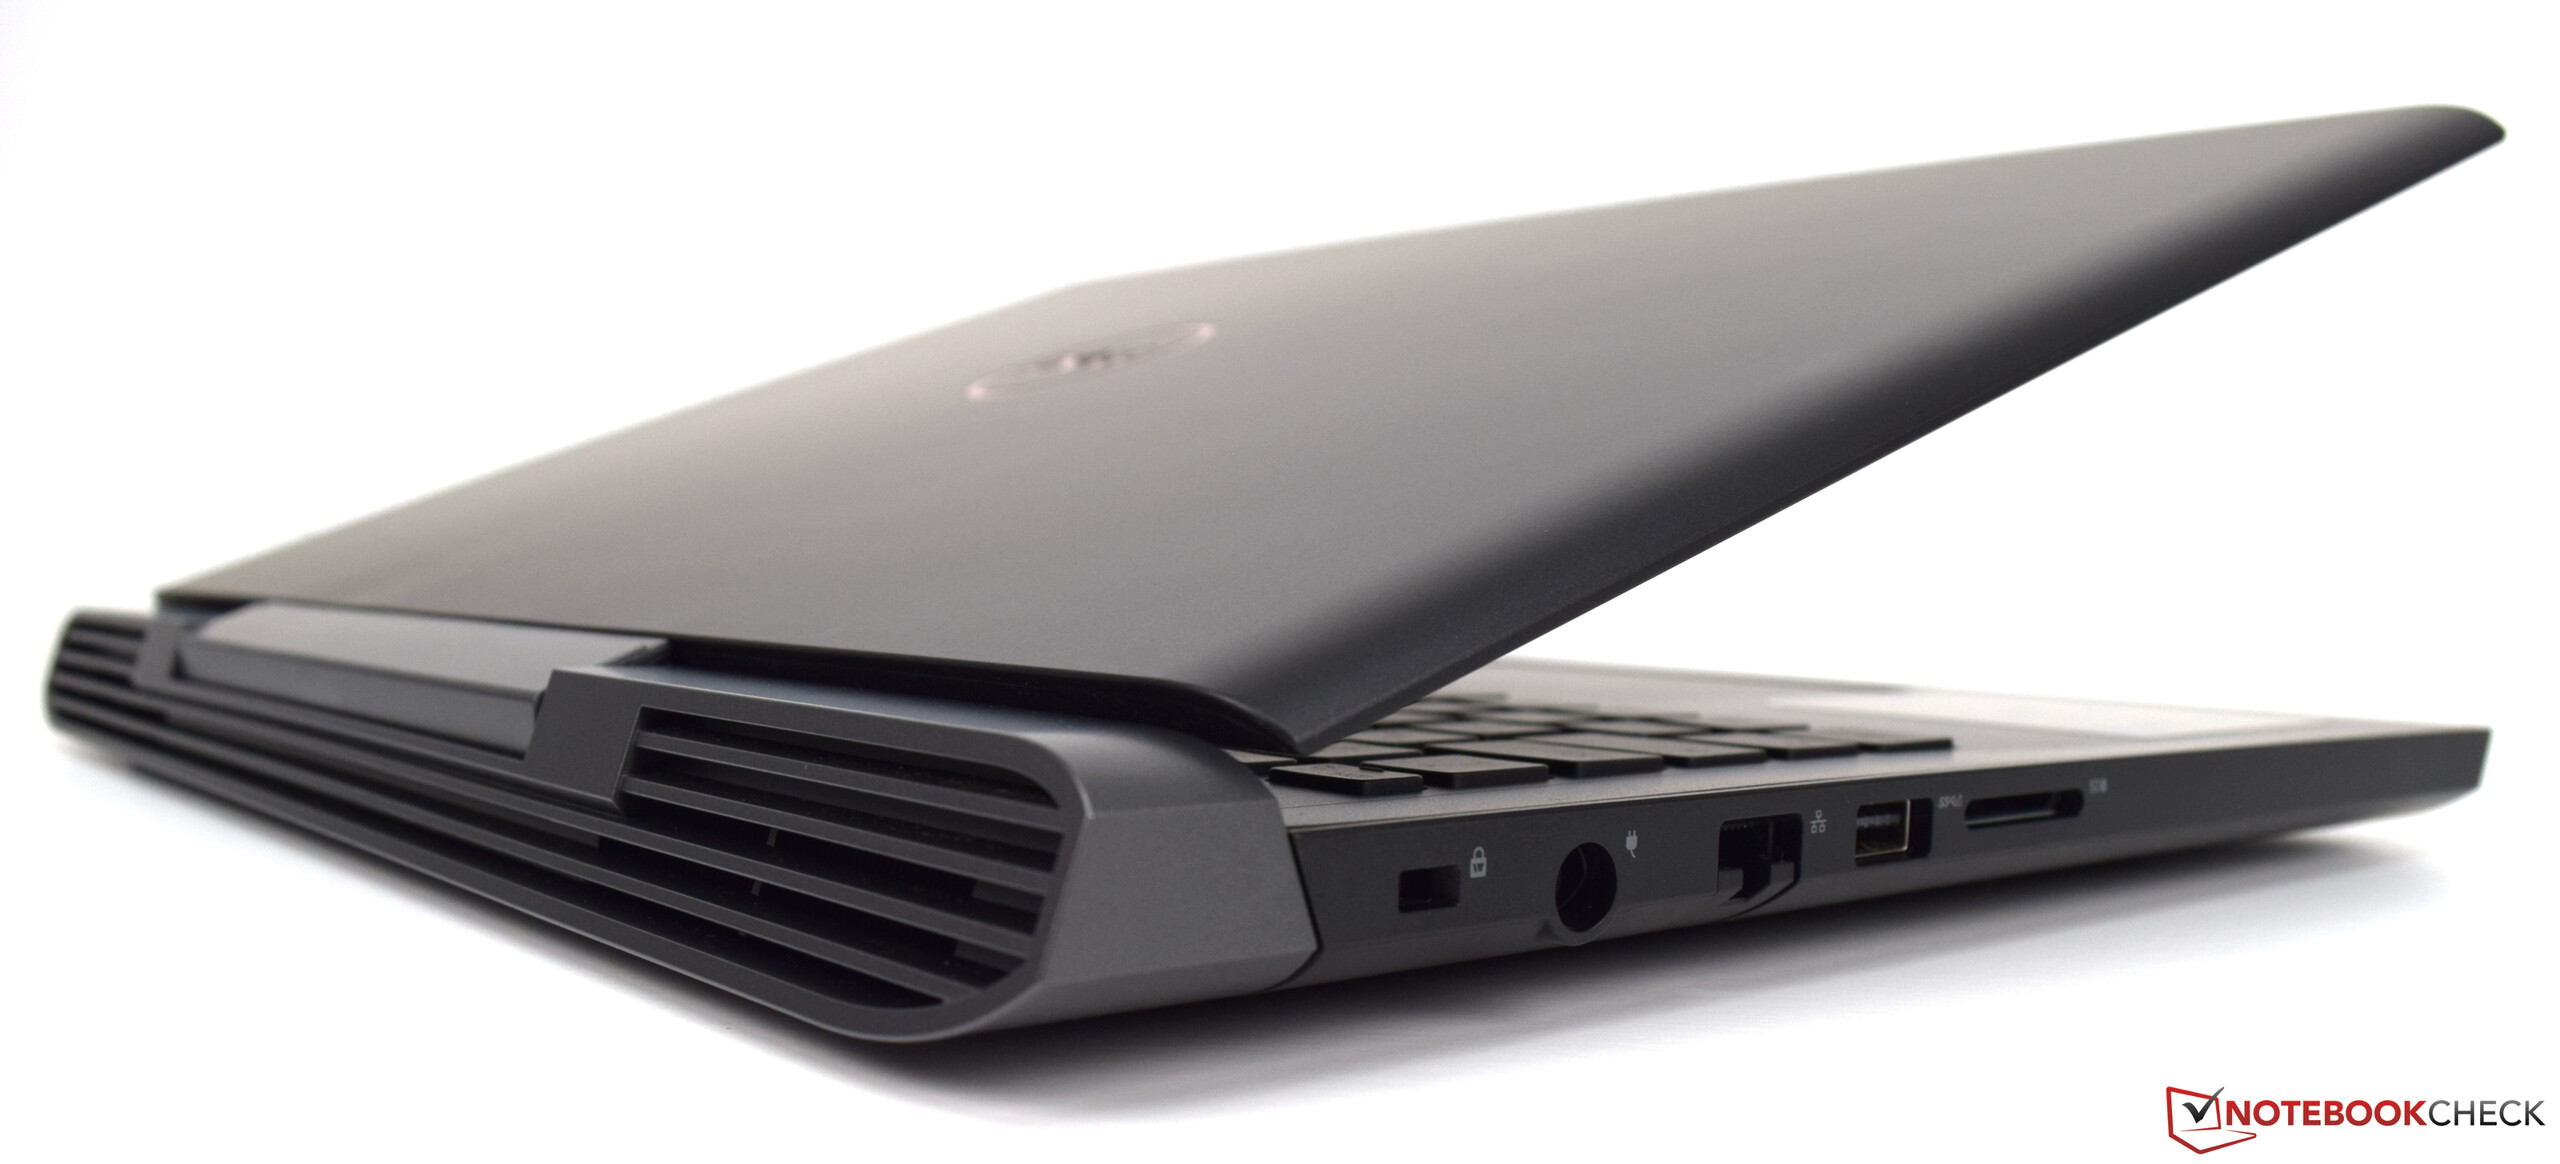
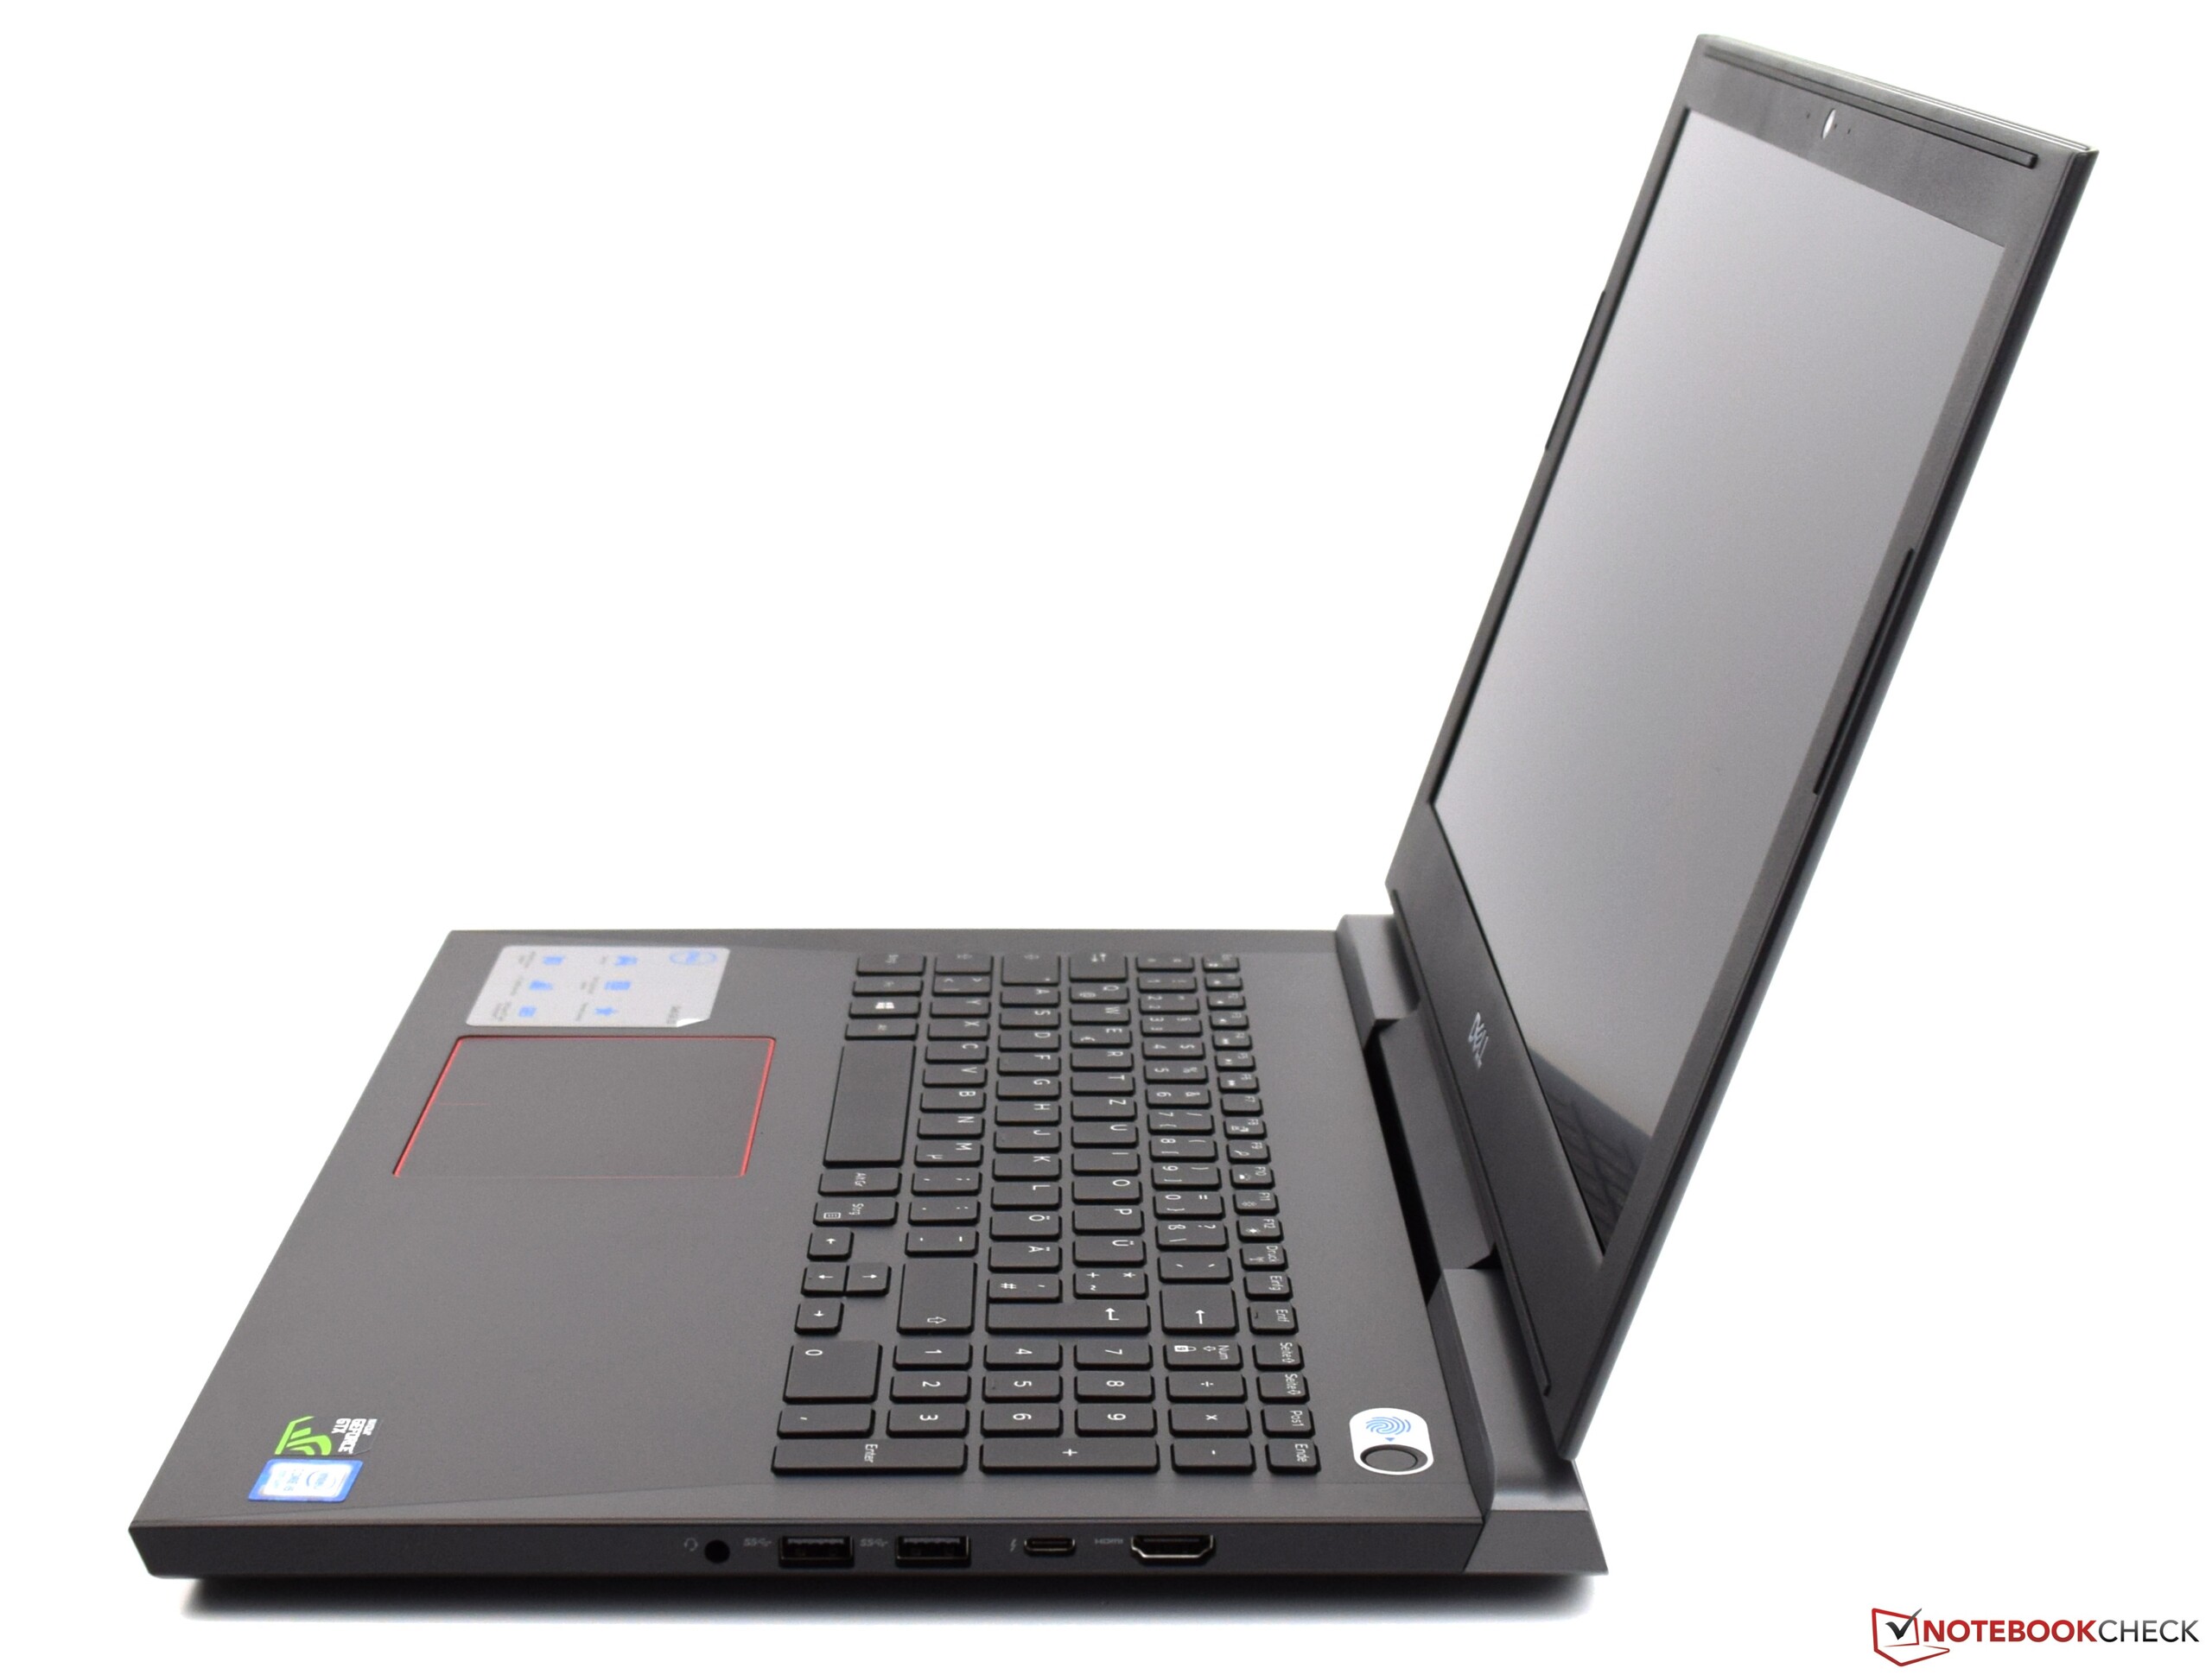
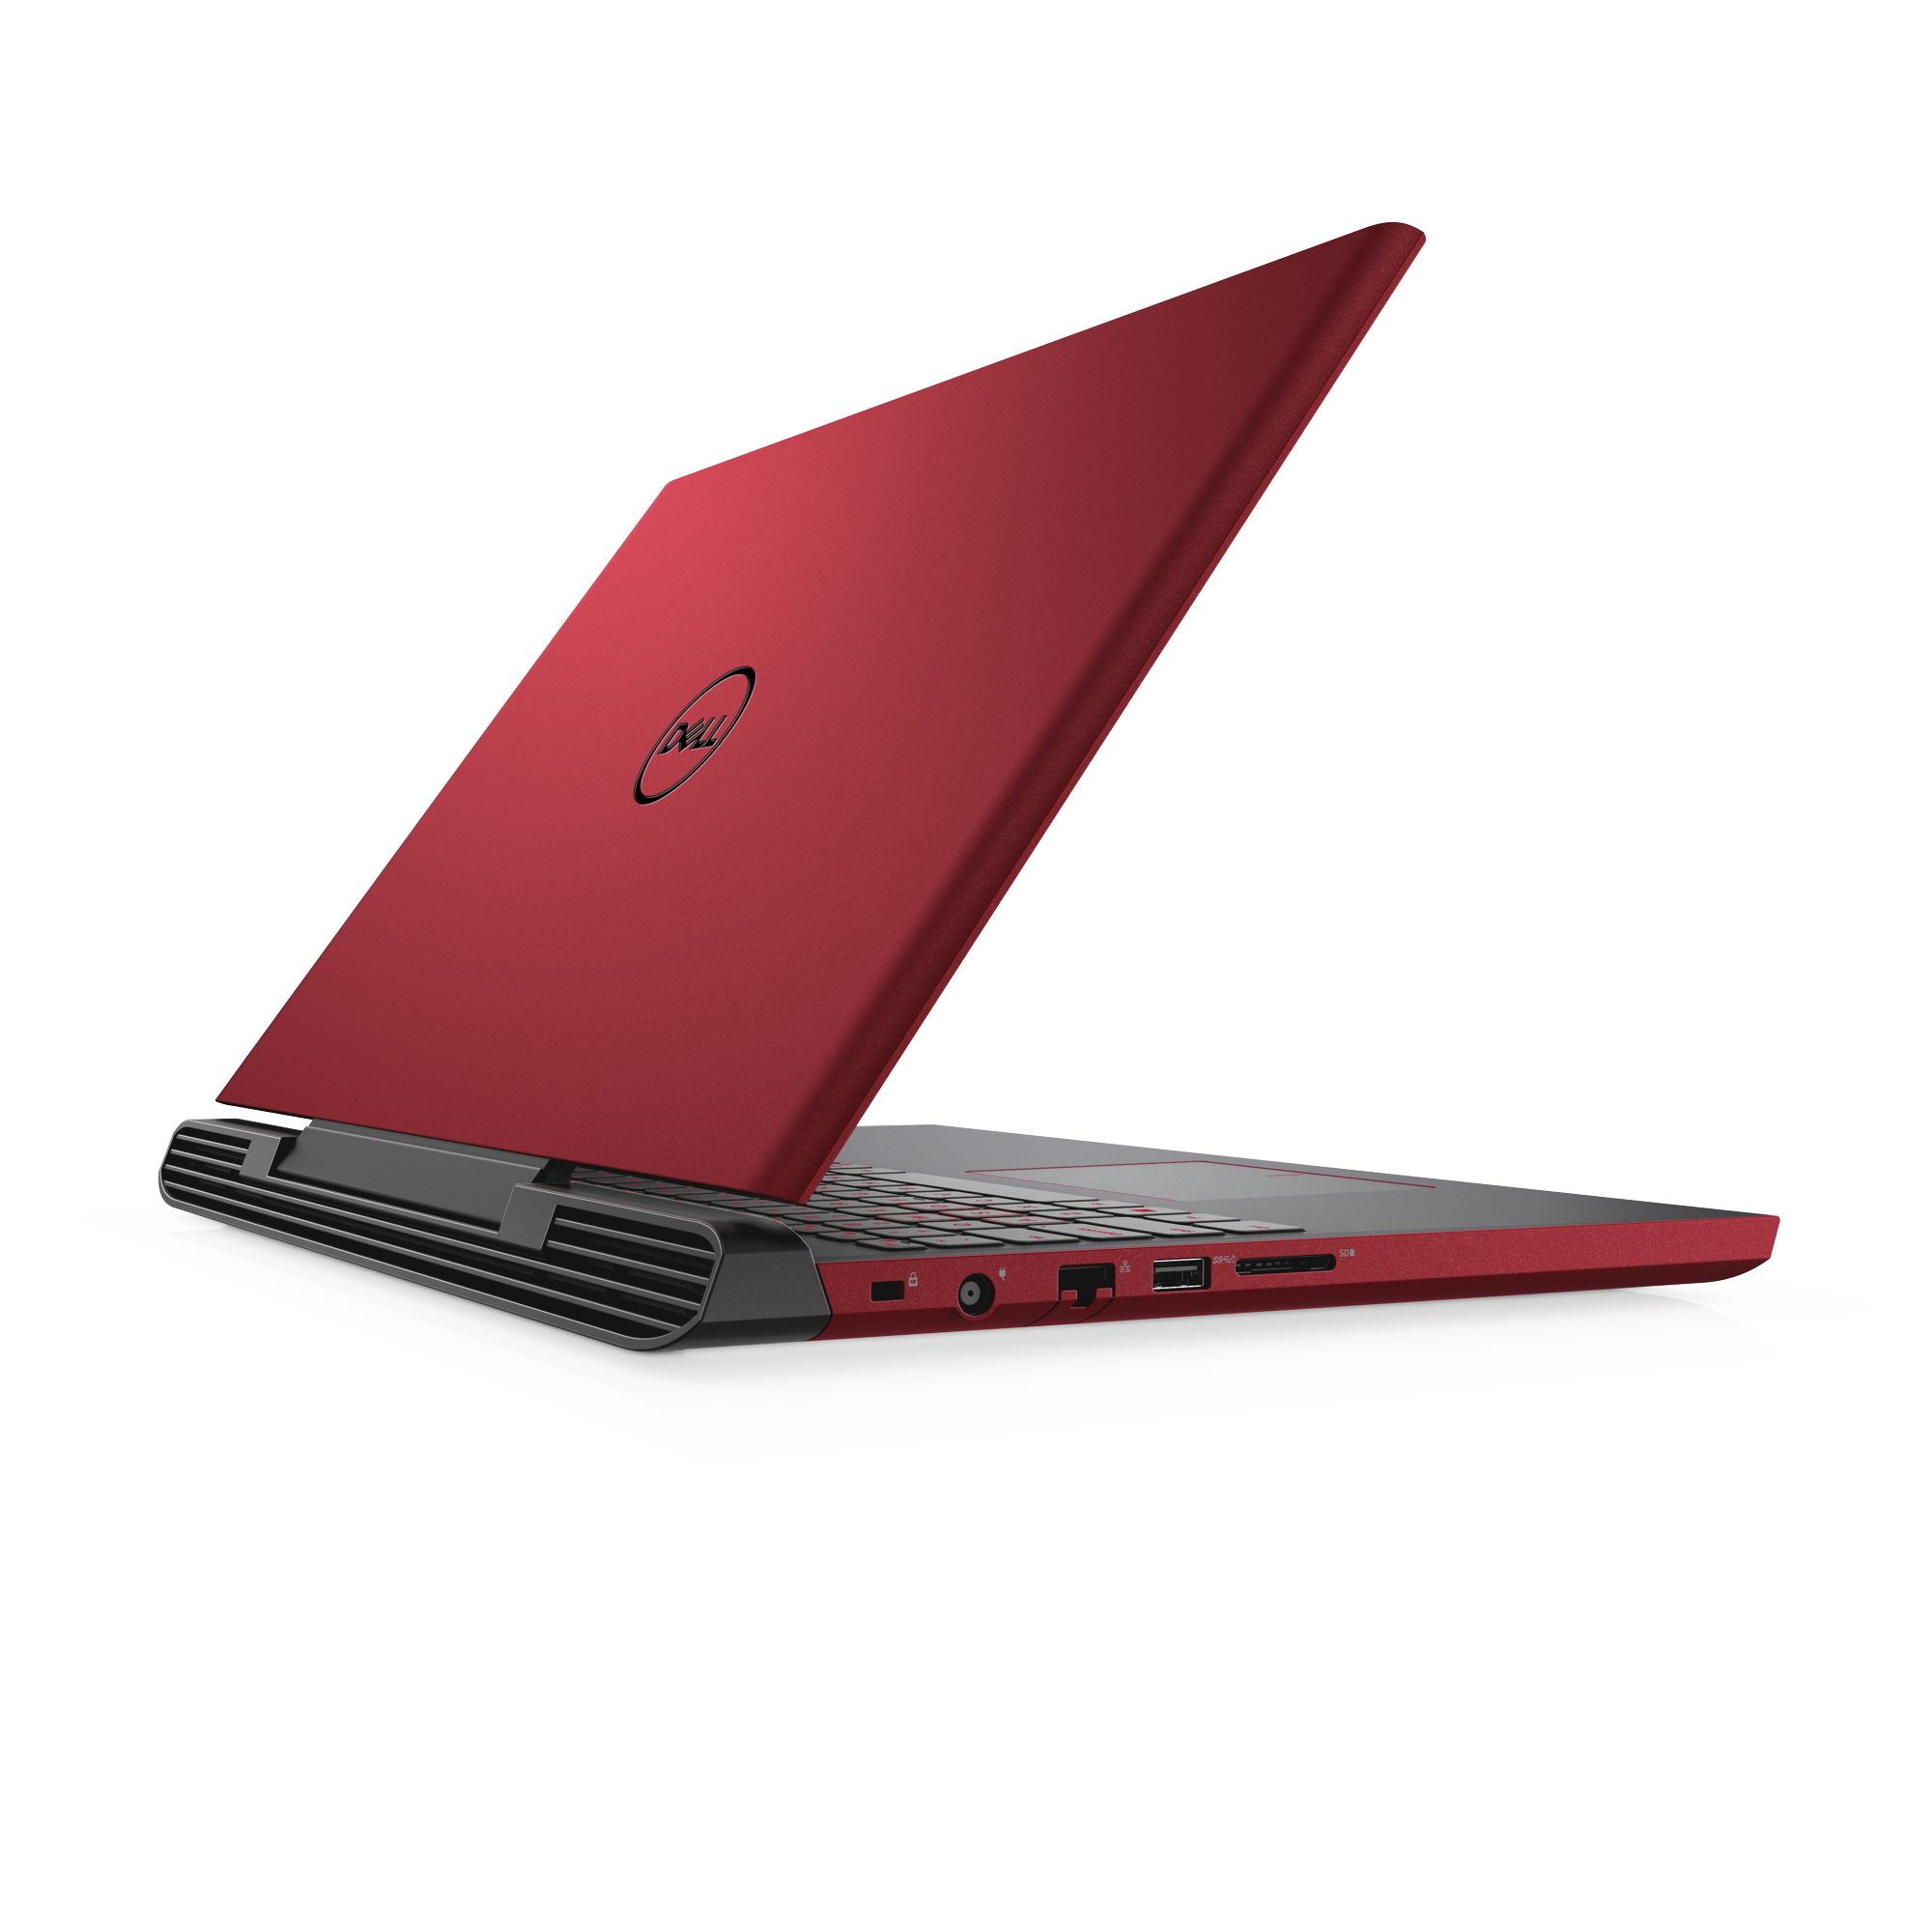
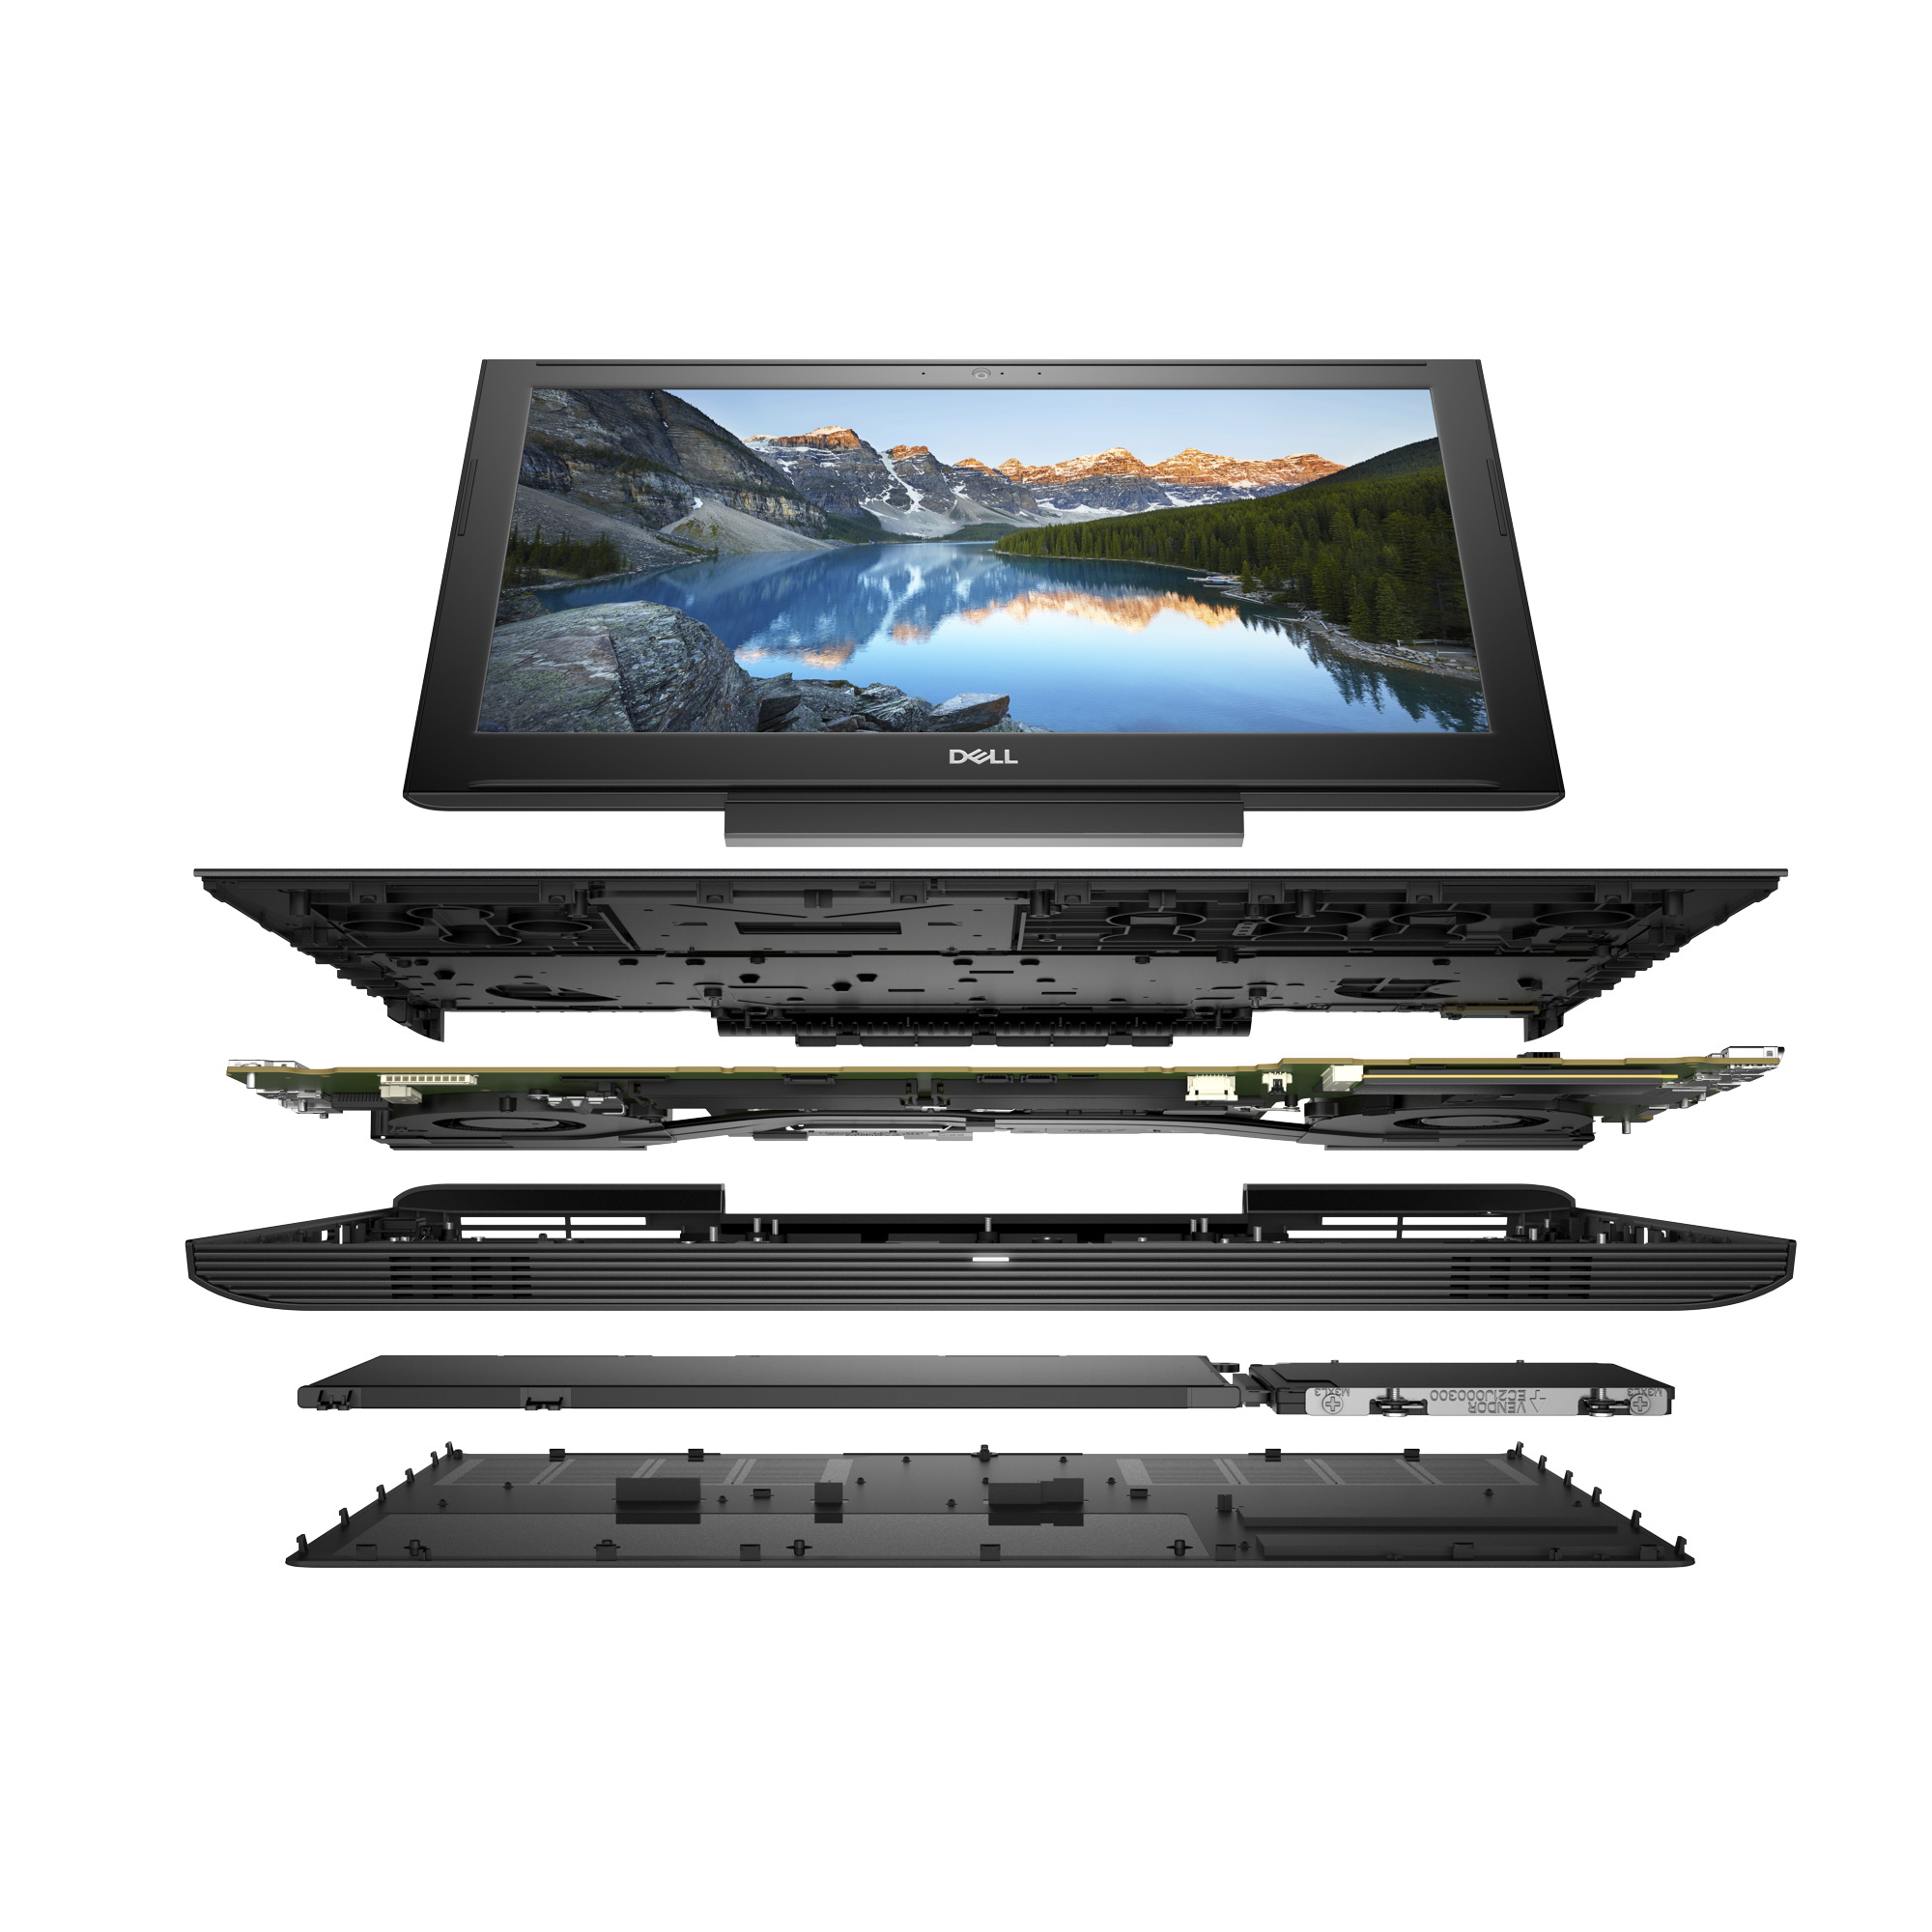
O Dell G5 15 5587 continua a ser um bom portátil para jogos que atrai os compradores com seu preço atraente, em particular. Ficamos convencidos pela carcaça muito robusta com as dobradiças no centro, proporcionando uma rigidez muito boa à tampa da tela. Graças à nova CPU, o dispositivo é agora um pouco mais rápido do que seu modelo anterior, que ainda tinha o rótulo Inspiron. Para quem o desempenho da CPU do Intel Core i5-8300H não é suficiente, pode optar pelo Intel Core i7-8750H, que com seus seis núcleos aumenta ainda mais o bom desempenho multithread. No entanto, a escolha razoável deve ser o i5, que se saiu bem em nosso teste.
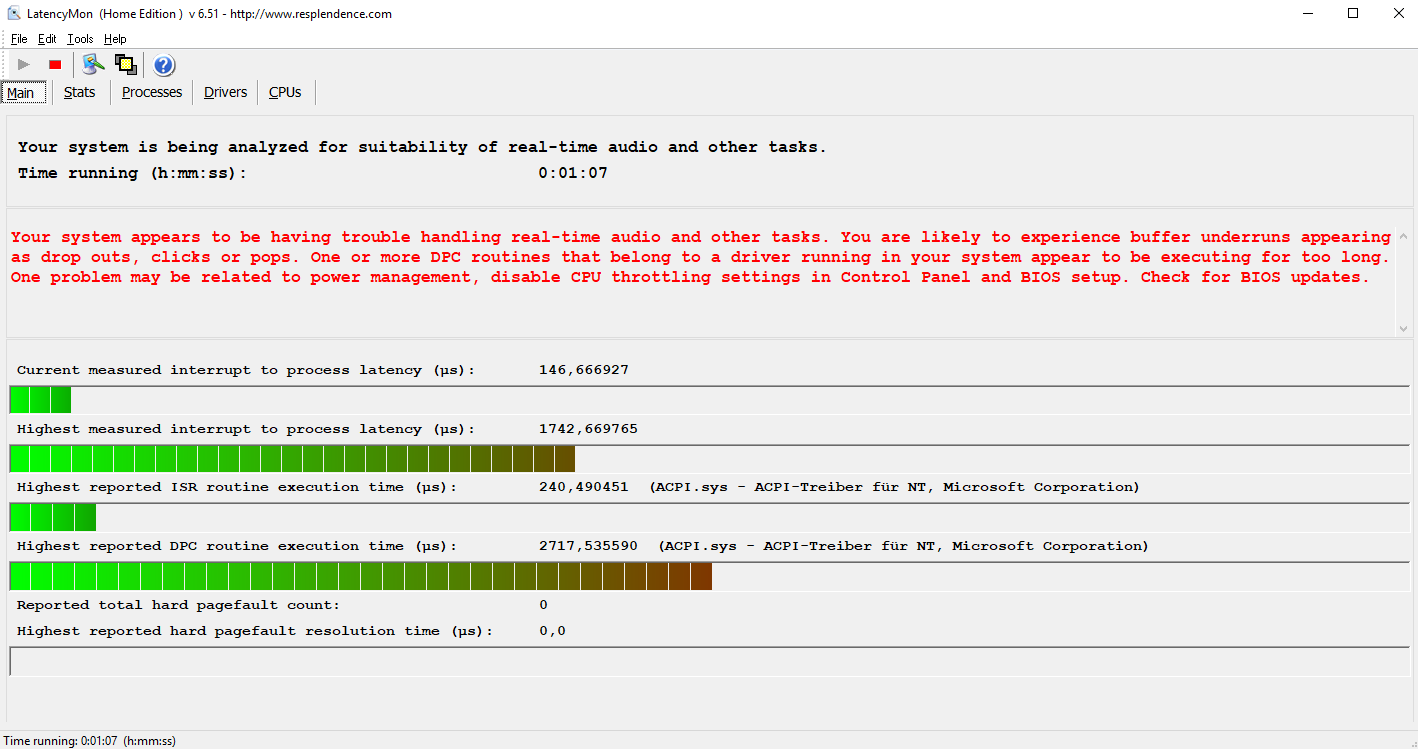
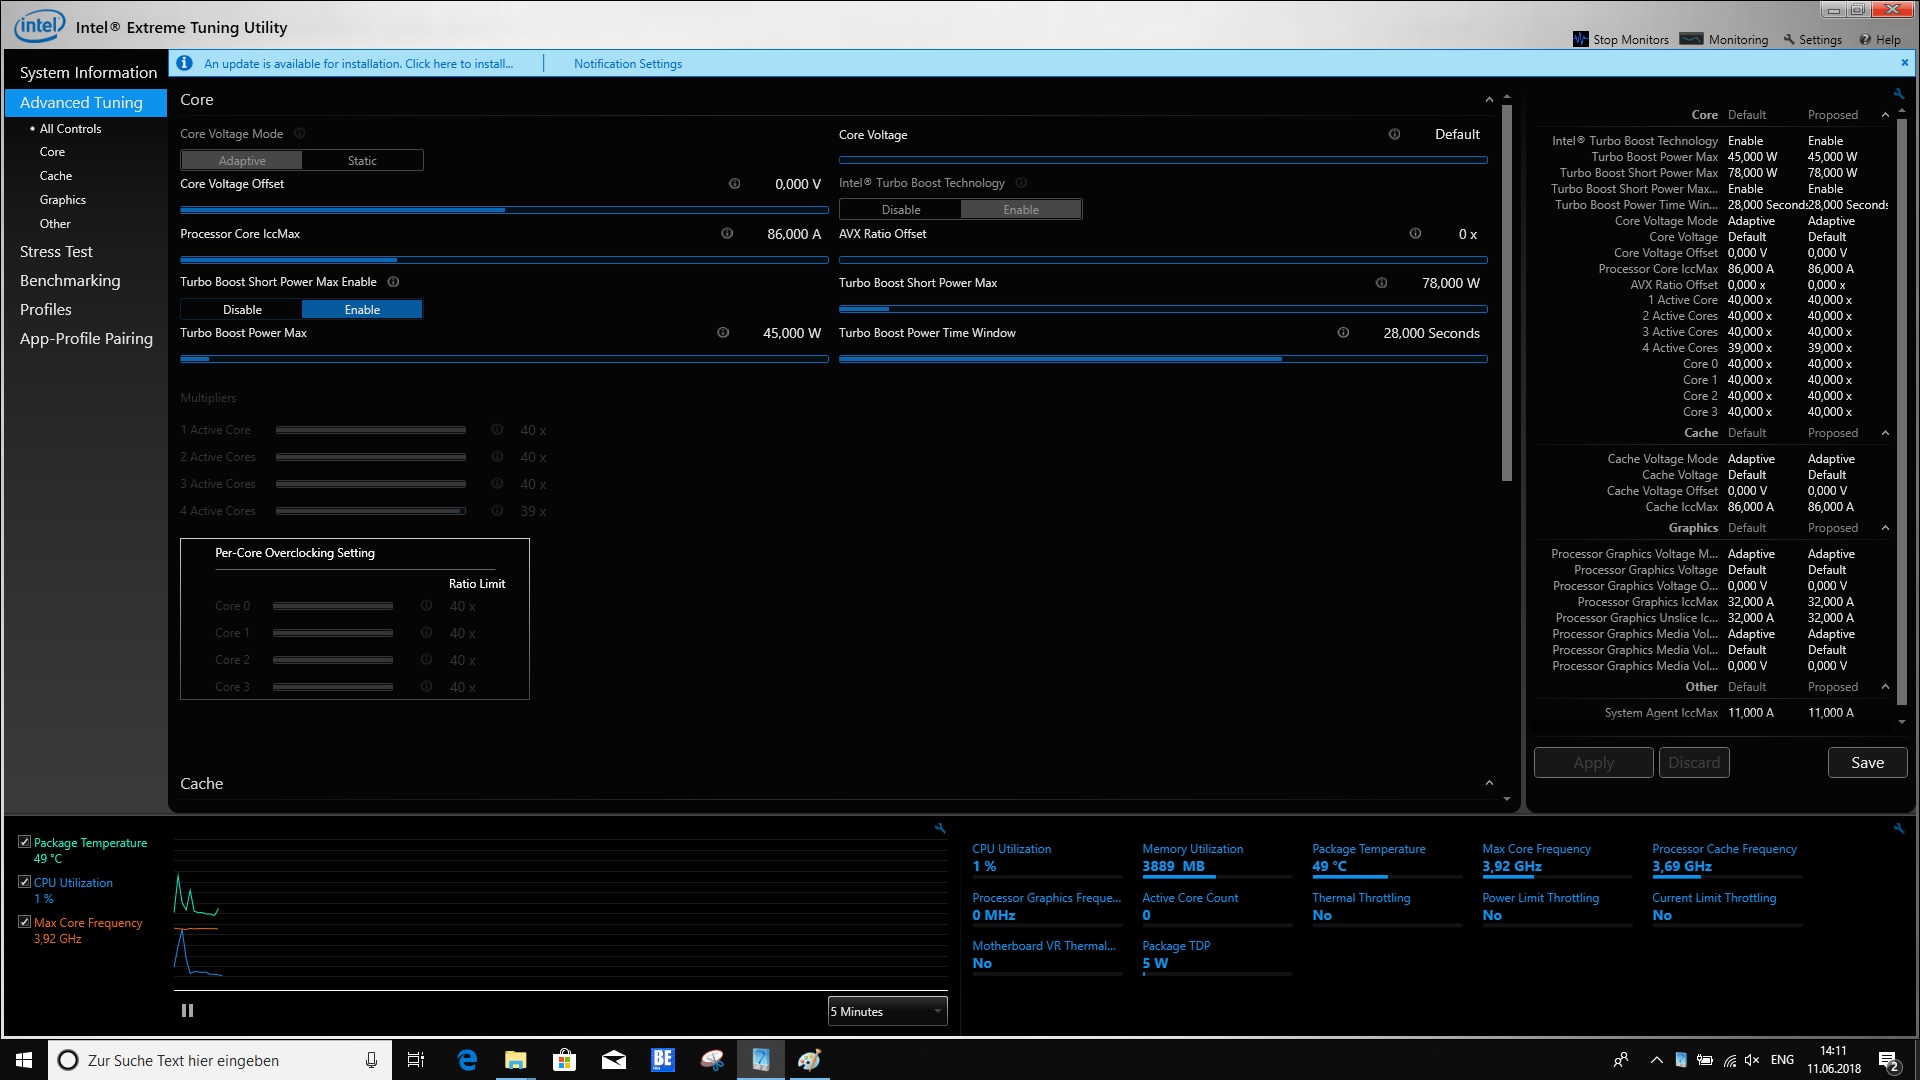
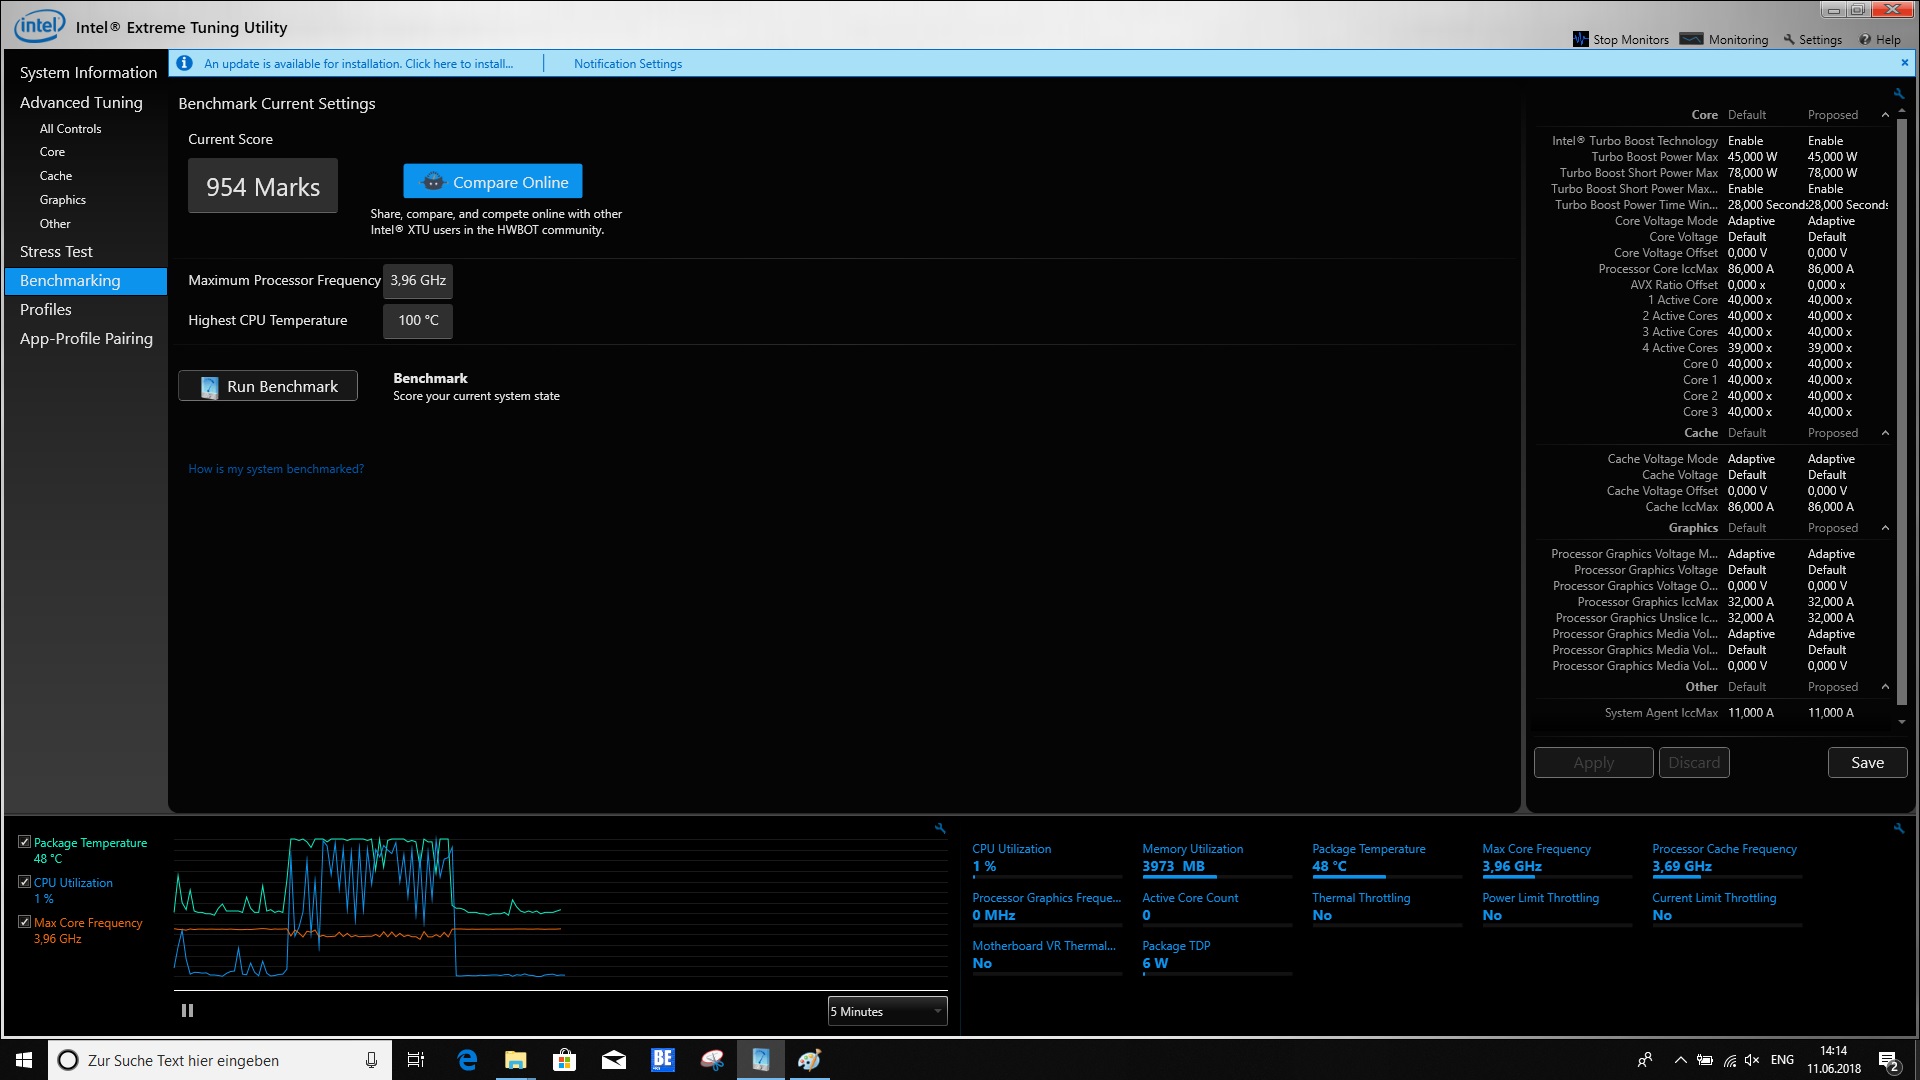
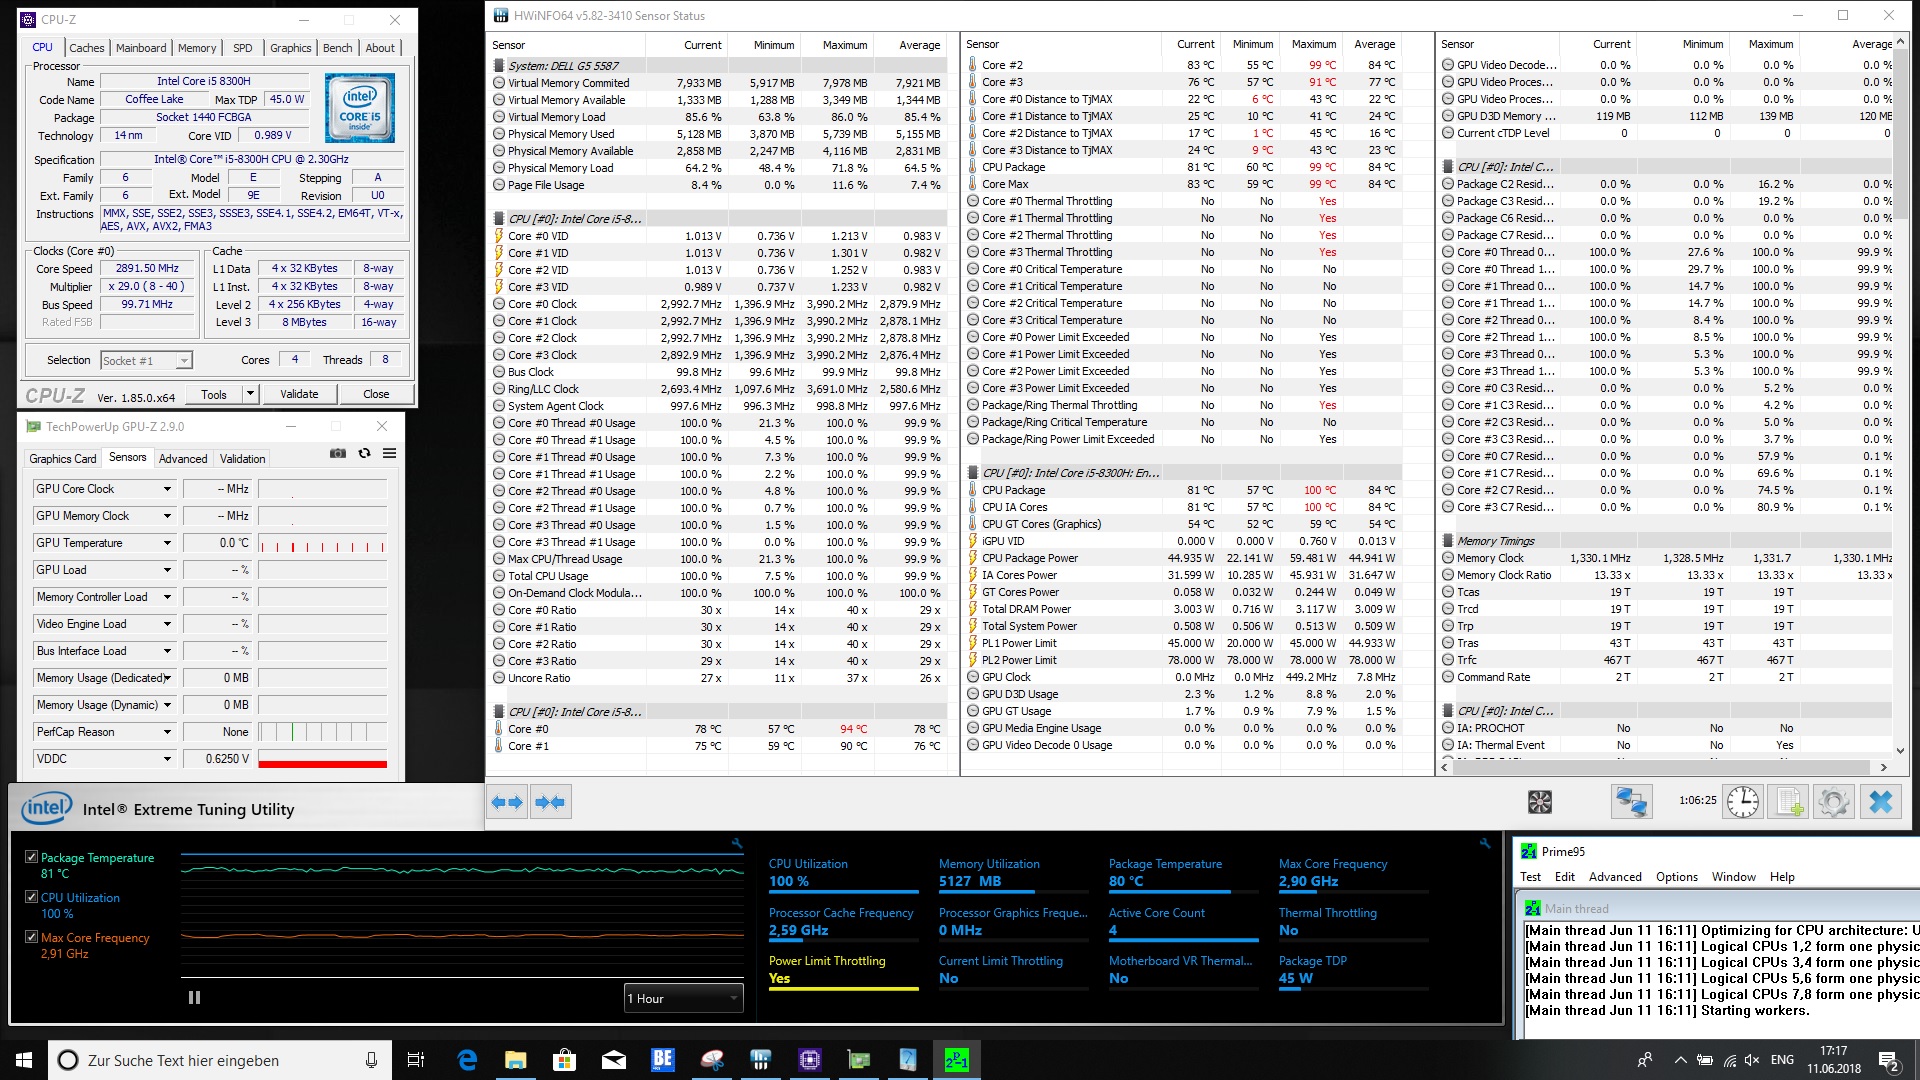
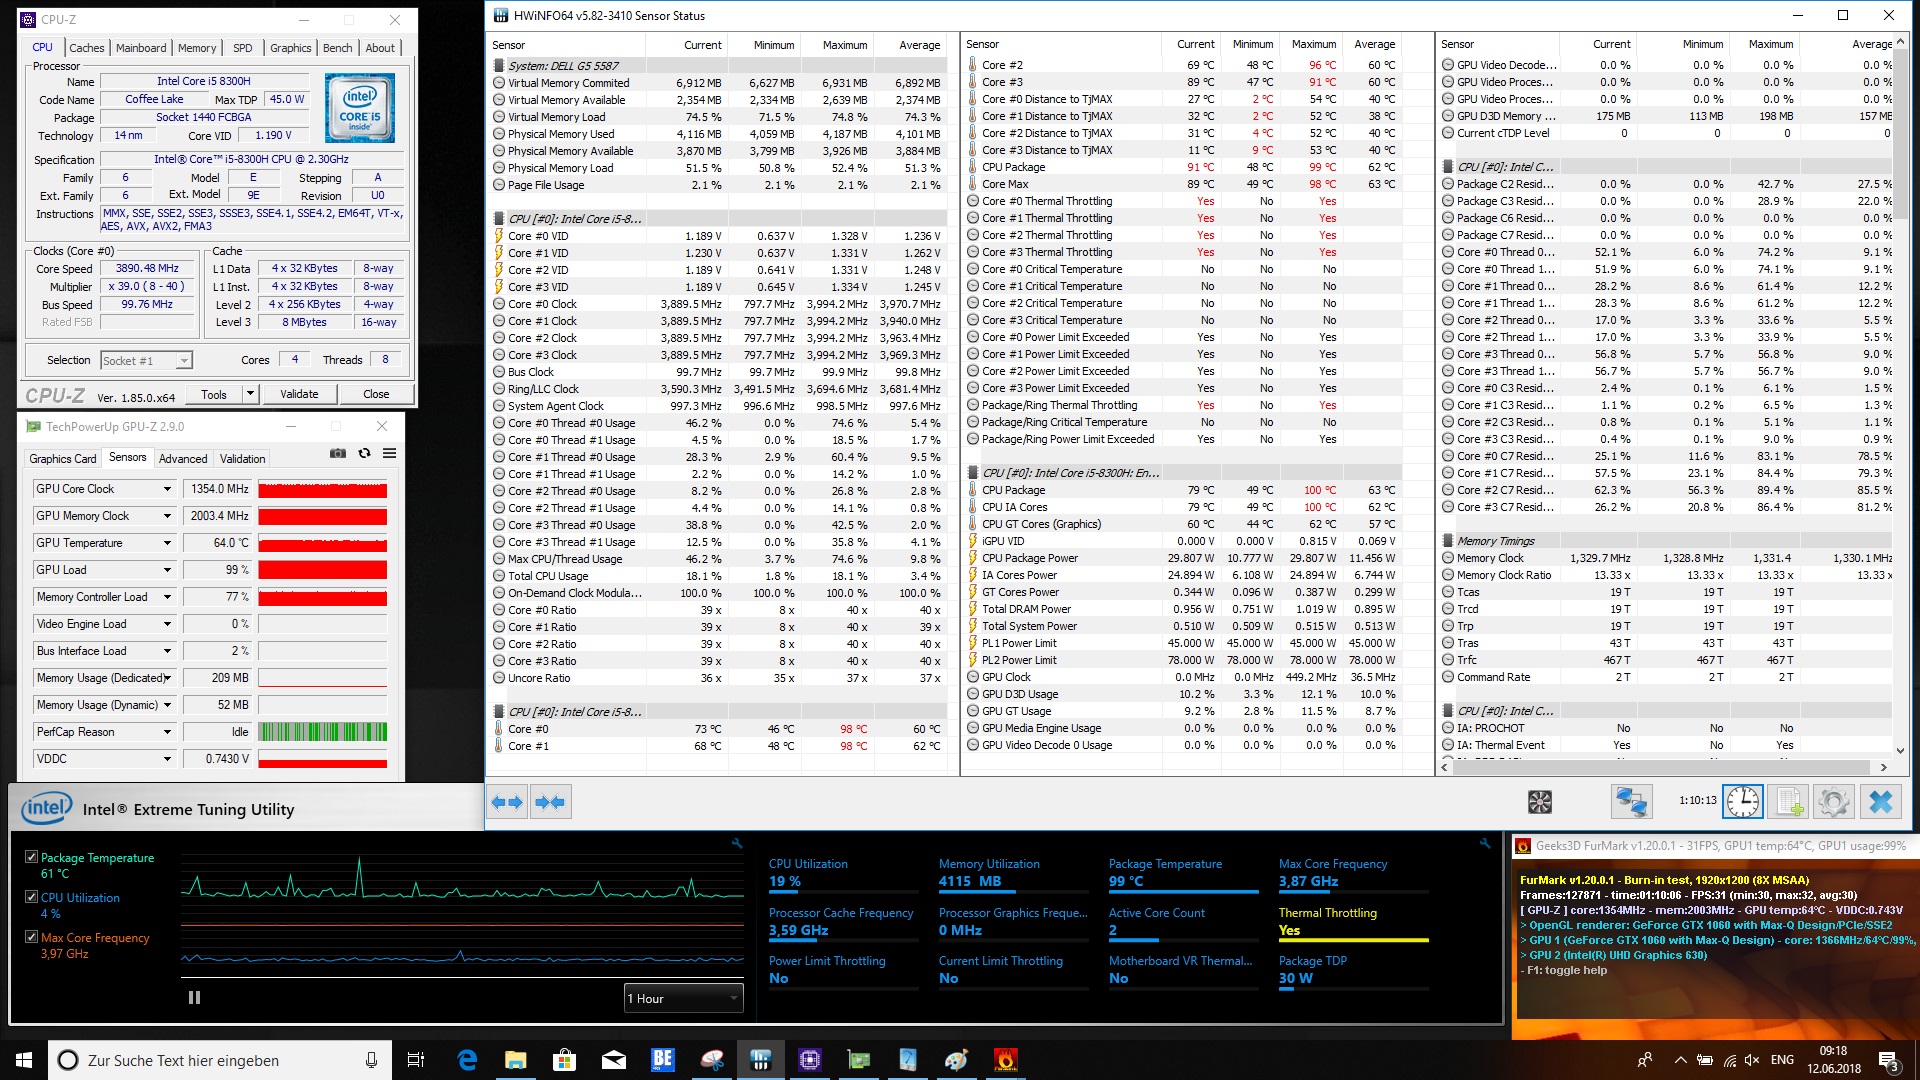
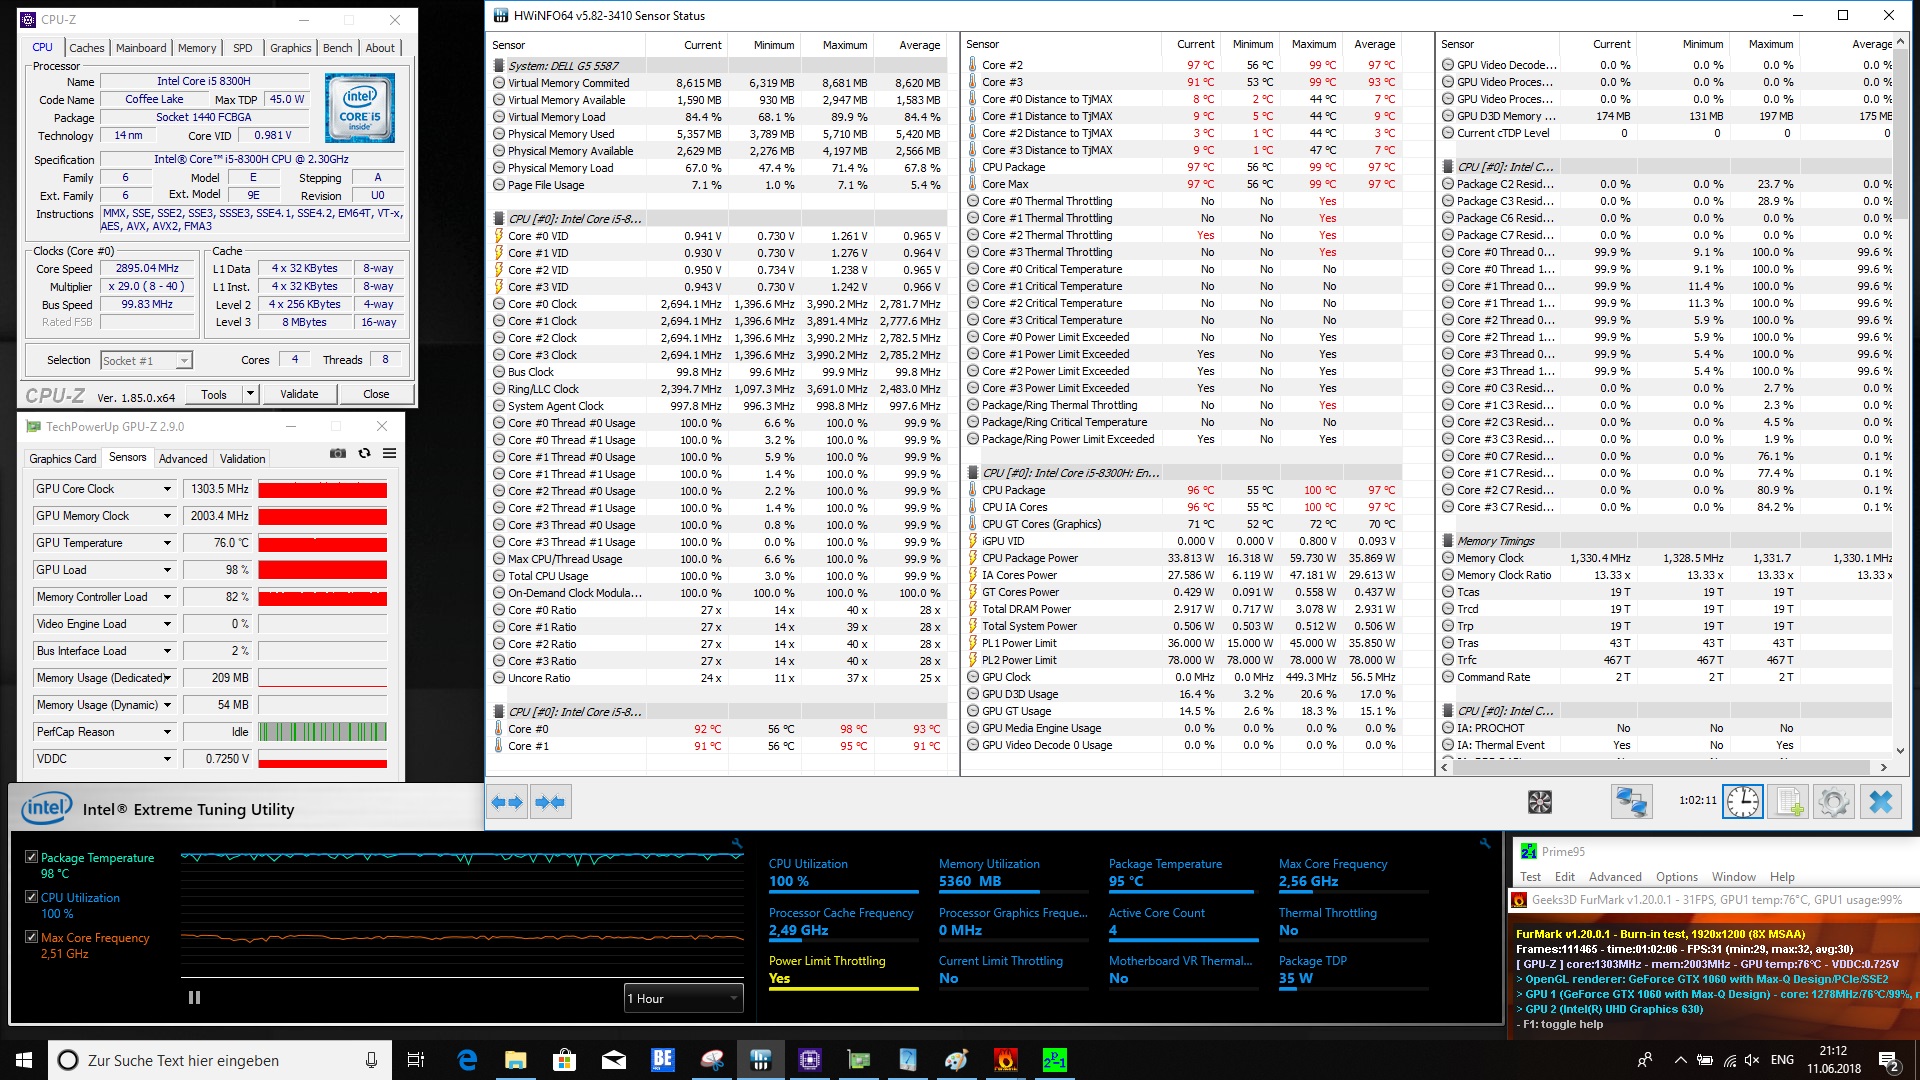
Se você observar o desenvolvimento da temperatura, nossa configuração realmente atinge seus limites em termos de dispersão de temperatura. No entanto, o afogamento da CPU permanece dentro dos limites e não afeta demais as avaliações.
Com a Nvidia GeForce GTX 1060 Max-Q, os compradores recebem o G5 15 5000 com a GPU mais potente que a Dell coloca neste portátil para jogos. O desempenho é bom e suficiente para poder jogar todos os jogos atuais em sua resolução nativa.
O Dell G5 15 5587 é um portátil de jogos bem equipado com um CPU moderna, uma placa gráfica rápida e um preço atrativo.
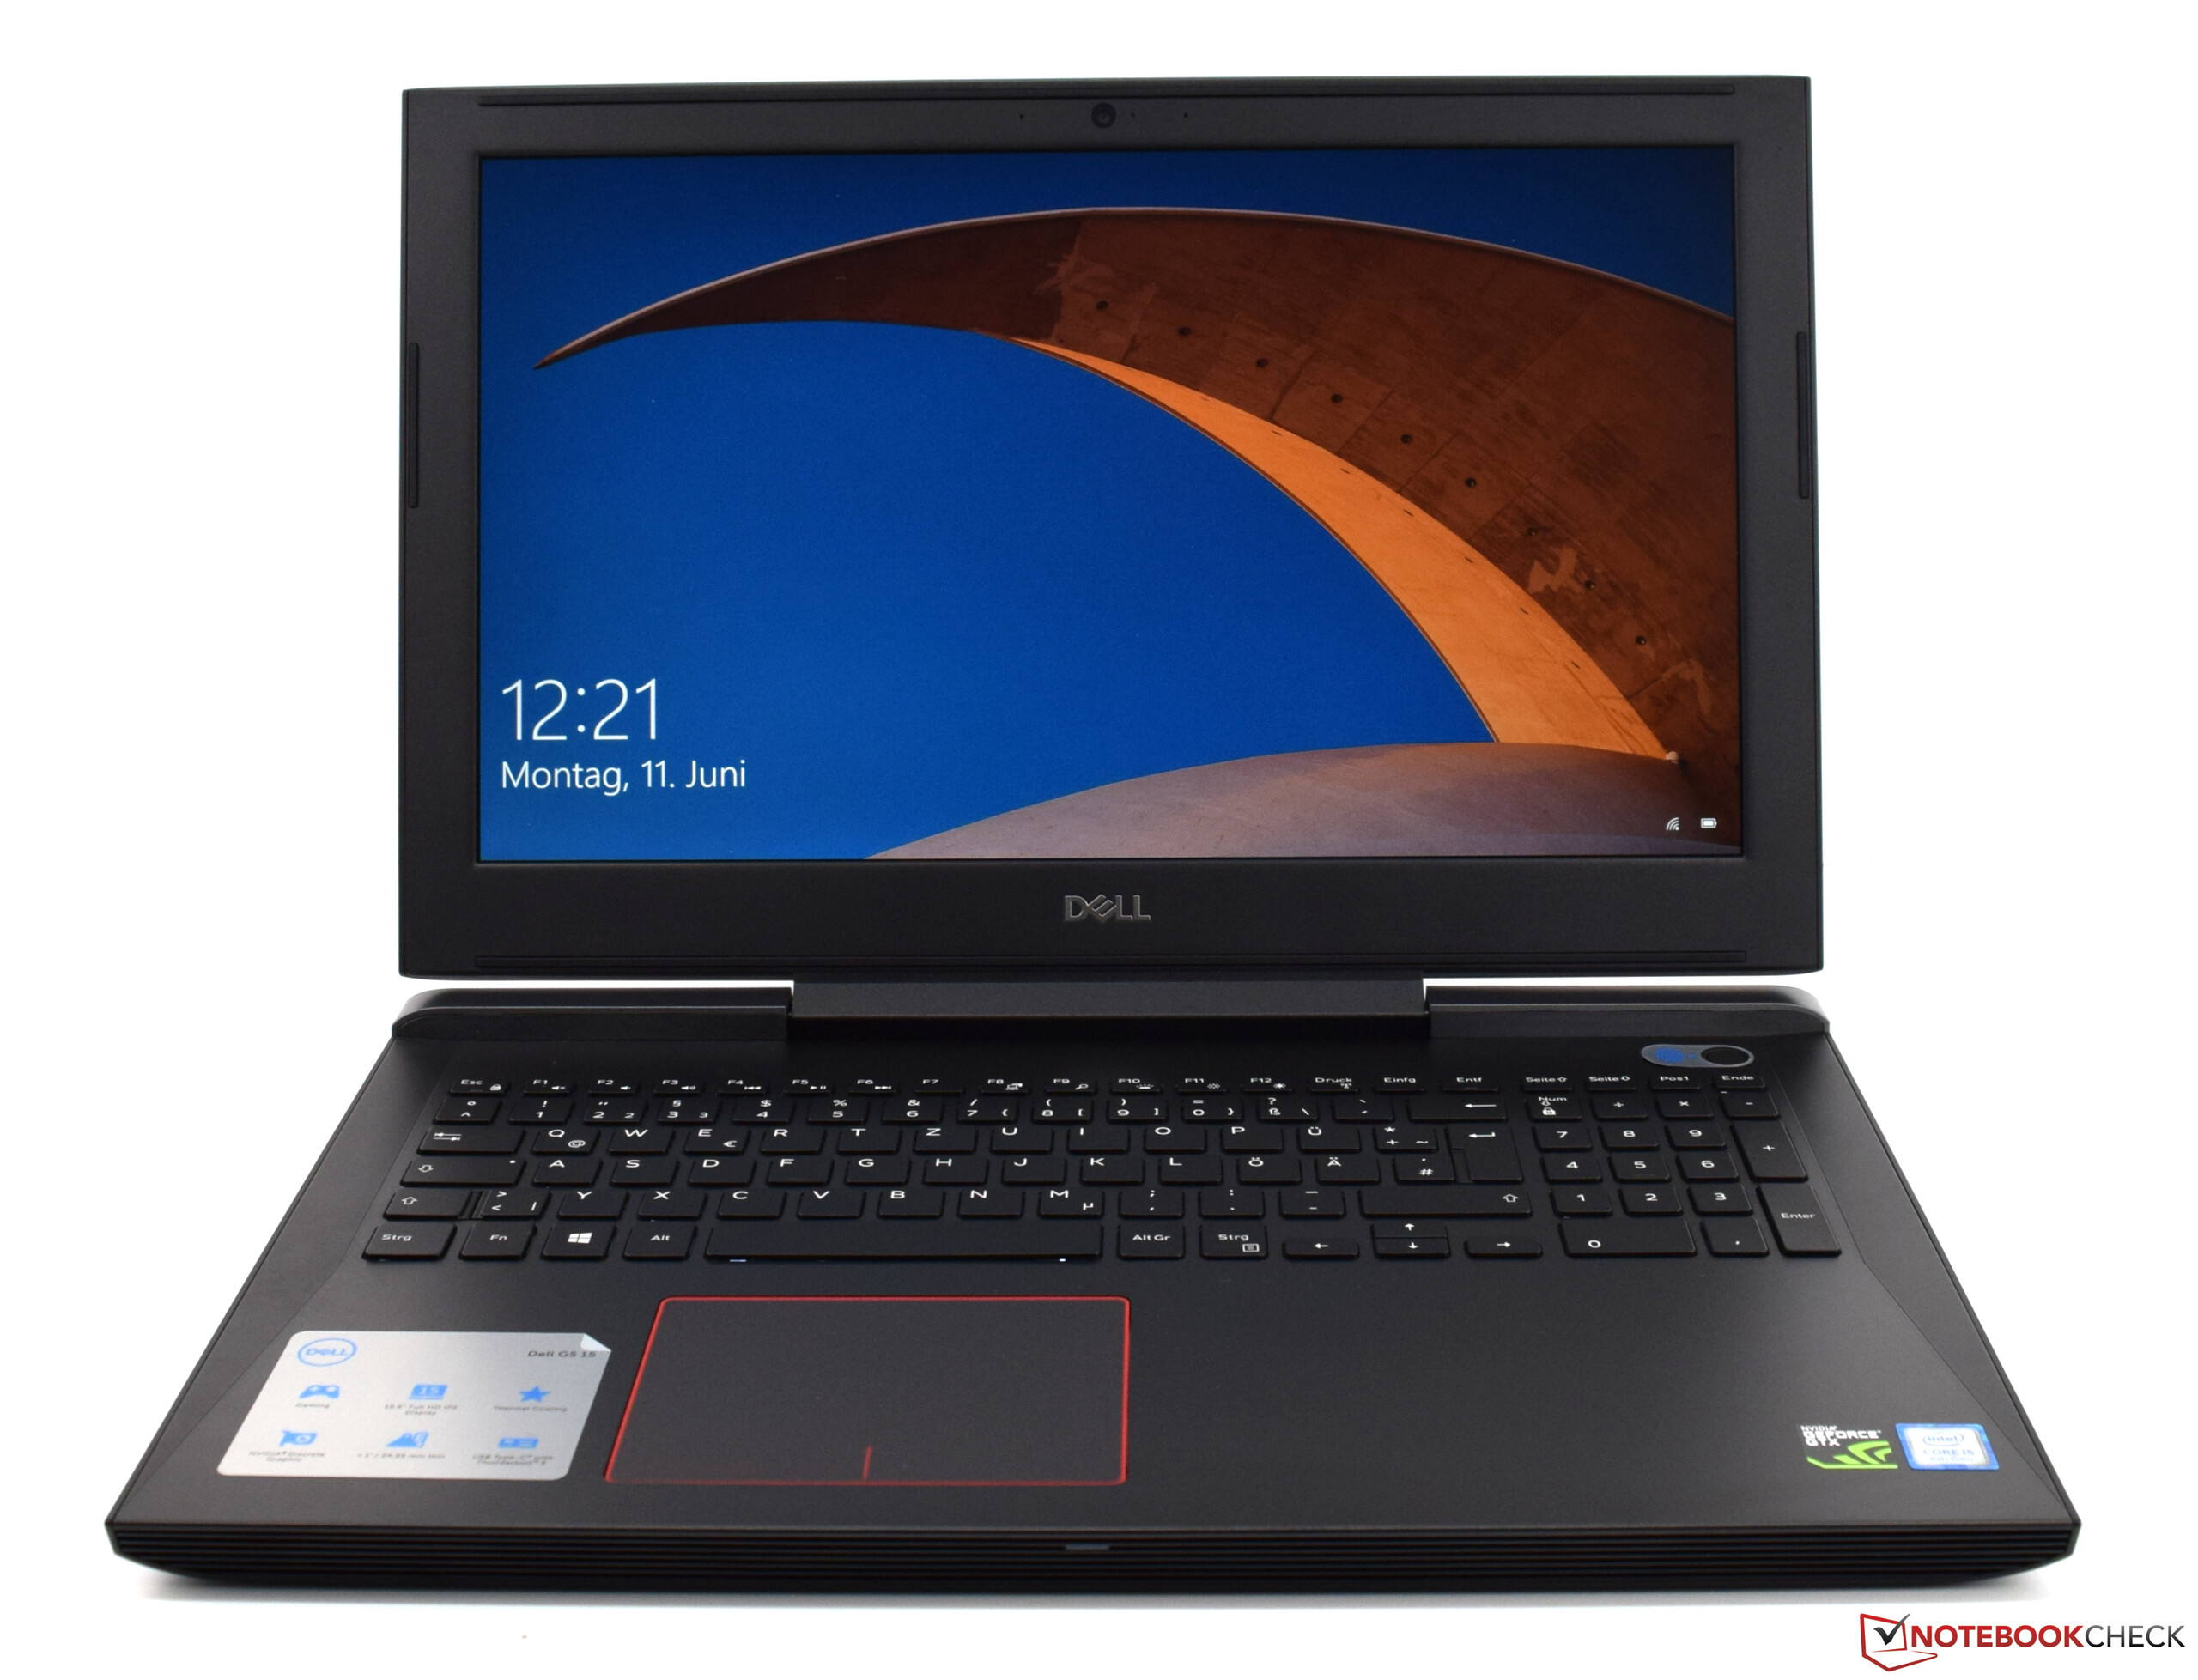
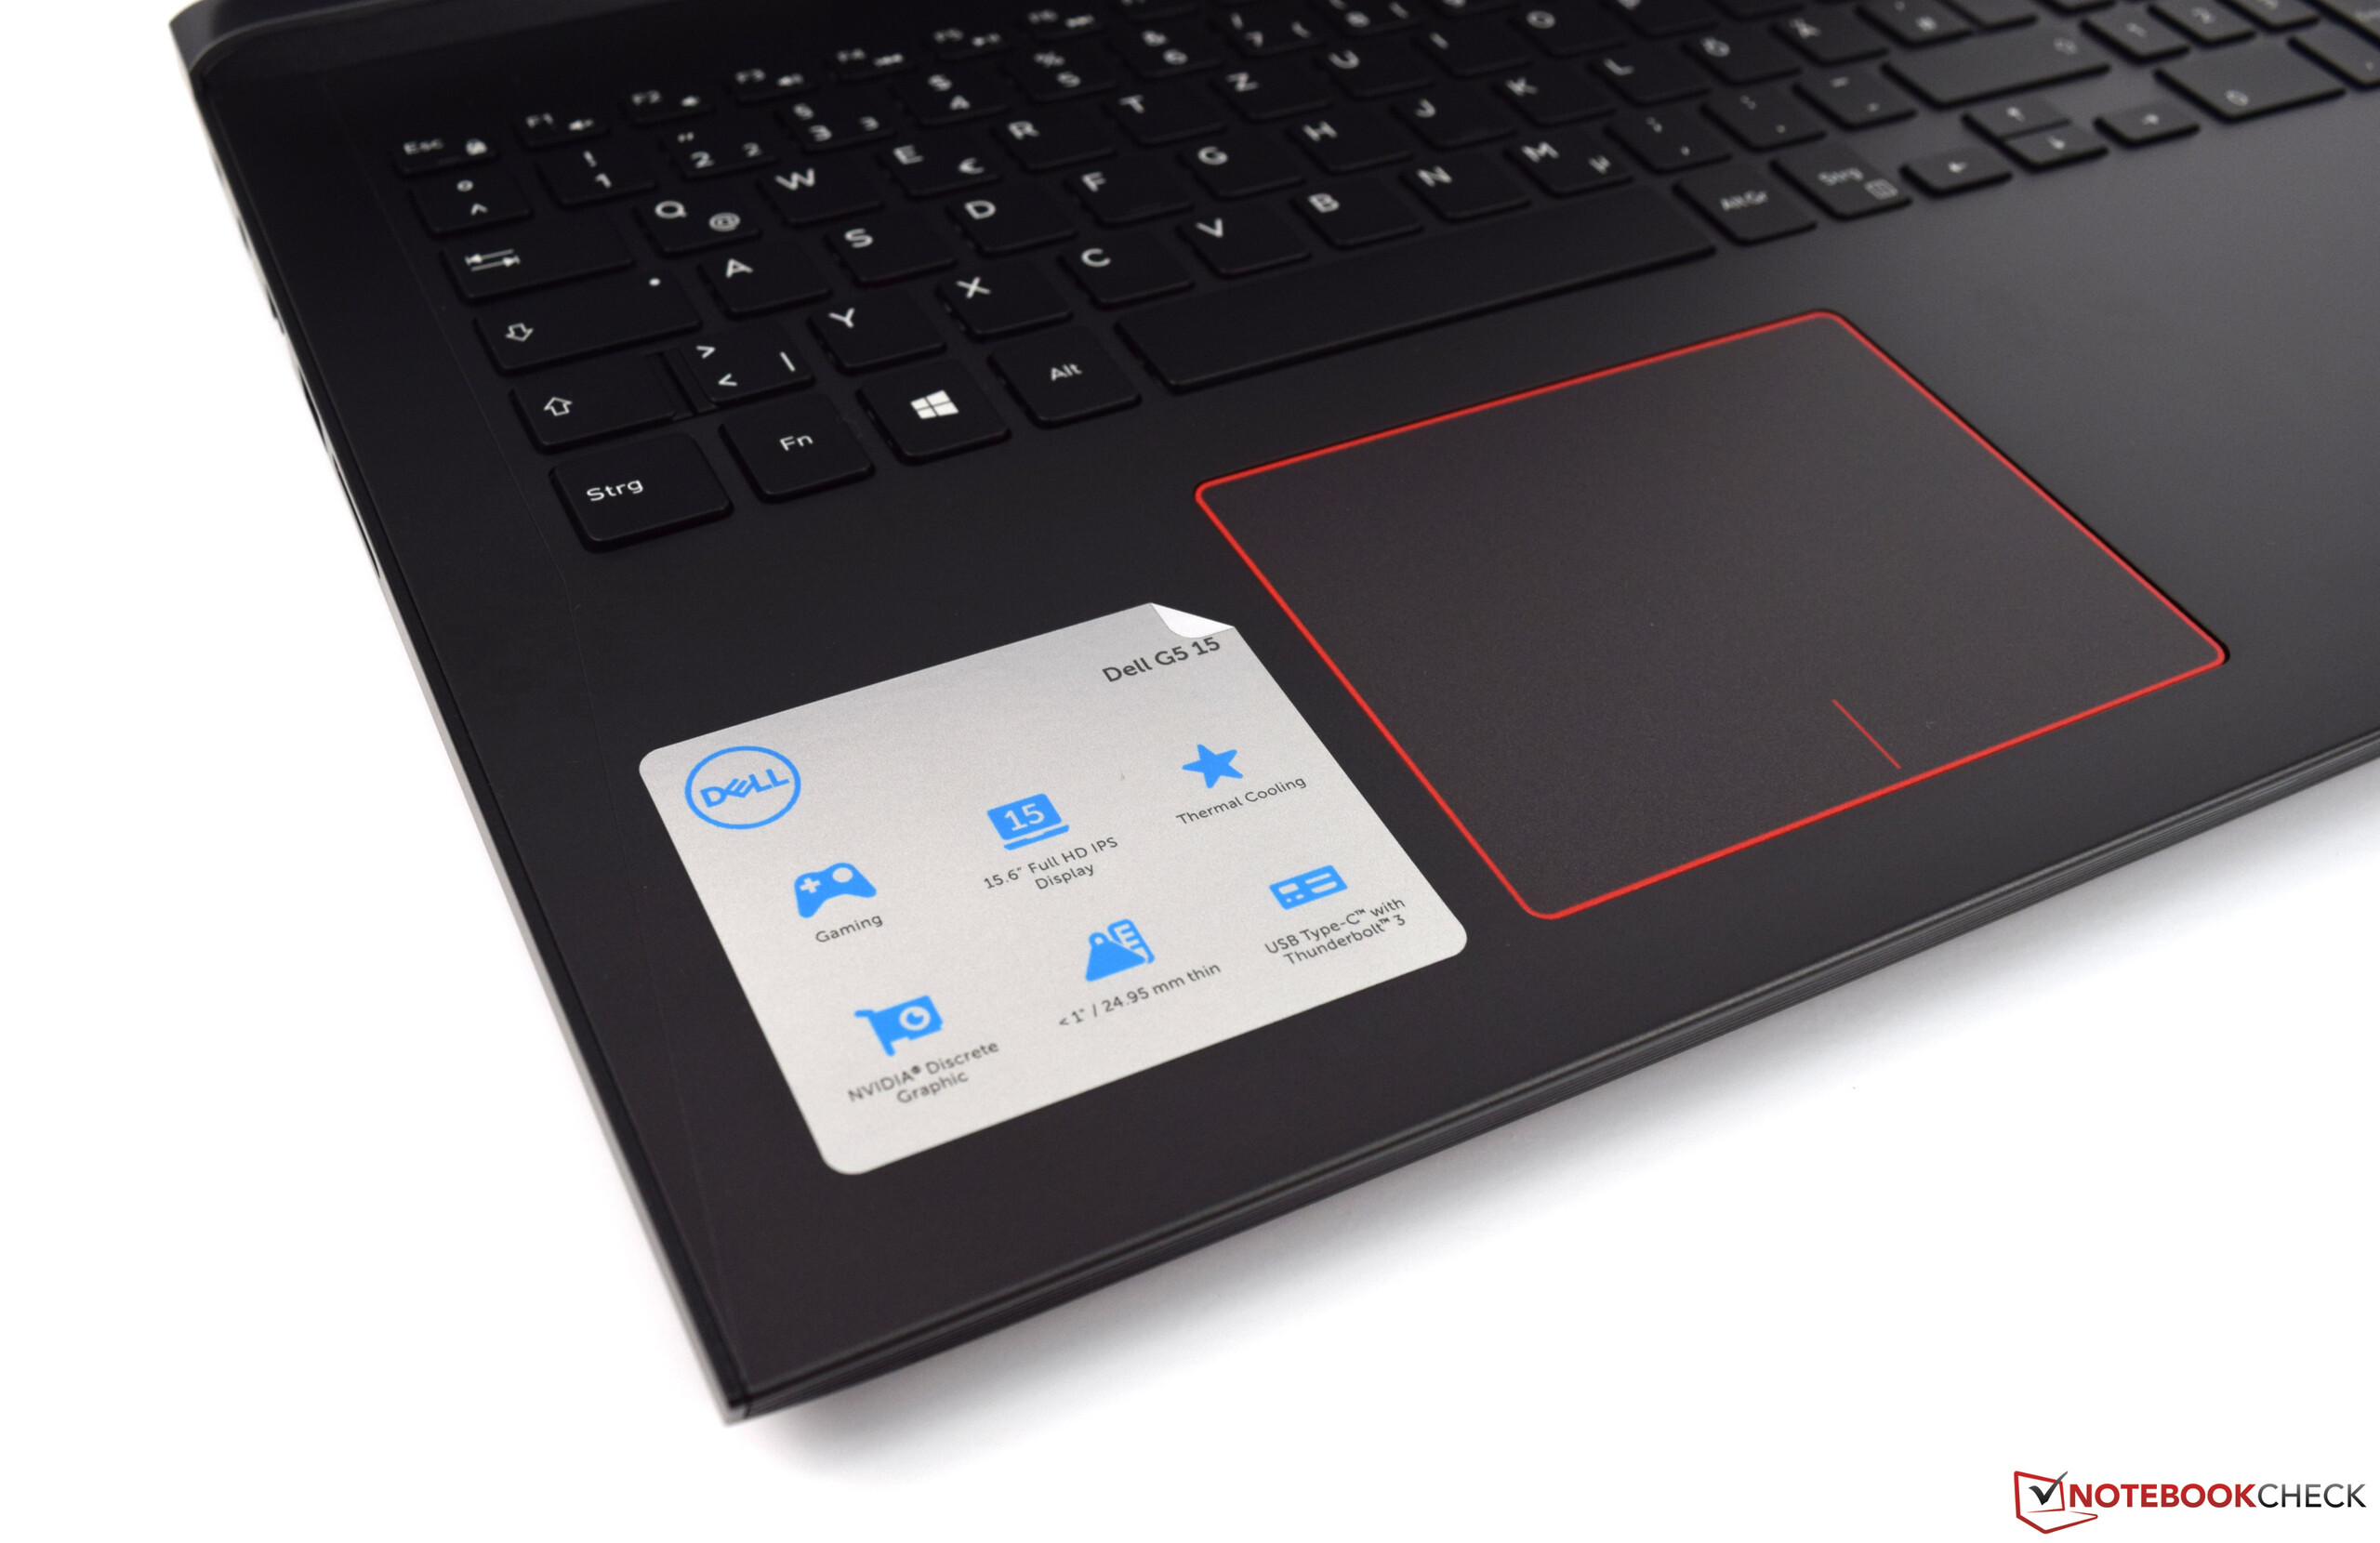
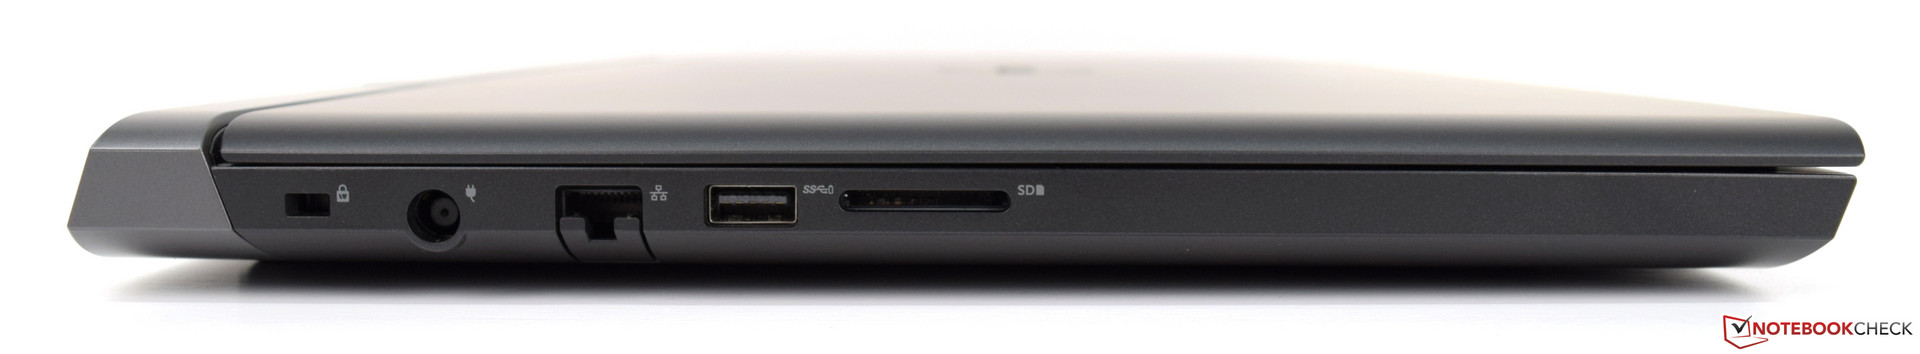
A tela não conseguiu nos convencer, apesar de ter alguns lados positivos também. Mas ter uma superfície mate e não usar PWM nem sempre é suficiente para ser convincente. Nosso modelo simplesmente carece de um pouco de contraste e brilho. Em termos do leitor de cartões, a Dell deveria pensar se a velocidade de uma USB 2.0 ainda está atualizada. Felizmente, o Dell G5 15 também oferece um leitor de cartão de armazenamento.
Em termos de som, esperávamos um pouco mais, pois o que o Dell G5 15 5587 oferece aqui não é adequado para um dispositivo de jogos puro. Um sub-woofer dedicado teria sido desejável. Outro ponto de reclamação é o peso, que com quase 3 kg para um dispositivo de 15,6 polegadas não pode ser facilmente ignorado.
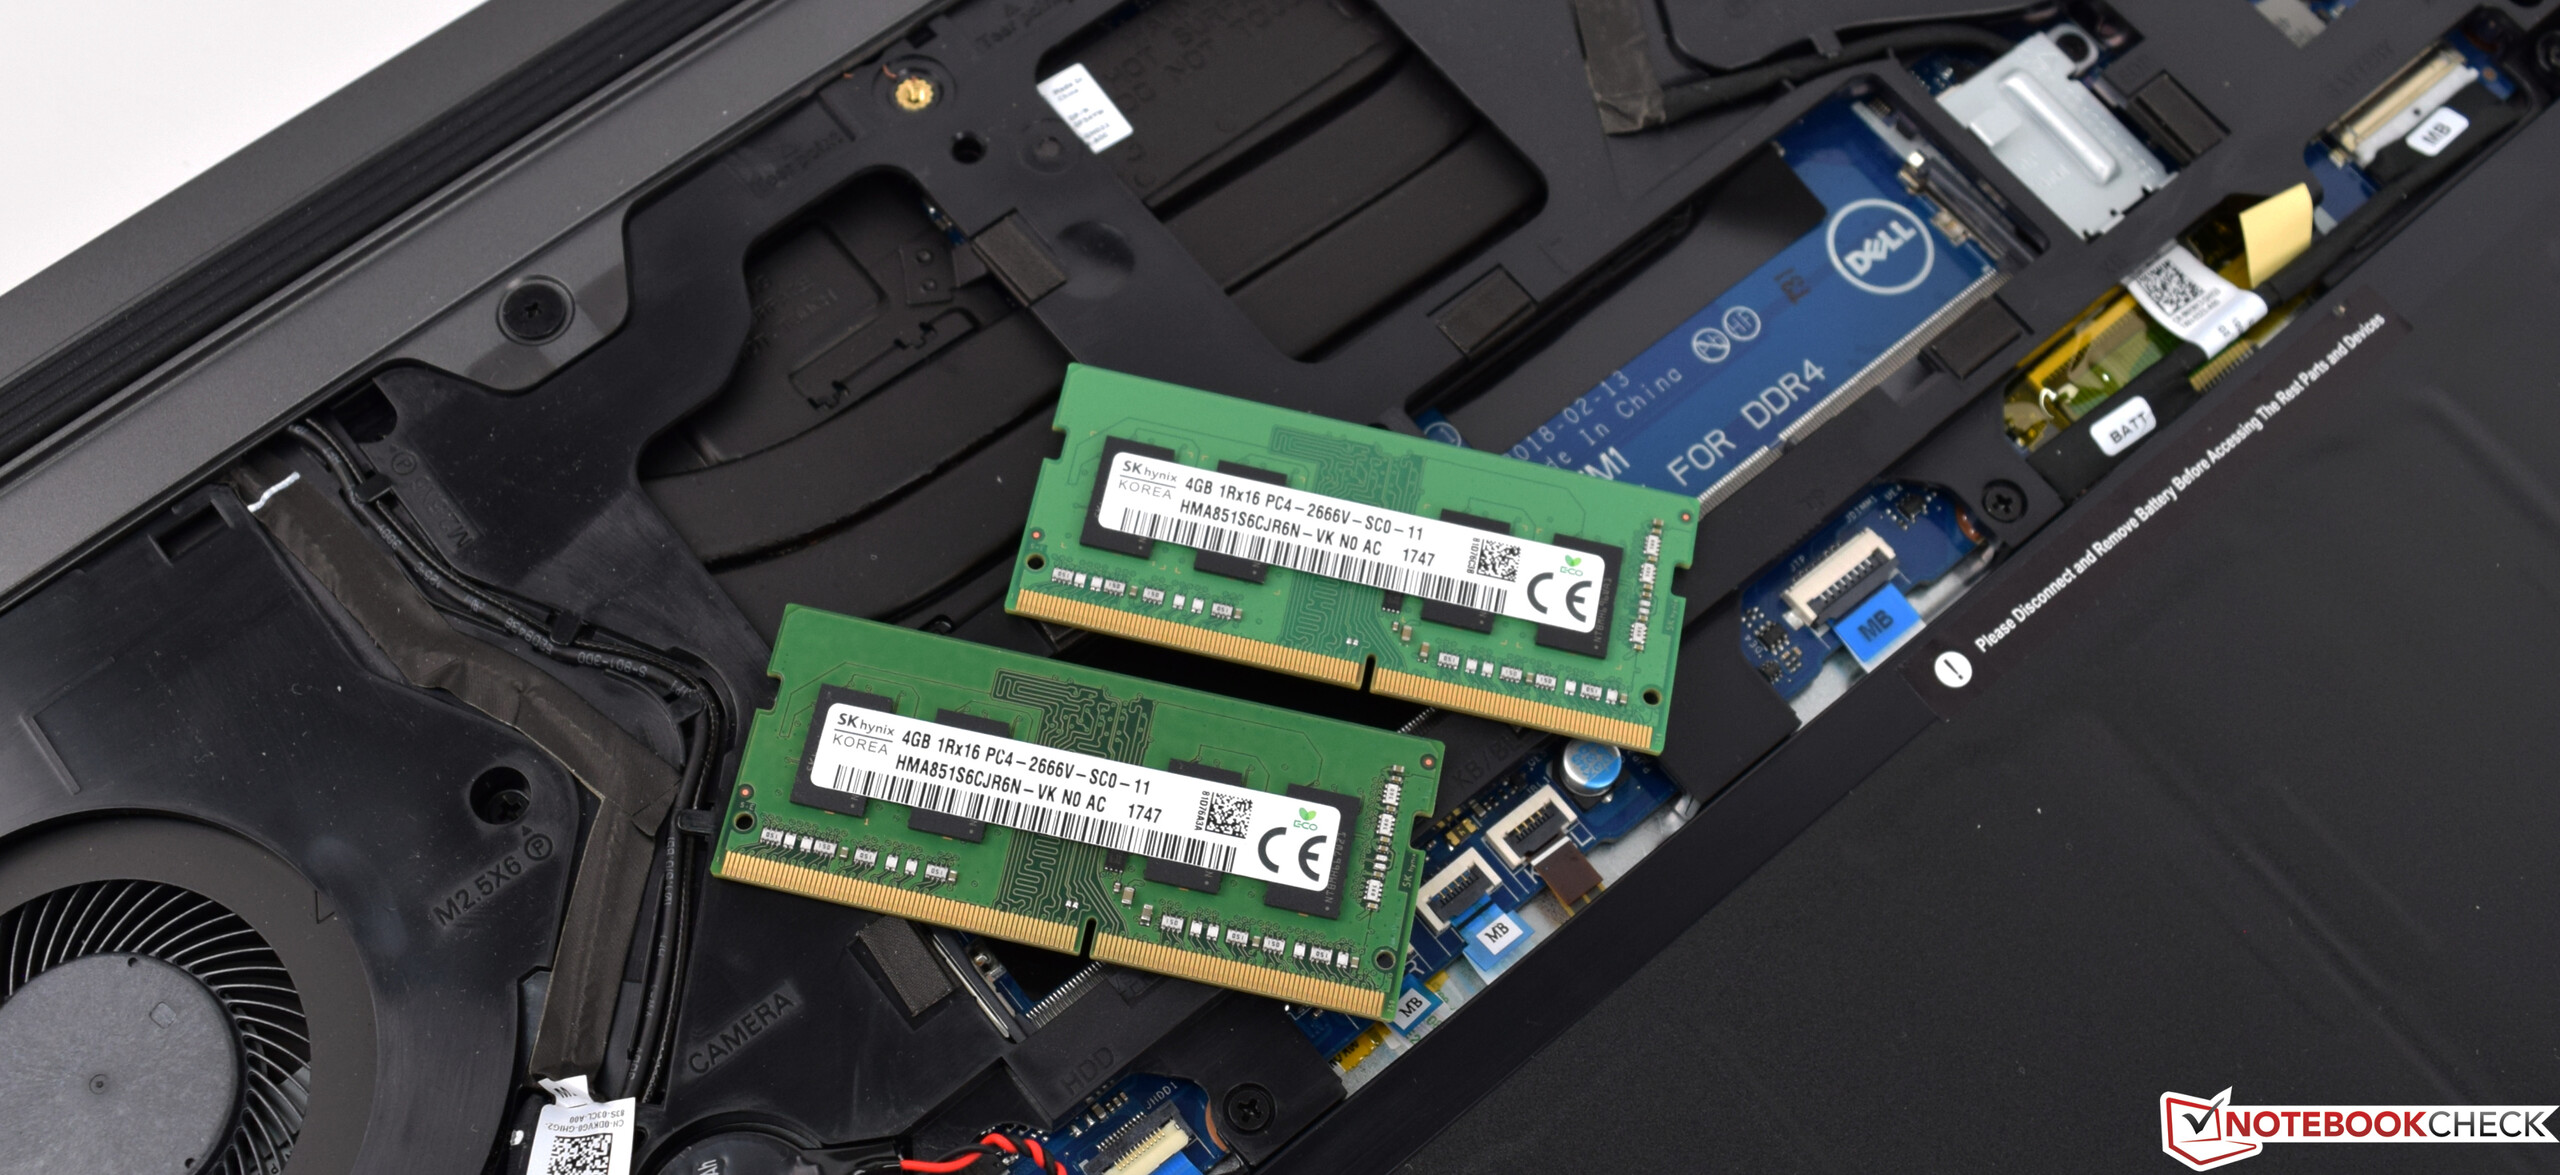
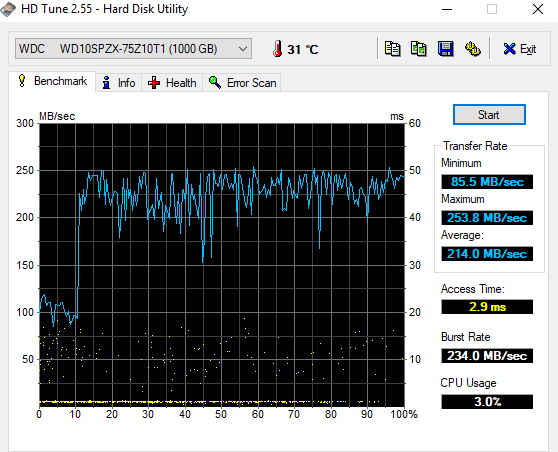
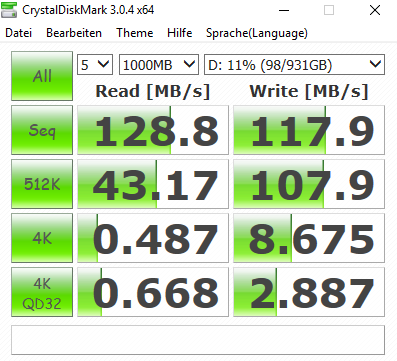
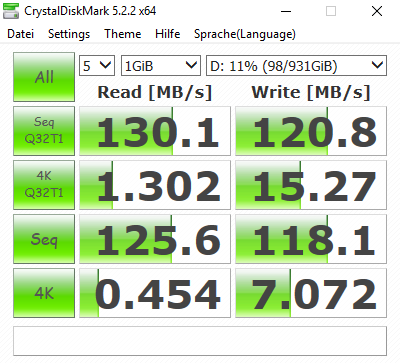
Embora o armazenamento ainda possa ser suficiente inicialmente, recomendamos uma solução SSD maior para poder aproveitar melhor a vantagem da velocidade.
Dell G5 15 5587
- 06/21/2018 v6 (old)
Sebastian Bade