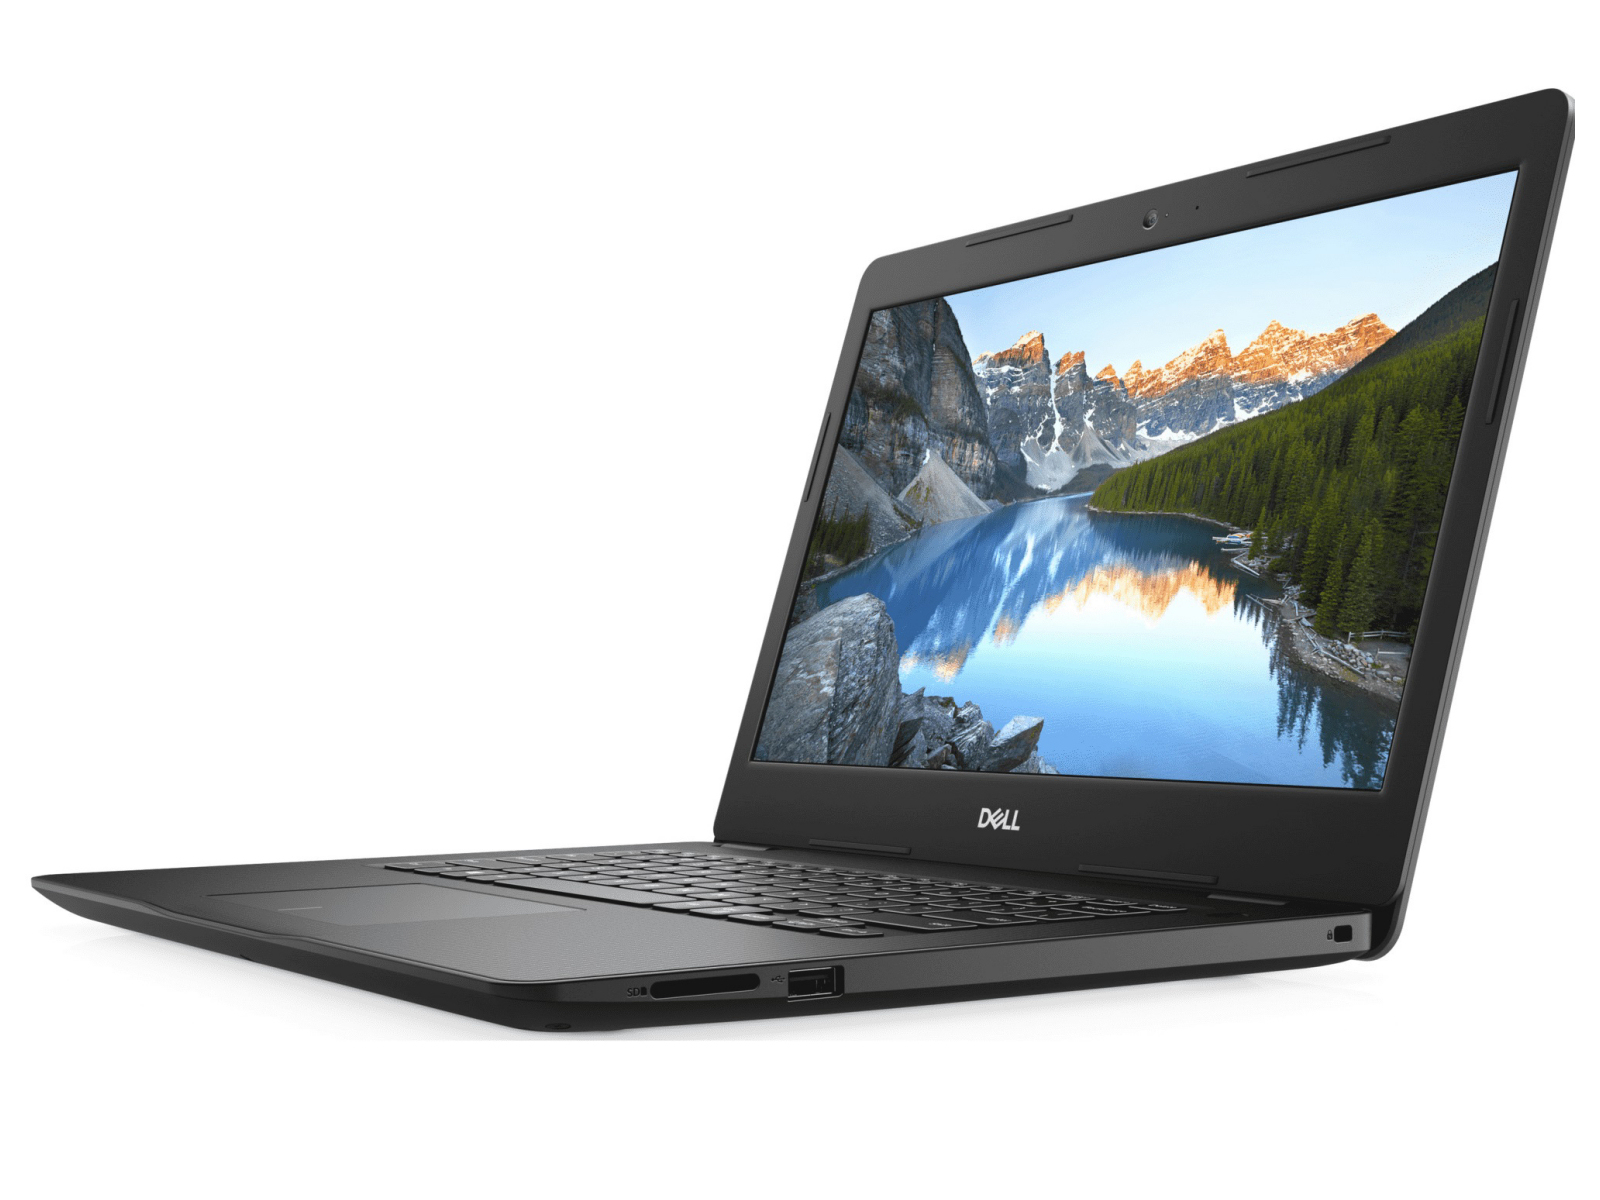
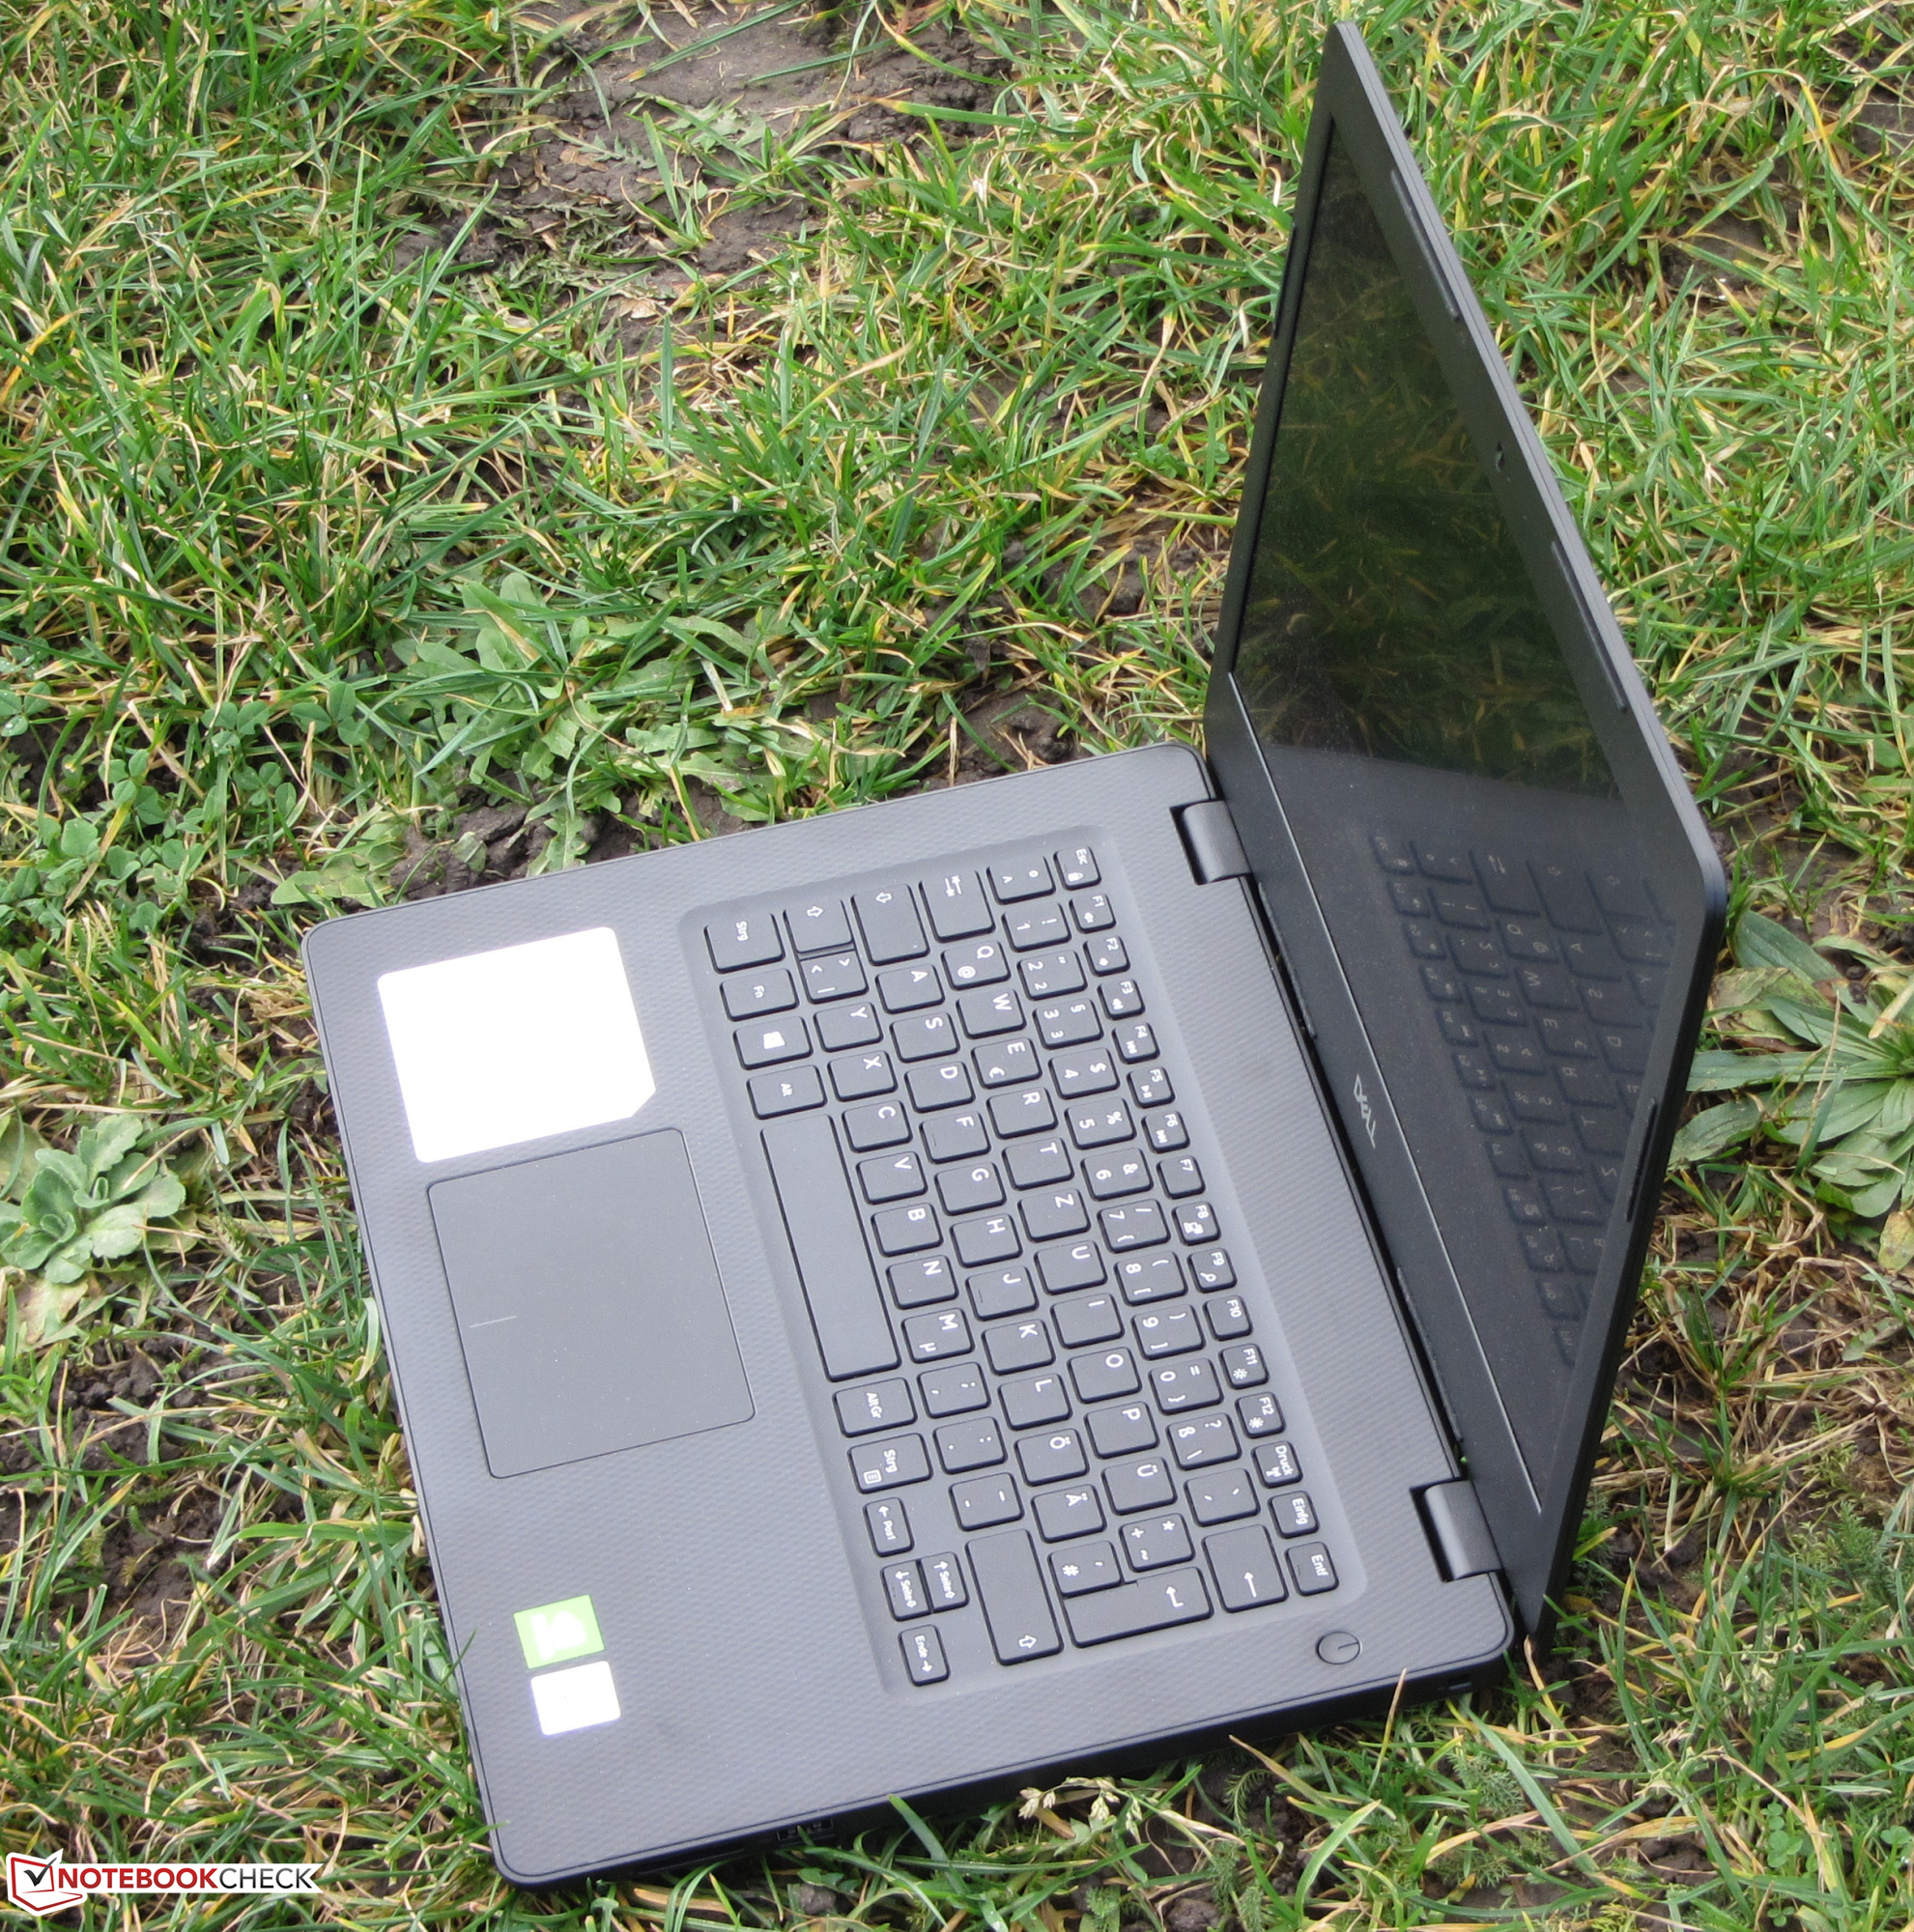
Breve Análise do Portátil Dell Inspiron 14 3493: Portátil de 14 polegadas da Dell negligencia o departamento de GPU
Avaliação | Data | Modelo | Peso | Altura | Size | Resolução | Preço |
|---|---|---|---|---|---|---|---|
| 74.5 % v7 (old) | 01/2020 | Dell Inspiron 14 3493-4KWCF i7-1065G7, GeForce MX230 | 1.8 kg | 21 mm | 14.00" | 1920x1080 | |
| 83.8 % v6 (old) | 08/2019 | Asus VivoBook 14 X412FJ-EB023T i5-8265U, GeForce MX230 | 1.5 kg | 19 mm | 14.00" | 1920x1080 | |
| 81.9 % v6 (old) | 06/2019 | HP 14-dk0008ng R7 3700U, Vega 10 | 1.5 kg | 20 mm | 14.00" | 1920x1080 | |
| 82.7 % v7 (old) | 12/2019 | Acer Swift 3 SF314-41-R8HZ R5 3500U, Vega 8 | 1.5 kg | 18 mm | 14.00" | 1920x1080 | |
| 84.8 % v6 (old) | 06/2019 | Lenovo Ideapad S340-14IWL-81N70056GE i7-8565U, GeForce MX230 | 1.6 kg | 17.9 mm | 14.00" | 1920x1080 | |
| 84.6 % v7 (old) | 05/2019 | Huawei MateBook D 14 W00D-53010GXL R5 2500U, Vega 8 | 1.5 kg | 16 mm | 14.00" | 1920x1080 |
| |||||||||||||||||||||||||
iluminação: 92 %
iluminação com acumulador: 195 cd/m²
Contraste: 1329:1 (Preto: 0.17 cd/m²)
ΔE ColorChecker Calman: 5.21 | ∀{0.5-29.43 Ø4.72}
calibrated: 4.43
ΔE Greyscale Calman: 3.27 | ∀{0.09-98 Ø4.97}
62% sRGB (Argyll 1.6.3 3D)
40% AdobeRGB 1998 (Argyll 1.6.3 3D)
43.33% AdobeRGB 1998 (Argyll 3D)
62.3% sRGB (Argyll 3D)
41.84% Display P3 (Argyll 3D)
Gamma: 2.36
CCT: 6538 K
| Dell Inspiron 14 3493-4KWCF IPS, 1920x1080, 14" | Asus VivoBook 14 X412FJ-EB023T IPS, 1920x1080, 14" | HP 14-dk0008ng IPS, 1920x1080, 14" | Acer Swift 3 SF314-41-R8HZ IPS, 1920x1080, 14" | Lenovo Ideapad S340-14IWL-81N70056GE IPS, 1920x1080, 14" | Huawei MateBook D 14 W00D-53010GXL IPS, 1920x1080, 14" | |
|---|---|---|---|---|---|---|
| Display | -5% | -6% | -1% | -8% | 5% | |
| Display P3 Coverage (%) | 41.84 | 39.65 -5% | 39.53 -6% | 41.43 -1% | 38.41 -8% | 44.26 6% |
| sRGB Coverage (%) | 62.3 | 59.5 -4% | 59.1 -5% | 61.8 -1% | 57.8 -7% | 65.1 4% |
| AdobeRGB 1998 Coverage (%) | 43.33 | 40.96 -5% | 40.84 -6% | 42.85 -1% | 39.68 -8% | 45.73 6% |
| Response Times | 4% | 10% | 10% | 13% | -5% | |
| Response Time Grey 50% / Grey 80% * (ms) | 41 ? | 40 ? 2% | 38 ? 7% | 38 ? 7% | 36 ? 12% | 42.4 ? -3% |
| Response Time Black / White * (ms) | 31 ? | 29 ? 6% | 27 ? 13% | 27 ? 13% | 27 ? 13% | 32.8 ? -6% |
| PWM Frequency (Hz) | 2500 ? | 250 ? | 198.4 ? | |||
| Screen | 7% | 13% | -4% | -11% | 0% | |
| Brightness middle (cd/m²) | 226 | 274 21% | 269 19% | 233 3% | 260 15% | 287 27% |
| Brightness (cd/m²) | 214 | 255 19% | 257 20% | 219 2% | 250 17% | 276 29% |
| Brightness Distribution (%) | 92 | 89 -3% | 89 -3% | 75 -18% | 87 -5% | 86 -7% |
| Black Level * (cd/m²) | 0.17 | 0.305 -79% | 0.2 -18% | 0.14 18% | 0.29 -71% | 0.25 -47% |
| Contrast (:1) | 1329 | 898 -32% | 1345 1% | 1664 25% | 897 -33% | 1148 -14% |
| Colorchecker dE 2000 * | 5.21 | 3.66 30% | 3.68 29% | 5.9 -13% | 6.29 -21% | 5.4 -4% |
| Colorchecker dE 2000 max. * | 22.15 | 7.54 66% | 7.36 67% | 22.8 -3% | 14.77 33% | 18.1 18% |
| Colorchecker dE 2000 calibrated * | 4.43 | 4.8 -8% | 4.51 -2% | 5 -13% | ||
| Greyscale dE 2000 * | 3.27 | 1.45 56% | 1.69 48% | 4.8 -47% | 4.65 -42% | 3.1 5% |
| Gamma | 2.36 93% | 2.49 88% | 2.49 88% | 2.06 107% | 2.73 81% | 1.99 111% |
| CCT | 6538 99% | 6597 99% | 6406 101% | 6589 99% | 7331 89% | 6769 96% |
| Color Space (Percent of AdobeRGB 1998) (%) | 40 | 38 -5% | 38 -5% | 39 -2% | 37 -7% | 41.8 5% |
| Color Space (Percent of sRGB) (%) | 62 | 59 -5% | 59 -5% | 62 0% | 58 -6% | 64.6 4% |
| Média Total (Programa/Configurações) | 2% /
4% | 6% /
9% | 2% /
-1% | -2% /
-8% | 0% /
1% |
* ... menor é melhor
Exibir tempos de resposta
| ↔ Tempo de resposta preto para branco | ||
|---|---|---|
| 31 ms ... ascensão ↗ e queda ↘ combinadas | ↗ 18 ms ascensão | 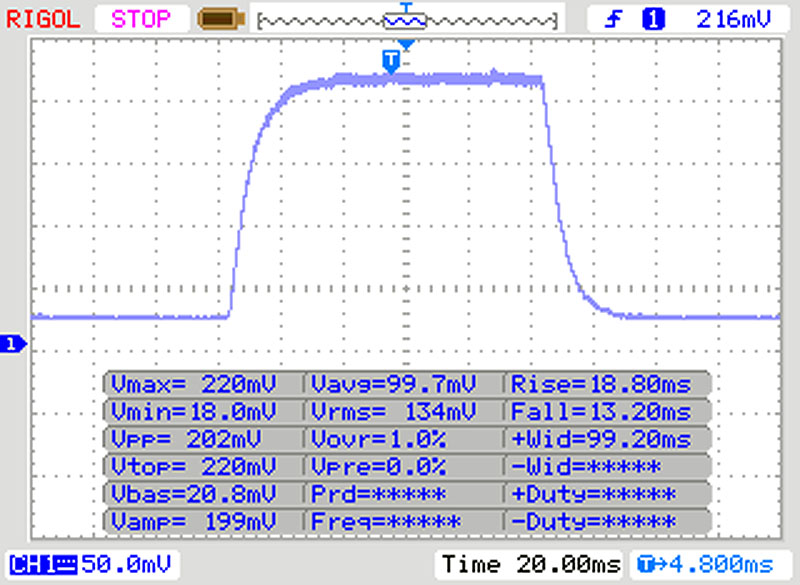 |
| ↘ 13 ms queda | ||
| A tela mostra taxas de resposta lentas em nossos testes e será insatisfatória para os jogadores. Em comparação, todos os dispositivos testados variam de 0.1 (mínimo) a 240 (máximo) ms. » 84 % de todos os dispositivos são melhores. Isso significa que o tempo de resposta medido é pior que a média de todos os dispositivos testados (19.8 ms). | ||
| ↔ Tempo de resposta 50% cinza a 80% cinza | ||
| 41 ms ... ascensão ↗ e queda ↘ combinadas | ↗ 23 ms ascensão | 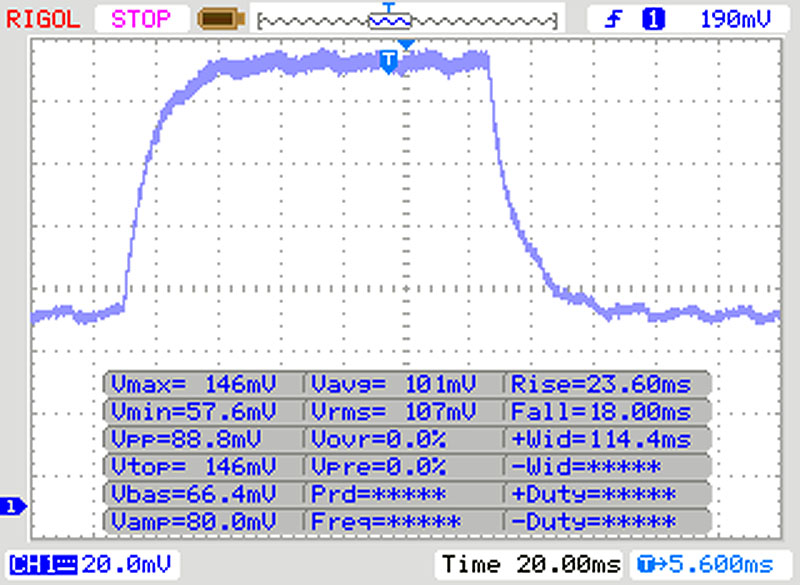 |
| ↘ 18 ms queda | ||
| A tela mostra taxas de resposta lentas em nossos testes e será insatisfatória para os jogadores. Em comparação, todos os dispositivos testados variam de 0.165 (mínimo) a 636 (máximo) ms. » 65 % de todos os dispositivos são melhores. Isso significa que o tempo de resposta medido é pior que a média de todos os dispositivos testados (31 ms). | ||
Cintilação da tela / PWM (modulação por largura de pulso)
| Tela tremeluzindo/PWM detectado | 2500 Hz | ≤ 20 % configuração de brilho | 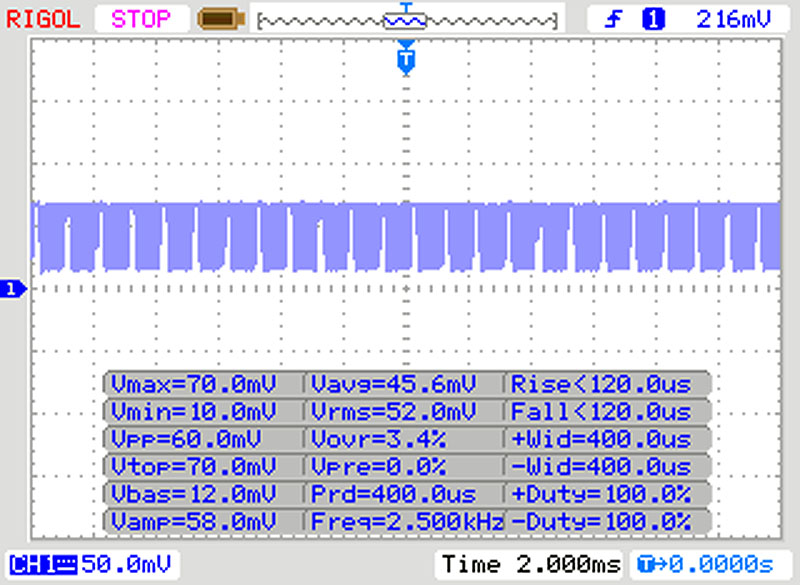 |
A luz de fundo da tela pisca em 2500 Hz (pior caso, por exemplo, utilizando PWM) Cintilação detectada em uma configuração de brilho de 20 % e abaixo. Não deve haver cintilação ou PWM acima desta configuração de brilho. A frequência de 2500 Hz é bastante alta, então a maioria dos usuários sensíveis ao PWM não deve notar nenhuma oscilação. [pwm_comparison] Em comparação: 52 % de todos os dispositivos testados não usam PWM para escurecer a tela. Se PWM foi detectado, uma média de 7763 (mínimo: 5 - máximo: 343500) Hz foi medida. | |||
| Geekbench 3 | |
| 32 Bit Multi-Core Score | |
| Dell Inspiron 14 3493-4KWCF | |
| Média Intel Core i7-1065G7 (n=1) | |
| Asus VivoBook 14 X412FJ-EB023T | |
| Acer Swift 3 SF314-41-R8HZ | |
| HP 14-dk0008ng | |
| 32 Bit Single-Core Score | |
| Dell Inspiron 14 3493-4KWCF | |
| Média Intel Core i7-1065G7 (n=1) | |
| Asus VivoBook 14 X412FJ-EB023T | |
| Acer Swift 3 SF314-41-R8HZ | |
| HP 14-dk0008ng | |
| Geekbench 5.0 | |
| 5.0 Multi-Core | |
| Média Intel Core i7-1065G7 (3375 - 4839, n=6) | |
| Dell Inspiron 14 3493-4KWCF | |
| Acer Swift 3 SF314-41-R8HZ | |
| 5.0 Single-Core | |
| Média Intel Core i7-1065G7 (1184 - 1334, n=6) | |
| Dell Inspiron 14 3493-4KWCF | |
| Acer Swift 3 SF314-41-R8HZ | |
| Mozilla Kraken 1.1 - Total | |
| Huawei MateBook D 14 W00D-53010GXL | |
| HP 14-dk0008ng (Edge 44) | |
| Acer Swift 3 SF314-41-R8HZ (Edge 44) | |
| Asus VivoBook 14 X412FJ-EB023T (Edge 44) | |
| Dell Inspiron 14 3493-4KWCF (Edge 44) | |
| Média Intel Core i7-1065G7 (788 - 1249, n=30) | |
| Lenovo Ideapad S340-14IWL-81N70056GE | |
| Média da turma Multimedia (228 - 835, n=72, últimos 2 anos) | |
| Octane V2 - Total Score | |
| Média da turma Multimedia (64079 - 153175, n=33, últimos 2 anos) | |
| Lenovo Ideapad S340-14IWL-81N70056GE | |
| Média Intel Core i7-1065G7 (25166 - 53081, n=17) | |
| Dell Inspiron 14 3493-4KWCF (Edge 44) | |
| Asus VivoBook 14 X412FJ-EB023T (Edge 44) | |
| Acer Swift 3 SF314-41-R8HZ (Edge 44) | |
| HP 14-dk0008ng (Edge 44) | |
| Huawei MateBook D 14 W00D-53010GXL | |
| JetStream 1.1 - 1.1 Total | |
| Média da turma Multimedia (n=1últimos 2 anos) | |
| Dell Inspiron 14 3493-4KWCF (Edge 44) | |
| Média Intel Core i7-1065G7 (205 - 273, n=16) | |
| Lenovo Ideapad S340-14IWL-81N70056GE | |
| Asus VivoBook 14 X412FJ-EB023T (Edge 44) | |
| Acer Swift 3 SF314-41-R8HZ (Edge 44) | |
| HP 14-dk0008ng (Edge 44) | |
| Huawei MateBook D 14 W00D-53010GXL | |
* ... menor é melhor
| PCMark 8 Home Score Accelerated v2 | 3355 pontos | |
| PCMark 8 Creative Score Accelerated v2 | 3948 pontos | |
| PCMark 8 Work Score Accelerated v2 | 4955 pontos | |
| PCMark 10 Score | 3862 pontos | |
Ajuda | ||

| Dell Inspiron 14 3493-4KWCF Toshiba KBG40ZNS512G NVMe | Asus VivoBook 14 X412FJ-EB023T Kingston RBUSNS8180DS3256GJ | HP 14-dk0008ng Samsung PM871b MZNLN128HAHQ | Acer Swift 3 SF314-41-R8HZ WDC PC SN520 SDAPNUW-512G | Lenovo Ideapad S340-14IWL-81N70056GE WDC PC SN520 SDAPNUW-512G | Huawei MateBook D 14 W00D-53010GXL SK Hynix SC313 HFS256G39TNF | Média Toshiba KBG40ZNS512G NVMe | |
|---|---|---|---|---|---|---|---|
| CrystalDiskMark 5.2 / 6 | -60% | -58% | -15% | -2% | -59% | -9% | |
| Write 4K (MB/s) | 159.6 | 79.7 -50% | 90.6 -43% | 134.3 -16% | 160.8 1% | 72.3 -55% | 126.4 ? -21% |
| Read 4K (MB/s) | 53.5 | 28.14 -47% | 33.17 -38% | 43.56 -19% | 50.5 -6% | 30.77 -42% | 50 ? -7% |
| Write Seq (MB/s) | 1174 | 450.9 -62% | 483 -59% | 1434 22% | 1458 24% | 468.1 -60% | 1207 ? 3% |
| Read Seq (MB/s) | 1648 | 434.7 -74% | 511 -69% | 1448 -12% | 1447 -12% | 518 -69% | 1567 ? -5% |
| Write 4K Q32T1 (MB/s) | 420.8 | 228.5 -46% | 170.7 -59% | 239.1 -43% | 406.5 -3% | 214.2 -49% | 347 ? -18% |
| Read 4K Q32T1 (MB/s) | 564 | 244.1 -57% | 235 -58% | 327.6 -42% | 476.8 -15% | 241.1 -57% | 425 ? -25% |
| Write Seq Q32T1 (MB/s) | 1231 | 478.4 -61% | 496.5 -60% | 1456 18% | 1458 18% | 482 -61% | 1224 ? -1% |
| Read Seq Q32T1 (MB/s) | 2274 | 456.6 -80% | 534 -77% | 1734 -24% | 1743 -23% | 537 -76% | 2278 ? 0% |
| 3DMark 11 Performance | 3316 pontos | |
| 3DMark Ice Storm Standard Score | 47692 pontos | |
| 3DMark Cloud Gate Standard Score | 10313 pontos | |
| 3DMark Fire Strike Score | 2041 pontos | |
| 3DMark Time Spy Score | 786 pontos | |
Ajuda | ||
| BioShock Infinite - 1366x768 High Preset | |
| Lenovo Ideapad S340-14IWL-81N70056GE | |
| Asus VivoBook 14 X412FJ-EB023T | |
| Média NVIDIA GeForce MX230 (61.8 - 79.8, n=5) | |
| Dell Inspiron 14 3493-4KWCF | |
| Microsoft Surface Laptop 3 15 i7-1065G7 | |
| Lenovo Yoga C940-14IIL | |
| Lenovo Yoga C940-14IIL 81Q9 | |
| Acer Swift 3 SF314-41-R8HZ | |
| HP 14-dk0008ng | |
| HP Spectre x360 13-aw0013dx | |
| Dell Inspiron 14 3493-4KWCF (Dual-Channel) | |
| Overwatch - 1366x768 Medium (Render Scale 100 %) AA:FX AF:2x | |
| Dell Inspiron 14 3493-4KWCF | |
| Média NVIDIA GeForce MX230 (78.3 - 83, n=2) | |
| Dell Inspiron 14 3493-4KWCF (Dual-Channel) | |
| Microsoft Surface Laptop 3 15 i7-1065G7 | |
| baixo | média | alto | ultra | |
|---|---|---|---|---|
| Tomb Raider (2013) | 150.8 | 74.4 | 55.4 | 26.1 |
| BioShock Infinite (2013) | 148.5 | 71.3 | 61.8 | 26.2 |
| Overwatch (2016) | 101 | 83 | 39.1 | 23 |
| Total War: Three Kingdoms (2019) | 55.5 | 12.3 | 5.8 | 3.5 |
Barulho
| Ocioso |
| 30.3 / 30.3 / 30.3 dB |
| Carga |
| 42.9 / 43.3 dB |
 | ||
30 dB silencioso 40 dB(A) audível 50 dB(A) ruidosamente alto |
||
min: | ||
| Dell Inspiron 14 3493-4KWCF i7-1065G7, GeForce MX230 | Asus VivoBook 14 X412FJ-EB023T i5-8265U, GeForce MX230 | HP 14-dk0008ng R7 3700U, Vega 10 | Acer Swift 3 SF314-41-R8HZ R5 3500U, Vega 8 | Lenovo Ideapad S340-14IWL-81N70056GE i7-8565U, GeForce MX230 | Huawei MateBook D 14 W00D-53010GXL R5 2500U, Vega 8 | Média NVIDIA GeForce MX230 | Média da turma Multimedia | |
|---|---|---|---|---|---|---|---|---|
| Noise | 3% | 6% | 4% | 3% | 10% | 4% | 13% | |
| desligado / ambiente * (dB) | 30.3 | 30 1% | 30.6 -1% | 30.4 -0% | 30.6 -1% | 29.5 3% | 30.2 ? -0% | 24.2 ? 20% |
| Idle Minimum * (dB) | 30.3 | 30.5 -1% | 31.4 -4% | 30.4 -0% | 30.6 -1% | 29.5 3% | 30.4 ? -0% | 24.3 ? 20% |
| Idle Average * (dB) | 30.3 | 30.5 -1% | 31.4 -4% | 30.9 -2% | 30.6 -1% | 29.5 3% | 30.4 ? -0% | 24.7 ? 18% |
| Idle Maximum * (dB) | 30.3 | 30.5 -1% | 31.4 -4% | 30.9 -2% | 31.2 -3% | 30.4 -0% | 30.5 ? -1% | 26.4 ? 13% |
| Load Average * (dB) | 42.9 | 38.2 11% | 32.5 24% | 36.3 15% | 36.5 15% | 31.5 27% | 37.5 ? 13% | 37.4 ? 13% |
| Load Maximum * (dB) | 43.3 | 40.2 7% | 32.5 25% | 36.6 15% | 39.7 8% | 33.5 23% | 39.6 ? 9% | 45.9 ? -6% |
* ... menor é melhor
(±) A temperatura máxima no lado superior é 44.4 °C / 112 F, em comparação com a média de 36.8 °C / 98 F , variando de 21 a 71 °C para a classe Multimedia.
(-) A parte inferior aquece até um máximo de 52.2 °C / 126 F, em comparação com a média de 39.1 °C / 102 F
(+) Em uso inativo, a temperatura média para o lado superior é 23.6 °C / 74 F, em comparação com a média do dispositivo de 31.3 °C / ### class_avg_f### F.
(+) Os apoios para as mãos e o touchpad são mais frios que a temperatura da pele, com um máximo de 27.9 °C / 82.2 F e, portanto, são frios ao toque.
(±) A temperatura média da área do apoio para as mãos de dispositivos semelhantes foi 28.7 °C / 83.7 F (+0.8 °C / 1.5 F).
| Dell Inspiron 14 3493-4KWCF i7-1065G7, GeForce MX230 | Asus VivoBook 14 X412FJ-EB023T i5-8265U, GeForce MX230 | HP 14-dk0008ng R7 3700U, Vega 10 | Acer Swift 3 SF314-41-R8HZ R5 3500U, Vega 8 | Lenovo Ideapad S340-14IWL-81N70056GE i7-8565U, GeForce MX230 | Huawei MateBook D 14 W00D-53010GXL R5 2500U, Vega 8 | Média NVIDIA GeForce MX230 | Média da turma Multimedia | |
|---|---|---|---|---|---|---|---|---|
| Heat | -1% | 9% | 6% | -3% | 6% | 1% | 1% | |
| Maximum Upper Side * (°C) | 44.4 | 45.2 -2% | 39.6 11% | 37.1 16% | 45.2 -2% | 44.3 -0% | 44.1 ? 1% | 41.1 ? 7% |
| Maximum Bottom * (°C) | 52.2 | 42.7 18% | 37.1 29% | 39.6 24% | 43.8 16% | 45 14% | 44.1 ? 16% | 43.7 ? 16% |
| Idle Upper Side * (°C) | 25 | 27.6 -10% | 25.8 -3% | 26.8 -7% | 27.4 -10% | 23.9 4% | 26.5 ? -6% | 27 ? -8% |
| Idle Bottom * (°C) | 25.1 | 27.8 -11% | 25.3 -1% | 27.2 -8% | 28.7 -14% | 23.5 6% | 26.7 ? -6% | 28 ? -12% |
* ... menor é melhor
Dell Inspiron 14 3493-4KWCF análise de áudio
(-) | alto-falantes não muito altos (###valor### dB)
Graves 100 - 315Hz
(±) | graves reduzidos - em média 5.6% menor que a mediana
(-) | graves não são lineares (16.1% delta para frequência anterior)
Médios 400 - 2.000 Hz
(+) | médios equilibrados - apenas 4% longe da mediana
(-) | médios não são lineares (26.8% delta para frequência anterior)
Altos 2 - 16 kHz
(+) | agudos equilibrados - apenas 4.1% longe da mediana
(-) | os máximos não são lineares (30.2% delta da frequência anterior)
Geral 100 - 16.000 Hz
(-) | o som geral não é linear (45.2% diferença em relação à mediana)
Comparado com a mesma classe
» 100% de todos os dispositivos testados nesta classe foram melhores, 0% semelhantes, 0% piores
» O melhor teve um delta de 5%, a média foi 17%, o pior foi 45%
Comparado com todos os dispositivos testados
» 96% de todos os dispositivos testados foram melhores, 0% semelhantes, 4% piores
» O melhor teve um delta de 4%, a média foi 23%, o pior foi 134%
Lenovo Ideapad S340-14IWL-81N70056GE análise de áudio
(-) | alto-falantes não muito altos (###valor### dB)
Graves 100 - 315Hz
(-) | quase nenhum baixo - em média 20.1% menor que a mediana
(±) | a linearidade dos graves é média (11.5% delta para a frequência anterior)
Médios 400 - 2.000 Hz
(+) | médios equilibrados - apenas 3.9% longe da mediana
(±) | a linearidade dos médios é média (7.1% delta para frequência anterior)
Altos 2 - 16 kHz
(+) | agudos equilibrados - apenas 2.6% longe da mediana
(+) | os máximos são lineares (5.9% delta da frequência anterior)
Geral 100 - 16.000 Hz
(±) | a linearidade do som geral é média (23.1% diferença em relação à mediana)
Comparado com a mesma classe
» 82% de todos os dispositivos testados nesta classe foram melhores, 5% semelhantes, 14% piores
» O melhor teve um delta de 5%, a média foi 17%, o pior foi 45%
Comparado com todos os dispositivos testados
» 69% de todos os dispositivos testados foram melhores, 5% semelhantes, 26% piores
» O melhor teve um delta de 4%, a média foi 23%, o pior foi 134%
| desligado | |
| Ocioso | |
| Carga |
|
Key:
min: | |
| Dell Inspiron 14 3493-4KWCF i7-1065G7, GeForce MX230 | Asus VivoBook 14 X412FJ-EB023T i5-8265U, GeForce MX230 | HP 14-dk0008ng R7 3700U, Vega 10 | Acer Swift 3 SF314-41-R8HZ R5 3500U, Vega 8 | Lenovo Ideapad S340-14IWL-81N70056GE i7-8565U, GeForce MX230 | Huawei MateBook D 14 W00D-53010GXL R5 2500U, Vega 8 | Média NVIDIA GeForce MX230 | Média da turma Multimedia | |
|---|---|---|---|---|---|---|---|---|
| Power Consumption | -6% | 6% | -6% | 17% | -4% | 3% | -57% | |
| Idle Minimum * (Watt) | 4.7 | 4.7 -0% | 4.8 -2% | 5.7 -21% | 2.5 47% | 5.3 -13% | 3.77 ? 20% | 5.65 ? -20% |
| Idle Average * (Watt) | 6.6 | 6.7 -2% | 7.1 -8% | 7.6 -15% | 5.1 23% | 7.8 -18% | 6.16 ? 7% | 10 ? -52% |
| Idle Maximum * (Watt) | 5.9 | 7.5 -27% | 7.3 -24% | 9 -53% | 5.6 5% | 8.46 -43% | 7.06 ? -20% | 12.3 ? -108% |
| Load Average * (Watt) | 56 | 54.4 3% | 34 39% | 40.1 28% | 47.5 15% | 36.9 34% | 49.6 ? 11% | 65.1 ? -16% |
| Load Maximum * (Watt) | 60.2 | 63 -5% | 45 25% | 42.4 30% | 64.5 -7% | 49.4 18% | 63.3 ? -5% | 112.5 ? -87% |
* ... menor é melhor
| Dell Inspiron 14 3493-4KWCF i7-1065G7, GeForce MX230, 42 Wh | Asus VivoBook 14 X412FJ-EB023T i5-8265U, GeForce MX230, 37 Wh | HP 14-dk0008ng R7 3700U, Vega 10, 41.04 Wh | Acer Swift 3 SF314-41-R8HZ R5 3500U, Vega 8, 48 Wh | Lenovo Ideapad S340-14IWL-81N70056GE i7-8565U, GeForce MX230, 52.5 Wh | Huawei MateBook D 14 W00D-53010GXL R5 2500U, Vega 8, 57.4 Wh | Média da turma Multimedia | |
|---|---|---|---|---|---|---|---|
| Duração da bateria | -8% | -18% | 28% | 16% | 27% | 65% | |
| Reader / Idle (h) | 13.8 | 11.8 -14% | 23.2 68% | 19 38% | 25.2 ? 83% | ||
| H.264 (h) | 8.6 | 6.9 -20% | 16.2 ? 88% | ||||
| WiFi v1.3 (h) | 6.5 | 6 -8% | 7.2 11% | 8.3 28% | 6 -8% | 9 38% | 12 ? 85% |
| Load (h) | 1.6 | 0.8 -50% | 1.4 -13% | 1.7 6% | 1.669 ? 4% |
Pro
Contra
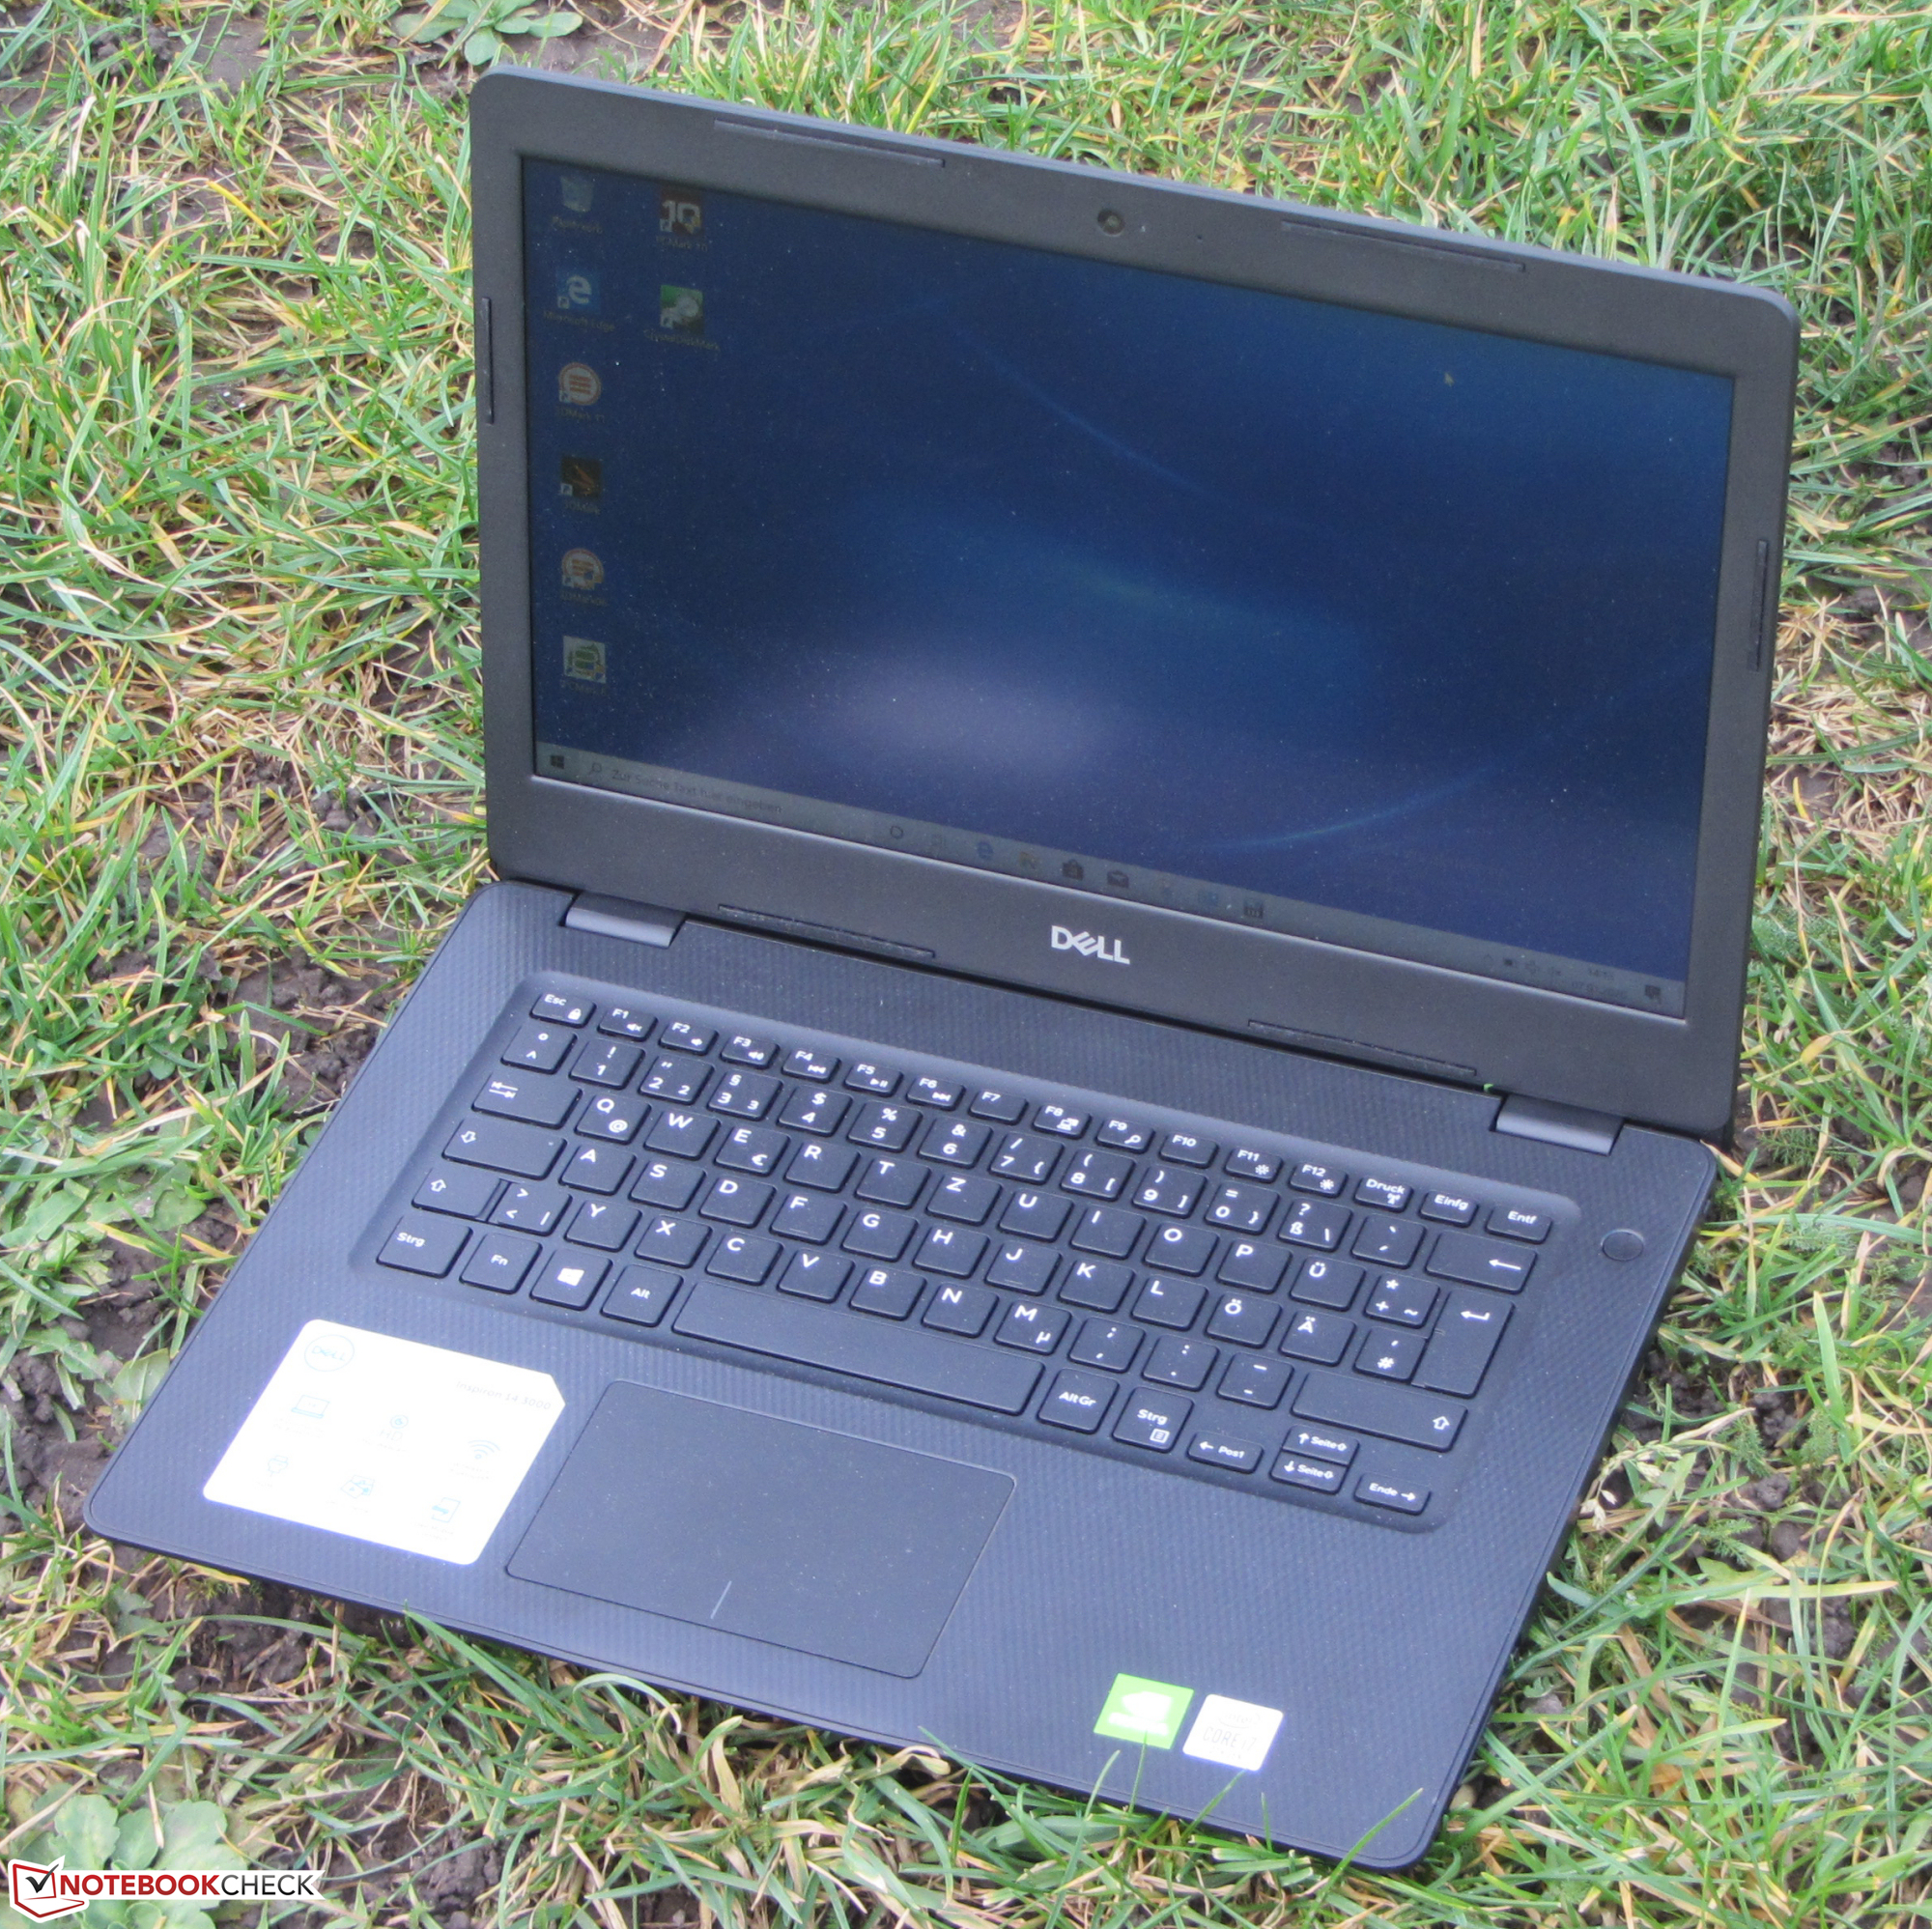
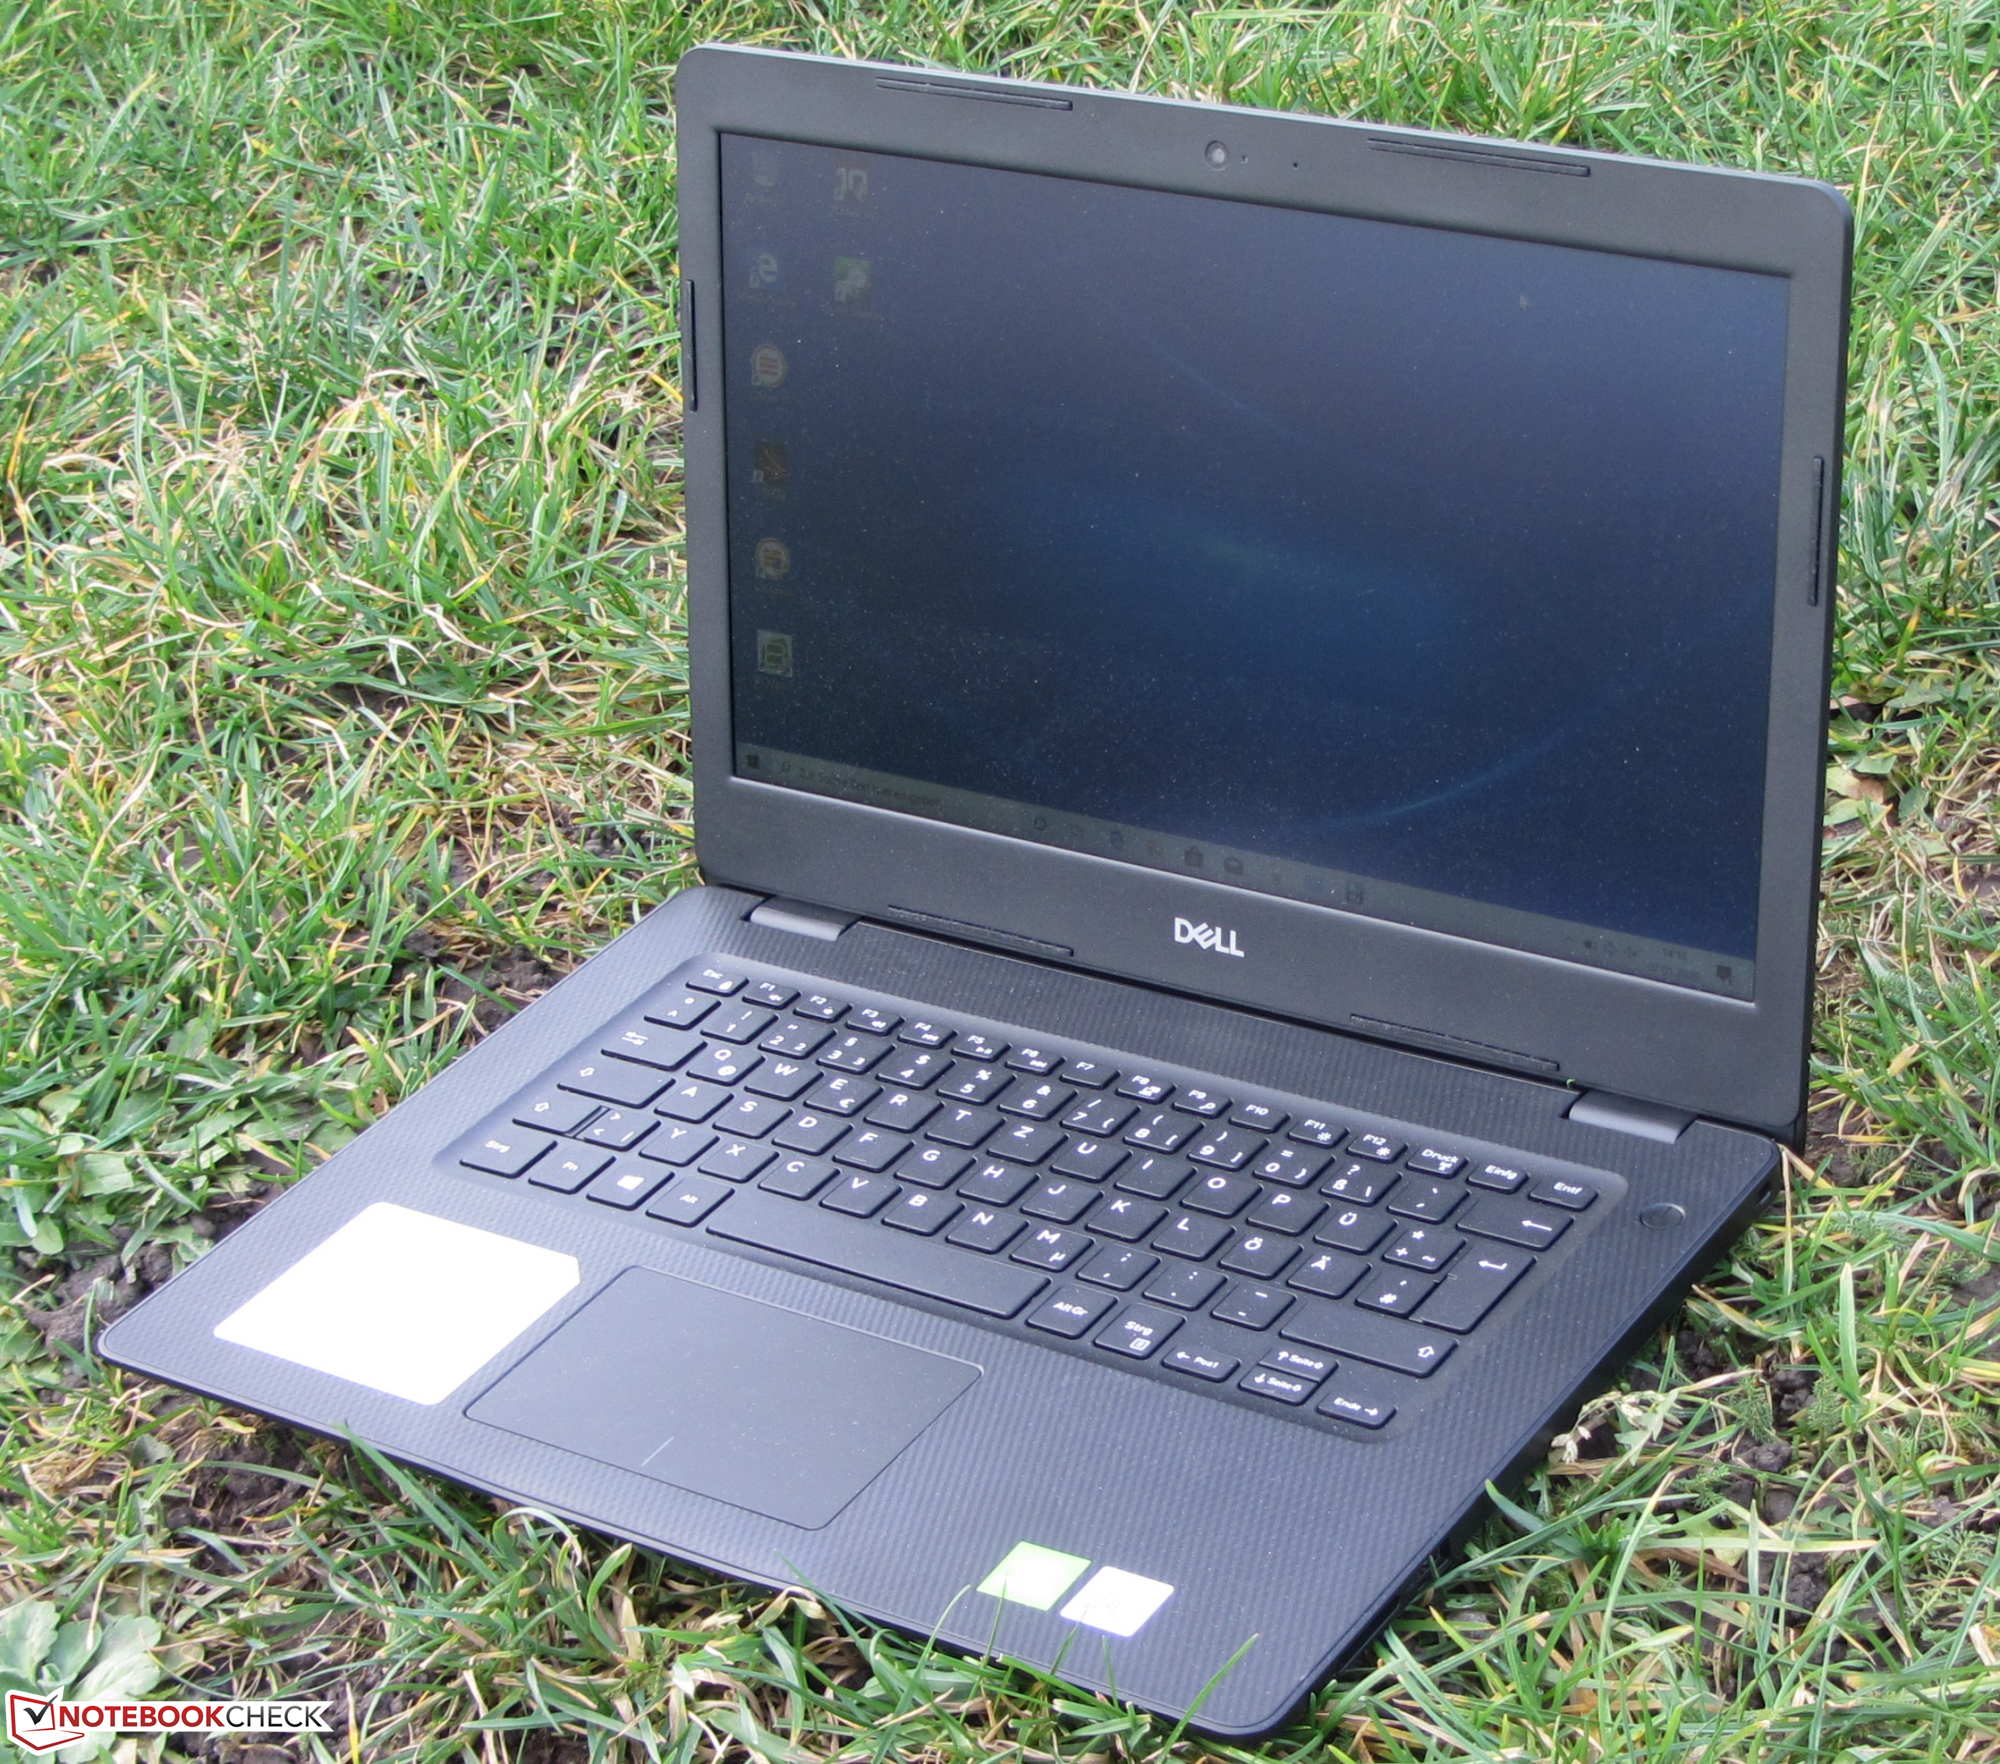
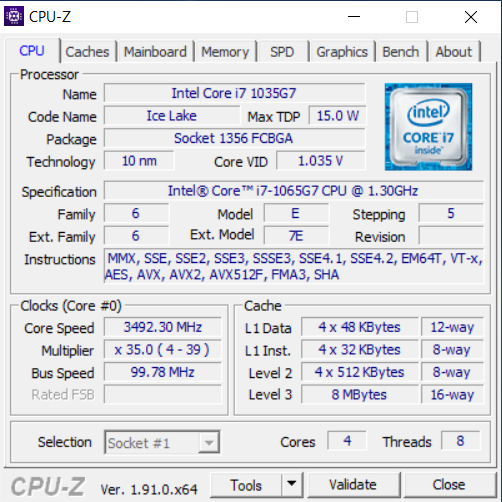
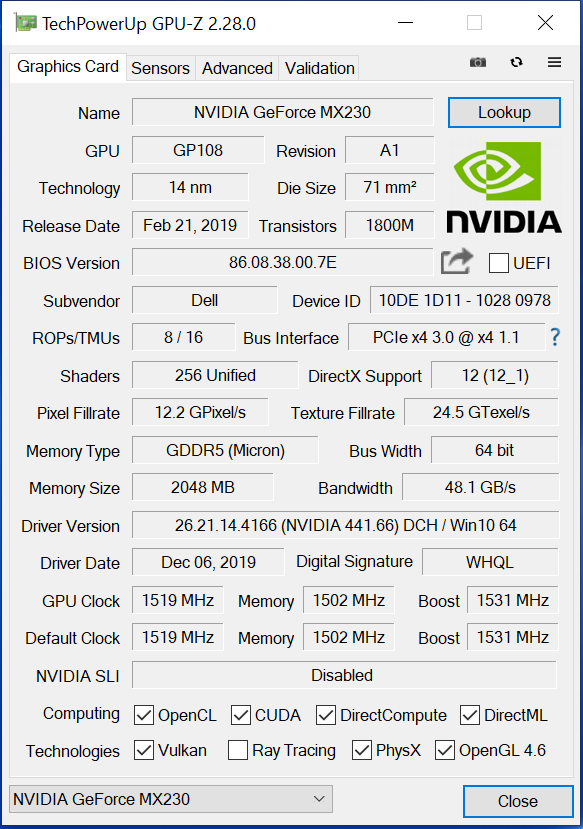
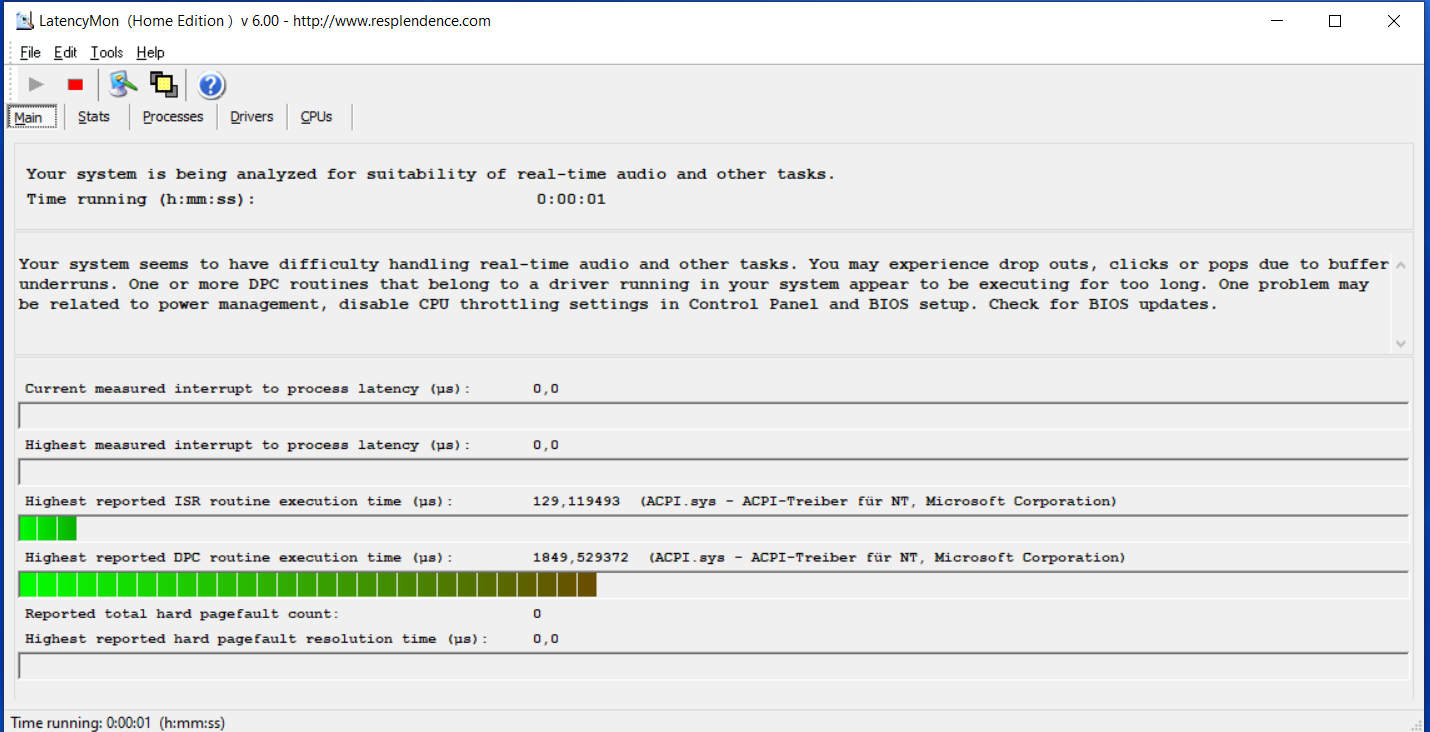
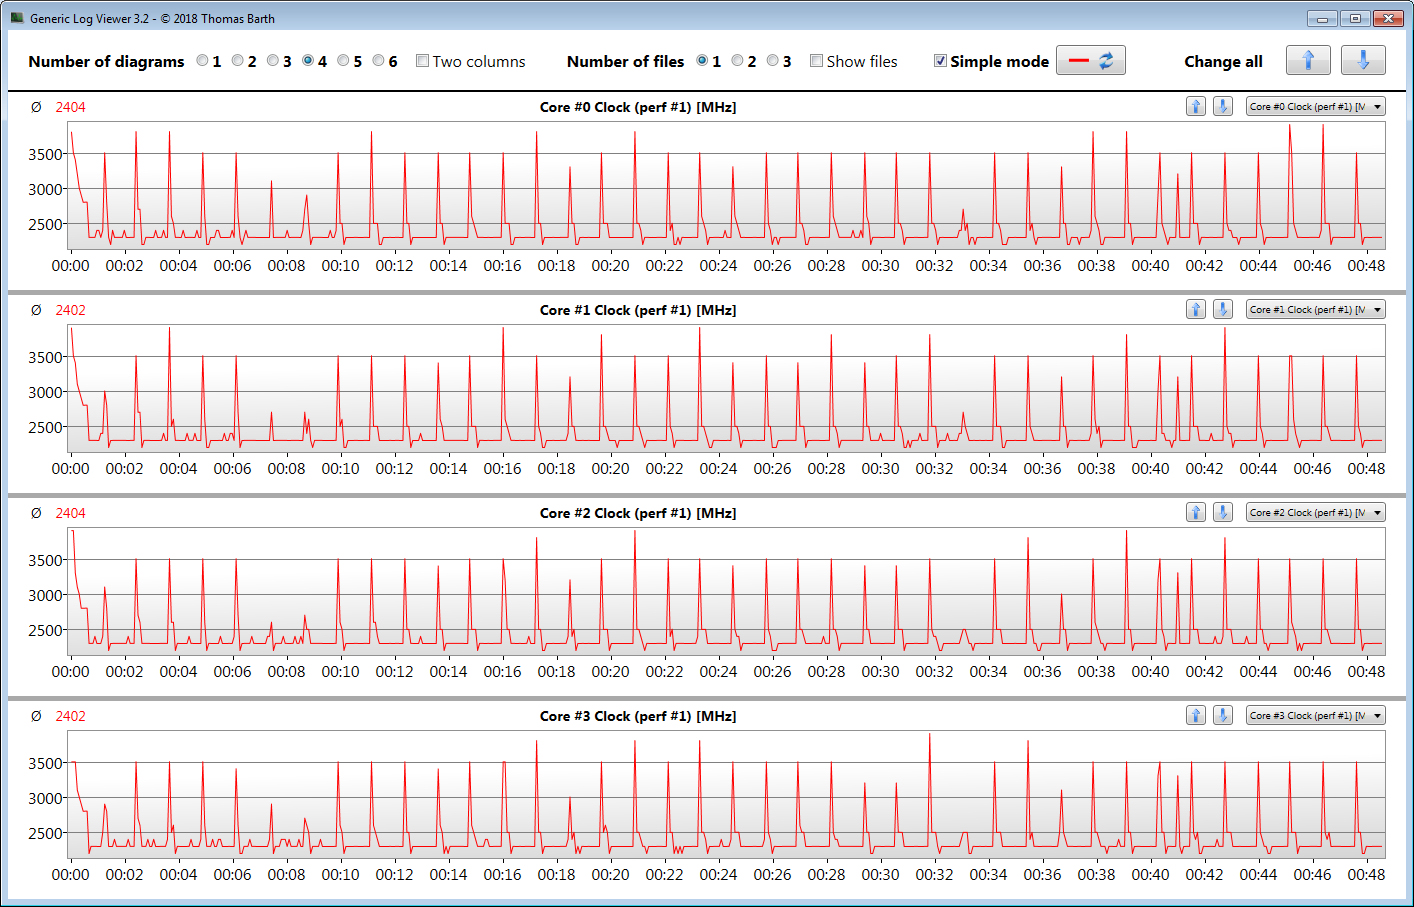
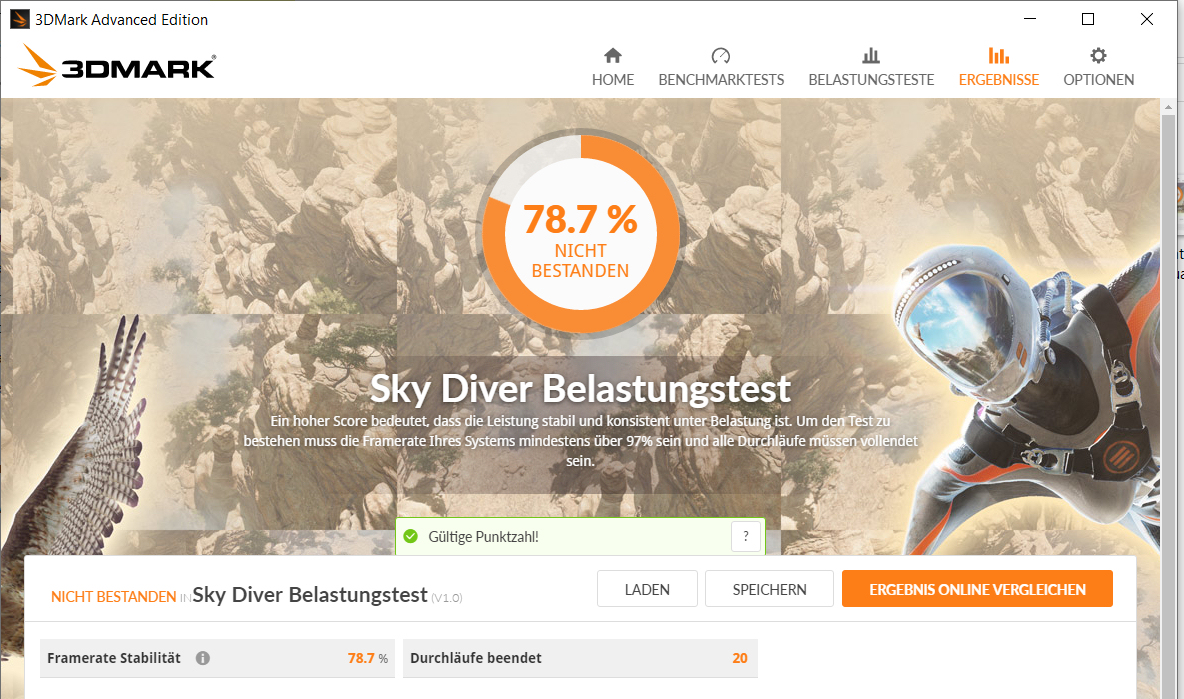
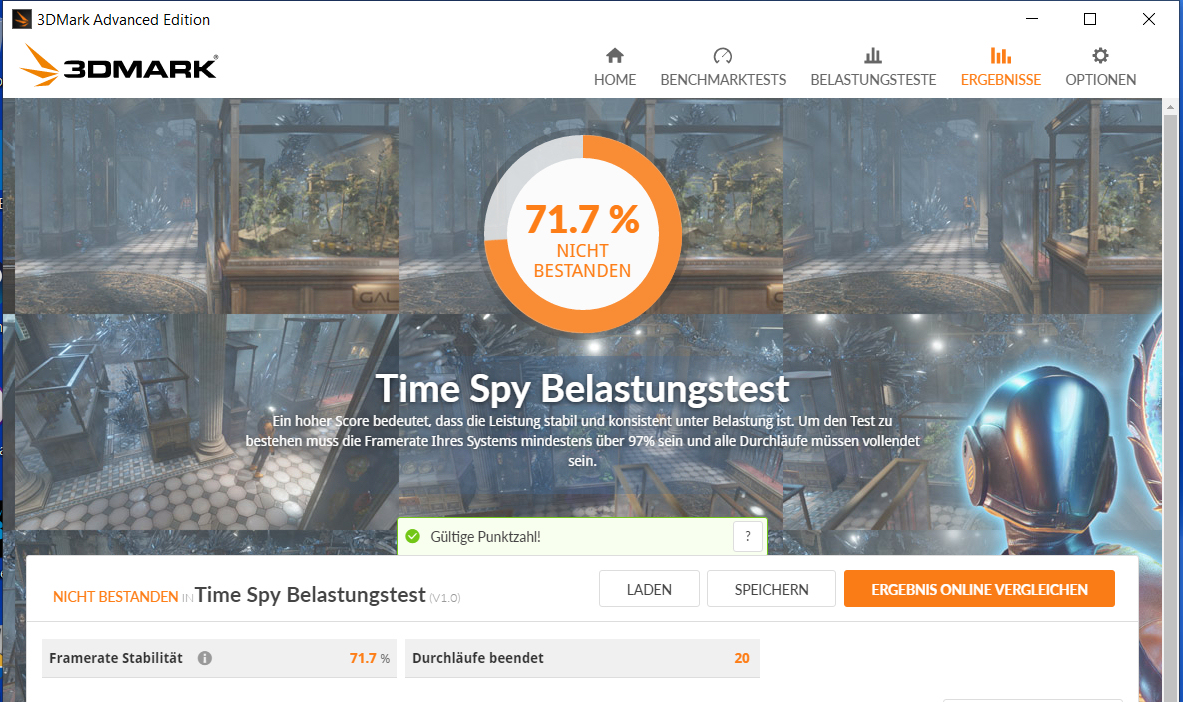
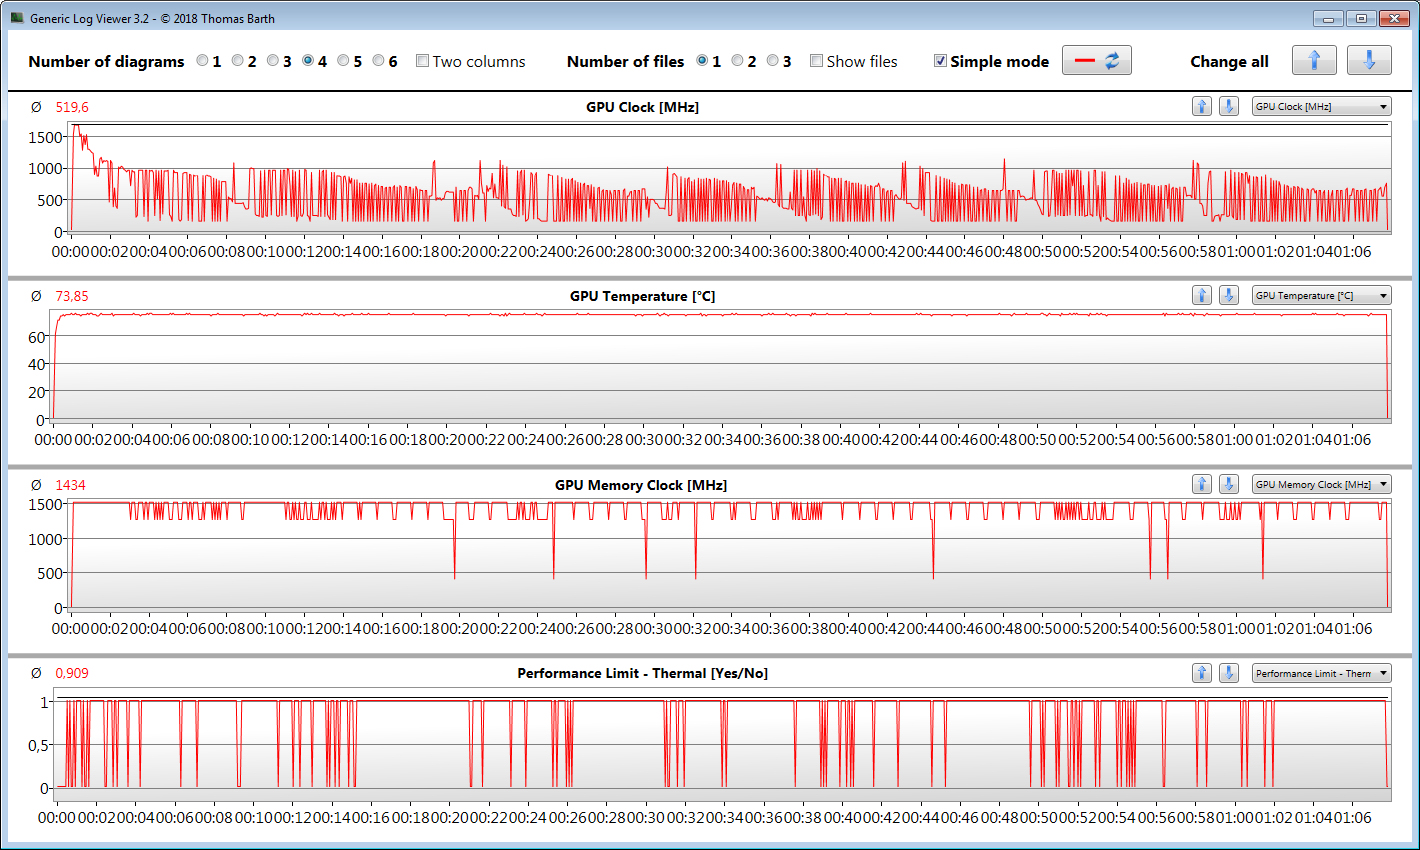
O portátil de 14 polegadas é impulsionado por um processador Core-i7-1065G7 e uma GPU GeForce-MX230. Embora a CPU tenha um bom desempenho e ofereça desempenho suficiente para cargas de trabalho de escritório e navegação na Web, a GPU GeForce decepciona. A velocidade começa a flutuar após um curto período de tempo. Portanto, jogar jogos não é possível. O único caso de uso sensato para a GPU são os aplicativos que exigem apenas brevemente.
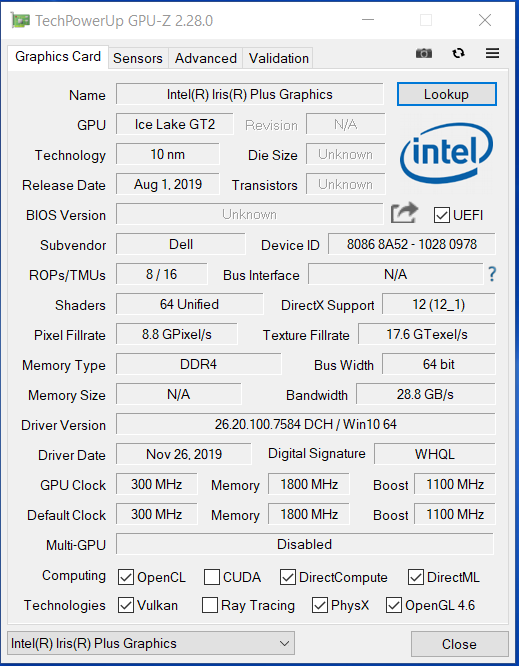
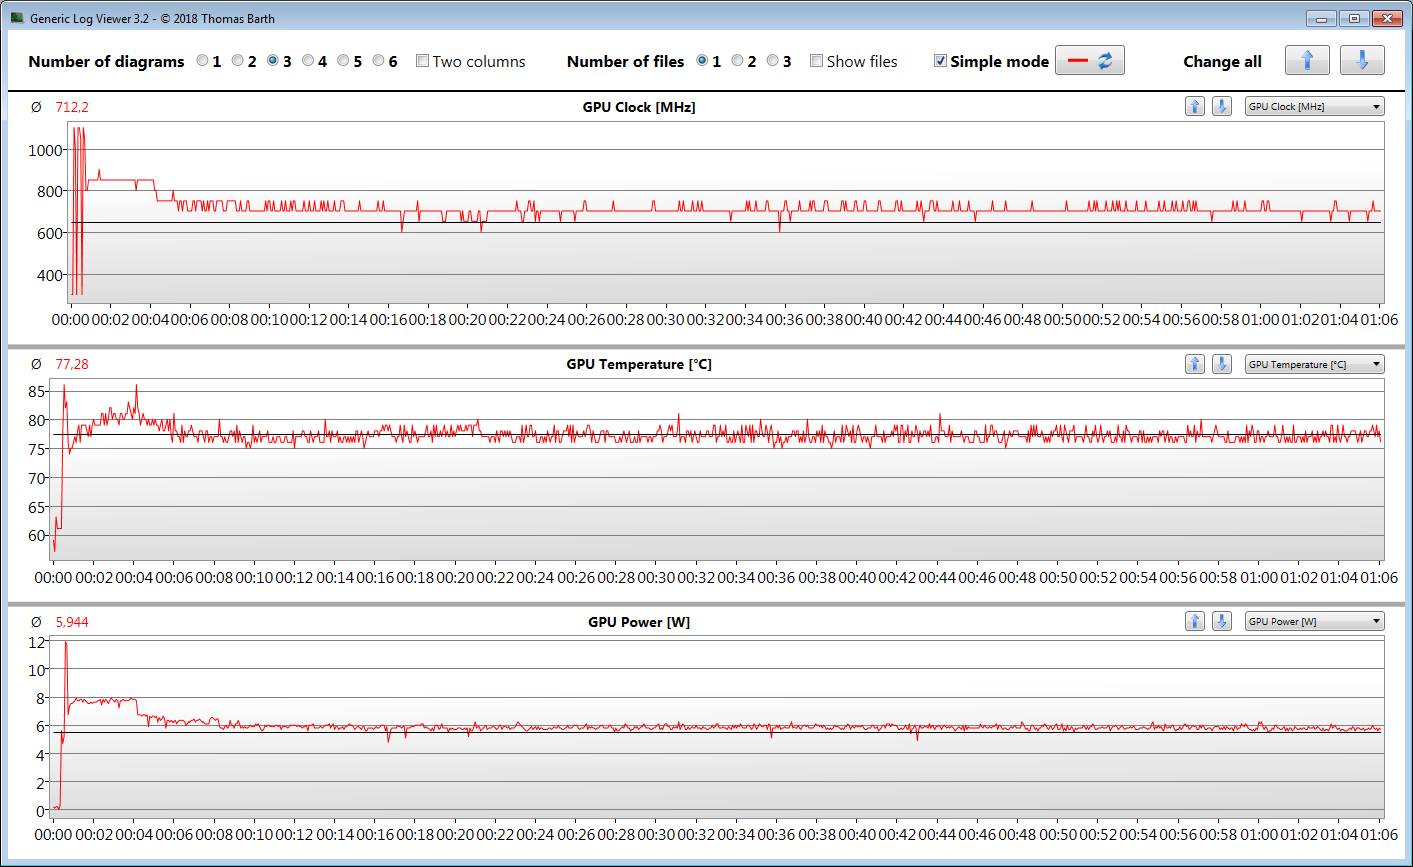
A GPU Iris Plus Graphics G7 integrada não é capaz de aproveitar completamente seus recursos e não funciona na sua velocidade máxima. Dito isto, fornece um nível de desempenho mais consistente, o que torna os jogos, pelo menos, um pouco possíveis. No entanto, isso requer um segundo módulo de RAM para poder se beneficiar do modo de canal duplo. Caso contrário, as taxas de quadros não proporcionam uma experiência de jogo agradável.
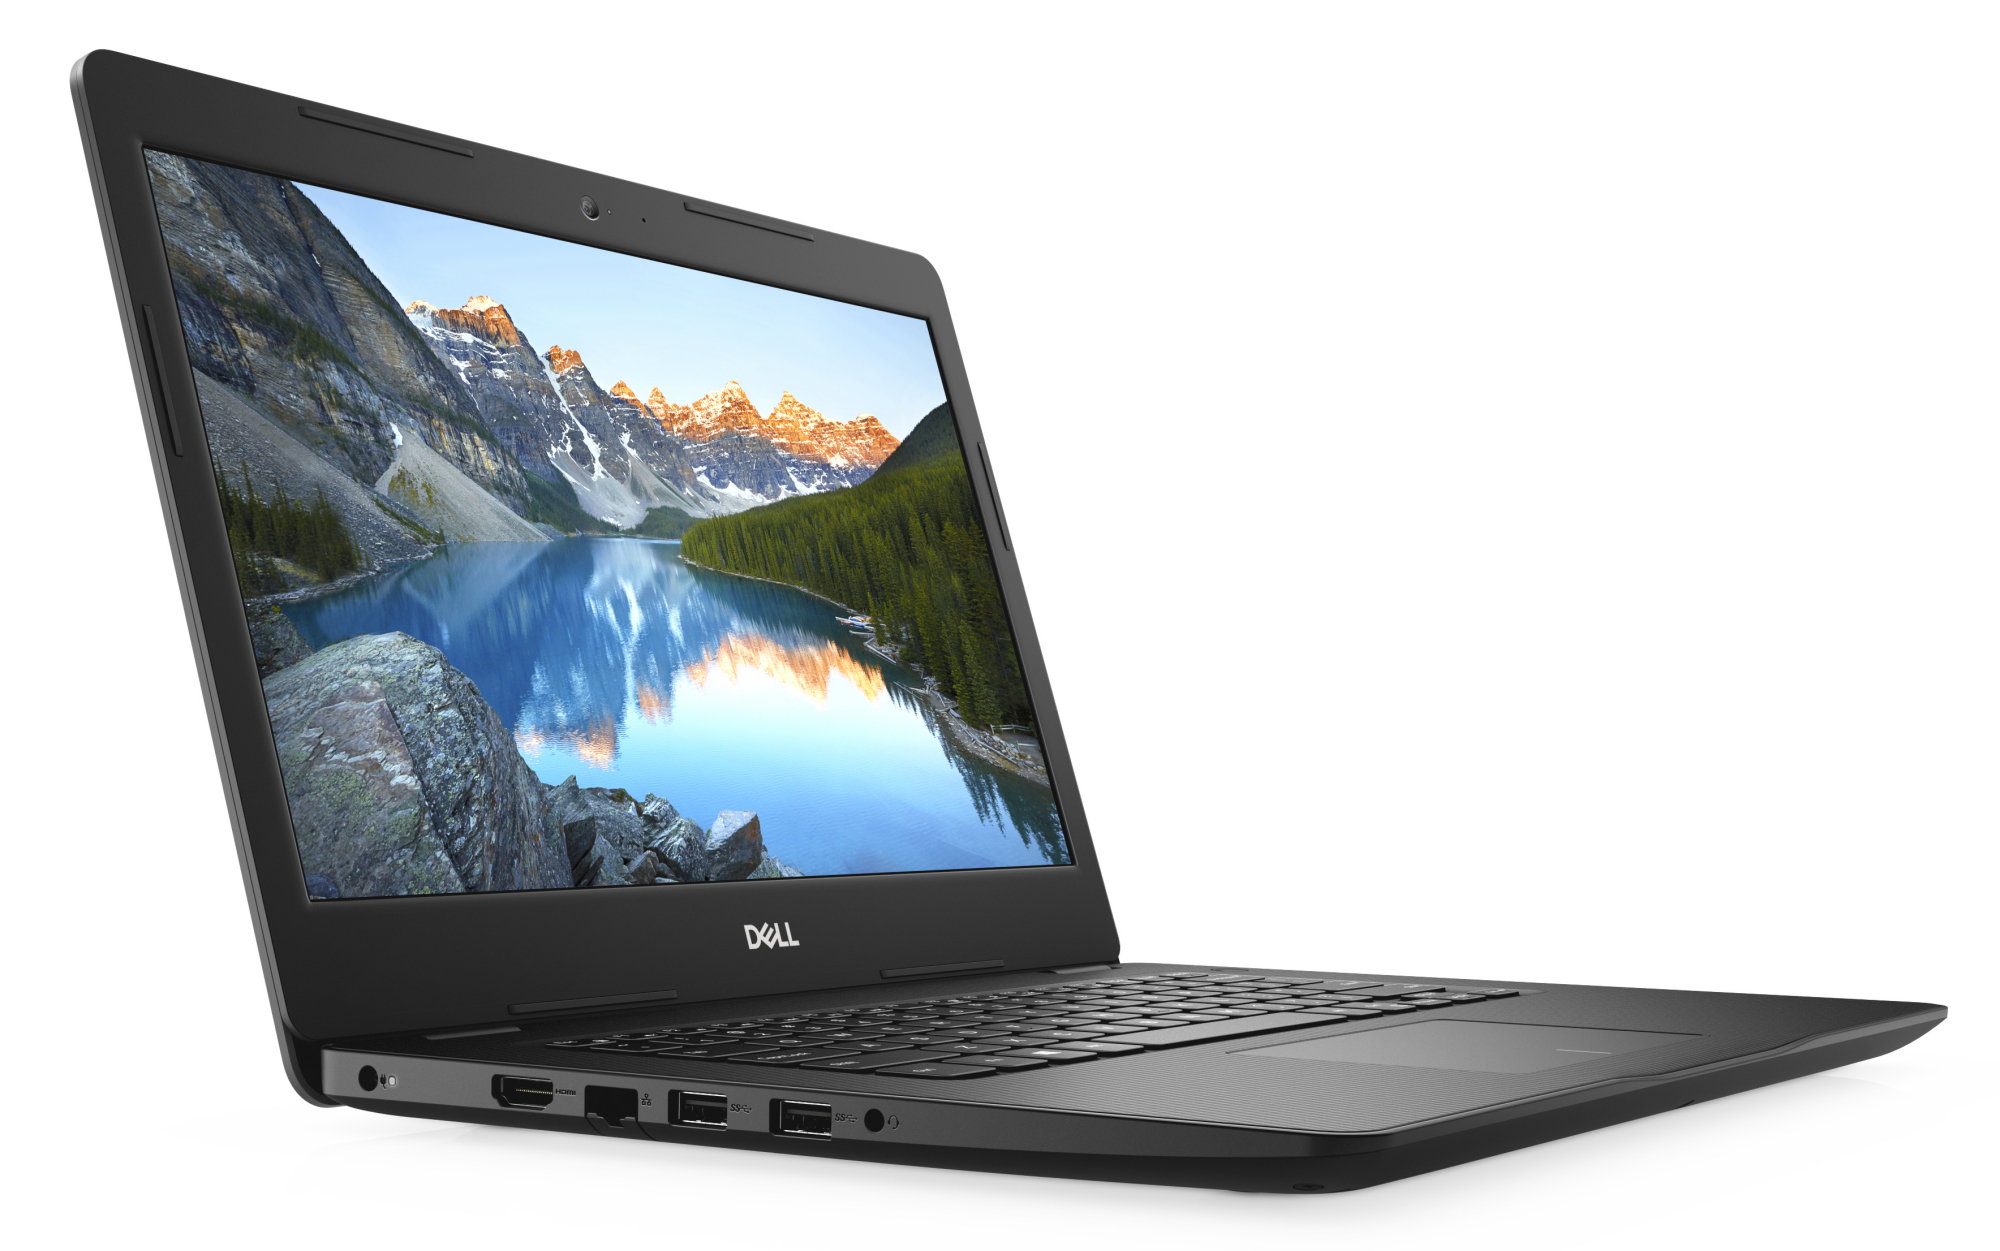
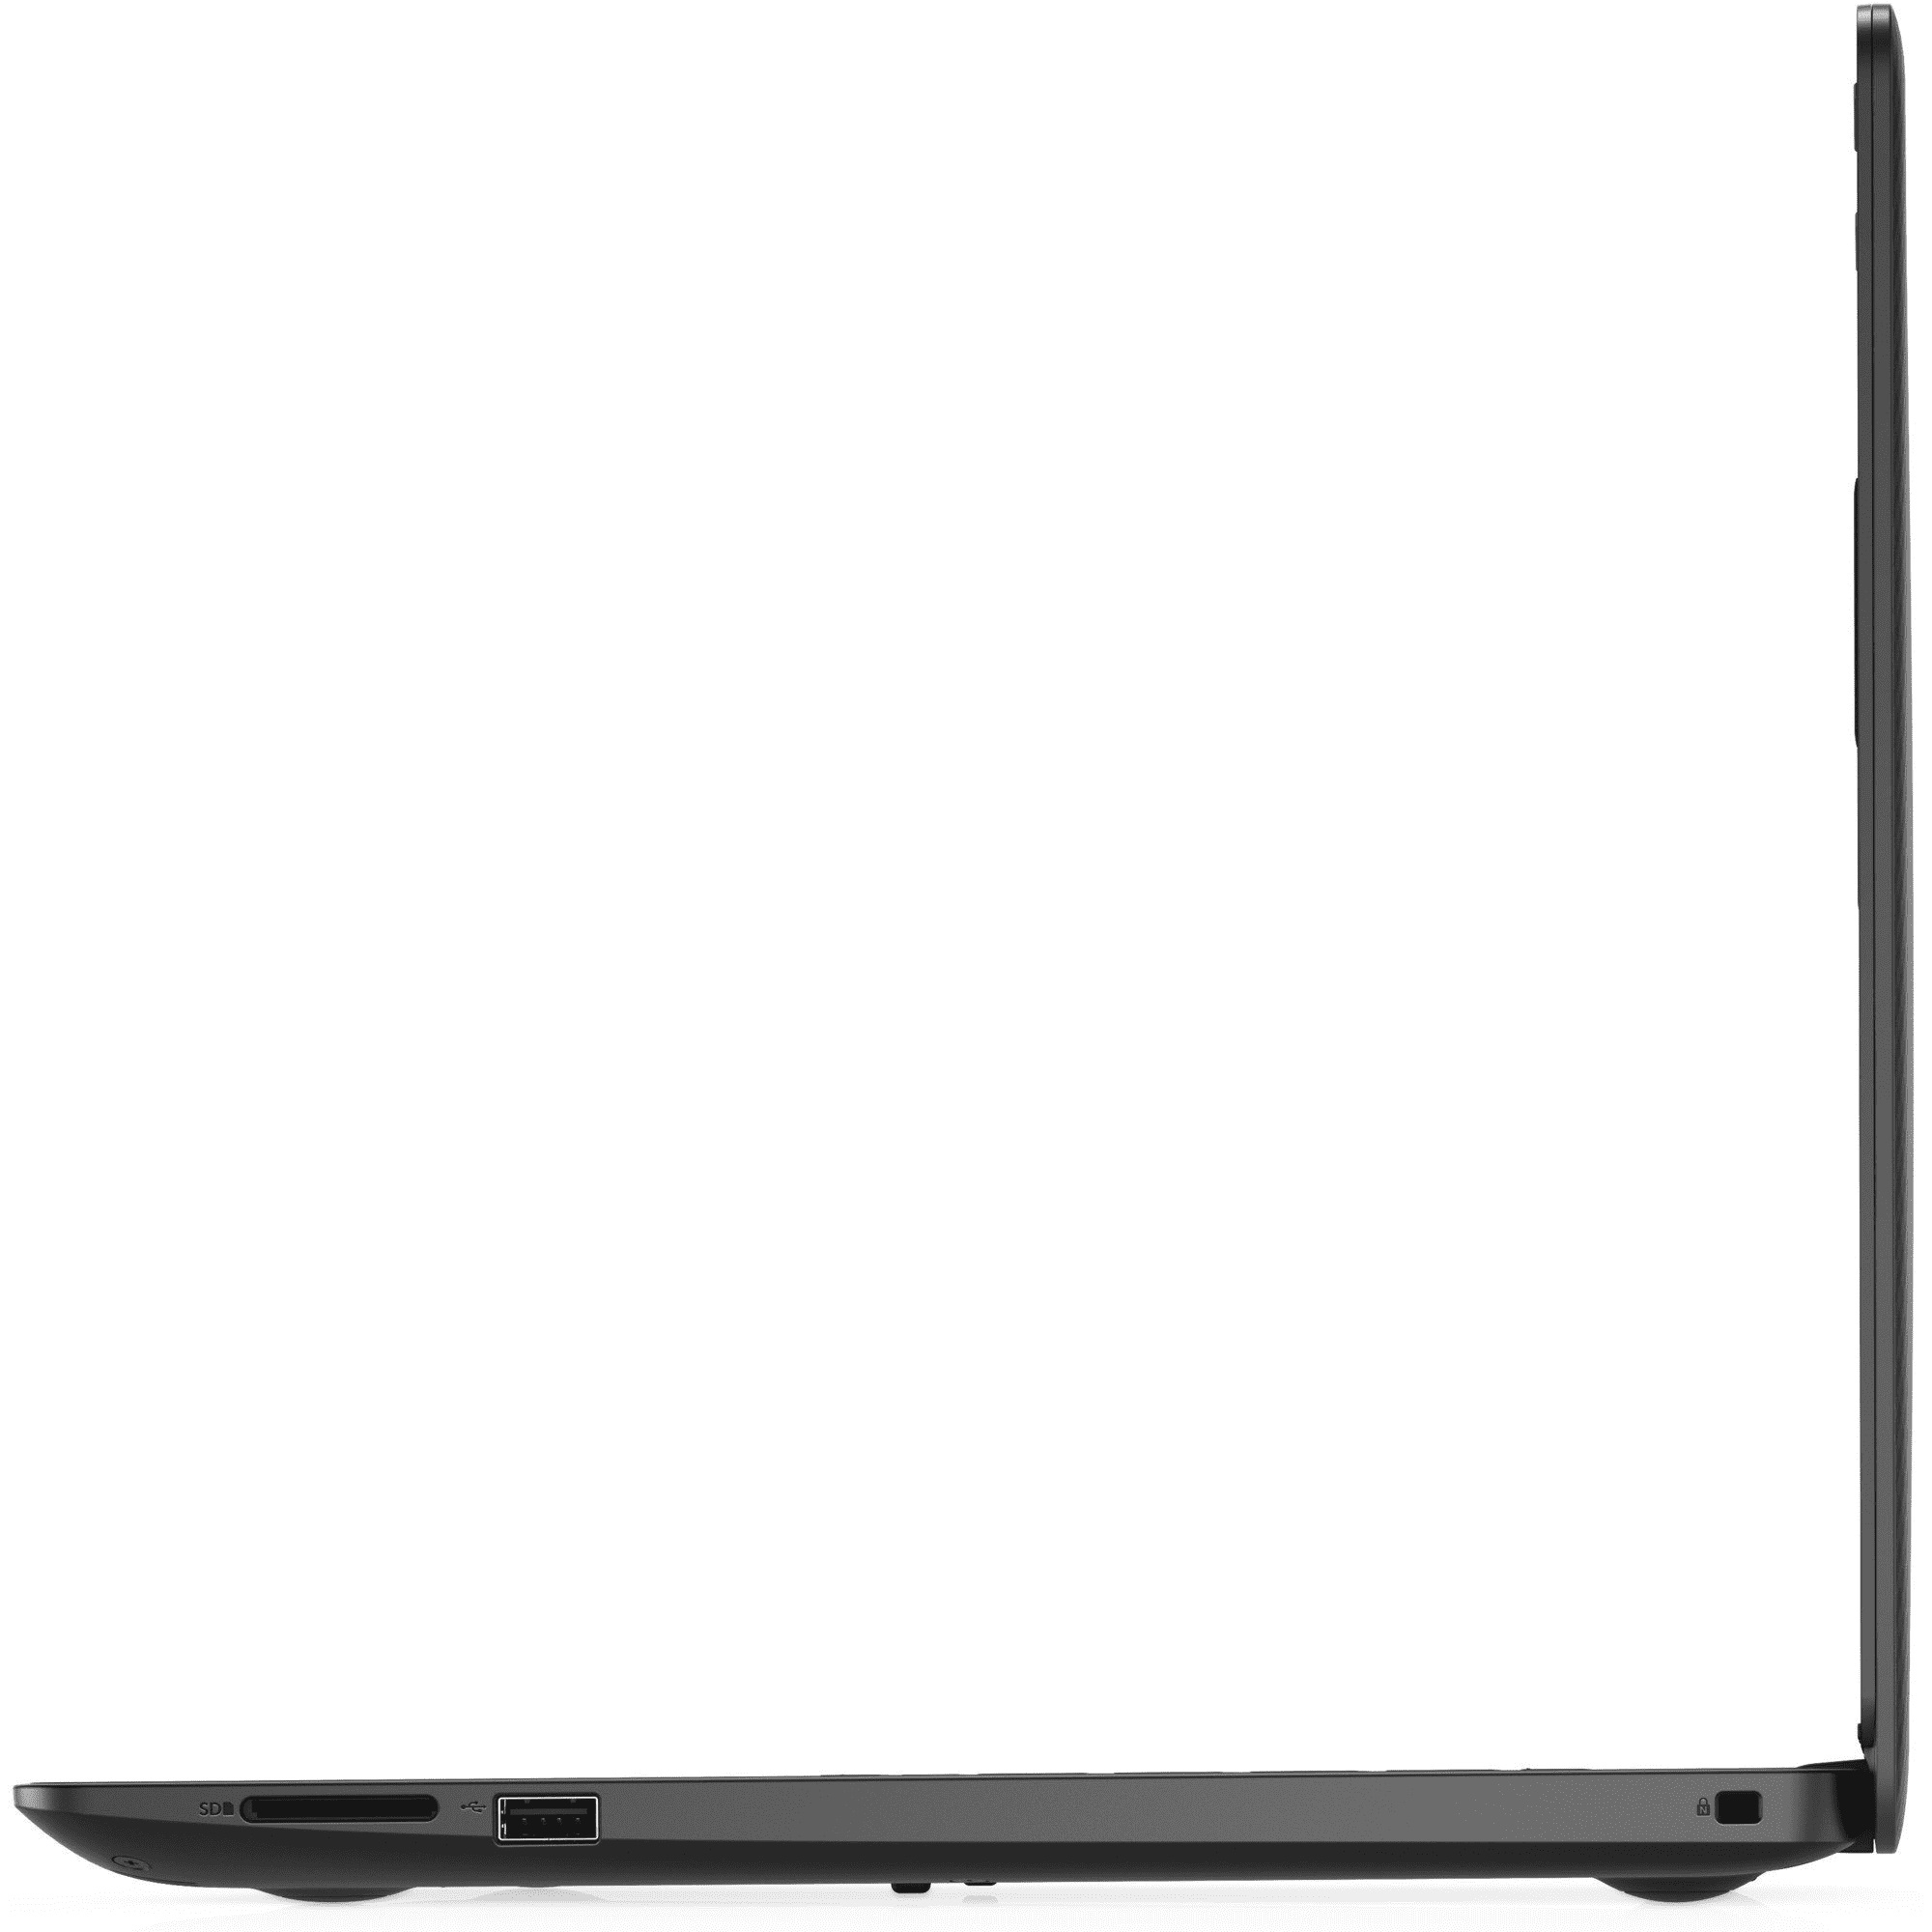
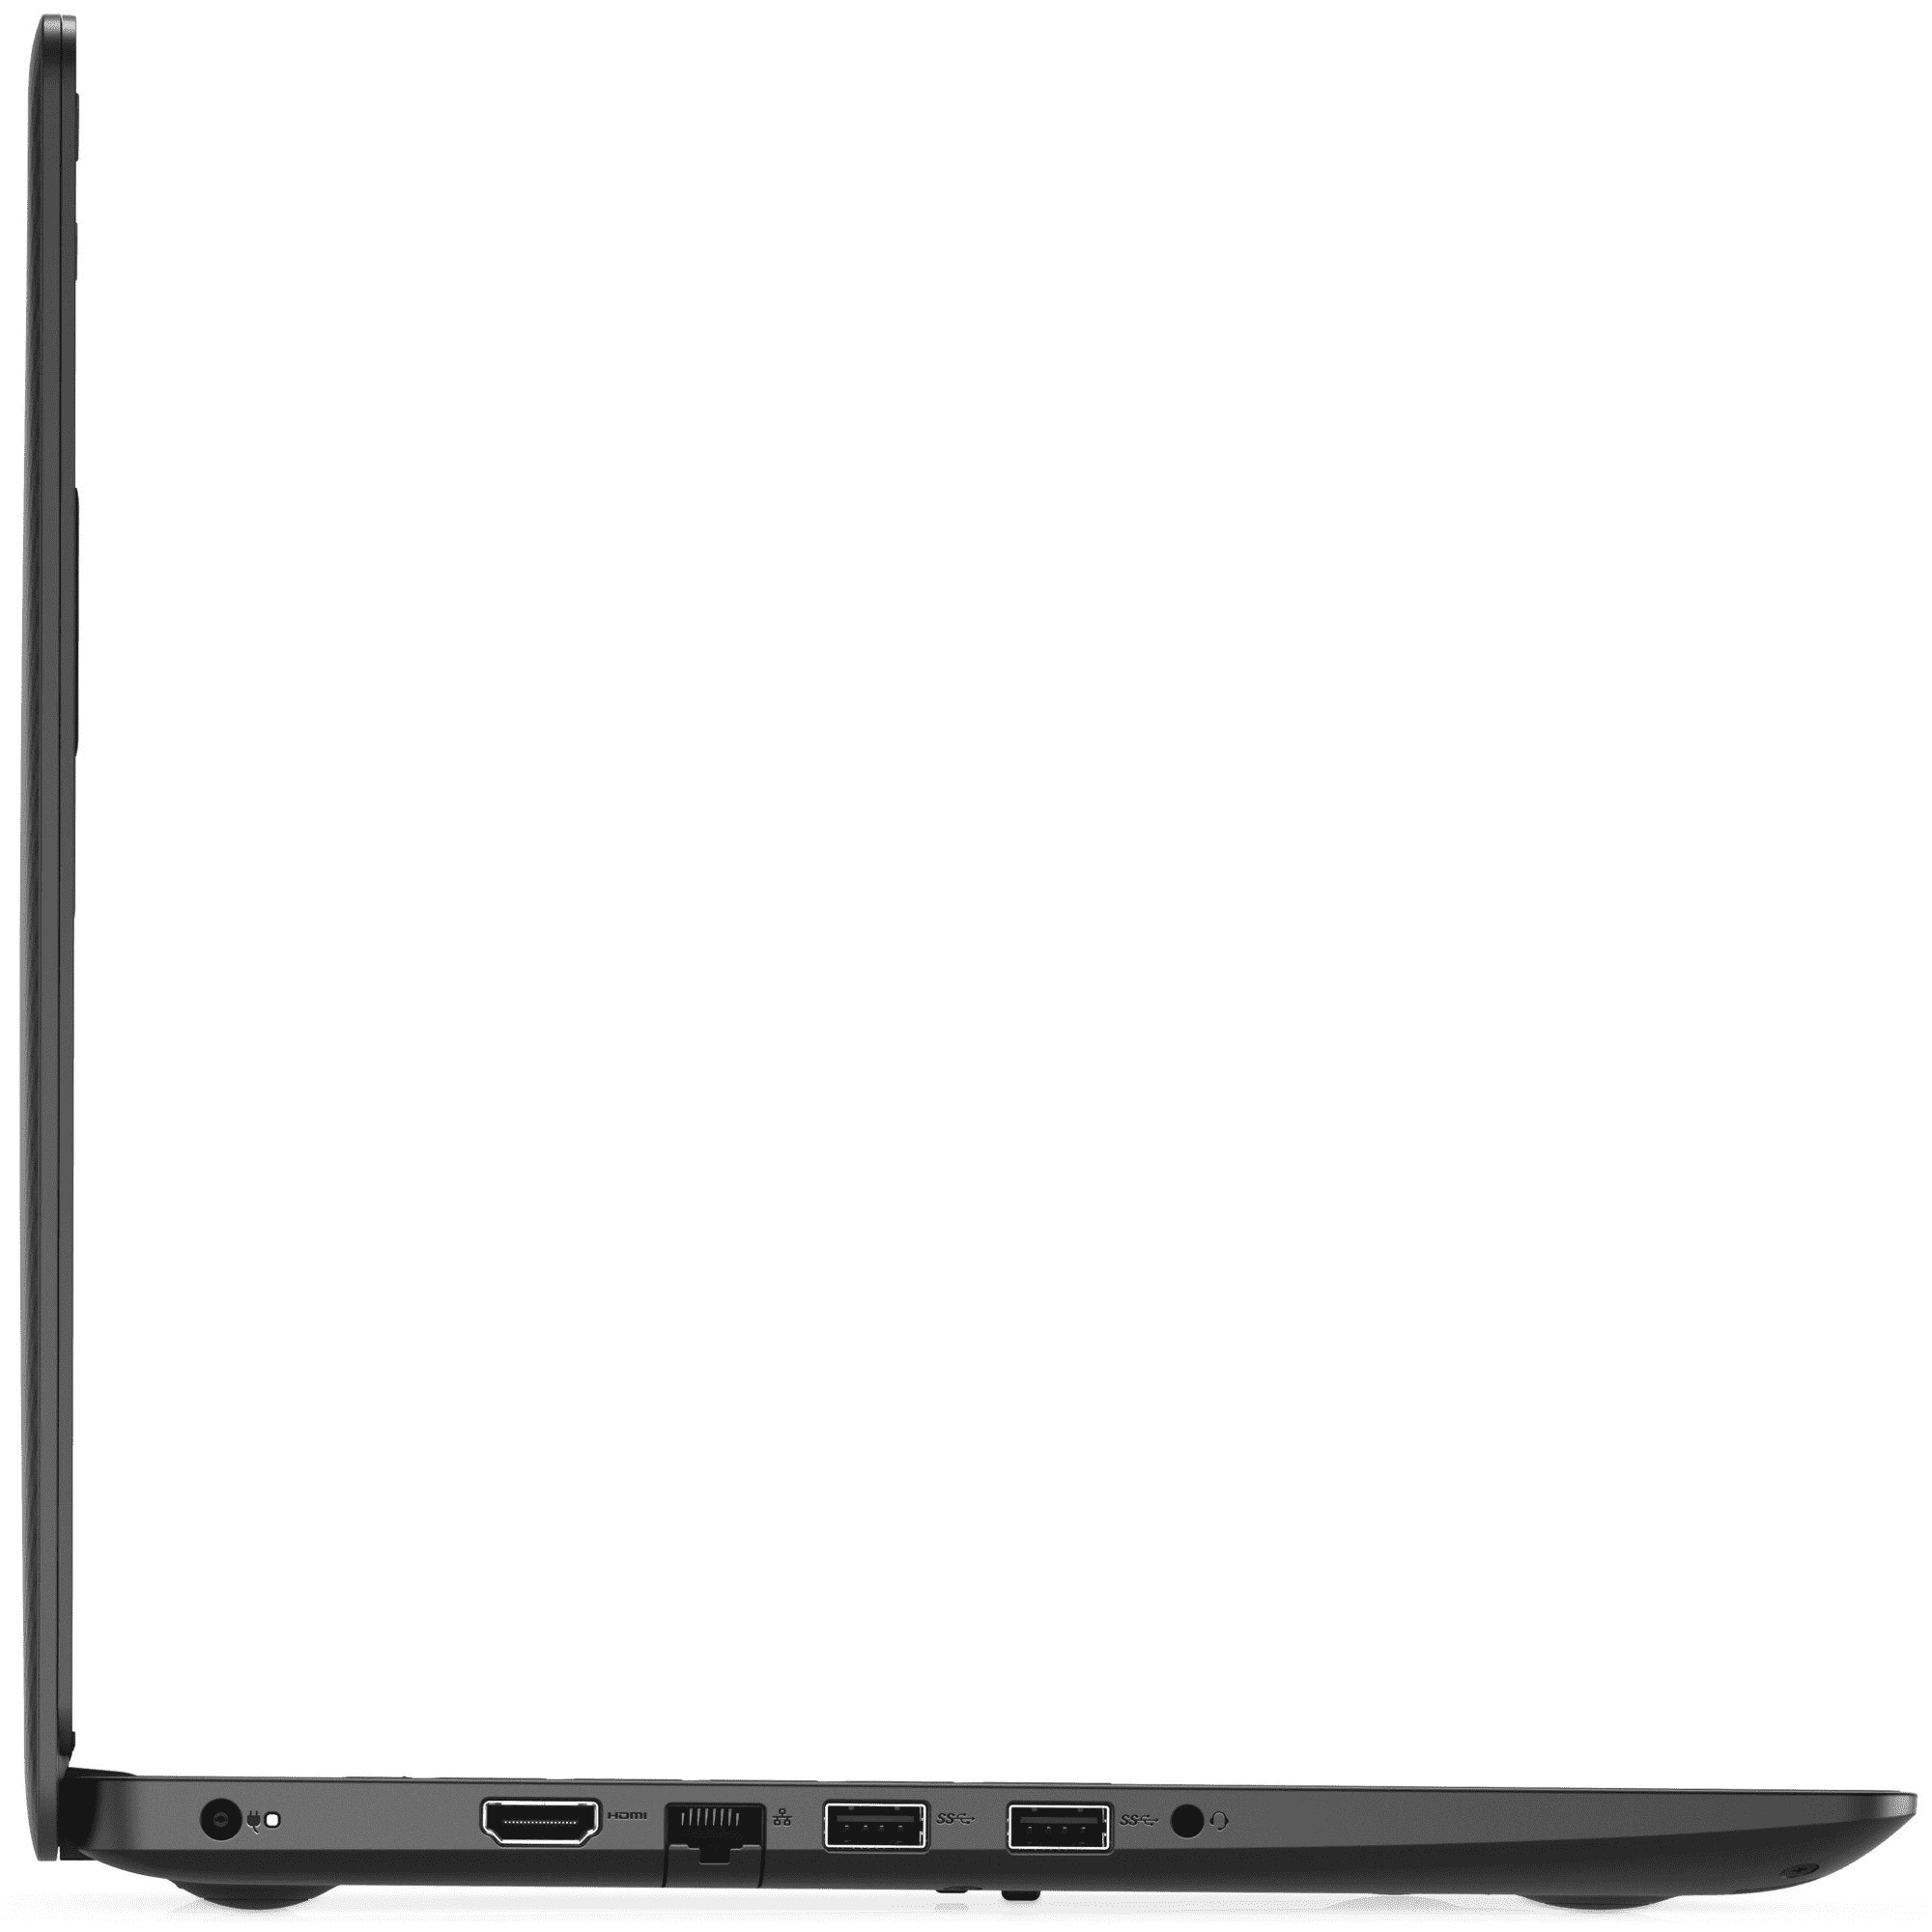
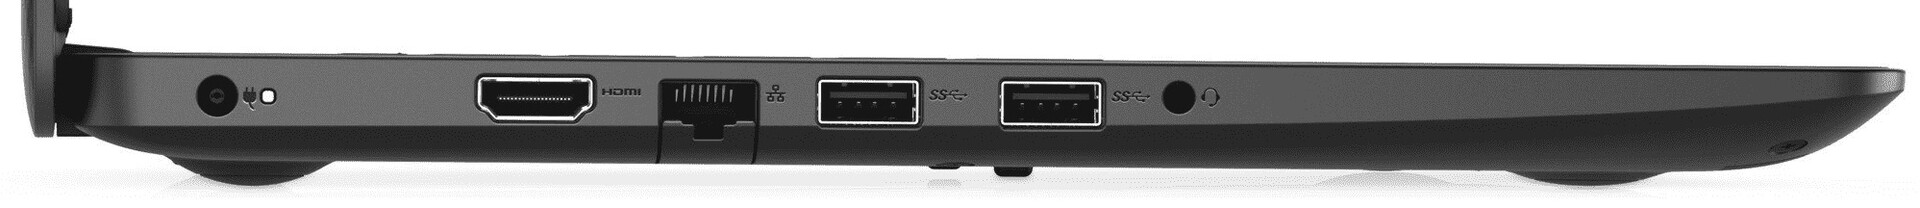
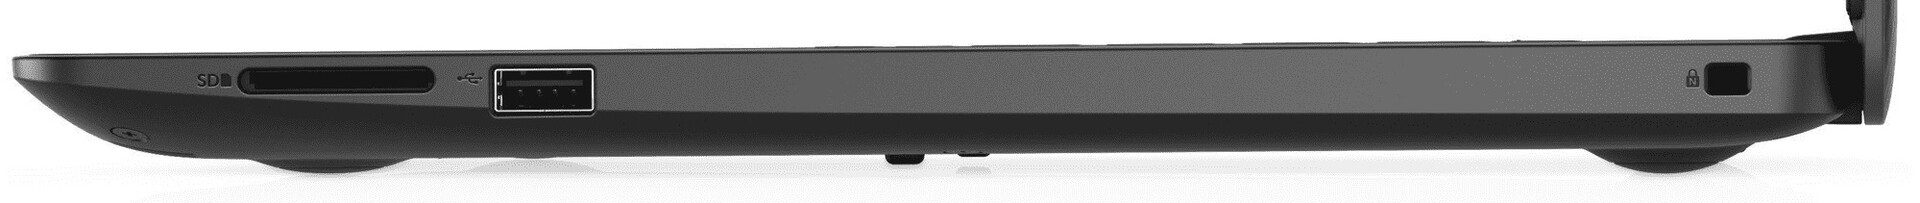
O Inspiron 14 3494 não atrai muitos compradores em potencial com bons argumentos para uma compra. Questões de GPU à parte, a seleção de portas é insatisfatória e parcialmente desatualizada.
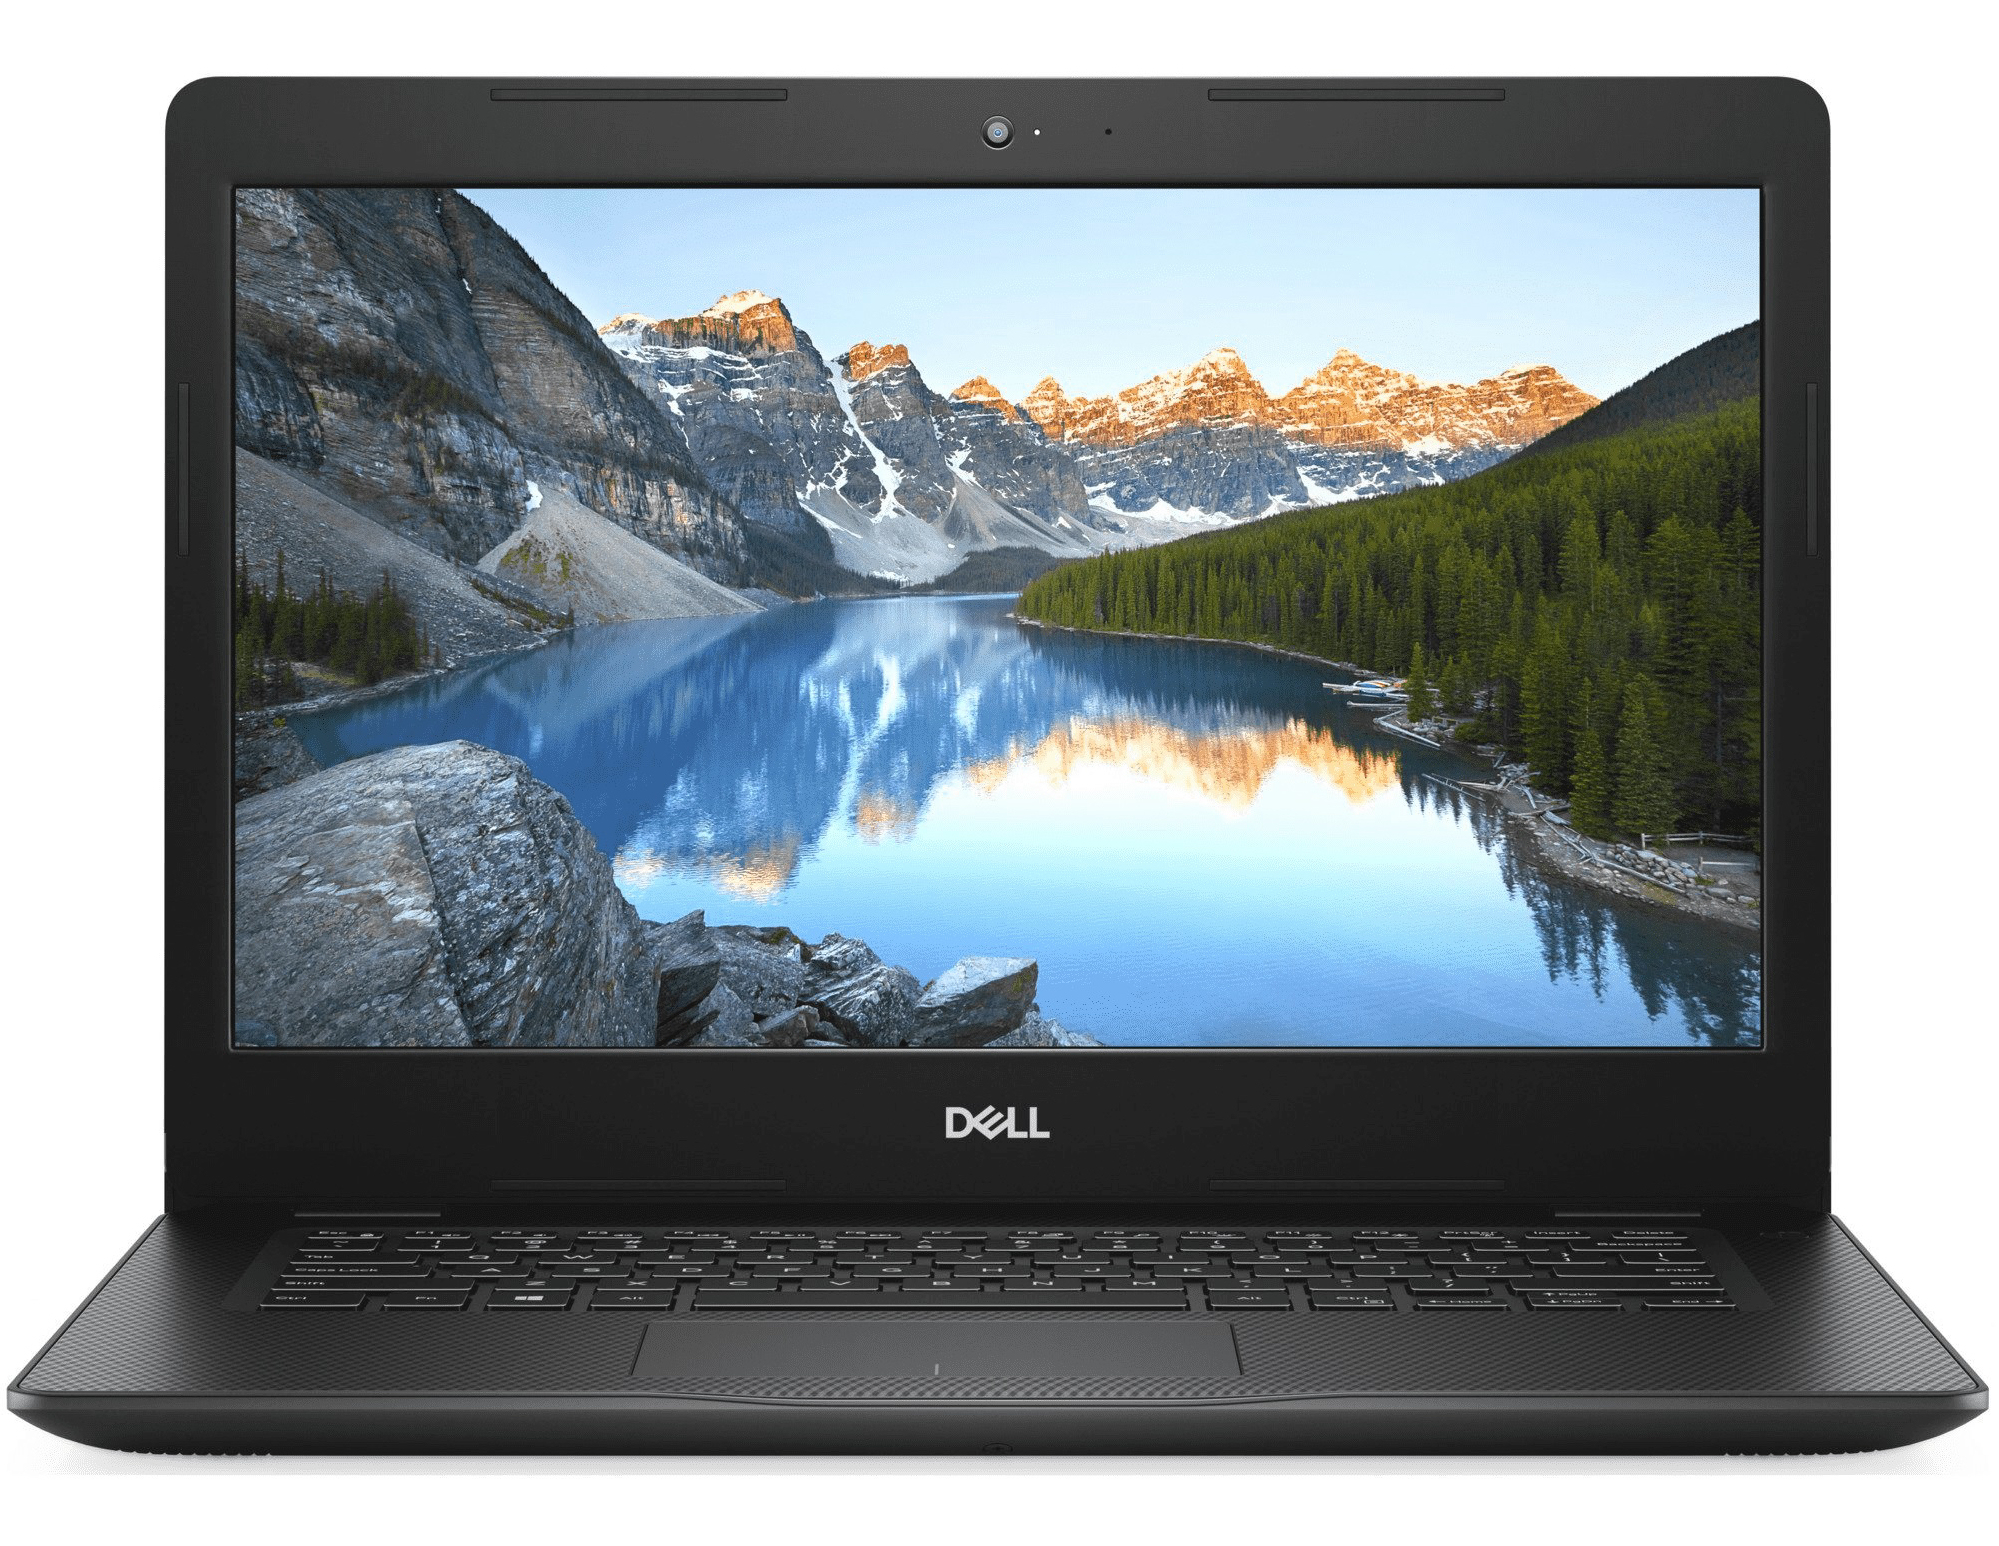
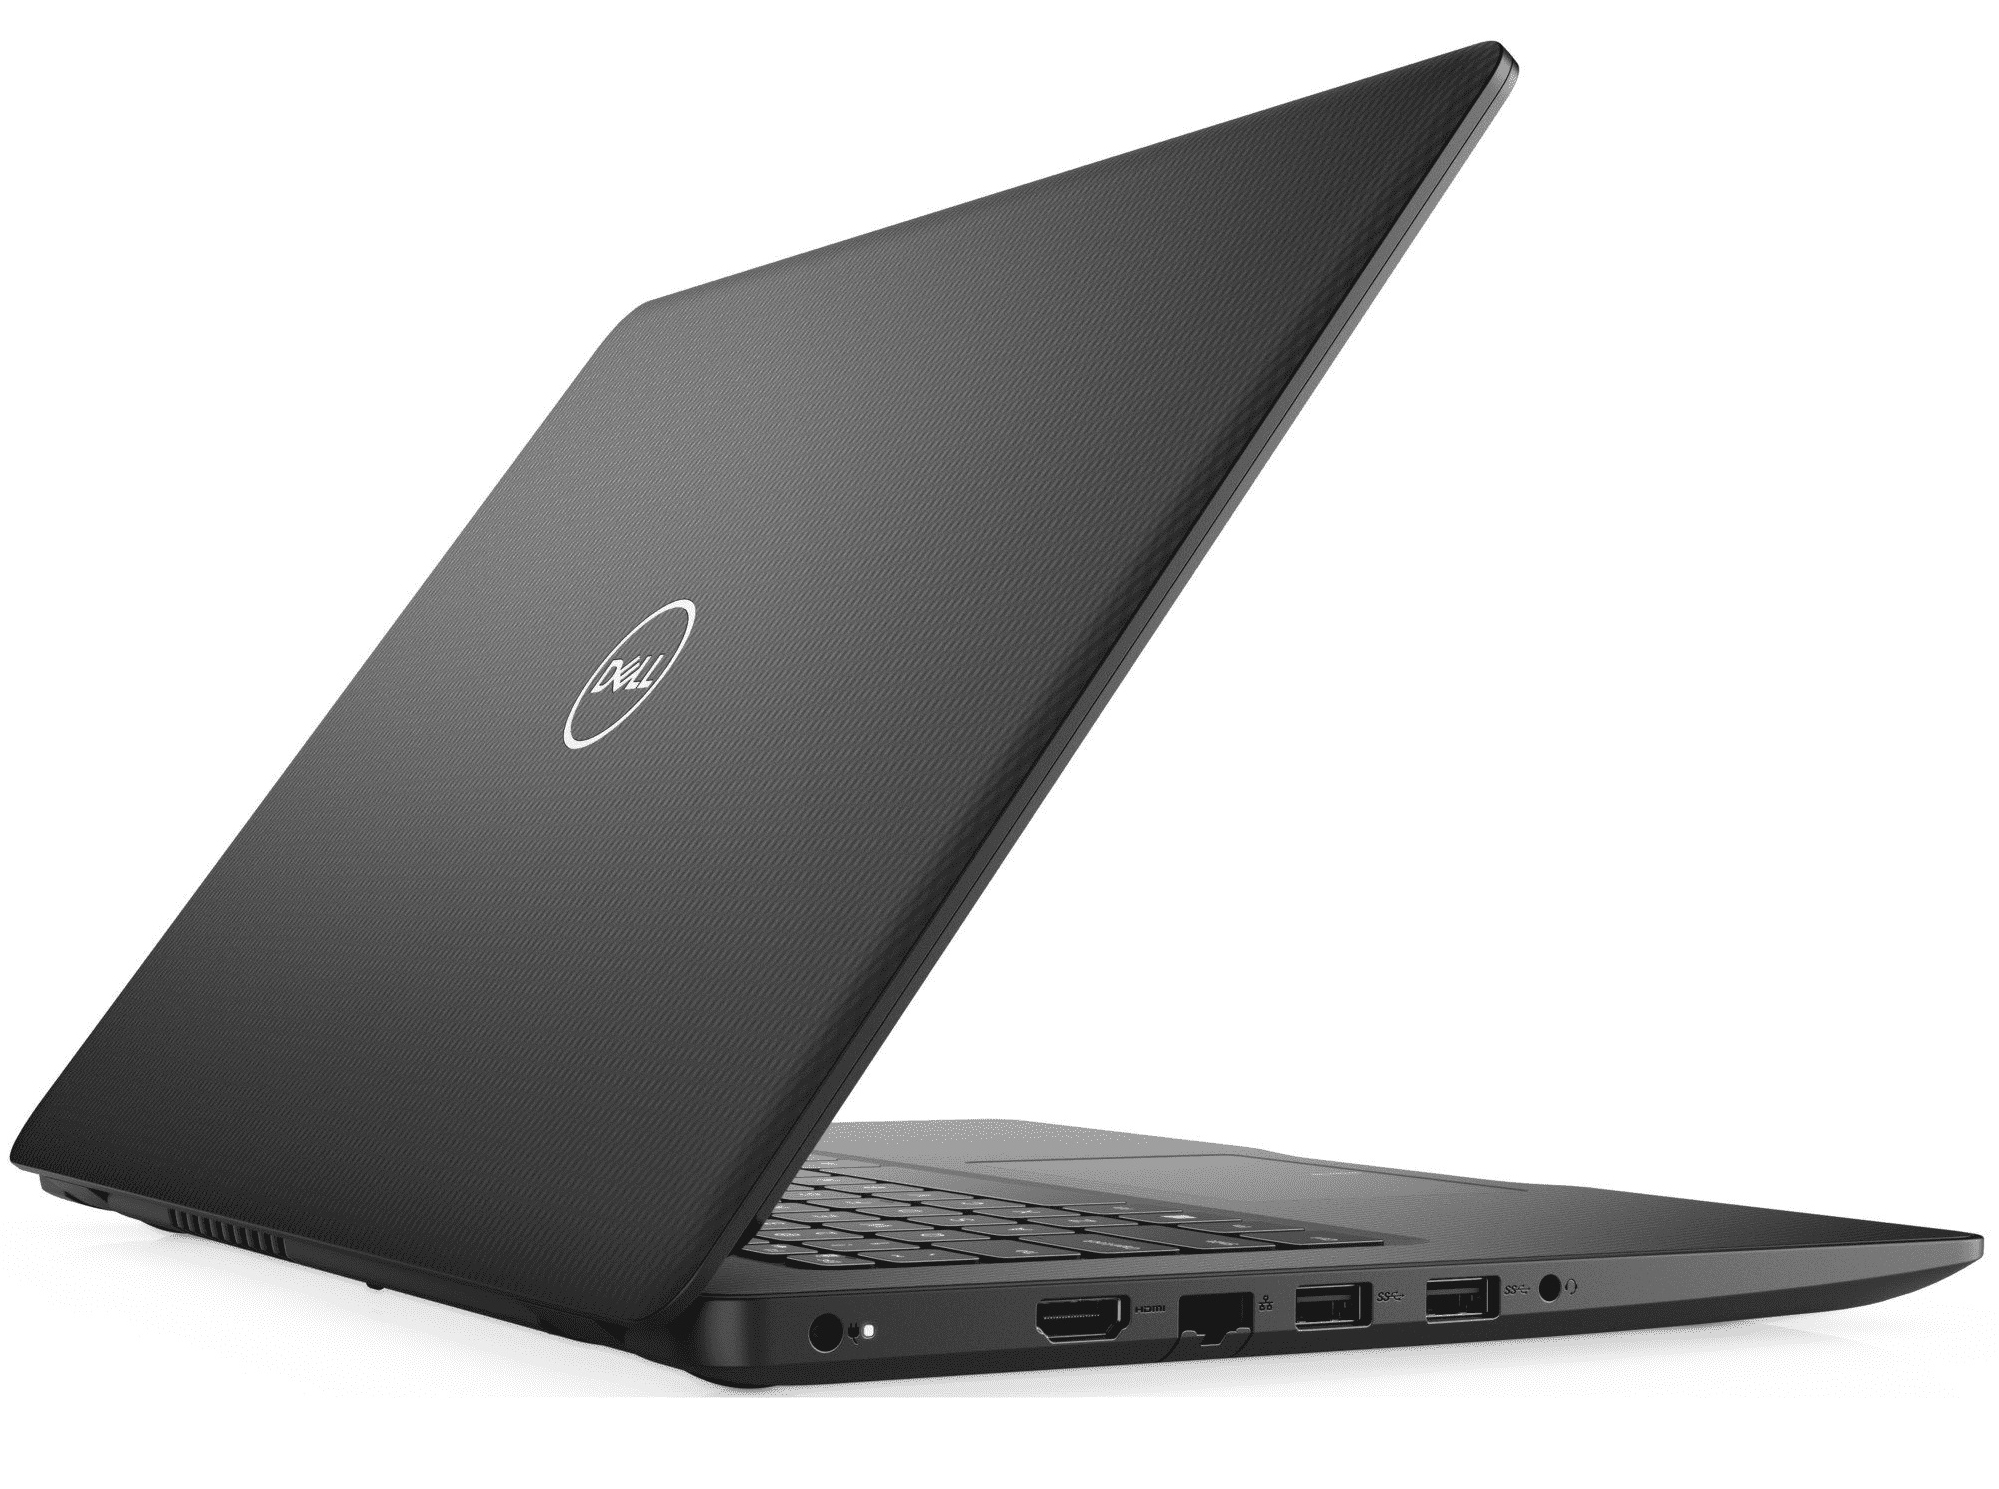
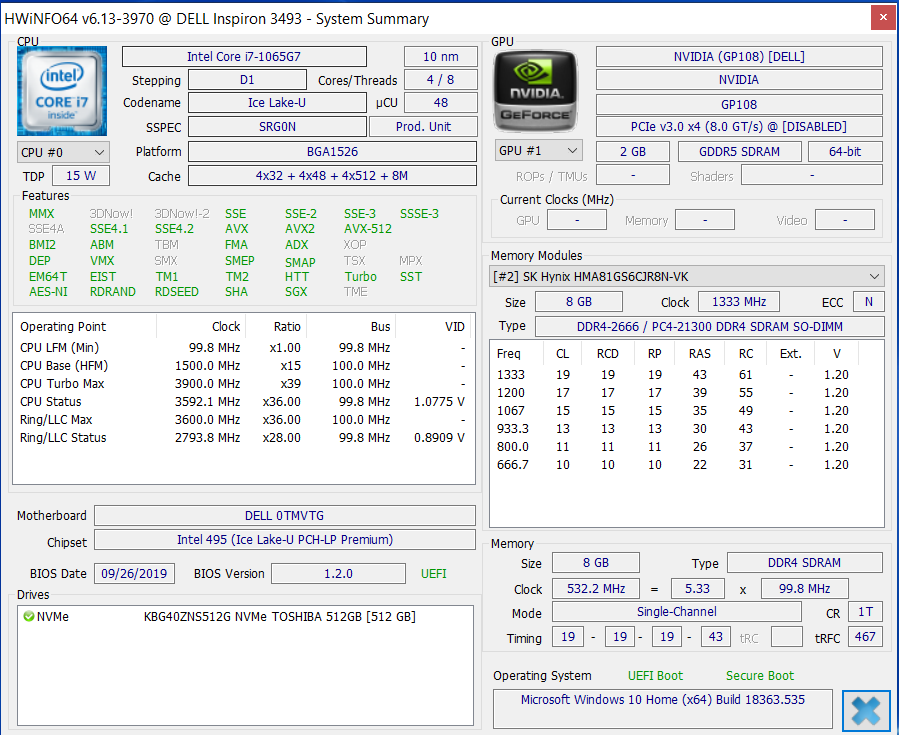
Graças a um SSD NVMe, o sistema é fluente e responsivo. A troca do SSD também é possível. Além disso, o Inspiron pode ser equipado com uma unidade de 2,5 polegadas. O conector SATA necessário e a estrutura de montagem estão disponíveis. Em ambos os casos, é necessário remover a placa inferior. A tela IPS Full HD brilha com uma superfície mate, bons ângulos de visão e uma boa relação de contraste. Por outro lado, o nível de brilho é muito baixo em relação à categoria de preço do dispositivo. A cobertura do espaço de cores também não é algo para se escrever. O teclado sem luz de fundo provou ser adequado para o uso diário. Além disso, a duração da bateria é decente ou inclusive boa. No entanto, a seleção de portas é apenas média. Mais especificamente, o 3493 não possui uma porta USB tipo C e suporta apenas Fast Ethernet.
Dell Inspiron 14 3493-4KWCF
- 01/13/2020 v7 (old)
Sascha Mölck
Price comparison
