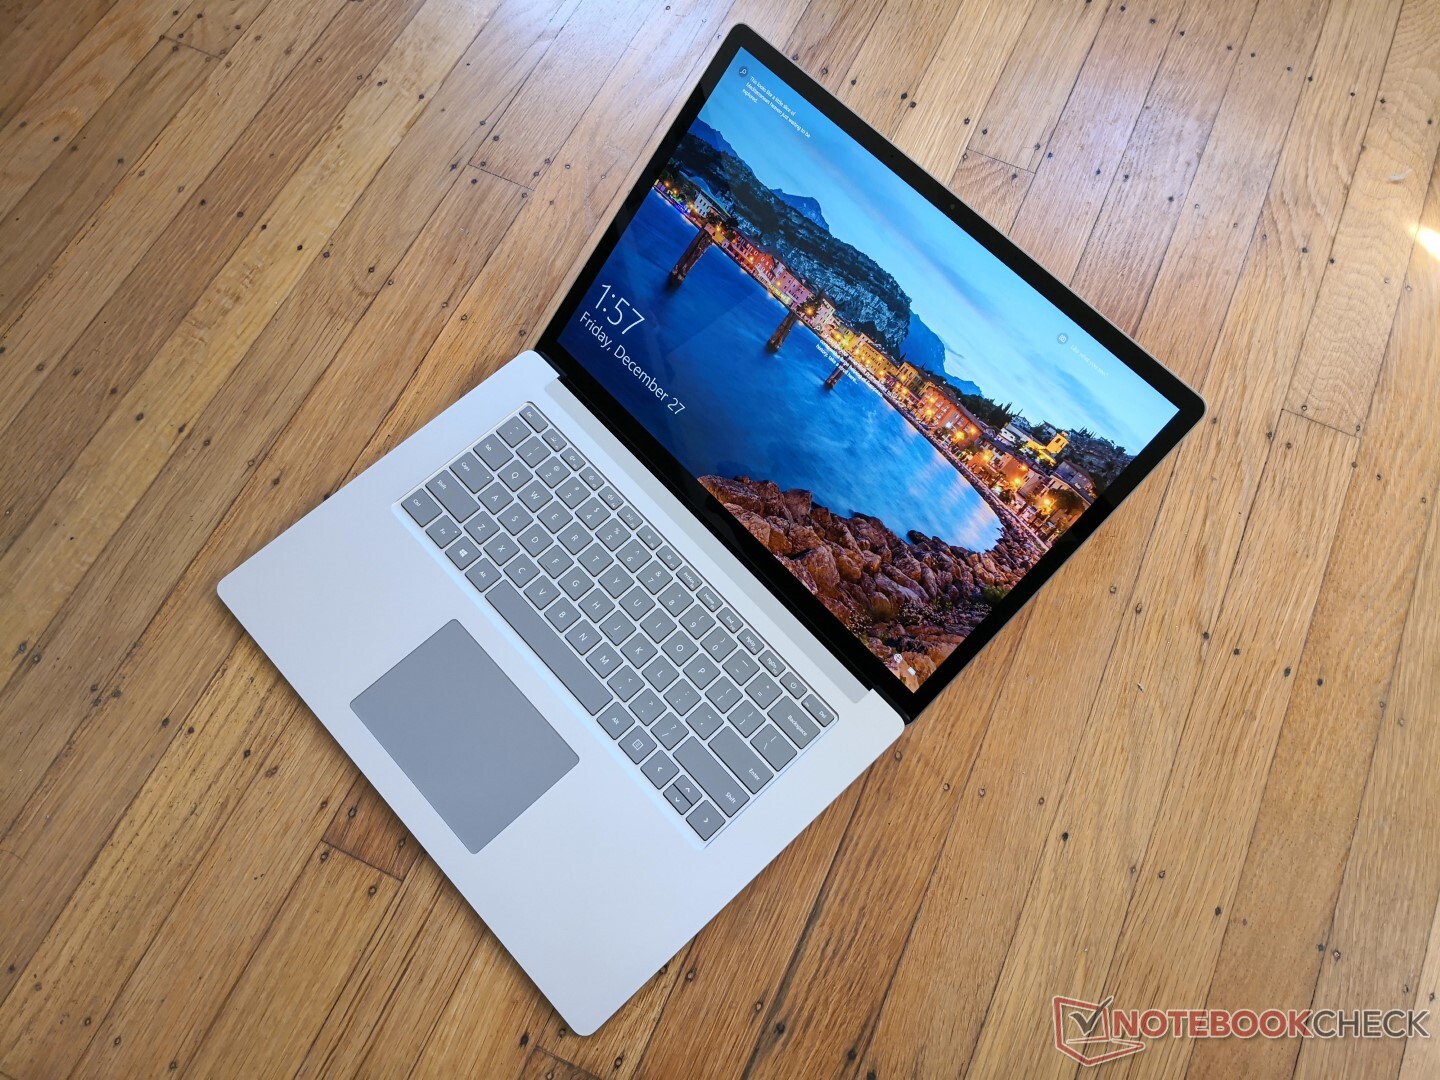
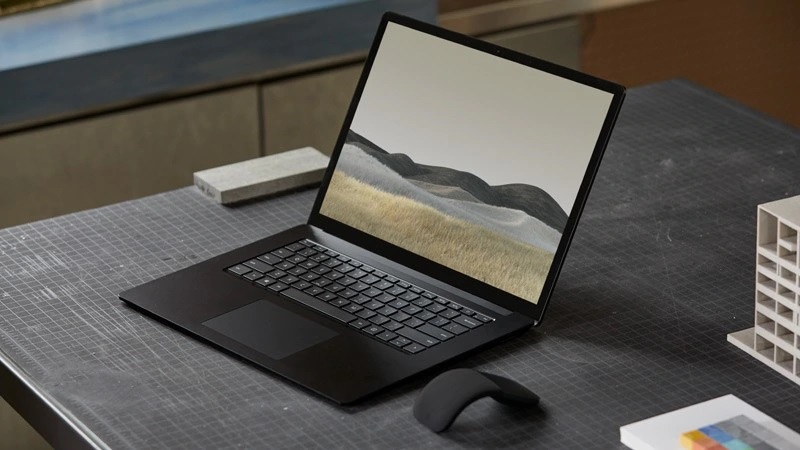
Breve Análise do Microsoft Surface Laptop 3 de 15 polegadas Core i7: Melhor com Ice Lake
Avaliação | Data | Modelo | Peso | Altura | Size | Resolução | Preço |
|---|---|---|---|---|---|---|---|
| 83.9 % v7 (old) | 12/2019 | Microsoft Surface Laptop 3 15 i7-1065G7 i7-1065G7, Iris Plus Graphics G7 (Ice Lake 64 EU) | 1.5 kg | 14.7 mm | 15.00" | 2496x1664 | |
| 86.3 % v7 (old) | 09/2019 | Dell XPS 15 7590 i5 iGPU FHD i5-9300H, UHD Graphics 630 | 1.9 kg | 17 mm | 15.60" | 1920x1080 | |
| 86 % v7 (old) | 12/2019 | Lenovo Yoga C940-15IRH i7-9750H, GeForce GTX 1650 Max-Q | 2 kg | 19.7 mm | 15.60" | 1920x1080 | |
| 83.9 % v7 (old) | 03/2019 | HP Spectre x360 15-df0126ng i7-8750H, GeForce GTX 1050 Ti Max-Q | 2.2 kg | 19.3 mm | 15.60" | 3840x2160 | |
| 89.7 % v7 (old) | 12/2019 | Apple MacBook Pro 16 2019 i9 5500M i9-9880H, Radeon Pro 5500M | 2 kg | 16.2 mm | 16.00" | 3072x1920 |
| |||||||||||||||||||||||||
iluminação: 78 %
iluminação com acumulador: 412.4 cd/m²
Contraste: 1178:1 (Preto: 0.35 cd/m²)
ΔE ColorChecker Calman: 1.04 | ∀{0.5-29.43 Ø4.72}
calibrated: 0.74
ΔE Greyscale Calman: 1.3 | ∀{0.09-98 Ø4.97}
98.4% sRGB (Argyll 1.6.3 3D)
62.4% AdobeRGB 1998 (Argyll 1.6.3 3D)
67.8% AdobeRGB 1998 (Argyll 3D)
98.4% sRGB (Argyll 3D)
65.6% Display P3 (Argyll 3D)
Gamma: 2.07
CCT: 6634 K
| Microsoft Surface Laptop 3 15 i7-1065G7 Sharp LQ150P1JX51, IPS, 15", 2496x1664 | Apple MacBook Pro 16 2019 i9 5500M APPA044, IPS, 16", 3072x1920 | Dell XPS 15 7590 i5 iGPU FHD LQ156M1, IPS, 15.6", 1920x1080 | Asus ZenBook 15 UX534FT-DB77 BOE NV156FHM-N63, IPS, 15.6", 1920x1080 | MSI Prestige 15 A10SC Sharp LQ156D1JW42, IPS, 15.6", 3840x2160 | Microsoft Surface Laptop 3 15 Ryzen 5 3580U Sharp LQ150P1JX51, IPS, 15", 2496x1664 | |
|---|---|---|---|---|---|---|
| Display | 1% | -5% | 22% | -1% | ||
| Display P3 Coverage (%) | 65.6 | 66.5 1% | 66.6 2% | 82 25% | 66.9 2% | |
| sRGB Coverage (%) | 98.4 | 98 0% | 87.7 -11% | 98.3 0% | 99.3 1% | |
| AdobeRGB 1998 Coverage (%) | 67.8 | 68.4 1% | 64.1 -5% | 96.2 42% | 63.7 -6% | |
| Response Times | 7% | 11% | 20% | -8% | 10% | |
| Response Time Grey 50% / Grey 80% * (ms) | 56 ? | 52.4 ? 6% | 52.8 ? 6% | 41.2 ? 26% | 60 ? -7% | 47.2 ? 16% |
| Response Time Black / White * (ms) | 38 ? | 34.9 ? 8% | 32 ? 16% | 33.2 ? 13% | 41.2 ? -8% | 36.8 ? 3% |
| PWM Frequency (Hz) | 21370 ? | 131700 | 1020 ? | 26040 ? | 21370 ? | |
| Screen | -14% | -34% | -132% | -65% | -31% | |
| Brightness middle (cd/m²) | 412.4 | 519 26% | 588 43% | 312.6 -24% | 464.5 13% | 416.9 1% |
| Brightness (cd/m²) | 374 | 477 28% | 555 48% | 290 -22% | 451 21% | 389 4% |
| Brightness Distribution (%) | 78 | 86 10% | 89 14% | 85 9% | 92 18% | 86 10% |
| Black Level * (cd/m²) | 0.35 | 0.39 -11% | 0.4 -14% | 0.31 11% | 0.5 -43% | 0.4 -14% |
| Contrast (:1) | 1178 | 1331 13% | 1470 25% | 1008 -14% | 929 -21% | 1042 -12% |
| Colorchecker dE 2000 * | 1.04 | 2.28 -119% | 2.5 -140% | 5.78 -456% | 3.36 -223% | 2.75 -164% |
| Colorchecker dE 2000 max. * | 2.83 | 6.54 -131% | 6.3 -123% | 8.86 -213% | 7.06 -149% | 6.64 -135% |
| Colorchecker dE 2000 calibrated * | 0.74 | 0.86 -16% | 0.6 19% | 3.78 -411% | 3.42 -362% | 0.71 4% |
| Greyscale dE 2000 * | 1.3 | 0.9 31% | 4.5 -246% | 5.4 -315% | 1.3 -0% | 1.8 -38% |
| Gamma | 2.07 106% | 2145 0% | 2.2 100% | 2.21 100% | 2.14 103% | 2.09 105% |
| CCT | 6634 98% | 6572 99% | 6836 95% | 7864 83% | 6596 99% | 6646 98% |
| Color Space (Percent of AdobeRGB 1998) (%) | 62.4 | 78 25% | 63.2 1% | 57.1 -8% | 84.8 36% | 63.4 2% |
| Color Space (Percent of sRGB) (%) | 98.4 | 98 0% | 87.4 -11% | 98.3 0% | 99.4 1% | |
| Média Total (Programa/Configurações) | -4% /
-11% | -7% /
-22% | -39% /
-89% | -17% /
-41% | -7% /
-20% |
* ... menor é melhor
Exibir tempos de resposta
| ↔ Tempo de resposta preto para branco | ||
|---|---|---|
| 38 ms ... ascensão ↗ e queda ↘ combinadas | ↗ 21.2 ms ascensão | 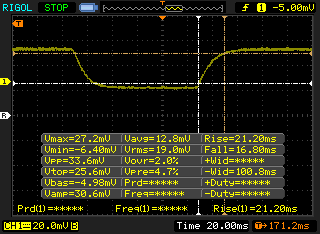 |
| ↘ 16.8 ms queda | ||
| A tela mostra taxas de resposta lentas em nossos testes e será insatisfatória para os jogadores. Em comparação, todos os dispositivos testados variam de 0.1 (mínimo) a 240 (máximo) ms. » 96 % de todos os dispositivos são melhores. Isso significa que o tempo de resposta medido é pior que a média de todos os dispositivos testados (19.9 ms). | ||
| ↔ Tempo de resposta 50% cinza a 80% cinza | ||
| 56 ms ... ascensão ↗ e queda ↘ combinadas | ↗ 27.6 ms ascensão | 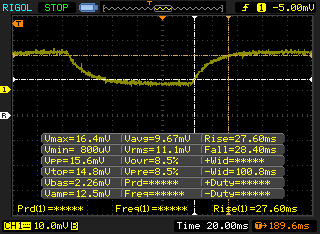 |
| ↘ 28.4 ms queda | ||
| A tela mostra taxas de resposta lentas em nossos testes e será insatisfatória para os jogadores. Em comparação, todos os dispositivos testados variam de 0.165 (mínimo) a 636 (máximo) ms. » 93 % de todos os dispositivos são melhores. Isso significa que o tempo de resposta medido é pior que a média de todos os dispositivos testados (31.1 ms). | ||
Cintilação da tela / PWM (modulação por largura de pulso)
| Tela tremeluzindo/PWM detectado | 21370 Hz | ≤ 51 % configuração de brilho | 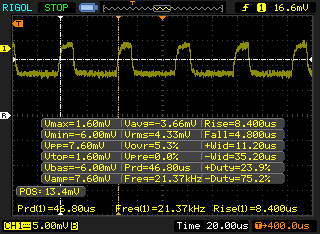 |
A luz de fundo da tela pisca em 21370 Hz (pior caso, por exemplo, utilizando PWM) Cintilação detectada em uma configuração de brilho de 51 % e abaixo. Não deve haver cintilação ou PWM acima desta configuração de brilho. A frequência de 21370 Hz é bastante alta, então a maioria dos usuários sensíveis ao PWM não deve notar nenhuma oscilação. [pwm_comparison] Em comparação: 52 % de todos os dispositivos testados não usam PWM para escurecer a tela. Se PWM foi detectado, uma média de 7784 (mínimo: 5 - máximo: 343500) Hz foi medida. | |||
| Cinebench R20 | |
| CPU (Single Core) | |
| MSI Prestige 15 A10SC | |
| Microsoft Surface Laptop 3 15 i7-1065G7 | |
| Walmart EVOO Gaming 17 | |
| Microsoft Surface Pro 7 Core i5-1035G4 | |
| Média Intel Core i7-1065G7 (358 - 474, n=31) | |
| Dell G3 3590 | |
| Dell XPS 13 7390 2-in-1 Core i3 | |
| HP EliteBook x360 830 G6 | |
| Dynabook Portege A30-E-174 | |
| Microsoft Surface Laptop 3 15 Ryzen 5 3580U | |
| Dell Latitude 13 3390 | |
| Dell Inspiron 15 5000 5585 | |
| Dell Latitude 3400 | |
| CPU (Multi Core) | |
| Walmart EVOO Gaming 17 | |
| MSI Prestige 15 A10SC | |
| Dell G3 3590 | |
| Microsoft Surface Laptop 3 15 i7-1065G7 | |
| Microsoft Surface Laptop 3 15 Ryzen 5 3580U | |
| Média Intel Core i7-1065G7 (1081 - 2024, n=31) | |
| Dell Inspiron 15 5000 5585 | |
| Microsoft Surface Pro 7 Core i5-1035G4 | |
| HP EliteBook x360 830 G6 | |
| Dynabook Portege A30-E-174 | |
| Dell Latitude 13 3390 | |
| Dell XPS 13 7390 2-in-1 Core i3 | |
| Dell Latitude 3400 | |
| Cinebench R15 | |
| CPU Single 64Bit | |
| MSI Prestige 15 A10SC | |
| Microsoft Surface Laptop 3 15 i7-1065G7 | |
| Walmart EVOO Gaming 17 | |
| Média Intel Core i7-1065G7 (141 - 190, n=35) | |
| Dell G3 3590 | |
| Microsoft Surface Pro 7 Core i5-1035G4 | |
| HP EliteBook x360 830 G6 | |
| Dell XPS 13 7390 2-in-1 Core i3 | |
| Dynabook Portege A30-E-174 | |
| Dell Latitude 3400 | |
| Dell Latitude 13 3390 | |
| Microsoft Surface Laptop 3 15 Ryzen 5 3580U | |
| Dell Inspiron 15 5000 5585 | |
| CPU Multi 64Bit | |
| Walmart EVOO Gaming 17 | |
| MSI Prestige 15 A10SC | |
| Dell G3 3590 | |
| Microsoft Surface Laptop 3 15 i7-1065G7 | |
| Microsoft Surface Laptop 3 15 Ryzen 5 3580U | |
| Dell Inspiron 15 5000 5585 | |
| Média Intel Core i7-1065G7 (288 - 836, n=36) | |
| Microsoft Surface Pro 7 Core i5-1035G4 | |
| Dell Latitude 13 3390 | |
| HP EliteBook x360 830 G6 | |
| Dynabook Portege A30-E-174 | |
| Dell XPS 13 7390 2-in-1 Core i3 | |
| Dell Latitude 3400 | |
| PCMark 8 Home Score Accelerated v2 | 3783 pontos | |
| PCMark 8 Work Score Accelerated v2 | 4799 pontos | |
| PCMark 10 Score | 4644 pontos | |
Ajuda | ||
| Microsoft Surface Laptop 3 15 i7-1065G7 Toshiba KBG40ZNS256G NVMe | Apple MacBook Pro 16 2019 i9 5500M Apple SSD AP1024 7171 | Asus ZenBook 15 UX534FT-DB77 Samsung SSD PM981 MZVLB1T0HALR | MSI Prestige 15 A10SC Samsung SSD PM981 MZVLB1T0HALR | Microsoft Surface Laptop 3 15 Ryzen 5 3580U SK hynix BC501 HFM256GDGTNG | Razer Blade Stealth 13, Core i7-1065G7 Lite-On CA3-8D512 | |
|---|---|---|---|---|---|---|
| AS SSD | 82% | 66% | 85% | -21% | 13% | |
| Seq Read (MB/s) | 1756 | 2531 44% | 1887 7% | 1274 -27% | 1122 -36% | 2666 52% |
| Seq Write (MB/s) | 818 | 2289 180% | 1432 75% | 1395 71% | 514 -37% | 1497 83% |
| 4K Read (MB/s) | 52.3 | 15.85 -70% | 52.3 0% | 50.3 -4% | 34.98 -33% | 53.7 3% |
| 4K Write (MB/s) | 112.2 | 39.88 -64% | 146 30% | 119.8 7% | 96.8 -14% | 133.7 19% |
| 4K-64 Read (MB/s) | 985 | 1267 29% | 969 -2% | 1599 62% | 492 -50% | 652 -34% |
| 4K-64 Write (MB/s) | 292.7 | 1749 498% | 1375 370% | 1455 397% | 339.9 16% | 272 -7% |
| Access Time Read * (ms) | 0.083 | 0.122 -47% | 0.034 59% | 0.044 47% | 0.056 33% | 0.075 10% |
| Access Time Write * (ms) | 0.619 | 0.095 85% | 0.075 88% | 0.092 85% | 0.11 82% | 0.032 95% |
| Score Read (Points) | 1213 | 1536 27% | 1210 0% | 1777 46% | 639 -47% | 972 -20% |
| Score Write (Points) | 487 | 2018 314% | 1664 242% | 1714 252% | 488 0% | 555 14% |
| Score Total (Points) | 2285 | 4317 89% | 3483 52% | 4411 93% | 1434 -37% | 1982 -13% |
| Copy ISO MB/s (MB/s) | 1192 | 1995 67% | 1375 15% | 2830 137% | 828 -31% | 1495 25% |
| Copy Program MB/s (MB/s) | 604 | 584 -3% | 468 -23% | 609 1% | 200.5 -67% | 458.4 -24% |
| Copy Game MB/s (MB/s) | 1136 | 1135 0% | 1287 13% | 1424 25% | 387.4 -66% | 964 -15% |
* ... menor é melhor

| 3DMark 11 Performance | 4932 pontos | |
| 3DMark Ice Storm Standard Score | 67987 pontos | |
| 3DMark Cloud Gate Standard Score | 14347 pontos | |
| 3DMark Fire Strike Score | 2865 pontos | |
| 3DMark Time Spy Score | 960 pontos | |
Ajuda | ||
| F1 2019 | |
| 1280x720 Ultra Low Preset | |
| Microsoft Surface Laptop 3 15 i7-1065G7 | |
| Microsoft Surface Laptop 3 15 Ryzen 5 3580U | |
| Média Intel Iris Plus Graphics G7 (Ice Lake 64 EU) (35 - 63, n=5) | |
| 1920x1080 Medium Preset AA:T AF:16x | |
| Microsoft Surface Laptop 3 15 i7-1065G7 | |
| Média Intel Iris Plus Graphics G7 (Ice Lake 64 EU) (22 - 31, n=5) | |
| Microsoft Surface Laptop 3 15 Ryzen 5 3580U | |
| 1920x1080 High Preset AA:T AF:16x | |
| Microsoft Surface Laptop 3 15 i7-1065G7 | |
| Média Intel Iris Plus Graphics G7 (Ice Lake 64 EU) (19 - 27, n=4) | |
| Microsoft Surface Laptop 3 15 Ryzen 5 3580U | |
| 1920x1080 Ultra High Preset AA:T AF:16x | |
| Microsoft Surface Laptop 3 15 i7-1065G7 | |
| Média Intel Iris Plus Graphics G7 (Ice Lake 64 EU) (12 - 21, n=4) | |
| Microsoft Surface Laptop 3 15 Ryzen 5 3580U | |
| Borderlands 3 | |
| 1280x720 Very Low Overall Quality (DX11) | |
| Microsoft Surface Laptop 3 15 i7-1065G7 | |
| Média Intel Iris Plus Graphics G7 (Ice Lake 64 EU) (26.7 - 37, n=4) | |
| Microsoft Surface Laptop 3 15 Ryzen 5 3580U | |
| 1920x1080 Medium Overall Quality (DX11) | |
| Microsoft Surface Laptop 3 15 i7-1065G7 | |
| Média Intel Iris Plus Graphics G7 (Ice Lake 64 EU) (11.7 - 16, n=3) | |
| Microsoft Surface Laptop 3 15 Ryzen 5 3580U | |
| 1920x1080 High Overall Quality (DX11) | |
| Microsoft Surface Laptop 3 15 i7-1065G7 | |
| Média Intel Iris Plus Graphics G7 (Ice Lake 64 EU) (7.73 - 10, n=3) | |
| Microsoft Surface Laptop 3 15 Ryzen 5 3580U | |
| baixo | média | alto | ultra | |
|---|---|---|---|---|
| StarCraft II: Heart of the Swarm (2013) | 358.2 | 100.9 | 64.8 | |
| BioShock Infinite (2013) | 109.6 | 73 | 61.5 | 22.6 |
| The Witcher 3 (2015) | 56.4 | 36.8 | 20.1 | 10 |
| Overwatch (2016) | 90 | 64 | 32.9 | 19.7 |
| Rocket League (2017) | 96.1 | 61 | 42.8 | |
| Shadow of the Tomb Raider (2018) | 31 | |||
| F1 2019 (2019) | 63 | 31 | 27 | 17 |
| Borderlands 3 (2019) | 37 | 16 | 10 |
| Microsoft Surface Laptop 3 15 i7-1065G7 Iris Plus Graphics G7 (Ice Lake 64 EU), i7-1065G7, Toshiba KBG40ZNS256G NVMe | Apple MacBook Pro 16 2019 i9 5500M Radeon Pro 5500M, i9-9880H, Apple SSD AP1024 7171 | Dell XPS 15 7590 i5 iGPU FHD UHD Graphics 630, i5-9300H, Toshiba XG6 KXG60ZNV512G | Asus ZenBook 15 UX534FT-DB77 GeForce GTX 1650 Max-Q, i7-8565U, Samsung SSD PM981 MZVLB1T0HALR | Razer Blade Stealth i7-8565U GeForce MX150, i7-8565U, Lite-On CA3-8D256-Q11 | Microsoft Surface Laptop 3 15 Ryzen 5 3580U Vega 9, R5 3580U, SK hynix BC501 HFM256GDGTNG | |
|---|---|---|---|---|---|---|
| Noise | -13% | -2% | -2% | -8% | 2% | |
| desligado / ambiente * (dB) | 28.5 | 29.8 -5% | 29.3 -3% | 28.4 -0% | 28.4 -0% | 28 2% |
| Idle Minimum * (dB) | 28.5 | 29.9 -5% | 29.3 -3% | 28.4 -0% | 28.5 -0% | 28 2% |
| Idle Average * (dB) | 28.5 | 29.9 -5% | 29.3 -3% | 28.4 -0% | 29 -2% | 28 2% |
| Idle Maximum * (dB) | 28.7 | 29.9 -4% | 29.8 -4% | 28.4 1% | 29.1 -1% | 28 2% |
| Load Average * (dB) | 30 | 43 -43% | 32.4 -8% | 33.9 -13% | 42.8 -43% | 29.2 3% |
| Witcher 3 ultra * (dB) | 39.2 | 45.4 -16% | 39.8 -2% | 41.4 -6% | 39 1% | |
| Load Maximum * (dB) | 41.2 | 46.1 -12% | 37.2 10% | 40.2 2% | 41.6 -1% | 41.4 -0% |
* ... menor é melhor
Barulho
| Ocioso |
| 28.5 / 28.5 / 28.7 dB |
| Carga |
| 30 / 41.2 dB |
 | ||
30 dB silencioso 40 dB(A) audível 50 dB(A) ruidosamente alto |
||
min: | ||
(±) A temperatura máxima no lado superior é 41.8 °C / 107 F, em comparação com a média de 34.3 °C / 94 F , variando de 21.2 a 62.5 °C para a classe Office.
(-) A parte inferior aquece até um máximo de 45.6 °C / 114 F, em comparação com a média de 36.8 °C / 98 F
(+) Em uso inativo, a temperatura média para o lado superior é 21.6 °C / 71 F, em comparação com a média do dispositivo de 29.5 °C / ### class_avg_f### F.
(±) Jogando The Witcher 3, a temperatura média para o lado superior é 32.2 °C / 90 F, em comparação com a média do dispositivo de 29.5 °C / ## #class_avg_f### F.
(+) Os apoios para as mãos e o touchpad são mais frios que a temperatura da pele, com um máximo de 29 °C / 84.2 F e, portanto, são frios ao toque.
(±) A temperatura média da área do apoio para as mãos de dispositivos semelhantes foi 27.5 °C / 81.5 F (-1.5 °C / -2.7 F).
Microsoft Surface Laptop 3 15 i7-1065G7 análise de áudio
(±) | o volume do alto-falante é médio, mas bom (###valor### dB)
Graves 100 - 315Hz
(±) | graves reduzidos - em média 5.3% menor que a mediana
(±) | a linearidade dos graves é média (10.3% delta para a frequência anterior)
Médios 400 - 2.000 Hz
(+) | médios equilibrados - apenas 2.7% longe da mediana
(+) | médios são lineares (6.7% delta para frequência anterior)
Altos 2 - 16 kHz
(+) | agudos equilibrados - apenas 2.7% longe da mediana
(±) | a linearidade dos máximos é média (8.5% delta para frequência anterior)
Geral 100 - 16.000 Hz
(+) | o som geral é linear (11.7% diferença em relação à mediana)
Comparado com a mesma classe
» 3% de todos os dispositivos testados nesta classe foram melhores, 2% semelhantes, 95% piores
» O melhor teve um delta de 7%, a média foi 21%, o pior foi 53%
Comparado com todos os dispositivos testados
» 8% de todos os dispositivos testados foram melhores, 3% semelhantes, 89% piores
» O melhor teve um delta de 4%, a média foi 24%, o pior foi 134%
Apple MacBook 12 (Early 2016) 1.1 GHz análise de áudio
(+) | os alto-falantes podem tocar relativamente alto (###valor### dB)
Graves 100 - 315Hz
(±) | graves reduzidos - em média 11.3% menor que a mediana
(±) | a linearidade dos graves é média (14.2% delta para a frequência anterior)
Médios 400 - 2.000 Hz
(+) | médios equilibrados - apenas 2.4% longe da mediana
(+) | médios são lineares (5.5% delta para frequência anterior)
Altos 2 - 16 kHz
(+) | agudos equilibrados - apenas 2% longe da mediana
(+) | os máximos são lineares (4.5% delta da frequência anterior)
Geral 100 - 16.000 Hz
(+) | o som geral é linear (10.2% diferença em relação à mediana)
Comparado com a mesma classe
» 7% de todos os dispositivos testados nesta classe foram melhores, 2% semelhantes, 91% piores
» O melhor teve um delta de 5%, a média foi 18%, o pior foi 53%
Comparado com todos os dispositivos testados
» 5% de todos os dispositivos testados foram melhores, 1% semelhantes, 94% piores
» O melhor teve um delta de 4%, a média foi 24%, o pior foi 134%
| desligado | |
| Ocioso | |
| Carga |
|
Key:
min: | |
| Microsoft Surface Laptop 3 15 i7-1065G7 i7-1065G7, Iris Plus Graphics G7 (Ice Lake 64 EU), Toshiba KBG40ZNS256G NVMe, IPS, 2496x1664, 15" | Dell XPS 15 7590 i5 iGPU FHD i5-9300H, UHD Graphics 630, Toshiba XG6 KXG60ZNV512G, IPS, 1920x1080, 15.6" | Asus ZenBook 15 UX534FT-DB77 i7-8565U, GeForce GTX 1650 Max-Q, Samsung SSD PM981 MZVLB1T0HALR, IPS, 1920x1080, 15.6" | MSI Prestige 15 A10SC i7-10710U, GeForce GTX 1650 Max-Q, Samsung SSD PM981 MZVLB1T0HALR, IPS, 3840x2160, 15.6" | Razer Blade Stealth i7-8565U i7-8565U, GeForce MX150, Lite-On CA3-8D256-Q11, IPS, 1920x1080, 13.3" | Microsoft Surface Laptop 3 15 Ryzen 5 3580U R5 3580U, Vega 9, SK hynix BC501 HFM256GDGTNG, IPS, 2496x1664, 15" | |
|---|---|---|---|---|---|---|
| Power Consumption | -17% | -74% | -68% | -28% | 10% | |
| Idle Minimum * (Watt) | 4.4 | 3.79 14% | 5 -14% | 6.1 -39% | 6.7 -52% | 3.3 25% |
| Idle Average * (Watt) | 8.3 | 6.9 17% | 13.2 -59% | 13.2 -59% | 8.6 -4% | 7.1 14% |
| Idle Maximum * (Watt) | 8.6 | 9.2 -7% | 24 -179% | 19.2 -123% | 9.4 -9% | 7.2 16% |
| Load Average * (Watt) | 43.6 | 62 -42% | 70 -61% | 75 -72% | 64.1 -47% | 44.8 -3% |
| Witcher 3 ultra * (Watt) | 41.5 | 63.3 -53% | 74 -78% | 63.7 -53% | 45.1 -9% | |
| Load Maximum * (Watt) | 64.4 | 108 -68% | 114 -77% | 89.7 -39% | 64.1 -0% | 53 18% |
* ... menor é melhor
| Microsoft Surface Laptop 3 15 i7-1065G7 i7-1065G7, Iris Plus Graphics G7 (Ice Lake 64 EU), 45 Wh | Apple MacBook Pro 16 2019 i9 5500M i9-9880H, Radeon Pro 5500M, 99.8 Wh | Dell XPS 15 7590 i5 iGPU FHD i5-9300H, UHD Graphics 630, 97 Wh | Lenovo Yoga C940-15IRH i7-9750H, GeForce GTX 1650 Max-Q, 69 Wh | HP Spectre x360 15-df0126ng i7-8750H, GeForce GTX 1050 Ti Max-Q, 84 Wh | Asus ZenBook 15 UX534FT-DB77 i7-8565U, GeForce GTX 1650 Max-Q, 71 Wh | MSI Prestige 15 A10SC i7-10710U, GeForce GTX 1650 Max-Q, 82 Wh | Microsoft Surface Laptop 3 15 Ryzen 5 3580U R5 3580U, Vega 9, 45 Wh | |
|---|---|---|---|---|---|---|---|---|
| Duração da bateria | -1% | 31% | -26% | -6% | 5% | -14% | -16% | |
| Reader / Idle (h) | 35 | 18.2 -48% | 18.8 -46% | 21.5 -39% | 19.1 -45% | 18.7 -47% | ||
| WiFi v1.3 (h) | 8.2 | 12 46% | 14.1 72% | 9.7 18% | 8.8 7% | 8.4 2% | 7.6 -7% | 9.1 11% |
| Load (h) | 1.9 | 1 -47% | 1.7 -11% | 1 -47% | 2.3 21% | 2.9 53% | 2.1 11% | 1.7 -11% |
| Witcher 3 ultra (h) | 0.9 |
Pro
Contra
As principais vantagens de nosso SKU Core i7 em comparação com o SKU Ryzen 5 incluem compatibilidade Wi-Fi 6, desempenho mais rápido de armazenamento, desempenho mais rápido da CPU, aceleração de IA integrada, desempenho mais rápido de jogos e maior desempenho por Watt. Outros aspectos, como a tela, a duração da bateria WLAN, a temperatura da superfície e o ruído do ventilador, são os mesmos entre si ou quase idênticos.
Embora não seja surpreendente que nosso SKU Core i7 seja capaz de superar nosso SKU Ryzen 5 mais barato, é a margem na qual estamos mais interessados. O desempenho bruto da CPU, por exemplo, não é muito mais rápido, o que significa que você não deve escolher Intel sobre AMD baseado puramente em potência de processador. O desempenho dos jogos também é bastante inconsistente, com alguns jogos rodando melhor na Intel e outros sendo disputados. Enquanto isso, a aceleração da IA continua sendo uma novidade para a maioria dos usuários de escritório, pois não tem influência direta nas tarefas comuns do dia-a-dia. A Intel pode realmente aproveitar suas vantagens sobre a AMD no campo da IA, mas isso não significará muito para os consumidores se os aplicativos não forem otimizados para explorar a aceleração da IA em primeiro lugar.
Em suma, as diferenças de desempenho diárias entre os SKUs do Surface Laptop 3 Core i7 e Ryzen 5 são menores do que o previsto, especialmente quando você considera o preço premium que a Microsoft está cobrando pelos SKUs da Intel. Se você é um usuário avançado que deseja o melhor que o Surface Laptop pode oferecer, as opções da Intel são as mais óbvias Caso contrário, seria difícil notar a diferença entre um Surface Laptop 3 Intel e AMD se sua carga de trabalho consistir principalmente em processamento de texto, navegação na Web ou streaming de vídeo.
Microsoft Surface Laptop 3 15 i7-1065G7
- 02/23/2020 v7 (old)
Allen Ngo
Price comparison
