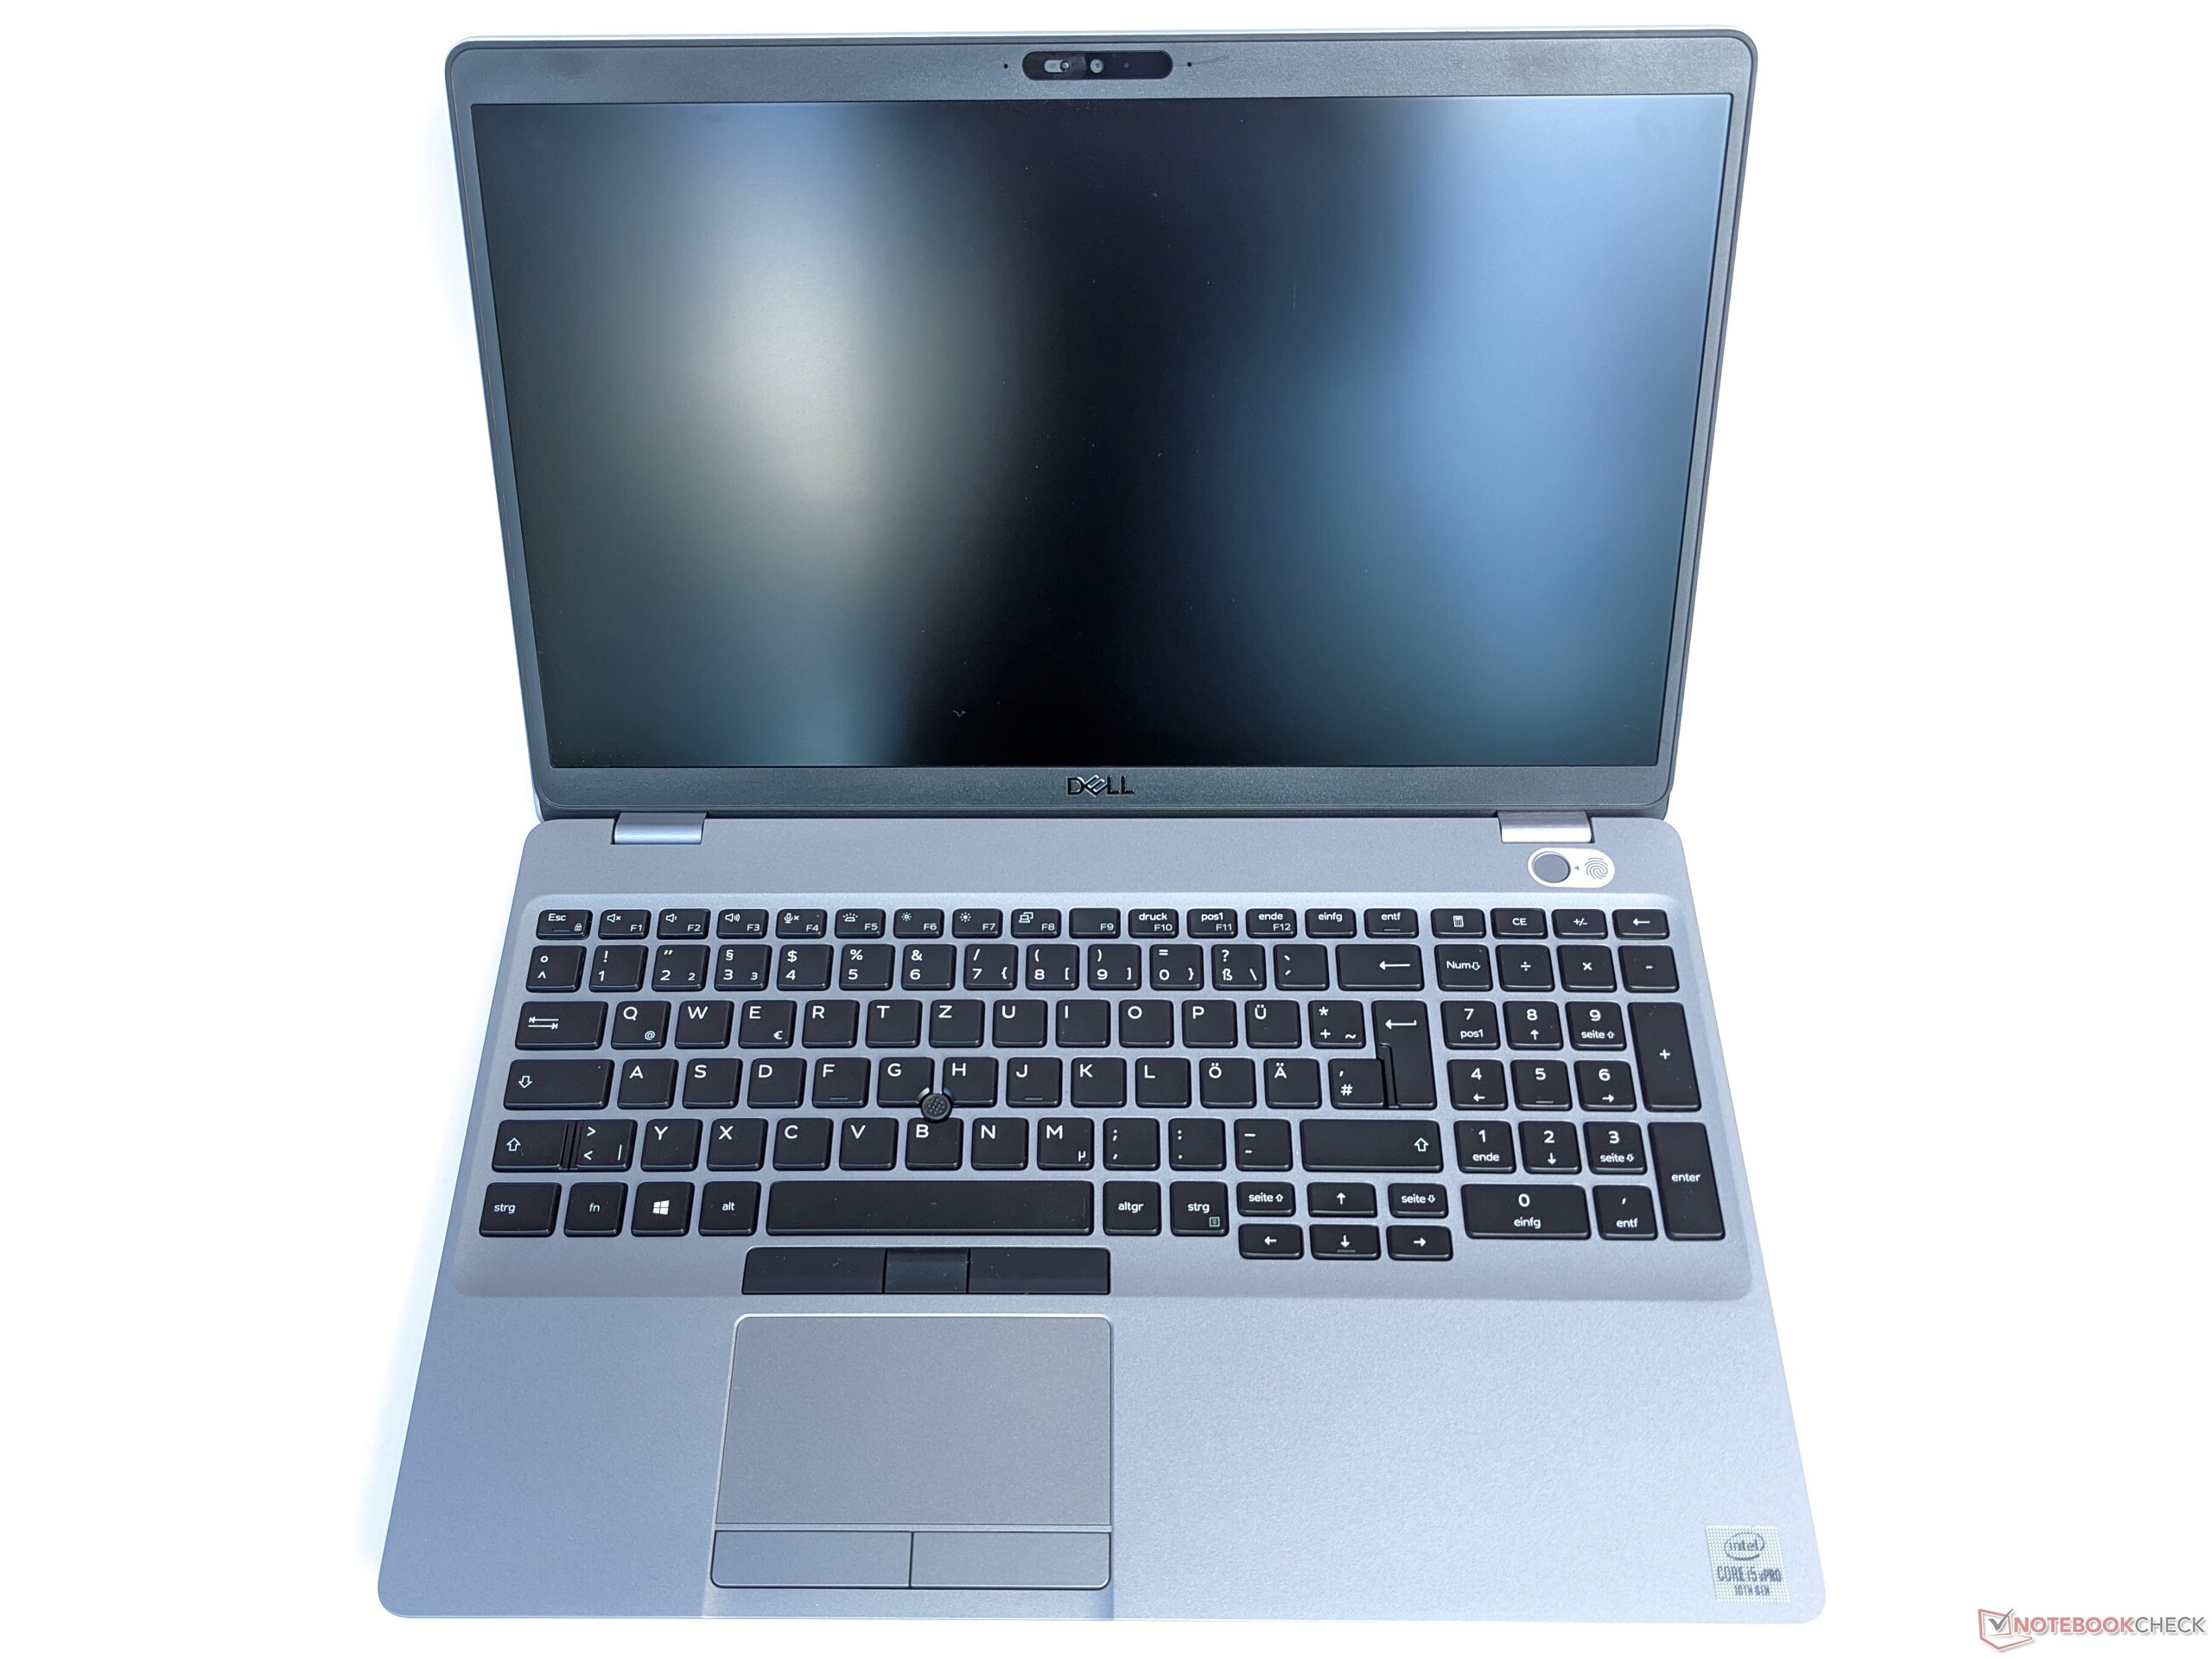
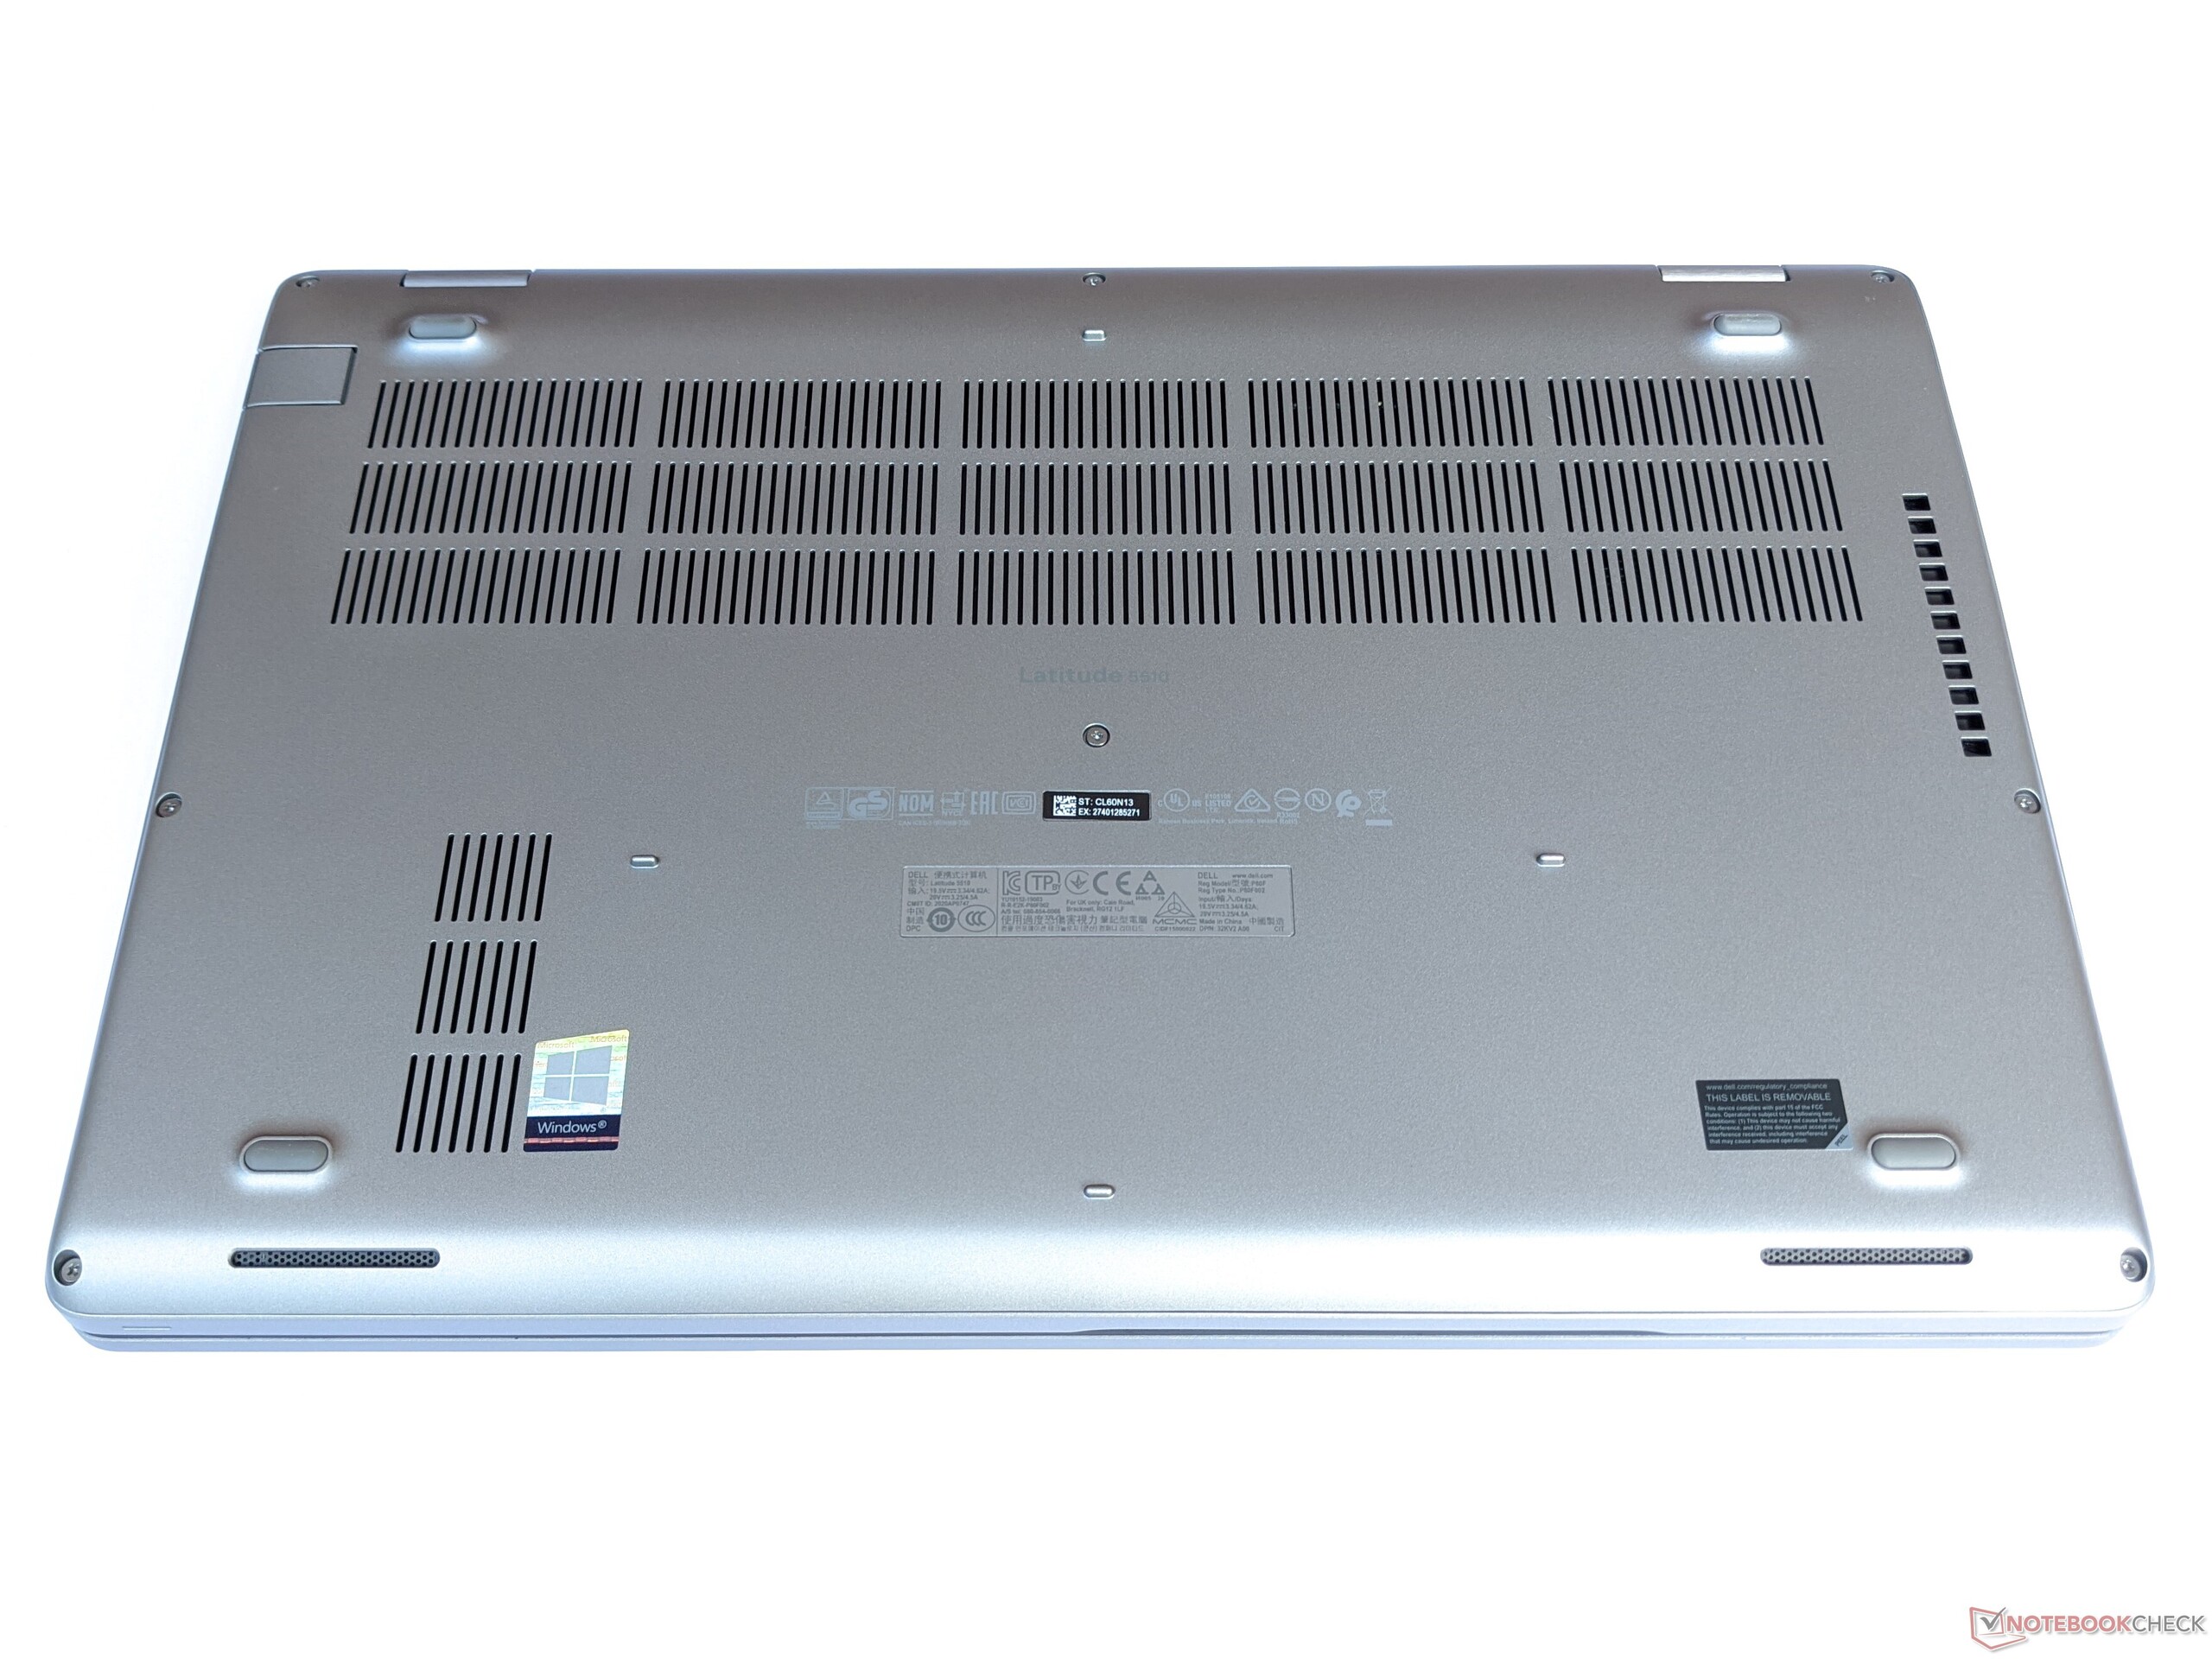
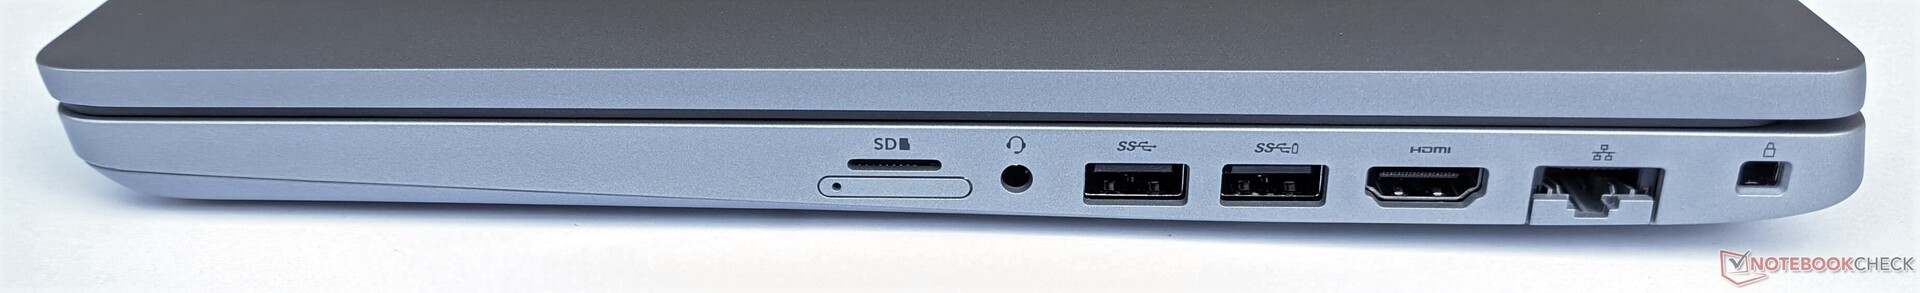
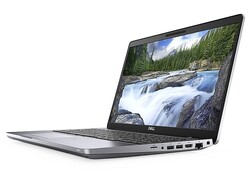
Breve Análise do Portátil Dell Latitude 15 5510: Portátil de escritório com WWAN preparado
Avaliação | Data | Modelo | Peso | Altura | Size | Resolução | Preço |
|---|---|---|---|---|---|---|---|
| 84 % v7 (old) | 10/2020 | Dell Latitude 15 5510-D90XK i5-10310U, UHD Graphics 620 | 1.8 kg | 23 mm | 15.60" | 1920x1080 | |
| 83.3 % v7 (old) | Schenker VIA 15 R5 3500U, Vega 8 | 1.4 kg | 17 mm | 15.60" | 1920x1080 | ||
| 82 % v7 (old) | 08/2020 | Acer TravelMate P215-52 i7-10510U, UHD Graphics 620 | 1.8 kg | 19.9 mm | 15.60" | 1920x1080 | |
| 82.6 % v7 (old) | 07/2020 | HP ProBook 455 G7-175W8EA R7 4700U, Vega 7 | 1.8 kg | 19 mm | 15.60" | 1920x1080 | |
| 82.1 % v7 (old) | 03/2020 | Lenovo ThinkPad E15 20RD0011GE i7-10510U, Radeon RX 640 | 1.8 kg | 18.9 mm | 15.60" | 1920x1080 |

| SD Card Reader | |
| average JPG Copy Test (av. of 3 runs) | |
| Dell Latitude 15 5510-D90XK (Toshiba Exceria Pro M501 microSDXC 64GB) | |
| HP ProBook 455 G7-175W8EA (Toshiba Exceria Pro SDXC 64 GB UHS-II) | |
| Média da turma Office (19.8 - 198.5, n=22, últimos 2 anos) | |
| Schenker VIA 15 | |
| Acer TravelMate P215-52 (Toshiba Exceria Pro SDXC 64 GB UHS-II) | |
| maximum AS SSD Seq Read Test (1GB) | |
| Dell Latitude 15 5510-D90XK (Toshiba Exceria Pro M501 microSDXC 64GB) | |
| HP ProBook 455 G7-175W8EA (Toshiba Exceria Pro SDXC 64 GB UHS-II) | |
| Média da turma Office (27.4 - 249, n=21, últimos 2 anos) | |
| Schenker VIA 15 (Toshiba Exceria Pro M501 64 GB UHS-II) | |
| Acer TravelMate P215-52 (Toshiba Exceria Pro SDXC 64 GB UHS-II) | |
| Networking | |
| iperf3 transmit AX12 | |
| Dell Latitude 15 5510-D90XK | |
| Acer TravelMate P215-52 | |
| Schenker VIA 15 | |
| Média Intel Wi-Fi 6 AX201 (49.8 - 1775, n=324) | |
| Lenovo ThinkPad E15 20RD0011GE | |
| iperf3 receive AX12 | |
| Acer TravelMate P215-52 | |
| Schenker VIA 15 | |
| Dell Latitude 15 5510-D90XK | |
| Média Intel Wi-Fi 6 AX201 (136 - 1743, n=324) | |
| Lenovo ThinkPad E15 20RD0011GE | |
| HP ProBook 455 G7-175W8EA | |


| |||||||||||||||||||||||||
iluminação: 74 %
iluminação com acumulador: 256 cd/m²
Contraste: 1613:1 (Preto: 0.16 cd/m²)
ΔE ColorChecker Calman: 5.61 | ∀{0.5-29.43 Ø4.71}
ΔE Greyscale Calman: 2.77 | ∀{0.09-98 Ø4.96}
56% sRGB (Argyll 1.6.3 3D)
36% AdobeRGB 1998 (Argyll 1.6.3 3D)
40.02% AdobeRGB 1998 (Argyll 3D)
56.6% sRGB (Argyll 3D)
38.74% Display P3 (Argyll 3D)
Gamma: 2.27
CCT: 6198 K
| Dell Latitude 15 5510-D90XK BOE0869, IPS, 1920x1080, 15.6" | Schenker VIA 15 Chi Mei CMN15E8, IPS, 1920x1080, 15.6" | Acer TravelMate P215-52 BOE CQ NV156FHM-N48, IPS, 1920x1080, 15.6" | HP ProBook 455 G7-175W8EA AUO, B156HW02, IPS, 1920x1080, 15.6" | Lenovo ThinkPad E15 20RD0011GE NV156FHM-N48, IPS LED, 1920x1080, 15.6" | |
|---|---|---|---|---|---|
| Display | 77% | 6% | -1% | 3% | |
| Display P3 Coverage (%) | 38.74 | 68.7 77% | 40.66 5% | 37.92 -2% | 40.25 4% |
| sRGB Coverage (%) | 56.6 | 99.8 76% | 60.6 7% | 57.1 1% | 57.7 2% |
| AdobeRGB 1998 Coverage (%) | 40.02 | 70.9 77% | 42.01 5% | 39.18 -2% | 41.59 4% |
| Response Times | 17% | 30% | 16% | -10% | |
| Response Time Grey 50% / Grey 80% * (ms) | 44 ? | 38.4 ? 13% | 24.4 ? 45% | 41 ? 7% | 49.6 ? -13% |
| Response Time Black / White * (ms) | 34 ? | 26.8 ? 21% | 29.2 ? 14% | 26 ? 24% | 36 ? -6% |
| PWM Frequency (Hz) | 1000 ? | 25910 ? | 1000 ? | 1250 ? | |
| Screen | 30% | -27% | -1% | -22% | |
| Brightness middle (cd/m²) | 258 | 296 15% | 255.9 -1% | 282 9% | 283 10% |
| Brightness (cd/m²) | 229 | 273 19% | 234 2% | 264 15% | 258 13% |
| Brightness Distribution (%) | 74 | 81 9% | 78 5% | 88 19% | 81 9% |
| Black Level * (cd/m²) | 0.16 | 0.25 -56% | 0.46 -188% | 0.19 -19% | 0.22 -38% |
| Contrast (:1) | 1613 | 1184 -27% | 556 -66% | 1484 -8% | 1286 -20% |
| Colorchecker dE 2000 * | 5.61 | 1.7 70% | 5.02 11% | 5.56 1% | 7.9 -41% |
| Colorchecker dE 2000 max. * | 19 | 2.9 85% | 18.26 4% | 19.07 -0% | 23.6 -24% |
| Greyscale dE 2000 * | 2.77 | 2.1 24% | 4.2 -52% | 3.57 -29% | 6.6 -138% |
| Gamma | 2.27 97% | 2.31 95% | 2.07 106% | 2.61 84% | 2.18 101% |
| CCT | 6198 105% | 6759 96% | 6975 93% | 6895 94% | 5735 113% |
| Color Space (Percent of AdobeRGB 1998) (%) | 36 | 64.7 80% | 38.6 7% | 36 0% | 37 3% |
| Color Space (Percent of sRGB) (%) | 56 | 99.8 78% | 60.4 8% | 57 2% | 57.1 2% |
| Colorchecker dE 2000 calibrated * | 0.8 | 4.17 | 4.5 | 5.8 | |
| Média Total (Programa/Configurações) | 41% /
37% | 3% /
-13% | 5% /
1% | -10% /
-16% |
* ... menor é melhor
Exibir tempos de resposta
| ↔ Tempo de resposta preto para branco | ||
|---|---|---|
| 34 ms ... ascensão ↗ e queda ↘ combinadas | ↗ 18 ms ascensão | 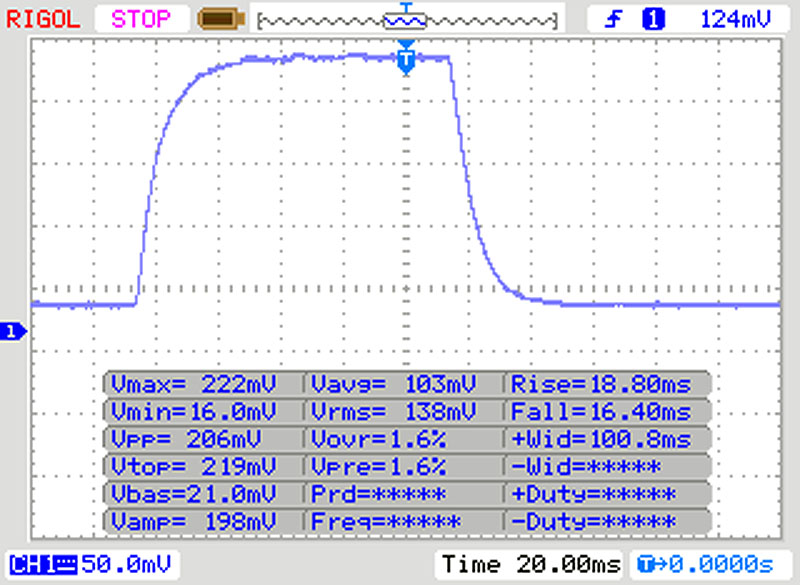 |
| ↘ 16 ms queda | ||
| A tela mostra taxas de resposta lentas em nossos testes e será insatisfatória para os jogadores. Em comparação, todos os dispositivos testados variam de 0.1 (mínimo) a 240 (máximo) ms. » 91 % de todos os dispositivos são melhores. Isso significa que o tempo de resposta medido é pior que a média de todos os dispositivos testados (19.8 ms). | ||
| ↔ Tempo de resposta 50% cinza a 80% cinza | ||
| 44 ms ... ascensão ↗ e queda ↘ combinadas | ↗ 23 ms ascensão | 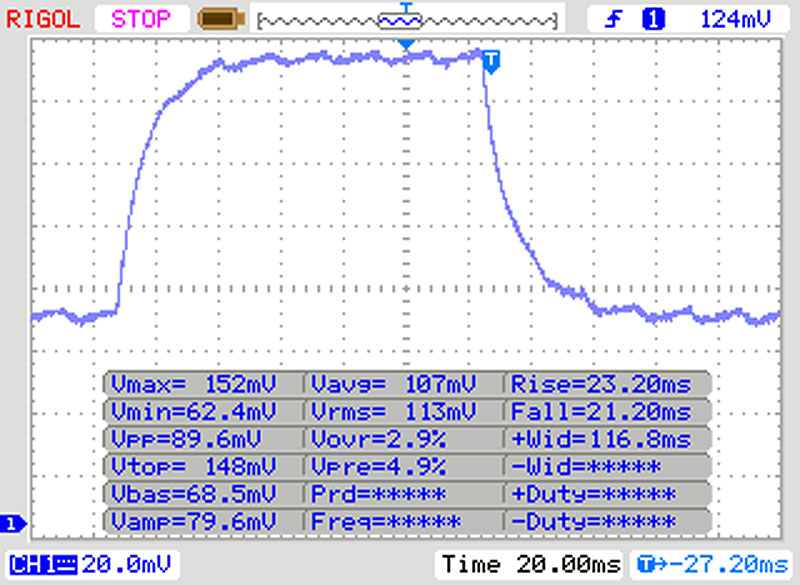 |
| ↘ 21 ms queda | ||
| A tela mostra taxas de resposta lentas em nossos testes e será insatisfatória para os jogadores. Em comparação, todos os dispositivos testados variam de 0.165 (mínimo) a 636 (máximo) ms. » 73 % de todos os dispositivos são melhores. Isso significa que o tempo de resposta medido é pior que a média de todos os dispositivos testados (31 ms). | ||
Cintilação da tela / PWM (modulação por largura de pulso)
| Tela tremeluzindo/PWM detectado | 1000 Hz | ≤ 90 % configuração de brilho | 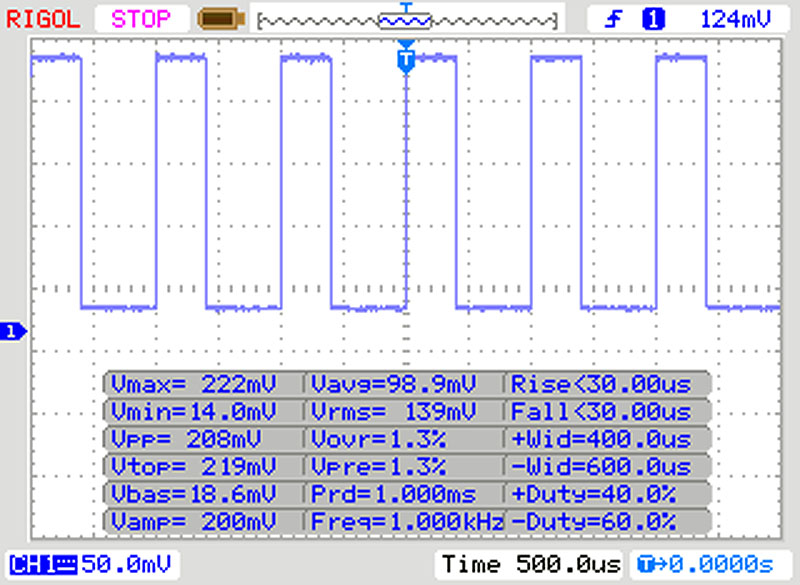 |
A luz de fundo da tela pisca em 1000 Hz (pior caso, por exemplo, utilizando PWM) Cintilação detectada em uma configuração de brilho de 90 % e abaixo. Não deve haver cintilação ou PWM acima desta configuração de brilho. A frequência de 1000 Hz é bastante alta, então a maioria dos usuários sensíveis ao PWM não deve notar nenhuma oscilação. [pwm_comparison] Em comparação: 52 % de todos os dispositivos testados não usam PWM para escurecer a tela. Se PWM foi detectado, uma média de 7754 (mínimo: 5 - máximo: 343500) Hz foi medida. | |||
Cinebench R15: CPU Single 64Bit | CPU Multi 64Bit
Blender: v2.79 BMW27 CPU
7-Zip 18.03: 7z b 4 -mmt1 | 7z b 4
Geekbench 5.5: Single-Core | Multi-Core
HWBOT x265 Benchmark v2.2: 4k Preset
LibreOffice : 20 Documents To PDF
R Benchmark 2.5: Overall mean
| Cinebench R20 / CPU (Single Core) | |
| Média da turma Office (345 - 816, n=75, últimos 2 anos) | |
| HP ProBook 455 G7-175W8EA | |
| Lenovo ThinkPad E15 20RD0011GE | |
| Dell Latitude 15 5510-D90XK | |
| Média Intel Core i5-10310U (411 - 438, n=5) | |
| Acer TravelMate P215-52 | |
| Schenker VIA 15 | |
| Cinebench R20 / CPU (Multi Core) | |
| Média da turma Office (648 - 8840, n=75, últimos 2 anos) | |
| HP ProBook 455 G7-175W8EA | |
| Schenker VIA 15 | |
| Média Intel Core i5-10310U (1192 - 1588, n=5) | |
| Dell Latitude 15 5510-D90XK | |
| Lenovo ThinkPad E15 20RD0011GE | |
| Acer TravelMate P215-52 | |
| Cinebench R15 / CPU Single 64Bit | |
| Média da turma Office (99.5 - 316, n=77, últimos 2 anos) | |
| HP ProBook 455 G7-175W8EA | |
| Lenovo ThinkPad E15 20RD0011GE | |
| Dell Latitude 15 5510-D90XK | |
| Média Intel Core i5-10310U (164 - 173.8, n=5) | |
| Acer TravelMate P215-52 | |
| Schenker VIA 15 | |
| Cinebench R15 / CPU Multi 64Bit | |
| Média da turma Office (250 - 3380, n=77, últimos 2 anos) | |
| HP ProBook 455 G7-175W8EA | |
| Schenker VIA 15 | |
| Média Intel Core i5-10310U (499 - 767, n=5) | |
| Lenovo ThinkPad E15 20RD0011GE | |
| Dell Latitude 15 5510-D90XK | |
| Acer TravelMate P215-52 | |
| Blender / v2.79 BMW27 CPU | |
| Dell Latitude 15 5510-D90XK | |
| Acer TravelMate P215-52 | |
| Média Intel Core i5-10310U (683 - 896, n=5) | |
| Lenovo ThinkPad E15 20RD0011GE | |
| Schenker VIA 15 | |
| HP ProBook 455 G7-175W8EA | |
| Média da turma Office (158 - 1940, n=76, últimos 2 anos) | |
| 7-Zip 18.03 / 7z b 4 -mmt1 | |
| Média da turma Office (3387 - 6469, n=77, últimos 2 anos) | |
| Lenovo ThinkPad E15 20RD0011GE | |
| Acer TravelMate P215-52 | |
| Dell Latitude 15 5510-D90XK | |
| HP ProBook 455 G7-175W8EA | |
| Média Intel Core i5-10310U (3615 - 4398, n=5) | |
| Schenker VIA 15 | |
| 7-Zip 18.03 / 7z b 4 | |
| Média da turma Office (7098 - 76886, n=77, últimos 2 anos) | |
| HP ProBook 455 G7-175W8EA | |
| Média Intel Core i5-10310U (15976 - 19935, n=5) | |
| Lenovo ThinkPad E15 20RD0011GE | |
| Schenker VIA 15 | |
| Acer TravelMate P215-52 | |
| Dell Latitude 15 5510-D90XK | |
| Geekbench 5.5 / Single-Core | |
| Média da turma Office (811 - 2175, n=73, últimos 2 anos) | |
| Lenovo ThinkPad E15 20RD0011GE | |
| Dell Latitude 15 5510-D90XK | |
| HP ProBook 455 G7-175W8EA | |
| Acer TravelMate P215-52 | |
| Média Intel Core i5-10310U (1040 - 1128, n=6) | |
| Schenker VIA 15 | |
| Geekbench 5.5 / Multi-Core | |
| Média da turma Office (1483 - 16999, n=73, últimos 2 anos) | |
| HP ProBook 455 G7-175W8EA | |
| Dell Latitude 15 5510-D90XK | |
| Média Intel Core i5-10310U (2821 - 3854, n=6) | |
| Lenovo ThinkPad E15 20RD0011GE | |
| Schenker VIA 15 | |
| Acer TravelMate P215-52 | |
| HWBOT x265 Benchmark v2.2 / 4k Preset | |
| Média da turma Office (2.21 - 26, n=76, últimos 2 anos) | |
| HP ProBook 455 G7-175W8EA | |
| Lenovo ThinkPad E15 20RD0011GE | |
| Média Intel Core i5-10310U (3.88 - 5.35, n=5) | |
| Acer TravelMate P215-52 | |
| Schenker VIA 15 | |
| Dell Latitude 15 5510-D90XK | |
| LibreOffice / 20 Documents To PDF | |
| HP ProBook 455 G7-175W8EA | |
| Média Intel Core i5-10310U (60 - 71.4, n=5) | |
| Dell Latitude 15 5510-D90XK | |
| Média da turma Office (39.9 - 102.3, n=76, últimos 2 anos) | |
| Acer TravelMate P215-52 | |
| R Benchmark 2.5 / Overall mean | |
| Schenker VIA 15 | |
| Média Intel Core i5-10310U (0.703 - 0.806, n=5) | |
| Acer TravelMate P215-52 | |
| Dell Latitude 15 5510-D90XK | |
| Lenovo ThinkPad E15 20RD0011GE | |
| HP ProBook 455 G7-175W8EA | |
| Média da turma Office (0.393 - 0.888, n=76, últimos 2 anos) | |
* ... menor é melhor
| PCMark 10 Score | 4155 pontos | |
Ajuda | ||
| DPC Latencies / LatencyMon - interrupt to process latency (max), Web, Youtube, Prime95 | |
| Dell Latitude 15 5510-D90XK | |
| Acer TravelMate P215-52 | |
| HP ProBook 455 G7-175W8EA | |
* ... menor é melhor
| Dell Latitude 15 5510-D90XK SK Hynix BC511 HFM512GDJTNI | Schenker VIA 15 Samsung SSD 970 EVO Plus 500GB | Acer TravelMate P215-52 SK hynix BC511 HFM256GDJTNI-82A0 | HP ProBook 455 G7-175W8EA Samsung PM991 MZVLQ512HALU | Lenovo ThinkPad E15 20RD0011GE Samsung PM991 MZALQ512HALU | Média SK Hynix BC511 HFM512GDJTNI | |
|---|---|---|---|---|---|---|
| CrystalDiskMark 5.2 / 6 | 76% | -1% | 9% | 25% | 6% | |
| Write 4K (MB/s) | 121 | 164.5 36% | 153.7 27% | 141.9 17% | 144.4 19% | 111 ? -8% |
| Read 4K (MB/s) | 42.39 | 46.88 11% | 60.4 42% | 37.25 -12% | 52.3 23% | 42.6 ? 0% |
| Write Seq (MB/s) | 1034 | 2659 157% | 431 -58% | 998 -3% | 946 -9% | 1037 ? 0% |
| Read Seq (MB/s) | 1063 | 2623 147% | 1199 13% | 1233 16% | 1608 51% | 1100 ? 3% |
| Write 4K Q32T1 (MB/s) | 351.4 | 310.9 -12% | 374.5 7% | 338.4 -4% | 592 68% | 410 ? 17% |
| Read 4K Q32T1 (MB/s) | 334.3 | 351.2 5% | 445.5 33% | 431.1 29% | 397.7 19% | 444 ? 33% |
| Write Seq Q32T1 (MB/s) | 1059 | 3236 206% | 408.4 -61% | 1367 29% | 1364 29% | 1072 ? 1% |
| Read Seq Q32T1 (MB/s) | 2290 | 3547 55% | 1966 -14% | 2355 3% | 2301 0% | 2269 ? -1% |
| Write 4K Q8T8 (MB/s) | 877 | |||||
| Read 4K Q8T8 (MB/s) | 518 | |||||
| AS SSD | 83% | -55% | 16% | 8% | 5% | |
| Seq Read (MB/s) | 1172 | 2817 140% | 1770 51% | 1929 65% | 1918 64% | 1458 ? 24% |
| Seq Write (MB/s) | 678 | 2392 253% | 354.5 -48% | 1199 77% | 802 18% | 900 ? 33% |
| 4K Read (MB/s) | 47.35 | 53.5 13% | 38.18 -19% | 43.9 -7% | 49.89 5% | 49 ? 3% |
| 4K Write (MB/s) | 115.7 | 129.4 12% | 95.9 -17% | 116.2 0% | 151.7 31% | 114.9 ? -1% |
| 4K-64 Read (MB/s) | 786 | 1280 63% | 423.4 -46% | 897 14% | 830 6% | 776 ? -1% |
| 4K-64 Write (MB/s) | 718 | 1649 130% | 141.1 -80% | 801 12% | 736 3% | 744 ? 4% |
| Access Time Read * (ms) | 0.049 | 0.041 16% | 0.071 -45% | 0.069 -41% | 0.095 -94% | 0.061 ? -24% |
| Access Time Write * (ms) | 0.034 | 0.034 -0% | 0.117 -244% | 0.033 3% | 0.025 26% | 0.03329 ? 2% |
| Score Read (Points) | 951 | 1616 70% | 639 -33% | 1134 19% | 1072 13% | 970 ? 2% |
| Score Write (Points) | 902 | 2018 124% | 272 -70% | 1037 15% | 968 7% | 949 ? 5% |
| Score Total (Points) | 2326 | 4446 91% | 1178 -49% | 2723 17% | 2545 9% | 2401 ? 3% |
| Média Total (Programa/Configurações) | 80% /
80% | -28% /
-32% | 13% /
13% | 17% /
15% | 6% /
5% |
* ... menor é melhor

Continuous load read: DiskSpd Read Loop, Queue Depth 8
| 3DMark 11 - 1280x720 Performance GPU | |
| Média da turma Office (2551 - 18313, n=72, últimos 2 anos) | |
| Lenovo ThinkPad E15 20RD0011GE | |
| HP ProBook 455 G7-175W8EA | |
| Schenker VIA 15 | |
| Dell Latitude 15 5510-D90XK | |
| Acer TravelMate P215-52 | |
| Média Intel UHD Graphics 620 (1144 - 3432, n=244) | |
| 3DMark 11 Performance | 2001 pontos | |
| 3DMark Cloud Gate Standard Score | 8445 pontos | |
| 3DMark Fire Strike Score | 1063 pontos | |
Ajuda | ||
| X-Plane 11.11 | |
| 1280x720 low (fps_test=1) | |
| Média da turma Office (20.7 - 105.6, n=73, últimos 2 anos) | |
| HP ProBook 455 G7-175W8EA | |
| Schenker VIA 15 | |
| Acer TravelMate P215-52 | |
| Média Intel UHD Graphics 620 (8.45 - 31.1, n=83) | |
| Dell Latitude 15 5510-D90XK | |
| 1920x1080 med (fps_test=2) | |
| Média da turma Office (13.4 - 94.8, n=69, últimos 2 anos) | |
| HP ProBook 455 G7-175W8EA | |
| Schenker VIA 15 | |
| Acer TravelMate P215-52 | |
| Média Intel UHD Graphics 620 (7.45 - 22.7, n=82) | |
| Dell Latitude 15 5510-D90XK | |
| Far Cry 5 - 1280x720 Low Preset AA:T | |
| Média da turma Office (38 - 99, n=13, últimos 2 anos) | |
| Lenovo ThinkPad E15 20RD0011GE | |
| HP ProBook 455 G7-175W8EA | |
| Média Intel UHD Graphics 620 (6 - 16, n=12) | |
| Dell Latitude 15 5510-D90XK | |
| baixo | média | alto | ultra | |
|---|---|---|---|---|
| Dota 2 Reborn (2015) | 70.5 | 38.8 | 18.4 | 16.2 |
| X-Plane 11.11 (2018) | 8.45 | 7.57 | 8.94 | |
| Far Cry 5 (2018) | 12 |
Barulho
| Ocioso |
| 24.5 / 24.5 / 24.5 dB |
| Carga |
| 30.1 / 33.9 dB |
 | ||
30 dB silencioso 40 dB(A) audível 50 dB(A) ruidosamente alto |
||
min: | ||
(-) A temperatura máxima no lado superior é 46.2 °C / 115 F, em comparação com a média de 34.3 °C / 94 F , variando de 21.2 a 62.5 °C para a classe Office.
(+) A parte inferior aquece até um máximo de 35.5 °C / 96 F, em comparação com a média de 36.8 °C / 98 F
(+) Em uso inativo, a temperatura média para o lado superior é 27.2 °C / 81 F, em comparação com a média do dispositivo de 29.5 °C / ### class_avg_f### F.
(+) Os apoios para as mãos e o touchpad são mais frios que a temperatura da pele, com um máximo de 28.6 °C / 83.5 F e, portanto, são frios ao toque.
(±) A temperatura média da área do apoio para as mãos de dispositivos semelhantes foi 27.5 °C / 81.5 F (-1.1 °C / -2 F).
Dell Latitude 15 5510-D90XK análise de áudio
(±) | o volume do alto-falante é médio, mas bom (###valor### dB)
Graves 100 - 315Hz
(-) | quase nenhum baixo - em média 23.5% menor que a mediana
(±) | a linearidade dos graves é média (10.1% delta para a frequência anterior)
Médios 400 - 2.000 Hz
(+) | médios equilibrados - apenas 4.2% longe da mediana
(+) | médios são lineares (6.9% delta para frequência anterior)
Altos 2 - 16 kHz
(+) | agudos equilibrados - apenas 3.1% longe da mediana
(+) | os máximos são lineares (3.2% delta da frequência anterior)
Geral 100 - 16.000 Hz
(±) | a linearidade do som geral é média (16.5% diferença em relação à mediana)
Comparado com a mesma classe
» 21% de todos os dispositivos testados nesta classe foram melhores, 7% semelhantes, 72% piores
» O melhor teve um delta de 7%, a média foi 21%, o pior foi 53%
Comparado com todos os dispositivos testados
» 28% de todos os dispositivos testados foram melhores, 6% semelhantes, 66% piores
» O melhor teve um delta de 4%, a média foi 23%, o pior foi 134%
Apple MacBook 12 (Early 2016) 1.1 GHz análise de áudio
(+) | os alto-falantes podem tocar relativamente alto (###valor### dB)
Graves 100 - 315Hz
(±) | graves reduzidos - em média 11.3% menor que a mediana
(±) | a linearidade dos graves é média (14.2% delta para a frequência anterior)
Médios 400 - 2.000 Hz
(+) | médios equilibrados - apenas 2.4% longe da mediana
(+) | médios são lineares (5.5% delta para frequência anterior)
Altos 2 - 16 kHz
(+) | agudos equilibrados - apenas 2% longe da mediana
(+) | os máximos são lineares (4.5% delta da frequência anterior)
Geral 100 - 16.000 Hz
(+) | o som geral é linear (10.2% diferença em relação à mediana)
Comparado com a mesma classe
» 7% de todos os dispositivos testados nesta classe foram melhores, 2% semelhantes, 90% piores
» O melhor teve um delta de 5%, a média foi 18%, o pior foi 53%
Comparado com todos os dispositivos testados
» 5% de todos os dispositivos testados foram melhores, 1% semelhantes, 94% piores
» O melhor teve um delta de 4%, a média foi 23%, o pior foi 134%
| desligado | |
| Ocioso | |
| Carga |
|
Key:
min: | |
| Dell Latitude 15 5510-D90XK i5-10310U, UHD Graphics 620, SK Hynix BC511 HFM512GDJTNI, IPS, 1920x1080, 15.6" | Schenker VIA 15 R5 3500U, Vega 8, Samsung SSD 970 EVO Plus 500GB, IPS, 1920x1080, 15.6" | Acer TravelMate P215-52 i7-10510U, UHD Graphics 620, SK hynix BC511 HFM256GDJTNI-82A0, IPS, 1920x1080, 15.6" | HP ProBook 455 G7-175W8EA R7 4700U, Vega 7, Samsung PM991 MZVLQ512HALU, IPS, 1920x1080, 15.6" | Lenovo ThinkPad E15 20RD0011GE i7-10510U, Radeon RX 640, Samsung PM991 MZALQ512HALU, IPS LED, 1920x1080, 15.6" | Média Intel UHD Graphics 620 | Média da turma Office | |
|---|---|---|---|---|---|---|---|
| Power Consumption | -29% | 9% | -7% | -16% | -3% | -20% | |
| Idle Minimum * (Watt) | 3.6 | 5.7 -58% | 3.5 3% | 3.8 -6% | 3.2 11% | 3.81 ? -6% | 4.26 ? -18% |
| Idle Average * (Watt) | 6.9 | 9.1 -32% | 6.2 10% | 7.7 -12% | 6.8 1% | 6.94 ? -1% | 7.31 ? -6% |
| Idle Maximum * (Watt) | 9.4 | 9.6 -2% | 6.9 27% | 10.5 -12% | 9.5 -1% | 8.75 ? 7% | 8.55 ? 9% |
| Load Average * (Watt) | 34.7 | 33.3 4% | 31 11% | 32 8% | 44 -27% | 35 ? -1% | 43.8 ? -26% |
| Load Maximum * (Watt) | 41 | 63.6 -55% | 43.3 -6% | 45.4 -11% | 66.4 -62% | 47.5 ? -16% | 64.5 ? -57% |
* ... menor é melhor
| Dell Latitude 15 5510-D90XK i5-10310U, UHD Graphics 620, 51 Wh | Schenker VIA 15 R5 3500U, Vega 8, 91 Wh | Acer TravelMate P215-52 i7-10510U, UHD Graphics 620, 48 Wh | HP ProBook 455 G7-175W8EA R7 4700U, Vega 7, 45 Wh | Lenovo ThinkPad E15 20RD0011GE i7-10510U, Radeon RX 640, 45 Wh | Média da turma Office | |
|---|---|---|---|---|---|---|
| Duração da bateria | 26% | -18% | -38% | -33% | -4% | |
| Reader / Idle (h) | 23.5 | 25.1 7% | 12.6 -46% | 24.5 ? 4% | ||
| WiFi v1.3 (h) | 10.6 | 13.4 26% | 7.9 -25% | 7.6 -28% | 7.5 -29% | 13.2 ? 25% |
| Load (h) | 3 | 1.9 -37% | 1.8 -40% | 1.9 -37% | 1.808 ? -40% |
Pro
Contra
Veredicto - O Latitude 15 5510 ganha pontos com longa duração da bateria
O Dell Latitude 15 5510 é um portátil de escritório sólido com muitos recursos opcionais. Isso inclui um leitor de cartão inteligente, bem como o espaço livre para um módulo WWAN com antenas já preparadas. Os dispositivos de entrada são adequados para escrever textos mais longos, pelo menos depois de algum tempo de se acostumar. Para usuários móveis, a longa duração da bateria pode ser um argumento, já que é muito boa com 10,5 horas em nosso teste WiFi.
Com o Latitude 15 5510, a Dell oferece um portátil de escritório sólido com muitos recursos empresariais.
Também no lado positivo estão as taxas de transferência de WLAN rápidas e o leitor de cartão microSD rápido. No entanto, os usuários que desejam trabalhar em exteriores provavelmente fiquem desapontados com o baixo brilho. Basicamente, o Latitude 15 também oferece boas possibilidades de manutenção, o que significa que a RAM pode ser estendida e o dispositivo de armazenamento massivo pode ser trocado. O último pode ser feito via baia M.2 ou porta SATA, mas infelizmente, essas portas não podem ser usadas ao mesmo tempo.
Dell Latitude 15 5510-D90XK
- 10/18/2020 v7 (old)
Mike Wobker
Price comparison
