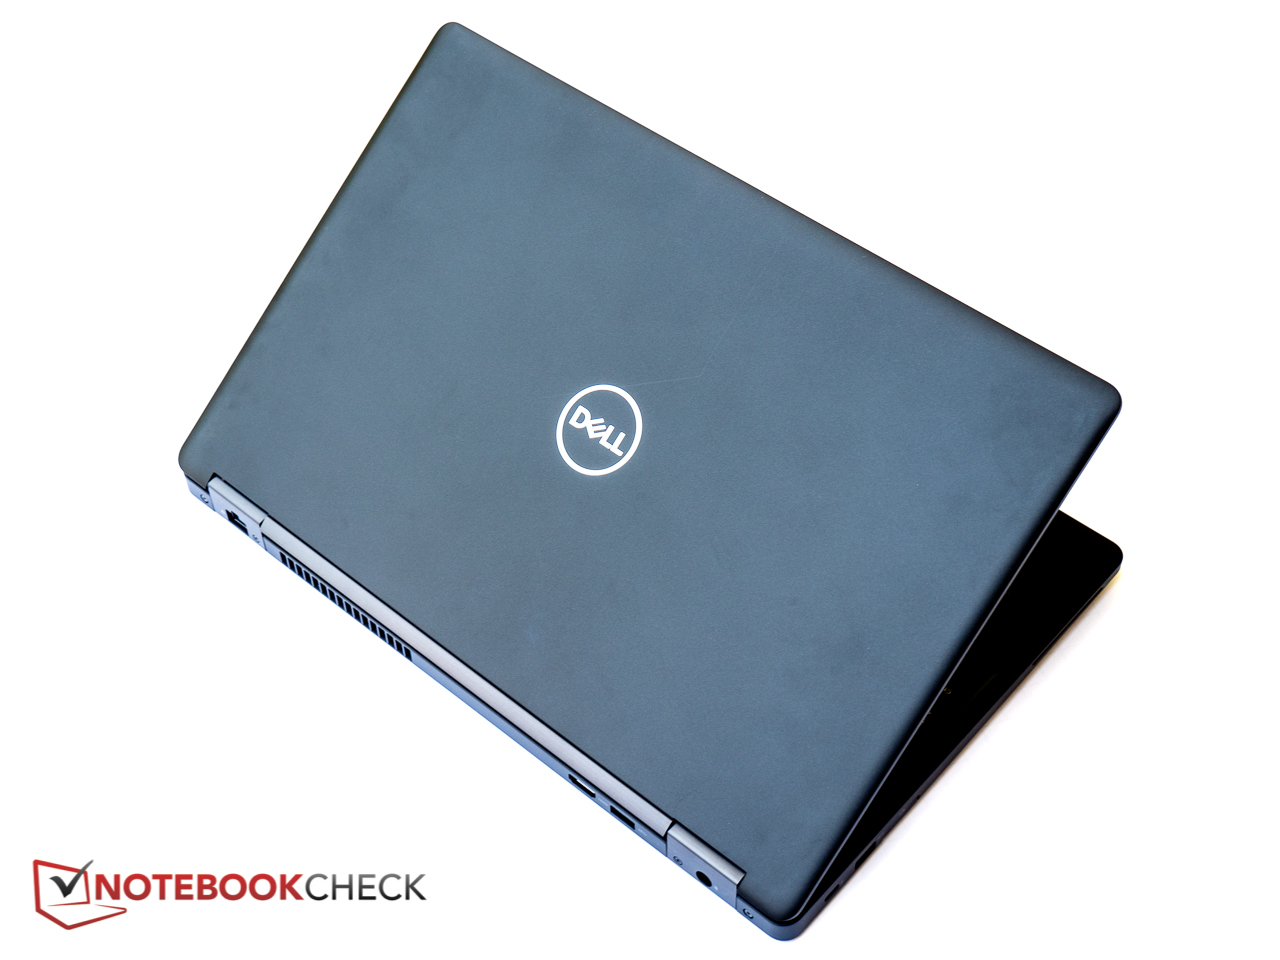
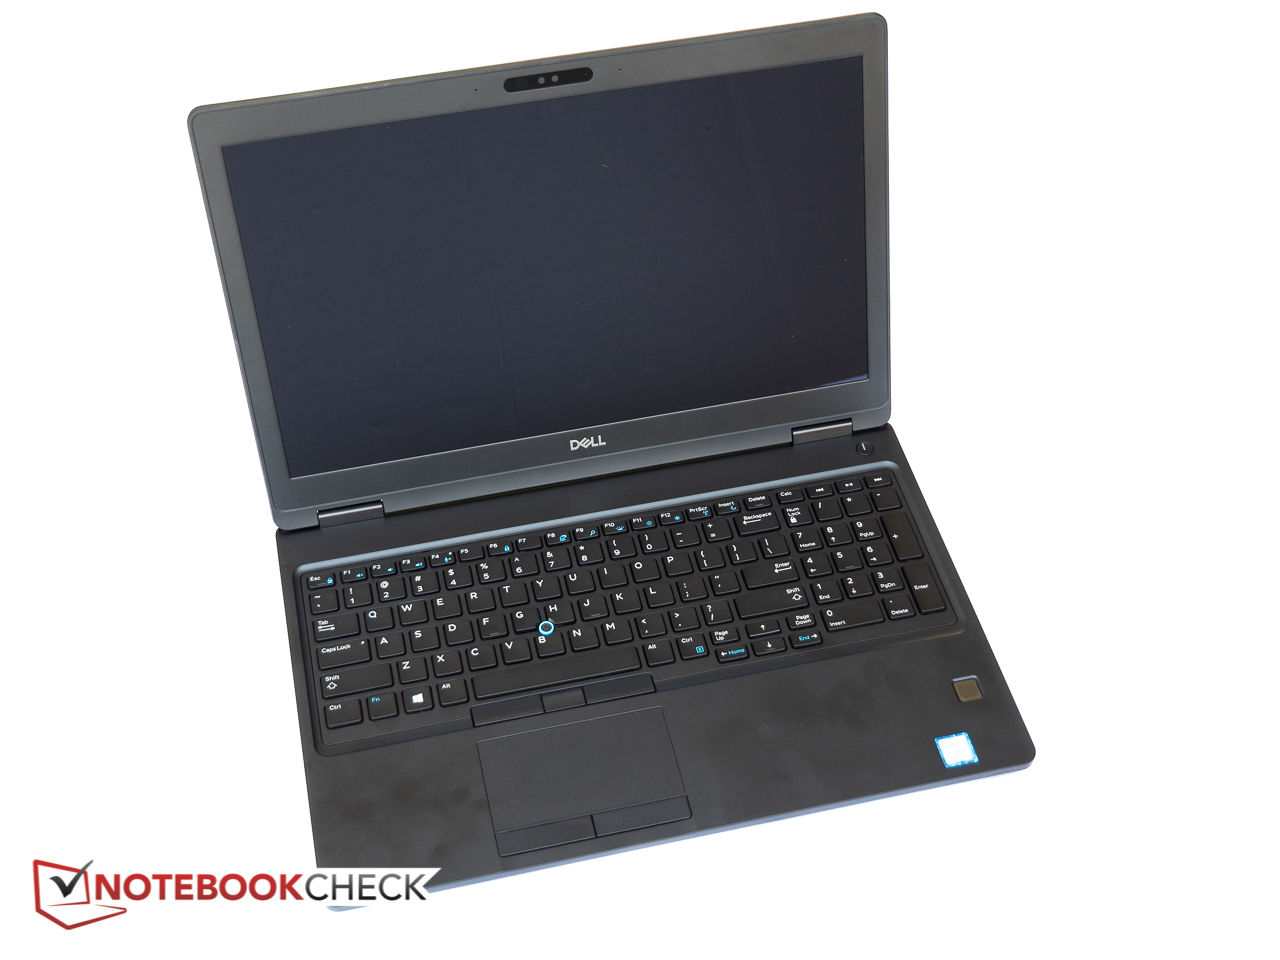
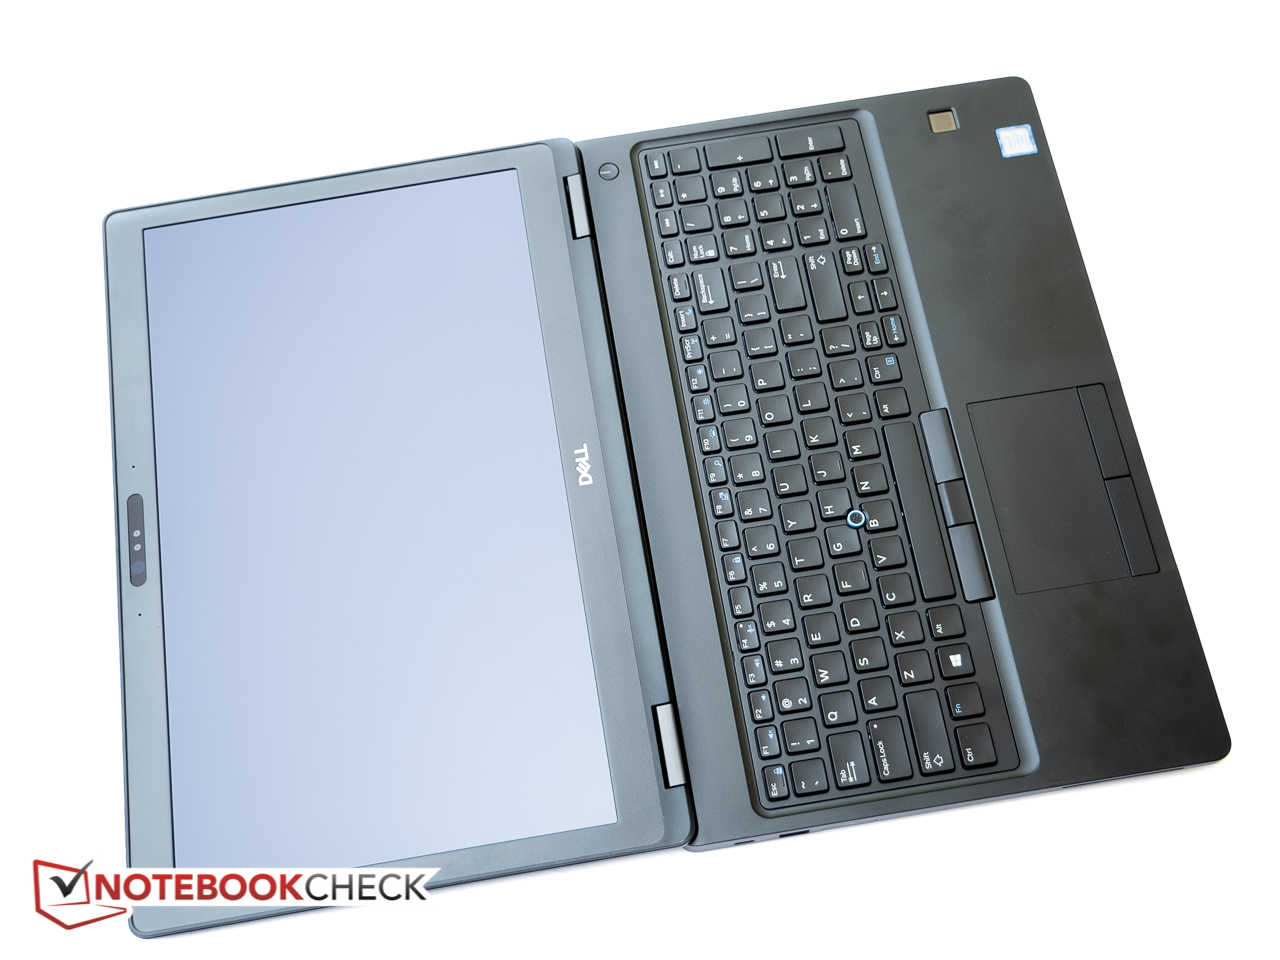
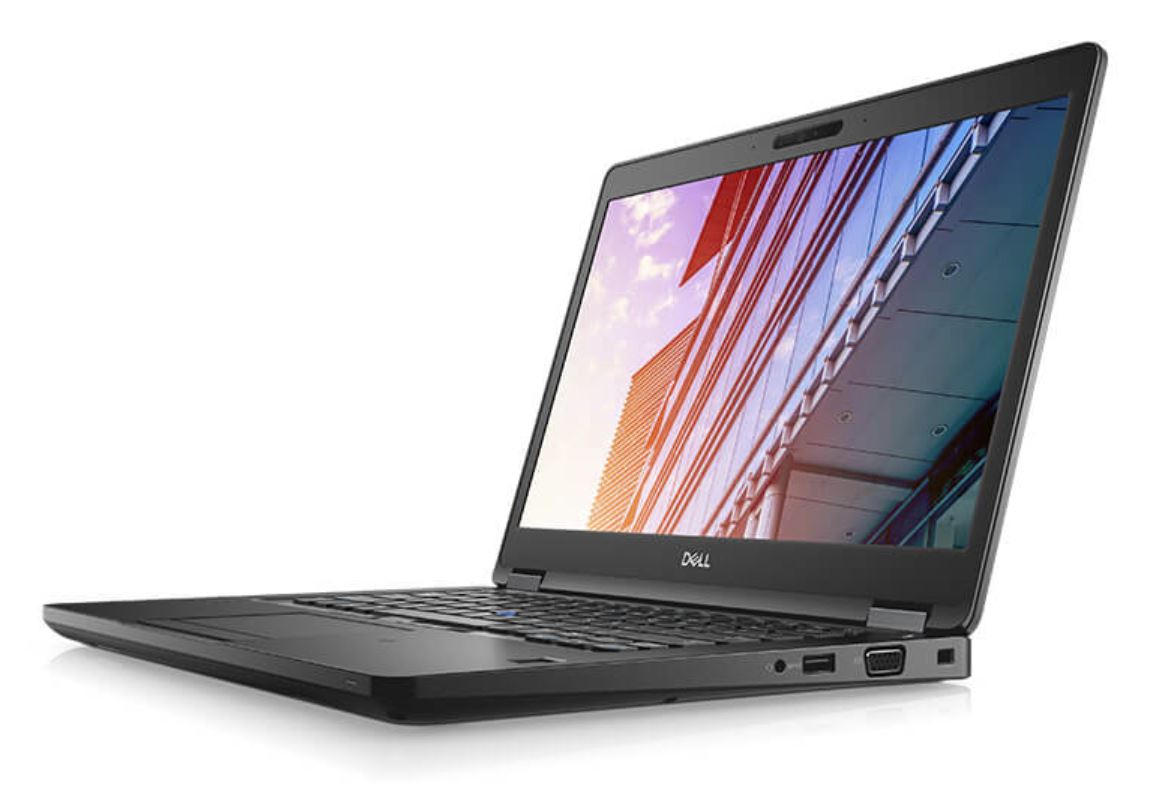
Breve Análise do Portátil Dell Latitude 5591 (8750H, MX130, Touchscreen)
| SD Card Reader | |
| average JPG Copy Test (av. of 3 runs) | |
| Dell Latitude 5590 (Toshiba Exceria Pro SDXC 64 GB UHS-II) | |
| Dell Latitude 5591 (Toshiba Exceria Pro SDXC 64 GB UHS-II) | |
| Dell XPS 15 2018 i5 FHD 97Wh | |
| Lenovo ThinkPad T580-20LAS01H00 (Toshiba Exceria Pro SDXC 64 GB UHS-II) | |
| Acer TravelMate 2410-G2-MG-82E6 (Toshiba Exceria Pro SDXC 64 GB UHS-II) | |
| maximum AS SSD Seq Read Test (1GB) | |
| Dell Latitude 5591 (Toshiba Exceria Pro SDXC 64 GB UHS-II) | |
| Dell Latitude 5590 (Toshiba Exceria Pro SDXC 64 GB UHS-II) | |
| Dell XPS 15 2018 i5 FHD 97Wh | |
| Lenovo ThinkPad T580-20LAS01H00 (Toshiba Exceria Pro SDXC 64 GB UHS-II) | |
| Acer TravelMate 2410-G2-MG-82E6 (Toshiba Exceria Pro SDXC 64 GB UHS-II) | |
| Networking | |
| iperf3 transmit AX12 | |
| Dell Latitude 5591 | |
| HP EliteBook 850 G5 3JX58EA | |
| Acer TravelMate 2410-G2-MG-82E6 | |
| Dell XPS 15 2018 i5 FHD 97Wh | |
| Dell Latitude 5590 | |
| Lenovo ThinkPad T580-20LAS01H00 | |
| iperf3 receive AX12 | |
| Dell Latitude 5591 | |
| Lenovo ThinkPad T580-20LAS01H00 | |
| Dell XPS 15 2018 i5 FHD 97Wh | |
| HP EliteBook 850 G5 3JX58EA | |
| Acer TravelMate 2410-G2-MG-82E6 | |
| Dell Latitude 5590 | |
| |||||||||||||||||||||||||
iluminação: 88 %
iluminação com acumulador: 245.4 cd/m²
Contraste: 944:1 (Preto: 0.26 cd/m²)
ΔE ColorChecker Calman: 5.36 | ∀{0.5-29.43 Ø4.71}
calibrated: 4.06
ΔE Greyscale Calman: 3.5 | ∀{0.09-98 Ø4.96}
58.1% sRGB (Argyll 1.6.3 3D)
40% AdobeRGB 1998 (Argyll 1.6.3 3D)
40.03% AdobeRGB 1998 (Argyll 3D)
58.1% sRGB (Argyll 3D)
38.74% Display P3 (Argyll 3D)
Gamma: 2.53
CCT: 6430 K
| Dell Latitude 5591 AU Optronics B156HW03, IPS, 15.6", 1920x1080 | HP EliteBook 850 G5 3JX58EA AUO24ED, IPS LED, 15.6", 1920x1080 | Lenovo ThinkPad T580-20LAS01H00 NV156QUM-N44, IPS LED, 15.6", 3840x2160 | Acer TravelMate 2410-G2-MG-82E6 CMN N140HCA-EAB, IPS, 14", 1920x1080 | Dell Latitude 5590 NV15N42, IPS, 15.6", 1920x1080 | HP EliteBook 755 G5 3UN79EA BOE074E, IPS, 15.6", 1920x1080 | |
|---|---|---|---|---|---|---|
| Display | 59% | 67% | 4% | 7% | 64% | |
| Display P3 Coverage (%) | 38.74 | 63.4 64% | 69.2 79% | 40.28 4% | 41.56 7% | 66.9 73% |
| sRGB Coverage (%) | 58.1 | 88.8 53% | 90.7 56% | 60.4 4% | 61.3 6% | 90.2 55% |
| AdobeRGB 1998 Coverage (%) | 40.03 | 64.4 61% | 66.3 66% | 41.65 4% | 42.93 7% | 66.1 65% |
| Response Times | 6% | -14% | 17% | -35% | -5% | |
| Response Time Grey 50% / Grey 80% * (ms) | 45.2 ? | 42 ? 7% | 51.2 ? -13% | 34 ? 25% | 53.2 ? -18% | 39 ? 14% |
| Response Time Black / White * (ms) | 26 ? | 25 ? 4% | 29.6 ? -14% | 24 ? 8% | 39.6 ? -52% | 32 ? -23% |
| PWM Frequency (Hz) | 952 ? | 25000 ? | 1000 ? | 21000 ? | ||
| Screen | 17% | 34% | 7% | -5% | -6% | |
| Brightness middle (cd/m²) | 245.4 | 402 64% | 310 26% | 265 8% | 243 -1% | 456 86% |
| Brightness (cd/m²) | 234 | 383 64% | 283 21% | 239 2% | 234 0% | 410 75% |
| Brightness Distribution (%) | 88 | 88 0% | 87 -1% | 85 -3% | 83 -6% | 84 -5% |
| Black Level * (cd/m²) | 0.26 | 0.41 -58% | 0.24 8% | 0.37 -42% | 0.19 27% | 0.62 -138% |
| Contrast (:1) | 944 | 980 4% | 1292 37% | 716 -24% | 1279 35% | 735 -22% |
| Colorchecker dE 2000 * | 5.36 | 5.25 2% | 3.1 42% | 3.93 27% | 6.6 -23% | 7.09 -32% |
| Colorchecker dE 2000 max. * | 19.31 | 8.65 55% | 7.6 61% | 8.79 54% | 22.3 -15% | 12.64 35% |
| Colorchecker dE 2000 calibrated * | 4.06 | 5.19 -28% | 2.2 46% | 3.13 23% | 5 -23% | |
| Greyscale dE 2000 * | 3.5 | 4 -14% | 2.3 34% | 2.29 35% | 5.2 -49% | 9.15 -161% |
| Gamma | 2.53 87% | 2.68 82% | 2.21 100% | 2.33 94% | 2.24 98% | 2.31 95% |
| CCT | 6430 101% | 6756 96% | 6876 95% | 6951 94% | 6990 93% | 7195 90% |
| Color Space (Percent of AdobeRGB 1998) (%) | 40 | 58 45% | 59.1 48% | 38 -5% | 39.2 -2% | 59 48% |
| Color Space (Percent of sRGB) (%) | 58.1 | 89 53% | 90.1 55% | 60 3% | 60.8 5% | 90 55% |
| Média Total (Programa/Configurações) | 27% /
24% | 29% /
34% | 9% /
8% | -11% /
-6% | 18% /
8% |
* ... menor é melhor
Exibir tempos de resposta
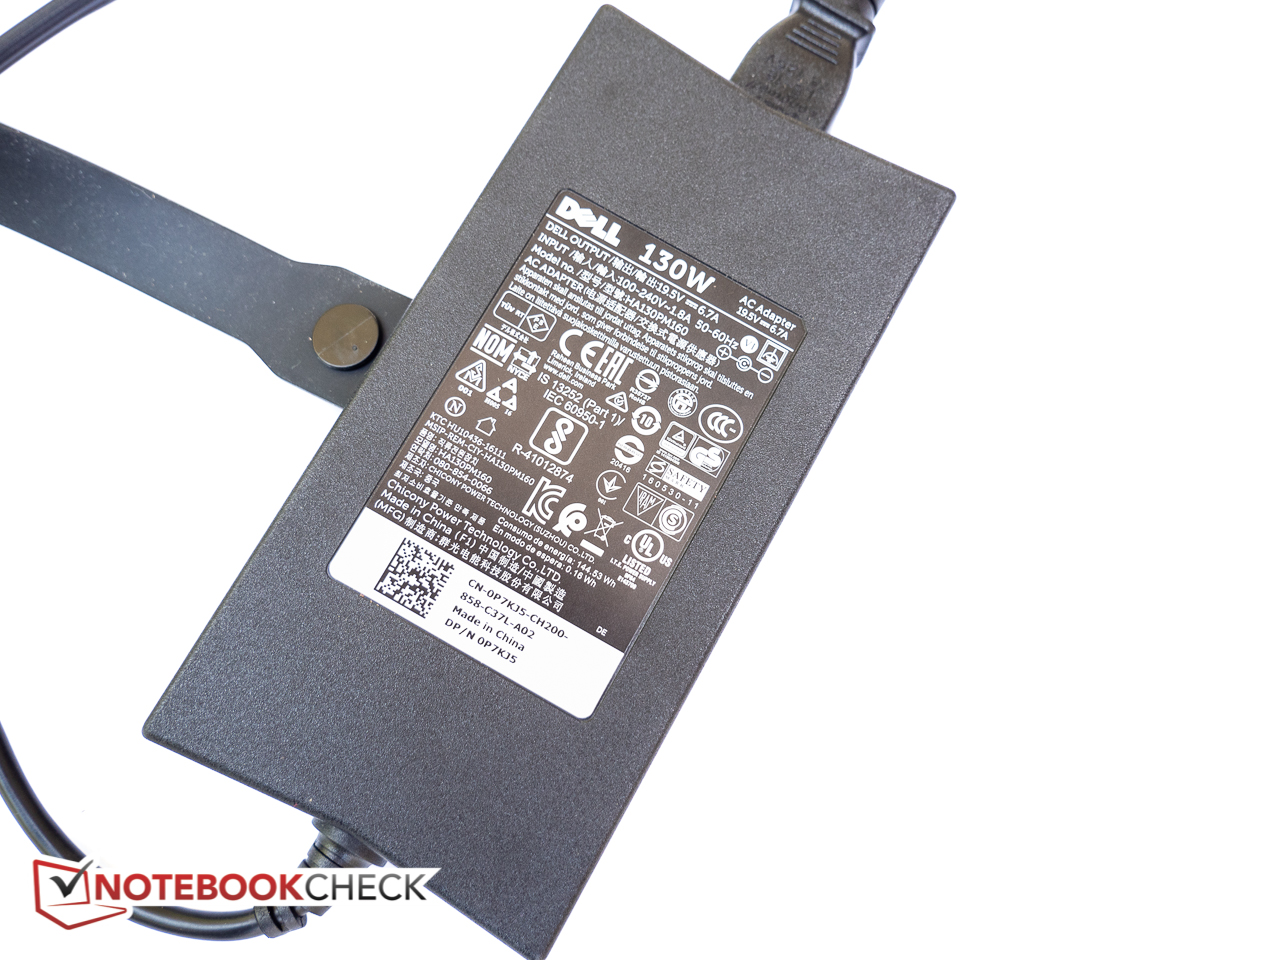
| ↔ Tempo de resposta preto para branco | ||
|---|---|---|
| 26 ms ... ascensão ↗ e queda ↘ combinadas | ↗ 15.2 ms ascensão | 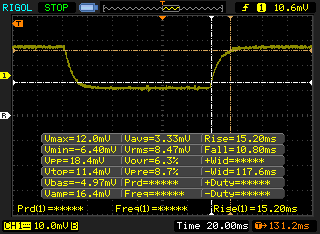 |
| ↘ 10.8 ms queda | ||
| A tela mostra taxas de resposta relativamente lentas em nossos testes e pode ser muito lenta para os jogadores. Em comparação, todos os dispositivos testados variam de 0.1 (mínimo) a 240 (máximo) ms. » 63 % de todos os dispositivos são melhores. Isso significa que o tempo de resposta medido é pior que a média de todos os dispositivos testados (19.8 ms). | ||
| ↔ Tempo de resposta 50% cinza a 80% cinza | ||
| 45.2 ms ... ascensão ↗ e queda ↘ combinadas | ↗ 26.8 ms ascensão | 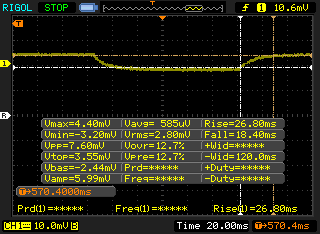 |
| ↘ 18.4 ms queda | ||
| A tela mostra taxas de resposta lentas em nossos testes e será insatisfatória para os jogadores. Em comparação, todos os dispositivos testados variam de 0.165 (mínimo) a 636 (máximo) ms. » 78 % de todos os dispositivos são melhores. Isso significa que o tempo de resposta medido é pior que a média de todos os dispositivos testados (31 ms). | ||
Cintilação da tela / PWM (modulação por largura de pulso)
| Tela tremeluzindo / PWM não detectado |  | ||
[pwm_comparison] Em comparação: 52 % de todos os dispositivos testados não usam PWM para escurecer a tela. Se PWM foi detectado, uma média de 7754 (mínimo: 5 - máximo: 343500) Hz foi medida. | |||
| PCMark 10 - Score | |
| Dell Latitude 5491 | |
| Dell Latitude 5591 | |
| HP EliteBook 850 G5 3JX58EA | |
| Lenovo ThinkPad T580-20LAS01H00 | |
| HP EliteBook 755 G5 3UN79EA | |
| Dell Latitude 5590 | |
| PCMark 8 | |
| Home Score Accelerated v2 | |
| Dell Latitude 5491 | |
| Dell Latitude 5591 | |
| Dell Latitude 5590 | |
| HP EliteBook 850 G5 3JX58EA | |
| HP EliteBook 755 G5 3UN79EA | |
| Lenovo ThinkPad T580-20LAS01H00 | |
| Work Score Accelerated v2 | |
| Dell Latitude 5491 | |
| Dell Latitude 5591 | |
| Dell Latitude 5590 | |
| HP EliteBook 755 G5 3UN79EA | |
| Lenovo ThinkPad T580-20LAS01H00 | |
| PCMark 8 Home Score Accelerated v2 | 4166 pontos | |
| PCMark 8 Work Score Accelerated v2 | 5344 pontos | |
| PCMark 10 Score | 4096 pontos | |
Ajuda | ||
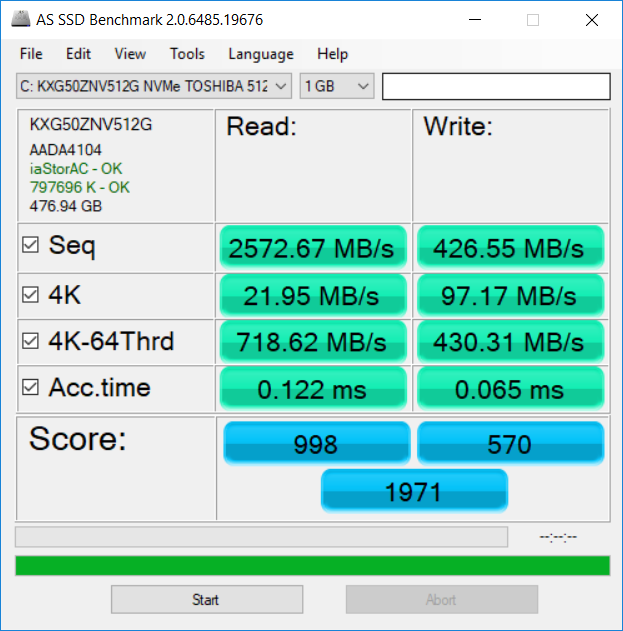
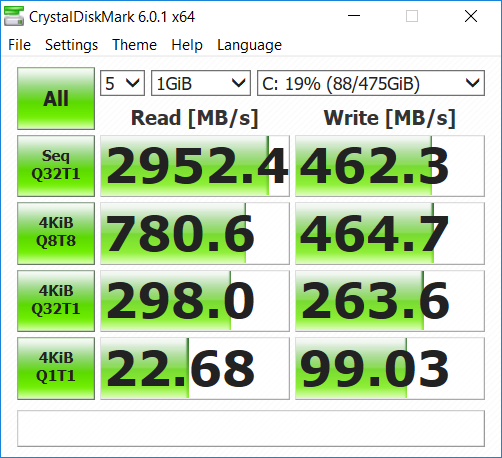
| Dell Latitude 5591 Toshiba XG5 KXG50ZNV512G | HP EliteBook 850 G5 3JX58EA Toshiba XG5 KXG50ZNV256G | Lenovo ThinkPad T580-20LAS01H00 Samsung SSD PM981 MZVLB512HAJQ | Dell Latitude 5590 SK hynix SC311 M.2 | Dell XPS 15 2018 i5 FHD 97Wh Lite-On CA3-8D256-Q11 | |
|---|---|---|---|---|---|
| AS SSD | -14% | 81% | -33% | -128% | |
| Copy Game MB/s (MB/s) | 457.9 | 343.8 -25% | 878 92% | 210 -54% | 465.9 2% |
| Copy Program MB/s (MB/s) | 365.7 | 274.4 -25% | 393.4 8% | 208.6 -43% | 117.2 -68% |
| Copy ISO MB/s (MB/s) | 782 | 337 -57% | 1533 96% | 311.5 -60% | 632 -19% |
| Score Total (Points) | 1971 | 1321 -33% | 3548 80% | 912 -54% | 750 -62% |
| Score Write (Points) | 570 | 444 -22% | 1515 166% | 326 -43% | 58 -90% |
| Score Read (Points) | 998 | 607 -39% | 1342 34% | 385 -61% | 492 -51% |
| Access Time Write * (ms) | 0.065 | 0.054 17% | 0.033 49% | 0.047 28% | 0.889 -1268% |
| Access Time Read * (ms) | 0.122 | 0.091 25% | 0.059 52% | 0.111 9% | 0.086 30% |
| 4K-64 Write (MB/s) | 430.3 | 286.6 -33% | 1278 197% | 212.7 -51% | 19.19 -96% |
| 4K-64 Read (MB/s) | 719 | 418.2 -42% | 1153 60% | 306 -57% | 301.8 -58% |
| 4K Write (MB/s) | 97.2 | 98.6 1% | 110.9 14% | 73.5 -24% | 5.12 -95% |
| 4K Read (MB/s) | 21.95 | 30.94 41% | 51.5 135% | 29.03 32% | 32.5 48% |
| Seq Write (MB/s) | 426.5 | 590 38% | 1262 196% | 393 -8% | 340.3 -20% |
| Seq Read (MB/s) | 2573 | 1579 -39% | 1373 -47% | 503 -80% | 1574 -39% |
* ... menor é melhor

| 3DMark 11 | |
| 1280x720 Performance GPU | |
| Dell XPS 15 2018 i5 FHD 97Wh | |
| Lenovo ThinkPad T580-20LAS01H00 | |
| Dell Latitude 5591 | |
| Média NVIDIA GeForce MX130 (2476 - 3203, n=14) | |
| HP EliteBook 755 G5 3UN79EA | |
| HP EliteBook 850 G5 3JX58EA | |
| Dell Latitude 5590 | |
| 1280x720 Performance Combined | |
| Dell XPS 15 2018 i5 FHD 97Wh | |
| Lenovo ThinkPad T580-20LAS01H00 | |
| Dell Latitude 5591 | |
| Média NVIDIA GeForce MX130 (2169 - 3031, n=13) | |
| HP EliteBook 755 G5 3UN79EA | |
| HP EliteBook 850 G5 3JX58EA | |
| Dell Latitude 5590 | |
| 3DMark | |
| 1280x720 Cloud Gate Standard Graphics | |
| Dell XPS 15 2018 i5 FHD 97Wh | |
| Lenovo ThinkPad T580-20LAS01H00 | |
| Dell Latitude 5591 | |
| Média NVIDIA GeForce MX130 (12166 - 14880, n=13) | |
| HP EliteBook 755 G5 3UN79EA | |
| Dell Latitude 5590 | |
| HP EliteBook 850 G5 3JX58EA | |
| 1920x1080 Fire Strike Graphics | |
| Dell XPS 15 2018 i5 FHD 97Wh | |
| Lenovo ThinkPad T580-20LAS01H00 | |
| Dell Latitude 5591 | |
| Média NVIDIA GeForce MX130 (2149 - 2495, n=13) | |
| HP EliteBook 755 G5 3UN79EA | |
| HP EliteBook 850 G5 3JX58EA | |
| Dell Latitude 5590 | |
| 1920x1080 Ice Storm Extreme Graphics | |
| Média NVIDIA GeForce MX130 (n=1) | |
| Dell Latitude 5590 | |
| 3DMark 11 Performance | 3414 pontos | |
| 3DMark Cloud Gate Standard Score | 13252 pontos | |
| 3DMark Fire Strike Score | 2308 pontos | |
Ajuda | ||
| baixo | média | alto | ultra | |
|---|---|---|---|---|
| BioShock Infinite (2013) | 152.6 | 84.5 | 69 | 25 |
| Rise of the Tomb Raider (2016) | 51 | 31.3 | 16.8 | 13.9 |
Barulho
| Ocioso |
| 29 / 29 / 30.3 dB |
| Carga |
| 46.5 / 48.6 dB |
 | ||
30 dB silencioso 40 dB(A) audível 50 dB(A) ruidosamente alto |
||
min: | ||
| Dell Latitude 5591 GeForce MX130, i7-8850H, Toshiba XG5 KXG50ZNV512G | Lenovo ThinkPad T580-20LAS01H00 GeForce MX150, i5-8550U, Samsung SSD PM981 MZVLB512HAJQ | HP EliteBook 850 G5 3JX58EA UHD Graphics 620, i5-8250U, Toshiba XG5 KXG50ZNV256G | HP EliteBook 755 G5 3UN79EA Vega 10, R7 2700U, Toshiba XG5 KXG50ZNV512G | Acer TravelMate 2410-G2-MG-82E6 GeForce MX130, i5-8550U, SK Hynix HFS256G39TND-N210A | Dell Latitude 5491 GeForce MX130, i7-8850H, Toshiba XG5 KXG50ZNV512G | |
|---|---|---|---|---|---|---|
| Noise | 6% | 7% | 5% | 1% | -1% | |
| desligado / ambiente * (dB) | 29 | 29.3 -1% | 30 -3% | 30.5 -5% | 30.3 -4% | 29.5 -2% |
| Idle Minimum * (dB) | 29 | 29.3 -1% | 30 -3% | 30.5 -5% | 30.8 -6% | 29.5 -2% |
| Idle Average * (dB) | 29 | 29.3 -1% | 30 -3% | 30.5 -5% | 30.8 -6% | 29.5 -2% |
| Idle Maximum * (dB) | 30.3 | 31.8 -5% | 32.2 -6% | 30.5 -1% | 30.8 -2% | 31.5 -4% |
| Load Average * (dB) | 46.5 | 35.8 23% | 33.2 29% | 37.5 19% | 42.7 8% | 46.2 1% |
| Load Maximum * (dB) | 48.6 | 38 22% | 34.2 30% | 35 28% | 39.7 18% | 46.2 5% |
| Witcher 3 ultra * (dB) | 35.8 |
* ... menor é melhor
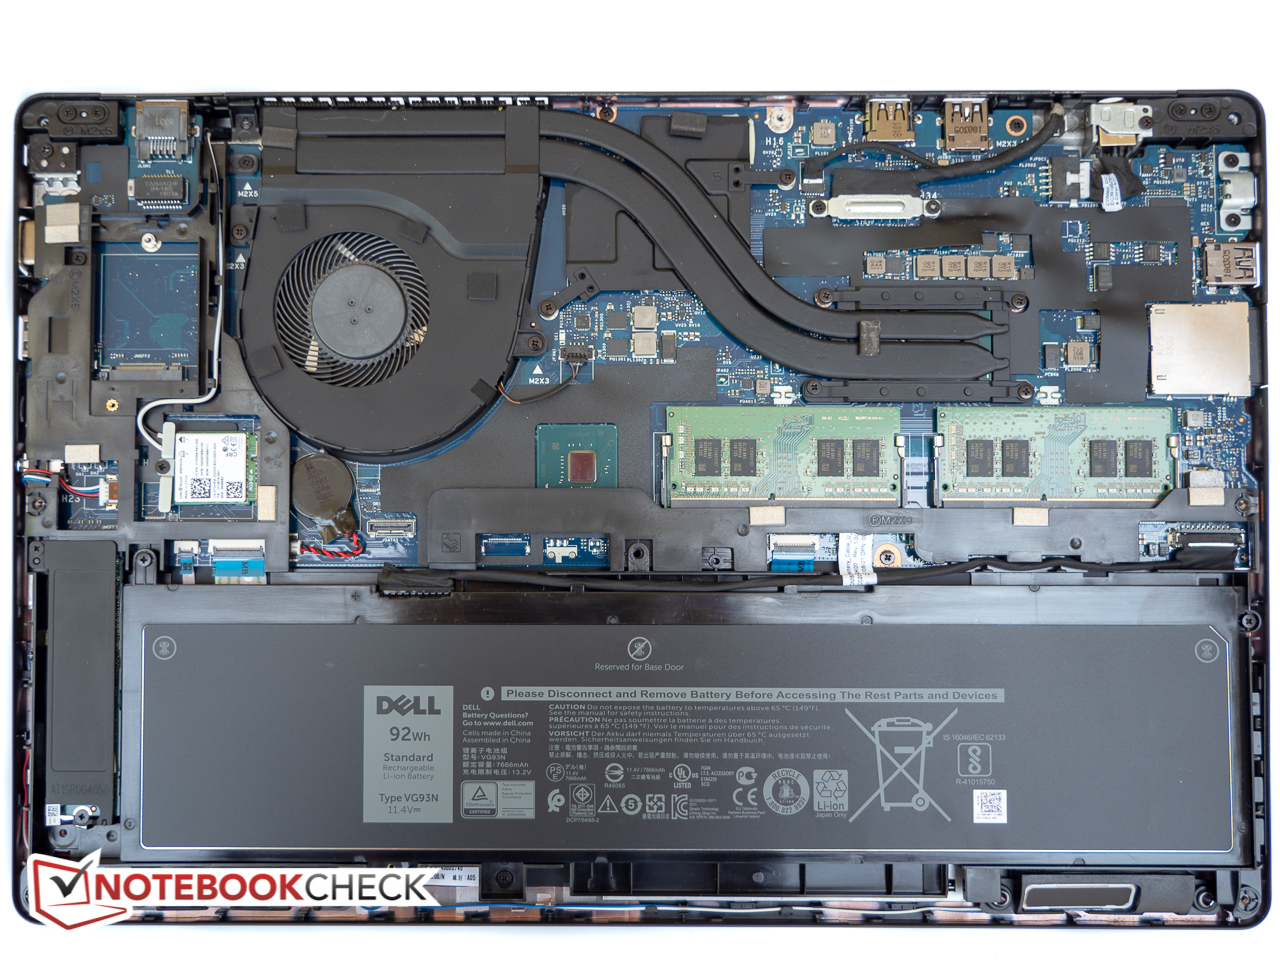
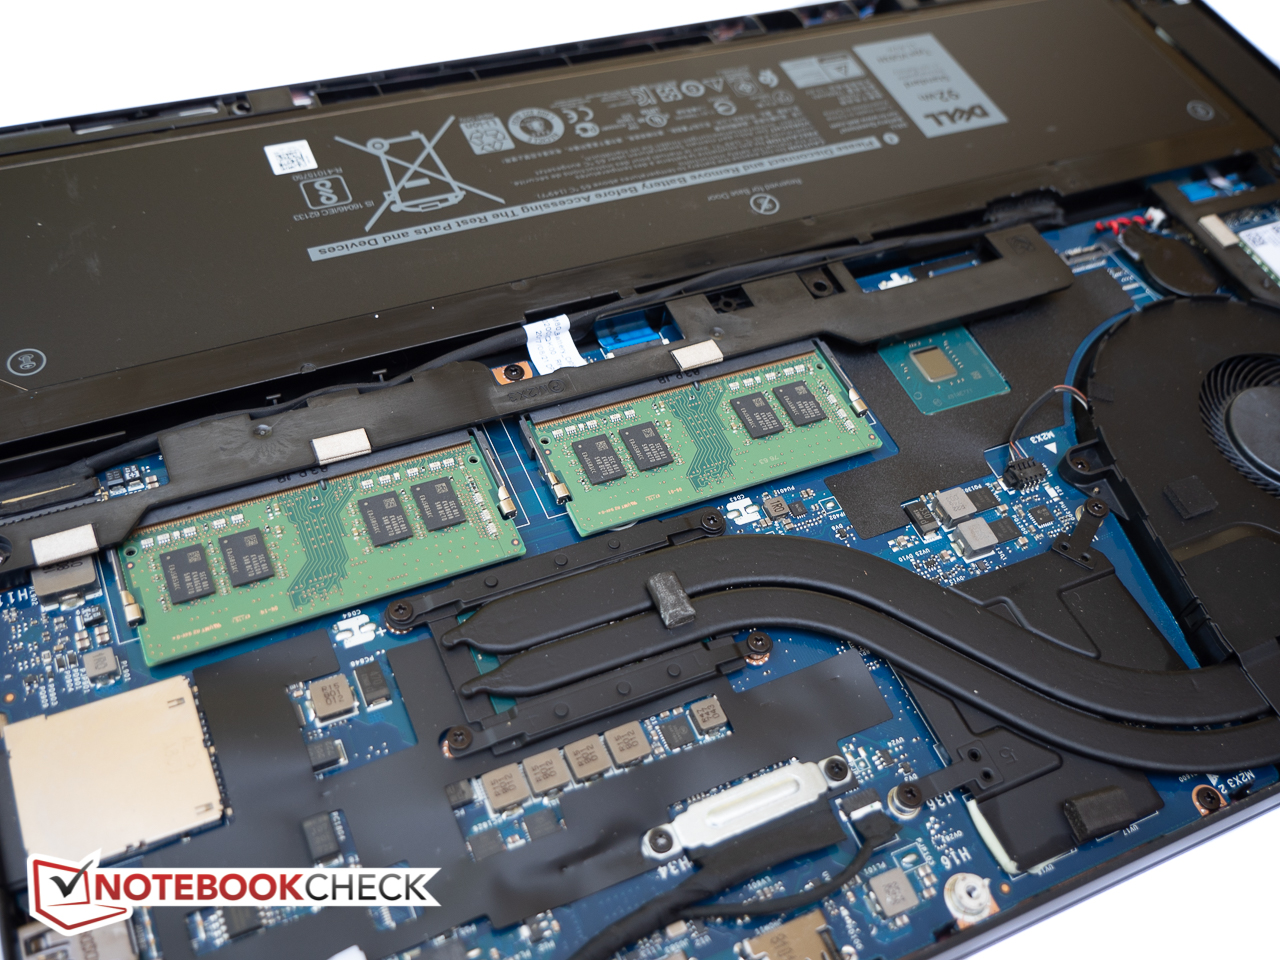
(-) A temperatura máxima no lado superior é 46.4 °C / 116 F, em comparação com a média de 34.3 °C / 94 F , variando de 21.2 a 62.5 °C para a classe Office.
(-) A parte inferior aquece até um máximo de 54.4 °C / 130 F, em comparação com a média de 36.8 °C / 98 F
(+) Em uso inativo, a temperatura média para o lado superior é 26.8 °C / 80 F, em comparação com a média do dispositivo de 29.5 °C / ### class_avg_f### F.
(+) Os apoios para as mãos e o touchpad são mais frios que a temperatura da pele, com um máximo de 25.2 °C / 77.4 F e, portanto, são frios ao toque.
(+) A temperatura média da área do apoio para as mãos de dispositivos semelhantes foi 27.5 °C / 81.5 F (+2.3 °C / 4.1 F).
Dell Latitude 5591 análise de áudio
(±) | o volume do alto-falante é médio, mas bom (###valor### dB)
Graves 100 - 315Hz
(-) | quase nenhum baixo - em média 17.2% menor que a mediana
(±) | a linearidade dos graves é média (14.2% delta para a frequência anterior)
Médios 400 - 2.000 Hz
(±) | médios mais altos - em média 5.3% maior que a mediana
(+) | médios são lineares (6.2% delta para frequência anterior)
Altos 2 - 16 kHz
(+) | agudos equilibrados - apenas 2.2% longe da mediana
(+) | os máximos são lineares (4.2% delta da frequência anterior)
Geral 100 - 16.000 Hz
(±) | a linearidade do som geral é média (17.9% diferença em relação à mediana)
Comparado com a mesma classe
» 30% de todos os dispositivos testados nesta classe foram melhores, 7% semelhantes, 63% piores
» O melhor teve um delta de 7%, a média foi 21%, o pior foi 53%
Comparado com todos os dispositivos testados
» 37% de todos os dispositivos testados foram melhores, 8% semelhantes, 55% piores
» O melhor teve um delta de 4%, a média foi 23%, o pior foi 134%
Apple MacBook 12 (Early 2016) 1.1 GHz análise de áudio
(+) | os alto-falantes podem tocar relativamente alto (###valor### dB)
Graves 100 - 315Hz
(±) | graves reduzidos - em média 11.3% menor que a mediana
(±) | a linearidade dos graves é média (14.2% delta para a frequência anterior)
Médios 400 - 2.000 Hz
(+) | médios equilibrados - apenas 2.4% longe da mediana
(+) | médios são lineares (5.5% delta para frequência anterior)
Altos 2 - 16 kHz
(+) | agudos equilibrados - apenas 2% longe da mediana
(+) | os máximos são lineares (4.5% delta da frequência anterior)
Geral 100 - 16.000 Hz
(+) | o som geral é linear (10.2% diferença em relação à mediana)
Comparado com a mesma classe
» 7% de todos os dispositivos testados nesta classe foram melhores, 2% semelhantes, 90% piores
» O melhor teve um delta de 5%, a média foi 18%, o pior foi 53%
Comparado com todos os dispositivos testados
» 5% de todos os dispositivos testados foram melhores, 1% semelhantes, 94% piores
» O melhor teve um delta de 4%, a média foi 23%, o pior foi 134%
| desligado | |
| Ocioso | |
| Carga |
|
Key:
min: | |
| Dell Latitude 5591 i7-8850H, GeForce MX130, Toshiba XG5 KXG50ZNV512G, IPS, 1920x1080, 15.6" | Lenovo ThinkPad T580-20LAS01H00 i5-8550U, GeForce MX150, Samsung SSD PM981 MZVLB512HAJQ, IPS LED, 3840x2160, 15.6" | Dell XPS 15 2018 i5 FHD 97Wh i5-8300H, GeForce GTX 1050 Mobile, Lite-On CA3-8D256-Q11, LED IGZO IPS InfinityEdge, 1920x1080, 15.6" | Acer TravelMate 2410-G2-MG-82E6 i5-8550U, GeForce MX130, SK Hynix HFS256G39TND-N210A, IPS, 1920x1080, 14" | Dell Latitude 5590 i5-8250U, UHD Graphics 620, SK hynix SC311 M.2, IPS, 1920x1080, 15.6" | HP EliteBook 755 G5 3UN79EA R7 2700U, Vega 10, Toshiba XG5 KXG50ZNV512G, IPS, 1920x1080, 15.6" | Dell Latitude 5491 i7-8850H, GeForce MX130, Toshiba XG5 KXG50ZNV512G, IPS, 1920x1080, 14" | |
|---|---|---|---|---|---|---|---|
| Power Consumption | -4% | 15% | 26% | 27% | 6% | -25% | |
| Idle Minimum * (Watt) | 4.4 | 5.3 -20% | 2.9 34% | 3.5 20% | 3.6 18% | 5 -14% | 7.5 -70% |
| Idle Average * (Watt) | 8.4 | 10.2 -21% | 5.8 31% | 5.9 30% | 6.5 23% | 10.6 -26% | 9.7 -15% |
| Idle Maximum * (Watt) | 10.2 | 13.6 -33% | 7.5 26% | 8.2 20% | 7.2 29% | 12.9 -26% | 13 -27% |
| Load Average * (Watt) | 71 | 58.3 18% | 77.5 -9% | 57.3 19% | 46.2 35% | 40.6 43% | 74.3 -5% |
| Load Maximum * (Watt) | 100.1 | 65.3 35% | 107 -7% | 57.9 42% | 68.8 31% | 46.6 53% | 106.6 -6% |
| Witcher 3 ultra * (Watt) | 47.8 | 84 |
* ... menor é melhor
| Dell Latitude 5591 i7-8850H, GeForce MX130, 92 Wh | HP EliteBook 850 G5 3JX58EA i5-8250U, UHD Graphics 620, 56 Wh | Lenovo ThinkPad T580-20LAS01H00 i5-8550U, GeForce MX150, 105 Wh | Dell XPS 15 2018 i5 FHD 97Wh i5-8300H, GeForce GTX 1050 Mobile, 97 Wh | Dell Latitude 5590 i5-8250U, UHD Graphics 620, 51 Wh | |
|---|---|---|---|---|---|
| Duração da bateria | 29% | 10% | 27% | -23% | |
| Reader / Idle (h) | 22.4 | 17.8 -21% | 19.7 -12% | 17.4 -22% | |
| WiFi v1.3 (h) | 12.5 | 9.3 -26% | 8.7 -30% | 15.7 26% | 7.4 -41% |
| Load (h) | 1.5 | 3.5 133% | 2.6 73% | 1.9 27% | 1.4 -7% |
| Witcher 3 ultra (h) | 1 |
Pro
Contra
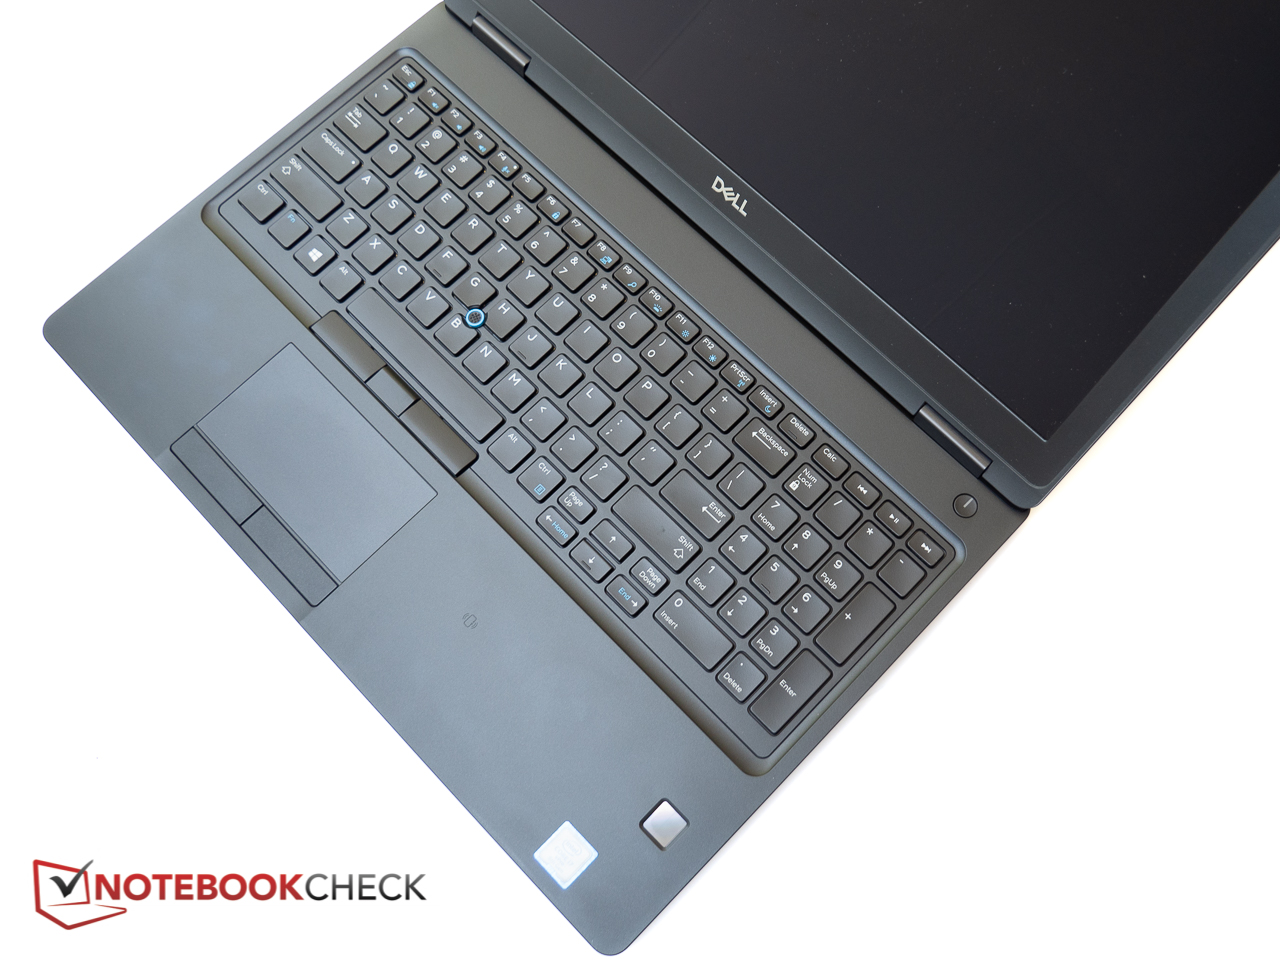
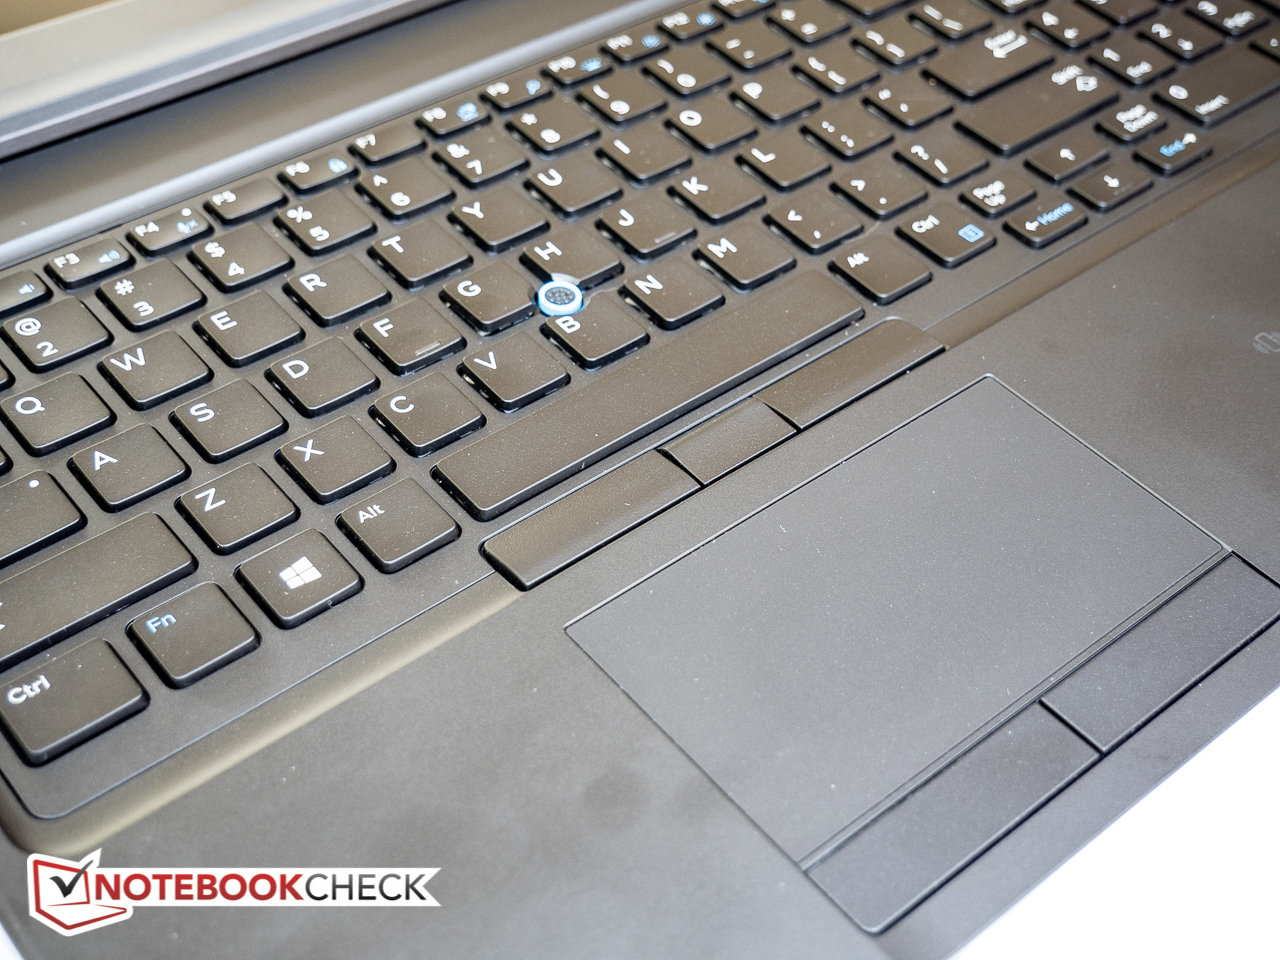
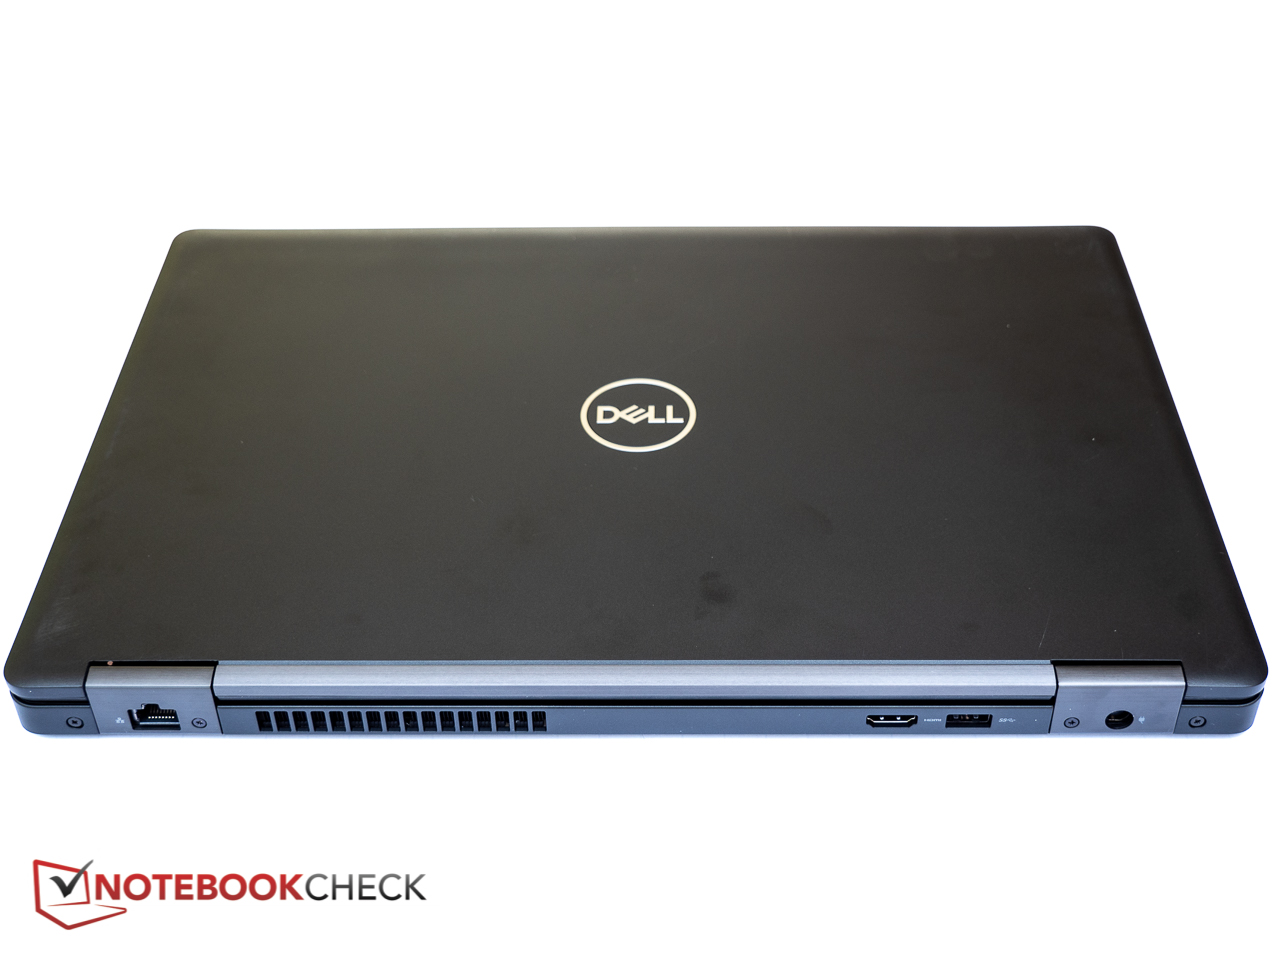
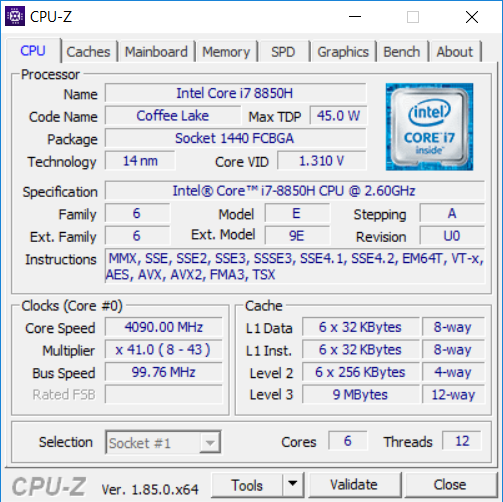
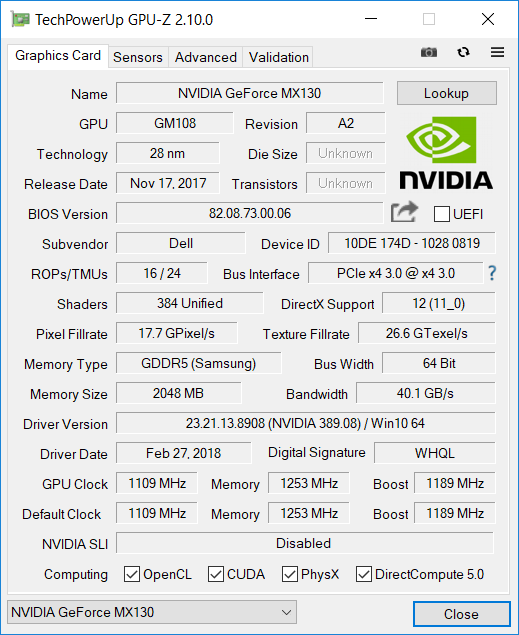
O Latitude 5591 pode parecer bastante utilitário em sua abordagem de design, mas ele vem com o conjunto de recursos desejado pelos profissionais de negócios, bem como a qualidade de construção e os recursos de segurança que os departamentos corporativos de TI exigem. O chassi é compatível com o MIL-STD 810G e deve durar muito tempo, as opções de conectividade são numerosas e incluem o Thunderbolt 3, e é agradável digitar no teclado. O notebook com CPU i7-8550H hexa-core e Nvidia GeForce MX130 está claramente à frente do Latitude 5590 com CPU ULV no que diz respeito ao desempenho e tem energia suficiente para lidar com aplicações extremamente exigentes.
Infelizmente, também há desvantagens: o 5591 funciona bastante quente sob carga e o calor gerado gera um impacto negativo na sustentabilidade do Turbo Boost. O nível de ruído também subiu e o portátil não funciona tanto quanto esperávamos, dada a grande capacidade da bateria. A tela também é decepcionante, dado o preço, já que ela não é tão brilhante, e tanto a gama quanto a precisão das cores deixam a desejar.
O Latitude 5591 apresenta inúmeras opções de segurança e um design ergonômico, mas os usuários precisam avaliar cuidadosamente se o desempenho adicional é compensado pelos inconvenientes mencionados.
Usuários domésticos que procuram um poderoso portátil de 15 polegadas podem querer considerar o Dell XPS 15, que também vem com uma CPU Coffee Lake-H e gráficos mais potentes na forma de uma GTX 1050. A tela é significativamente melhor e o portátil dura três horas a mais, com uma carga.
Dell Latitude 5591
- 07/31/2018 v6 (old)
Bernie Pechlaner
Price comparison
