Breve Análise do Portátil Acer TravelMate P2 TMP215-52: Empresarial acessível
Avaliação | Data | Modelo | Peso | Altura | Size | Resolução | Preço |
|---|---|---|---|---|---|---|---|
| 82 % v7 (old) | 08/2020 | Acer TravelMate P215-52 i7-10510U, UHD Graphics 620 | 1.8 kg | 19.9 mm | 15.60" | 1920x1080 | |
| 81.4 % v7 (old) | 08/2020 | HP ProBook 450 G7 8WC04UT i7-10510U, GeForce MX250 | 1.9 kg | 19 mm | 15.60" | 1920x1080 | |
| 76.6 % v7 (old) | 02/2020 | Acer Extensa 15 EX215-51-56UX i5-10210U, UHD Graphics 620 | 1.9 kg | 19.9 mm | 15.60" | 1920x1080 | |
| 78.5 % v7 (old) | 02/2020 | HP 15s-fq1556ng i5-1035G1, UHD Graphics G1 (Ice Lake 32 EU) | 1.7 kg | 18 mm | 15.60" | 1920x1080 | |
| 83.2 % v7 (old) | 11/2019 | Lenovo ThinkPad L590-20Q70019GE i5-8265U, UHD Graphics 620 | 2 kg | 23 mm | 15.60" | 1920x1080 | |
| 79.6 % v6 (old) | Dell Latitude 15 3590 i5-8250U, UHD Graphics 620 | 2.1 kg | 22 mm | 15.60" | 1920x1080 |
| SD Card Reader | |
| average JPG Copy Test (av. of 3 runs) | |
| HP ProBook 450 G7 8WC04UT (Toshiba Exceria Pro SDXC 64 GB UHS-II) | |
| Lenovo ThinkPad L590-20Q70019GE (Toshiba Exceria Pro M501 64 GB UHS-II) | |
| Dell Latitude 15 3590 (Toshiba Exceria Pro SDXC 64 GB UHS-II) | |
| Acer TravelMate P215-52 (Toshiba Exceria Pro SDXC 64 GB UHS-II) | |
| maximum AS SSD Seq Read Test (1GB) | |
| Lenovo ThinkPad L590-20Q70019GE (Toshiba Exceria Pro M501 64 GB UHS-II) | |
| HP ProBook 450 G7 8WC04UT (Toshiba Exceria Pro SDXC 64 GB UHS-II) | |
| Dell Latitude 15 3590 (Toshiba Exceria Pro SDXC 64 GB UHS-II) | |
| Acer TravelMate P215-52 (Toshiba Exceria Pro SDXC 64 GB UHS-II) | |


| |||||||||||||||||||||||||
iluminação: 78 %
iluminação com acumulador: 255.9 cd/m²
Contraste: 556:1 (Preto: 0.46 cd/m²)
ΔE ColorChecker Calman: 5.02 | ∀{0.5-29.43 Ø4.71}
calibrated: 4.17
ΔE Greyscale Calman: 4.2 | ∀{0.09-98 Ø4.96}
60.4% sRGB (Argyll 1.6.3 3D)
38.6% AdobeRGB 1998 (Argyll 1.6.3 3D)
42.01% AdobeRGB 1998 (Argyll 3D)
60.6% sRGB (Argyll 3D)
40.66% Display P3 (Argyll 3D)
Gamma: 2.07
CCT: 6975 K
| Acer TravelMate P215-52 BOE CQ NV156FHM-N48, IPS, 15.6", 1920x1080 | HP ProBook 450 G7 8WC04UT LG Philips LGD062E, IPS, 15.6", 1920x1080 | Acer Extensa 15 EX215-51-56UX BOE CQ NT156FHM-N61, TN LED, 15.6", 1920x1080 | HP 15s-fq1556ng AU Optronics B156HW02, IPS, 15.6", 1920x1080 | Lenovo ThinkPad L590-20Q70019GE N156HCE-EAA, IPS, 15.6", 1920x1080 | Dell Latitude 15 3590 BOE0802 / NT15N41 / Dell: M9P74, TN LED, 15.6", 1920x1080 | |
|---|---|---|---|---|---|---|
| Display | -7% | -6% | -7% | 6% | -2% | |
| Display P3 Coverage (%) | 40.66 | 37.9 -7% | 38.17 -6% | 37.66 -7% | 43.3 6% | 39.67 -2% |
| sRGB Coverage (%) | 60.6 | 56.5 -7% | 57.5 -5% | 56.4 -7% | 64.4 6% | 59.7 -1% |
| AdobeRGB 1998 Coverage (%) | 42.01 | 39.08 -7% | 39.44 -6% | 38.91 -7% | 44.81 7% | 40.99 -2% |
| Response Times | -24% | -10% | -60% | -40% | -5% | |
| Response Time Grey 50% / Grey 80% * (ms) | 24.4 ? | 35.2 ? -44% | 41 ? -68% | 51 ? -109% | 42.8 ? -75% | 41 ? -68% |
| Response Time Black / White * (ms) | 29.2 ? | 30.4 ? -4% | 15 ? 49% | 32 ? -10% | 30.8 ? -5% | 12 ? 59% |
| PWM Frequency (Hz) | 1000 ? | 24510 ? | 250 ? | |||
| Screen | 1% | -44% | 20% | 13% | -26% | |
| Brightness middle (cd/m²) | 255.9 | 259.8 2% | 203 -21% | 254 -1% | 247 -3% | 215 -16% |
| Brightness (cd/m²) | 234 | 251 7% | 188 -20% | 234 0% | 228 -3% | 214 -9% |
| Brightness Distribution (%) | 78 | 91 17% | 87 12% | 86 10% | 81 4% | 91 17% |
| Black Level * (cd/m²) | 0.46 | 0.42 9% | 0.635 -38% | 0.18 61% | 0.18 61% | 0.385 16% |
| Contrast (:1) | 556 | 619 11% | 320 -42% | 1411 154% | 1372 147% | 558 0% |
| Colorchecker dE 2000 * | 5.02 | 6.09 -21% | 10.84 -116% | 5.58 -11% | 5.9 -18% | 10.31 -105% |
| Colorchecker dE 2000 max. * | 18.26 | 16.33 11% | 22.18 -21% | 9.83 46% | 22.9 -25% | 20.44 -12% |
| Colorchecker dE 2000 calibrated * | 4.17 | 5.2 -25% | 5.09 -22% | 4.53 -9% | 4.7 -13% | 3.88 7% |
| Greyscale dE 2000 * | 4.2 | 3.7 12% | 12.87 -206% | 5.02 -20% | 5.1 -21% | 11.84 -182% |
| Gamma | 2.07 106% | 2.56 86% | 2.58 85% | 2.83 78% | 2.21 100% | 2.67 82% |
| CCT | 6975 93% | 6759 96% | 15854 41% | 6570 99% | 6398 102% | 13398 49% |
| Color Space (Percent of AdobeRGB 1998) (%) | 38.6 | 35.7 -8% | 36.4 -6% | 36 -7% | 41.2 7% | 39 1% |
| Color Space (Percent of sRGB) (%) | 60.4 | 56.2 -7% | 57.4 -5% | 56 -7% | 64.1 6% | 61 1% |
| Média Total (Programa/Configurações) | -10% /
-4% | -20% /
-33% | -16% /
5% | -7% /
5% | -11% /
-19% |
* ... menor é melhor
Exibir tempos de resposta
| ↔ Tempo de resposta preto para branco | ||
|---|---|---|
| 29.2 ms ... ascensão ↗ e queda ↘ combinadas | ↗ 15.2 ms ascensão | 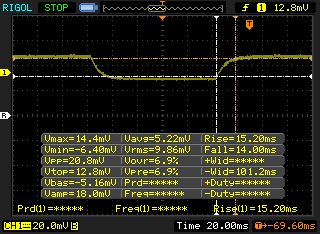 |
| ↘ 14 ms queda | ||
| A tela mostra taxas de resposta relativamente lentas em nossos testes e pode ser muito lenta para os jogadores. Em comparação, todos os dispositivos testados variam de 0.1 (mínimo) a 240 (máximo) ms. » 78 % de todos os dispositivos são melhores. Isso significa que o tempo de resposta medido é pior que a média de todos os dispositivos testados (19.8 ms). | ||
| ↔ Tempo de resposta 50% cinza a 80% cinza | ||
| 24.4 ms ... ascensão ↗ e queda ↘ combinadas | ↗ 14 ms ascensão | 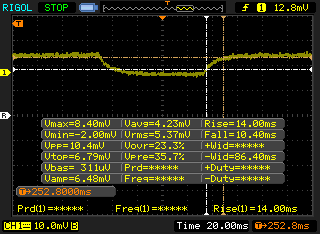 |
| ↘ 10.4 ms queda | ||
| A tela mostra boas taxas de resposta em nossos testes, mas pode ser muito lenta para jogadores competitivos. Em comparação, todos os dispositivos testados variam de 0.165 (mínimo) a 636 (máximo) ms. » 35 % de todos os dispositivos são melhores. Isso significa que o tempo de resposta medido é melhor que a média de todos os dispositivos testados (31 ms). | ||
Cintilação da tela / PWM (modulação por largura de pulso)
| Tela tremeluzindo/PWM detectado | 1000 Hz | ≤ 99 % configuração de brilho | 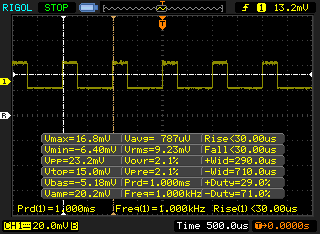 |
A luz de fundo da tela pisca em 1000 Hz (pior caso, por exemplo, utilizando PWM) Cintilação detectada em uma configuração de brilho de 99 % e abaixo. Não deve haver cintilação ou PWM acima desta configuração de brilho. A frequência de 1000 Hz é bastante alta, então a maioria dos usuários sensíveis ao PWM não deve notar nenhuma oscilação. [pwm_comparison] Em comparação: 52 % de todos os dispositivos testados não usam PWM para escurecer a tela. Se PWM foi detectado, uma média de 7757 (mínimo: 5 - máximo: 343500) Hz foi medida. | |||
Cinebench R15: CPU Multi 64Bit | CPU Single 64Bit
Blender: v2.79 BMW27 CPU
7-Zip 18.03: 7z b 4 -mmt1 | 7z b 4
Geekbench 5.5: Single-Core | Multi-Core
HWBOT x265 Benchmark v2.2: 4k Preset
LibreOffice : 20 Documents To PDF
R Benchmark 2.5: Overall mean
| Geekbench 5.5 / Single-Core | |
| HP 15s-fq1440ng | |
| Média Intel Core i7-10510U (977 - 1287, n=31) | |
| Lenovo IdeaPad 3 14IIL05 | |
| HP ProBook 455 G7-175W8EA | |
| Acer TravelMate P215-52 | |
| HP ProBook 445 G7 175W4EA | |
| Lenovo ThinkPad T14s-20T00044GE | |
| Acer Swift 3 SF314-42-R27B | |
| Geekbench 5.5 / Multi-Core | |
| HP ProBook 455 G7-175W8EA | |
| HP ProBook 445 G7 175W4EA | |
| HP 15s-fq1440ng | |
| Lenovo ThinkPad T14s-20T00044GE | |
| Média Intel Core i7-10510U (2474 - 4484, n=31) | |
| Acer Swift 3 SF314-42-R27B | |
| Acer TravelMate P215-52 | |
| Lenovo IdeaPad 3 14IIL05 | |
| HWBOT x265 Benchmark v2.2 / 4k Preset | |
| HP ProBook 455 G7-175W8EA | |
| Dell XPS 13 7390 Core i7-10710U | |
| Lenovo ThinkPad T590-20N4002VGE | |
| Média Intel Core i7-10510U (3.41 - 6.04, n=31) | |
| Lenovo ThinkPad T14s-20T00044GE | |
| Acer Swift 3 SF314-42-R27B | |
| HP 15s-fq1440ng | |
| Acer TravelMate P215-52 | |
| Lenovo ThinkPad L590-20Q70019GE | |
| Lenovo IdeaPad 3 14IIL05 | |
| LibreOffice / 20 Documents To PDF | |
| HP ProBook 455 G7-175W8EA | |
| HP ProBook 445 G7 175W4EA | |
| Acer Swift 3 SF314-42-R27B | |
| Média Intel Core i7-10510U (50.7 - 77.8, n=27) | |
| Lenovo IdeaPad 3 14IIL05 | |
| Acer TravelMate P215-52 | |
| Lenovo ThinkPad T14s-20T00044GE | |
| HP 15s-fq1440ng | |
| R Benchmark 2.5 / Overall mean | |
| Lenovo IdeaPad 3 14IIL05 | |
| Lenovo ThinkPad T14s-20T00044GE | |
| Acer TravelMate P215-52 | |
| Acer Swift 3 SF314-42-R27B | |
| Média Intel Core i7-10510U (0.637 - 0.81, n=28) | |
| HP 15s-fq1440ng | |
| HP ProBook 455 G7-175W8EA | |
* ... menor é melhor
| PCMark 8 | |
| Home Score Accelerated v2 | |
| HP 15s-fq1556ng | |
| Média Intel Core i7-10510U, Intel UHD Graphics 620 (3157 - 4251, n=13) | |
| HP ProBook 450 G7 8WC04UT | |
| Dell Latitude 15 3590 | |
| Acer Extensa 15 EX215-51-56UX | |
| Acer TravelMate P215-52 | |
| Lenovo ThinkPad L590-20Q70019GE | |
| Work Score Accelerated v2 | |
| HP 15s-fq1556ng | |
| HP ProBook 450 G7 8WC04UT | |
| Média Intel Core i7-10510U, Intel UHD Graphics 620 (3734 - 5366, n=13) | |
| Acer Extensa 15 EX215-51-56UX | |
| Acer TravelMate P215-52 | |
| Dell Latitude 15 3590 | |
| Lenovo ThinkPad L590-20Q70019GE | |
| PCMark 8 Home Score Accelerated v2 | 3157 pontos | |
| PCMark 8 Work Score Accelerated v2 | 4823 pontos | |
| PCMark 10 Score | 3797 pontos | |
Ajuda | ||
| DPC Latencies / LatencyMon - interrupt to process latency (max), Web, Youtube, Prime95 | |
| Dell XPS 15 9500 Core i7 4K UHD | |
| HP ProBook 450 G7 8WC04UT | |
| Acer TravelMate P215-52 | |
| HP 470 G7 8VU24EA | |
| Lenovo ThinkPad T14s-20T00044GE | |
| HP ProBook 455 G7-175W8EA | |
| HP ProBook 445 G7 175W4EA | |
| Acer Swift 3 SF314-42-R27B | |
| HP 15s-fq1440ng | |
| Lenovo IdeaPad 3 14IIL05 | |
| Lenovo ThinkPad E14 Gen2-20T7S00W00 | |
* ... menor é melhor
| Acer TravelMate P215-52 SK hynix BC511 HFM256GDJTNI-82A0 | HP ProBook 450 G7 8WC04UT Crucial P1 SSD CT1000P1SSD8 | Acer Extensa 15 EX215-51-56UX WDC PC SN520 SDAPNUW-512G | HP 15s-fq1556ng Intel SSD 660p SSDPEKNW512G8 | Lenovo ThinkPad L590-20Q70019GE Toshiba XG6 KXG6AZNV512G | Dell Latitude 15 3590 Samsung SSD PM871b MZ7LN256HAJQ | |
|---|---|---|---|---|---|---|
| AS SSD | 84% | 147% | 106% | 170% | 4% | |
| Seq Read (MB/s) | 1770 | 1155 -35% | 1542 -13% | 1705 -4% | 1383 -22% | 498.7 -72% |
| Seq Write (MB/s) | 354.5 | 984 178% | 1249 252% | 904 155% | 852 140% | 361.7 2% |
| 4K Read (MB/s) | 38.18 | 48.85 28% | 38.79 2% | 58.5 53% | 45.72 20% | 34.65 -9% |
| 4K Write (MB/s) | 95.9 | 96.6 1% | 89.3 -7% | 165.4 72% | 120.2 25% | 79.8 -17% |
| 4K-64 Read (MB/s) | 423.4 | 581 37% | 966 128% | 323.1 -24% | 1344 217% | 372.5 -12% |
| 4K-64 Write (MB/s) | 141.1 | 658 366% | 885 527% | 827 486% | 926 556% | 247.7 76% |
| Access Time Read * (ms) | 0.071 | 0.066 7% | 0.056 21% | 0.063 11% | 0.06 15% | |
| Access Time Write * (ms) | 0.117 | 0.207 -77% | 0.044 62% | 0.044 62% | 0.036 69% | 0.042 64% |
| Score Read (Points) | 639 | 745 17% | 1159 81% | 522 -18% | 1528 139% | 457 -28% |
| Score Write (Points) | 272 | 853 214% | 1099 304% | 1083 298% | 1132 316% | 364 34% |
| Score Total (Points) | 1178 | 1986 69% | 2842 141% | 1901 61% | 3420 190% | 1060 -10% |
| Copy ISO MB/s (MB/s) | 634 | 2635 316% | 894 41% | 1147 81% | ||
| Copy Program MB/s (MB/s) | 96.2 | 95.1 -1% | 304.9 217% | 419.8 336% | ||
| Copy Game MB/s (MB/s) | 228.9 | 361.9 58% | 642 180% | 928 305% | ||
| CrystalDiskMark 5.2 / 6 | 30% | 62% | 45% | 51% | -30% | |
| Write 4K (MB/s) | 153.7 | 111.1 -28% | 176.1 15% | 203.1 32% | 115.3 -25% | 79.5 -48% |
| Read 4K (MB/s) | 60.4 | 56.3 -7% | 50.4 -17% | 65.3 8% | 43.34 -28% | 32.72 -46% |
| Write Seq (MB/s) | 431 | 559 30% | 1457 238% | 973 126% | 1014 135% | 472.5 10% |
| Read Seq (MB/s) | 1199 | 1348 12% | 1424 19% | 1651 38% | 1481 24% | 504 -58% |
| Write 4K Q32T1 (MB/s) | 374.5 | 277.1 -26% | 381 2% | 526 40% | 495.4 32% | 322.6 -14% |
| Read 4K Q32T1 (MB/s) | 445.5 | 312.1 -30% | 436.5 -2% | 345.2 -23% | 332.6 -25% | 249.9 -44% |
| Write Seq Q32T1 (MB/s) | 408.4 | 1652 305% | 1455 256% | 980 140% | 1654 305% | 531 30% |
| Read Seq Q32T1 (MB/s) | 1966 | 1588 -19% | 1725 -12% | 1883 -4% | 1746 -11% | 544 -72% |
| Write 4K Q8T8 (MB/s) | 1033 | |||||
| Read 4K Q8T8 (MB/s) | 892 | |||||
| Média Total (Programa/Configurações) | 57% /
64% | 105% /
115% | 76% /
80% | 111% /
127% | -13% /
-10% |
* ... menor é melhor

Disk Throttling: DiskSpd Read Loop, Queue Depth 8
| 3DMark 11 Performance | 1960 pontos | |
| 3DMark Cloud Gate Standard Score | 7963 pontos | |
| 3DMark Fire Strike Score | 1071 pontos | |
| 3DMark Time Spy Score | 431 pontos | |
Ajuda | ||
| baixo | média | alto | ultra | |
|---|---|---|---|---|
| Dota 2 Reborn (2015) | 68 | 43 | 20.4 | 18.1 |
| X-Plane 11.11 (2018) | 21.4 | 14.5 | 13.1 |
| Acer TravelMate P215-52 UHD Graphics 620, i7-10510U, SK hynix BC511 HFM256GDJTNI-82A0 | HP ProBook 450 G7 8WC04UT GeForce MX250, i7-10510U, Crucial P1 SSD CT1000P1SSD8 | Acer Extensa 15 EX215-51-56UX UHD Graphics 620, i5-10210U, WDC PC SN520 SDAPNUW-512G | HP 15s-fq1556ng UHD Graphics G1 (Ice Lake 32 EU), i5-1035G1, Intel SSD 660p SSDPEKNW512G8 | Lenovo ThinkPad L590-20Q70019GE UHD Graphics 620, i5-8265U, Toshiba XG6 KXG6AZNV512G | Dell Latitude 15 3590 UHD Graphics 620, i5-8250U, Samsung SSD PM871b MZ7LN256HAJQ | |
|---|---|---|---|---|---|---|
| Noise | -8% | -10% | -15% | -5% | -18% | |
| desligado / ambiente * (dB) | 25.7 | 26.2 -2% | 30.3 -18% | 30.3 -18% | 29 -13% | 30.6 -19% |
| Idle Minimum * (dB) | 25.7 | 26.2 -2% | 30.3 -18% | 30.3 -18% | 29 -13% | 30.6 -19% |
| Idle Average * (dB) | 25.7 | 26.2 -2% | 30.3 -18% | 30.3 -18% | 29 -13% | 31.9 -24% |
| Idle Maximum * (dB) | 25.7 | 26.2 -2% | 30.3 -18% | 30.3 -18% | 29 -13% | 31.9 -24% |
| Load Average * (dB) | 33.8 | 38.1 -13% | 32.7 3% | 34 -1% | 29 14% | 39 -15% |
| Load Maximum * (dB) | 36.3 | 47 -29% | 32.8 10% | 41.3 -14% | 33.8 7% | 39.1 -8% |
| Witcher 3 ultra * (dB) | 37.5 |
* ... menor é melhor
Barulho
| Ocioso |
| 25.7 / 25.7 / 25.7 dB |
| Carga |
| 33.8 / 36.3 dB |
 | ||
30 dB silencioso 40 dB(A) audível 50 dB(A) ruidosamente alto |
||
min: | ||
(-) A temperatura máxima no lado superior é 49 °C / 120 F, em comparação com a média de 34.3 °C / 94 F , variando de 21.2 a 62.5 °C para a classe Office.
(±) A parte inferior aquece até um máximo de 41.2 °C / 106 F, em comparação com a média de 36.8 °C / 98 F
(+) Em uso inativo, a temperatura média para o lado superior é 29.6 °C / 85 F, em comparação com a média do dispositivo de 29.5 °C / ### class_avg_f### F.
(+) Os apoios para as mãos e o touchpad estão atingindo a temperatura máxima da pele (32 °C / 89.6 F) e, portanto, não estão quentes.
(-) A temperatura média da área do apoio para as mãos de dispositivos semelhantes foi 27.5 °C / 81.5 F (-4.5 °C / -8.1 F).
Acer TravelMate P215-52 análise de áudio
(±) | o volume do alto-falante é médio, mas bom (###valor### dB)
Graves 100 - 315Hz
(-) | quase nenhum baixo - em média 27.6% menor que a mediana
(-) | graves não são lineares (15% delta para frequência anterior)
Médios 400 - 2.000 Hz
(+) | médios equilibrados - apenas 3.4% longe da mediana
(+) | médios são lineares (5.2% delta para frequência anterior)
Altos 2 - 16 kHz
(+) | agudos equilibrados - apenas 2.9% longe da mediana
(+) | os máximos são lineares (4.5% delta da frequência anterior)
Geral 100 - 16.000 Hz
(±) | a linearidade do som geral é média (25.8% diferença em relação à mediana)
Comparado com a mesma classe
» 79% de todos os dispositivos testados nesta classe foram melhores, 7% semelhantes, 15% piores
» O melhor teve um delta de 7%, a média foi 21%, o pior foi 53%
Comparado com todos os dispositivos testados
» 79% de todos os dispositivos testados foram melhores, 4% semelhantes, 17% piores
» O melhor teve um delta de 4%, a média foi 23%, o pior foi 134%
Apple MacBook 12 (Early 2016) 1.1 GHz análise de áudio
(+) | os alto-falantes podem tocar relativamente alto (###valor### dB)
Graves 100 - 315Hz
(±) | graves reduzidos - em média 11.3% menor que a mediana
(±) | a linearidade dos graves é média (14.2% delta para a frequência anterior)
Médios 400 - 2.000 Hz
(+) | médios equilibrados - apenas 2.4% longe da mediana
(+) | médios são lineares (5.5% delta para frequência anterior)
Altos 2 - 16 kHz
(+) | agudos equilibrados - apenas 2% longe da mediana
(+) | os máximos são lineares (4.5% delta da frequência anterior)
Geral 100 - 16.000 Hz
(+) | o som geral é linear (10.2% diferença em relação à mediana)
Comparado com a mesma classe
» 7% de todos os dispositivos testados nesta classe foram melhores, 2% semelhantes, 90% piores
» O melhor teve um delta de 5%, a média foi 18%, o pior foi 53%
Comparado com todos os dispositivos testados
» 5% de todos os dispositivos testados foram melhores, 1% semelhantes, 94% piores
» O melhor teve um delta de 4%, a média foi 23%, o pior foi 134%
| desligado | |
| Ocioso | |
| Carga |
|
Key:
min: | |
| Acer TravelMate P215-52 i7-10510U, UHD Graphics 620, SK hynix BC511 HFM256GDJTNI-82A0, IPS, 1920x1080, 15.6" | HP ProBook 450 G7 8WC04UT i7-10510U, GeForce MX250, Crucial P1 SSD CT1000P1SSD8, IPS, 1920x1080, 15.6" | HP 15s-fq1556ng i5-1035G1, UHD Graphics G1 (Ice Lake 32 EU), Intel SSD 660p SSDPEKNW512G8, IPS, 1920x1080, 15.6" | Lenovo ThinkPad L590-20Q70019GE i5-8265U, UHD Graphics 620, Toshiba XG6 KXG6AZNV512G, IPS, 1920x1080, 15.6" | Dell Latitude 15 3590 i5-8250U, UHD Graphics 620, Samsung SSD PM871b MZ7LN256HAJQ, TN LED, 1920x1080, 15.6" | Lenovo ThinkPad E15 20RD0011GE i7-10510U, Radeon RX 640, Samsung PM991 MZALQ512HALU, IPS LED, 1920x1080, 15.6" | |
|---|---|---|---|---|---|---|
| Power Consumption | -61% | 1% | -14% | -12% | -27% | |
| Idle Minimum * (Watt) | 3.5 | 4.8 -37% | 3.3 6% | 3.96 -13% | 4.3 -23% | 3.2 9% |
| Idle Average * (Watt) | 6.2 | 9.5 -53% | 6.4 -3% | 6.9 -11% | 7.2 -16% | 6.8 -10% |
| Idle Maximum * (Watt) | 6.9 | 10.7 -55% | 6.8 1% | 9.8 -42% | 9.8 -42% | 9.5 -38% |
| Load Average * (Watt) | 31 | 61.8 -99% | 29 6% | 31.4 -1% | 38 -23% | 44 -42% |
| Load Maximum * (Watt) | 43.3 | 69 -59% | 46 -6% | 45.4 -5% | 24 45% | 66.4 -53% |
| Witcher 3 ultra * (Watt) | 50 |
* ... menor é melhor
| Acer TravelMate P215-52 i7-10510U, UHD Graphics 620, 48 Wh | HP ProBook 450 G7 8WC04UT i7-10510U, GeForce MX250, 45 Wh | Acer Extensa 15 EX215-51-56UX i5-10210U, UHD Graphics 620, 37 Wh | HP 15s-fq1556ng i5-1035G1, UHD Graphics G1 (Ice Lake 32 EU), 41 Wh | Lenovo ThinkPad L590-20Q70019GE i5-8265U, UHD Graphics 620, 45 Wh | Dell Latitude 15 3590 i5-8250U, UHD Graphics 620, 56 Wh | |
|---|---|---|---|---|---|---|
| Duração da bateria | -15% | -21% | -28% | 2% | 4% | |
| Reader / Idle (h) | 25.1 | 14.8 -41% | 17.4 -31% | 13.1 -48% | 17.4 -31% | 20.2 -20% |
| WiFi v1.3 (h) | 7.9 | 7.2 -9% | 6.7 -15% | 6 -24% | 7.2 -9% | 9.1 15% |
| Load (h) | 1.9 | 2 5% | 1.6 -16% | 1.7 -11% | 2.8 47% | 2.2 16% |
Pro
Contra
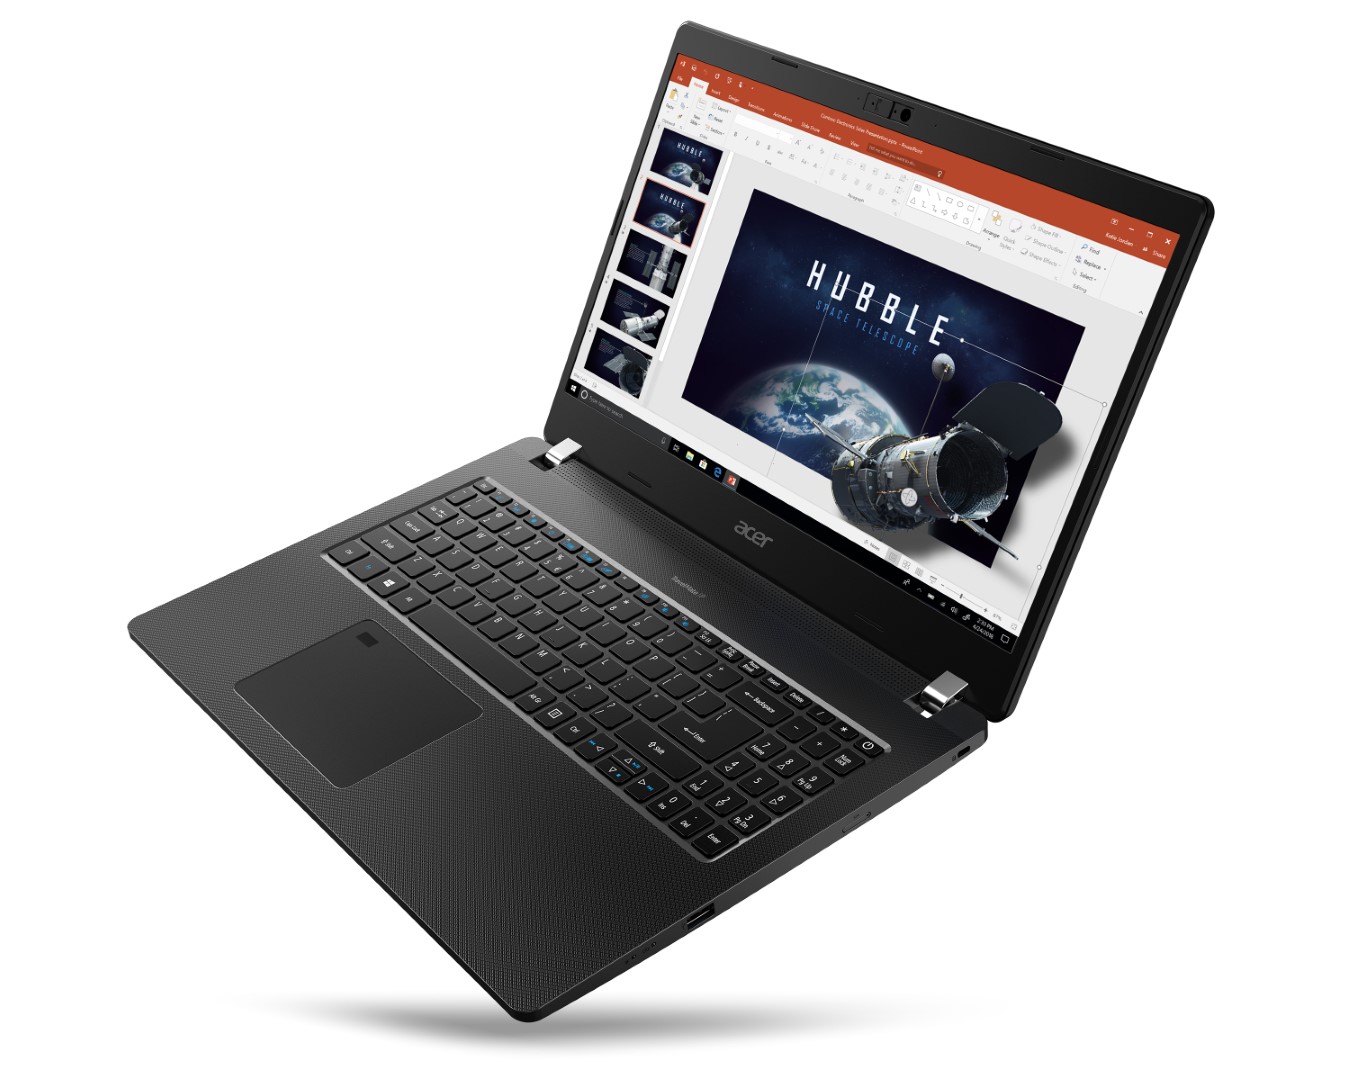
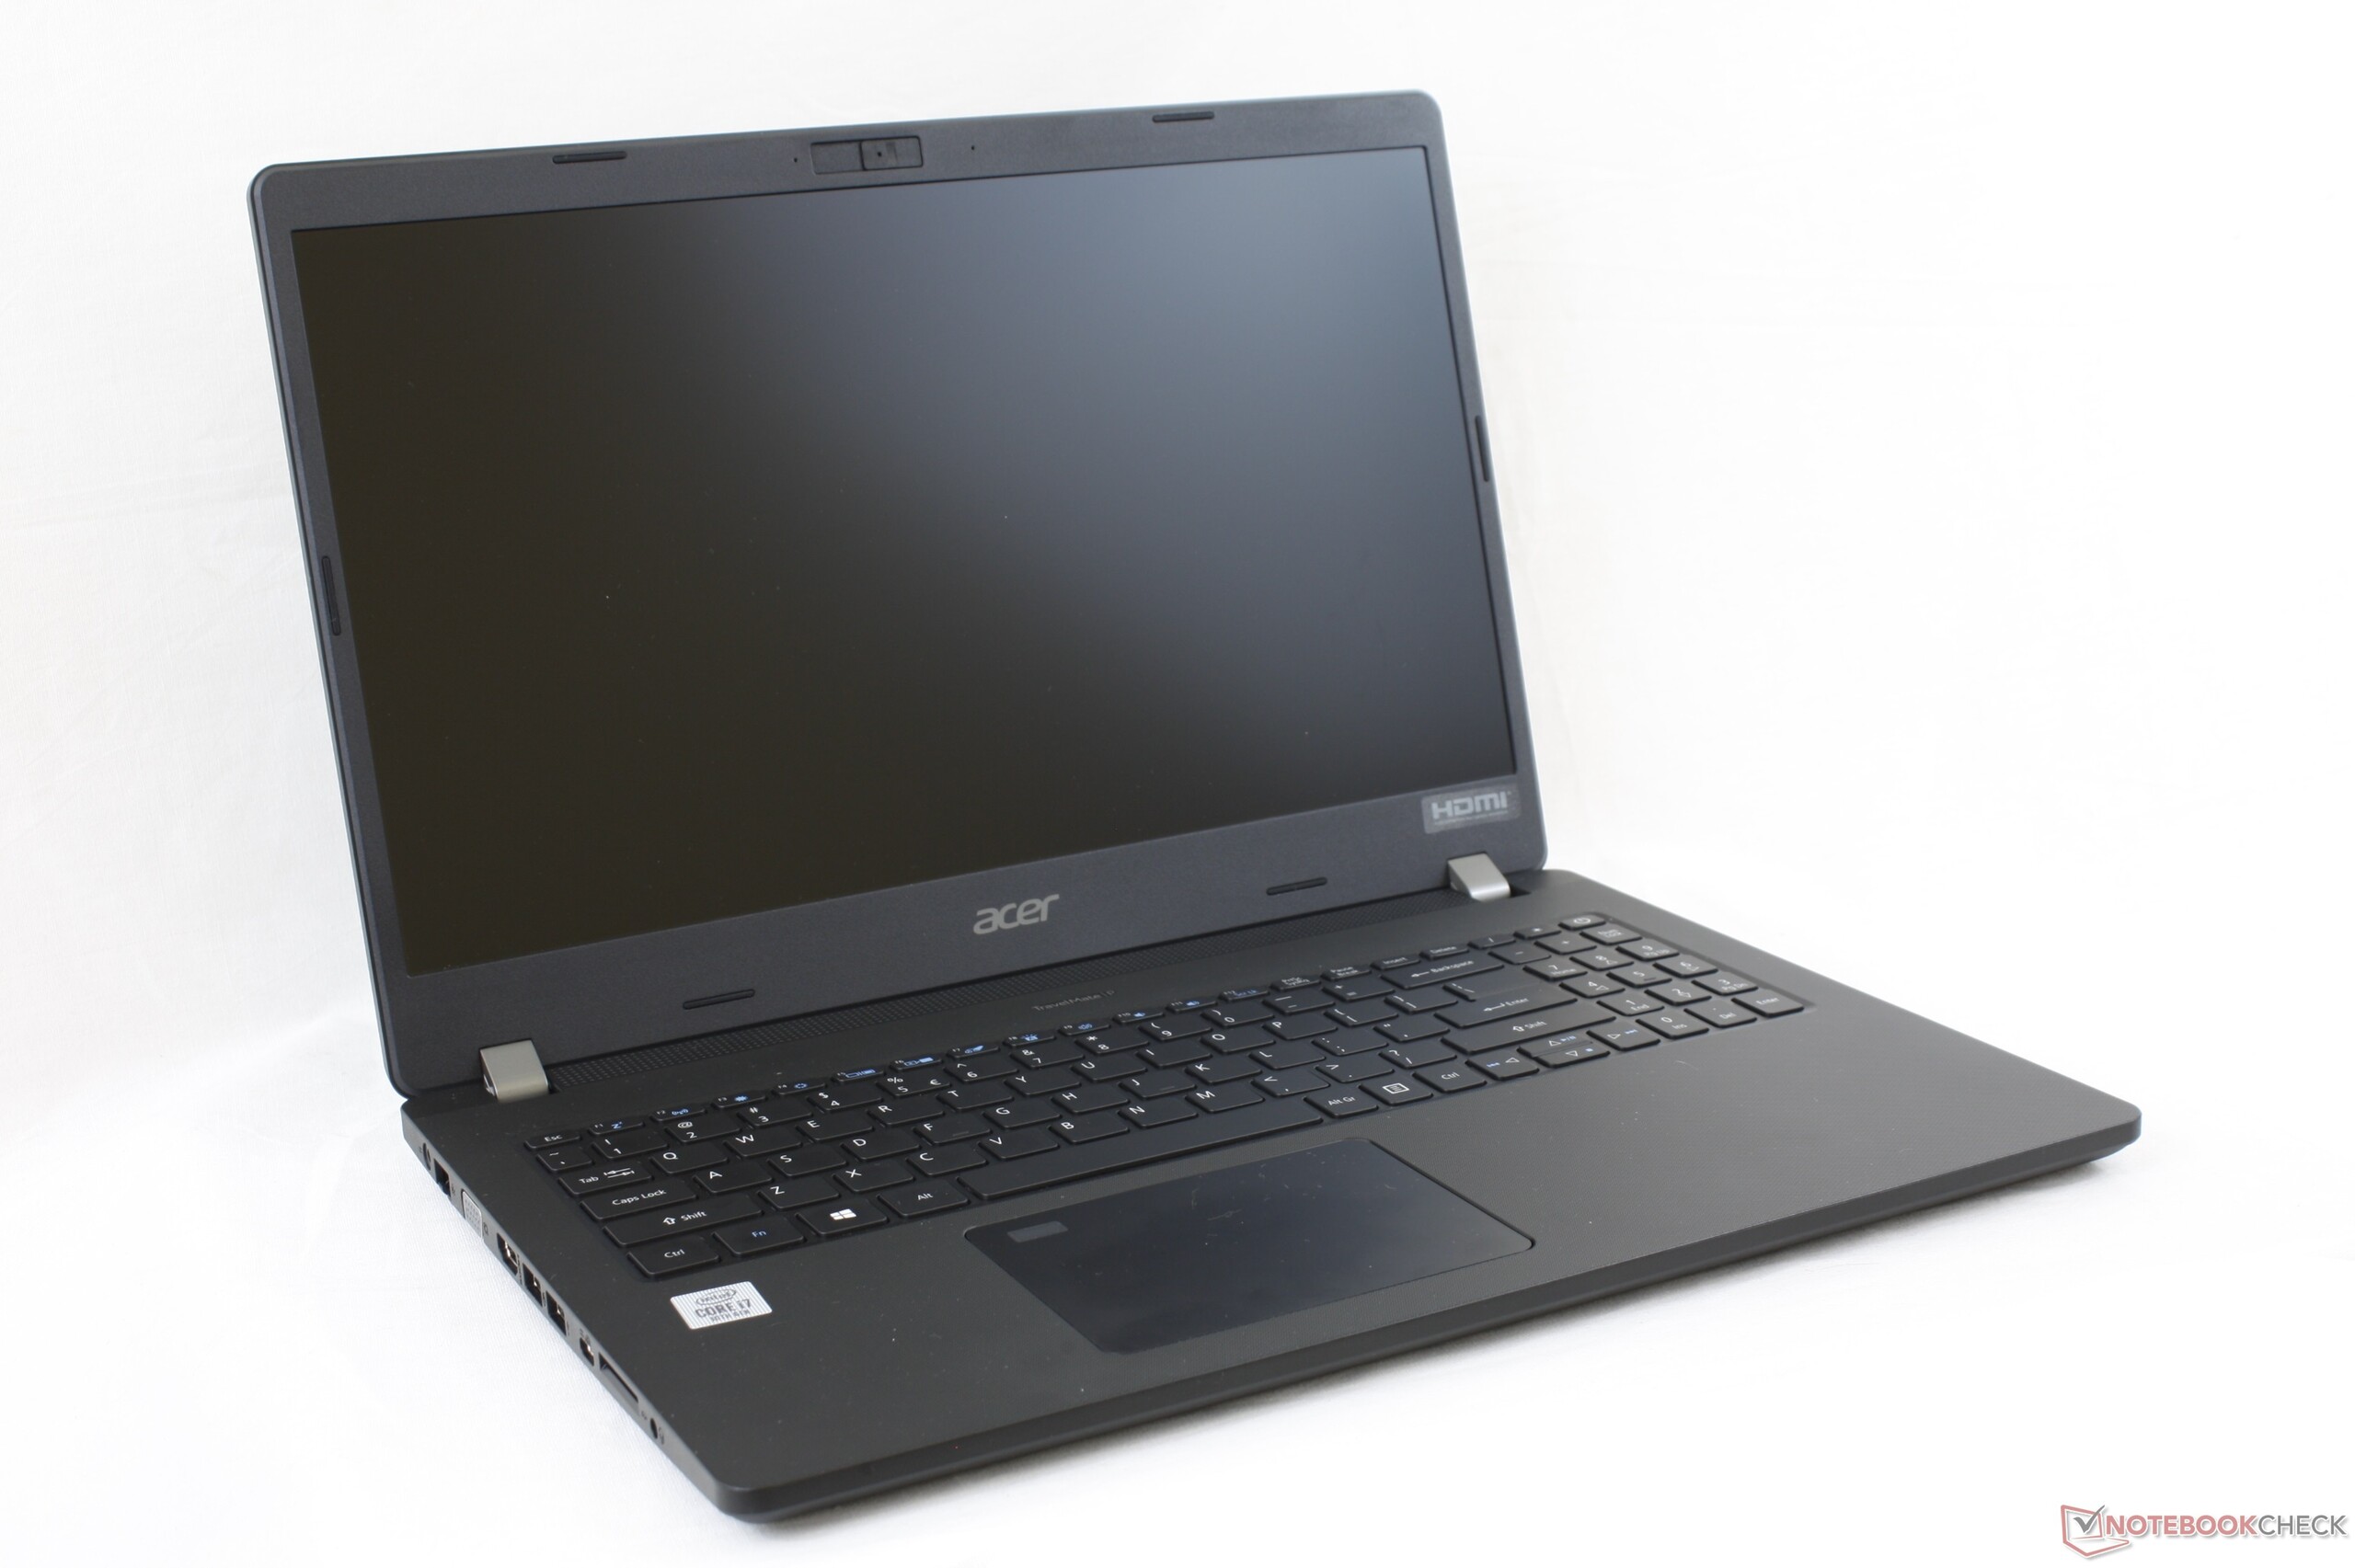
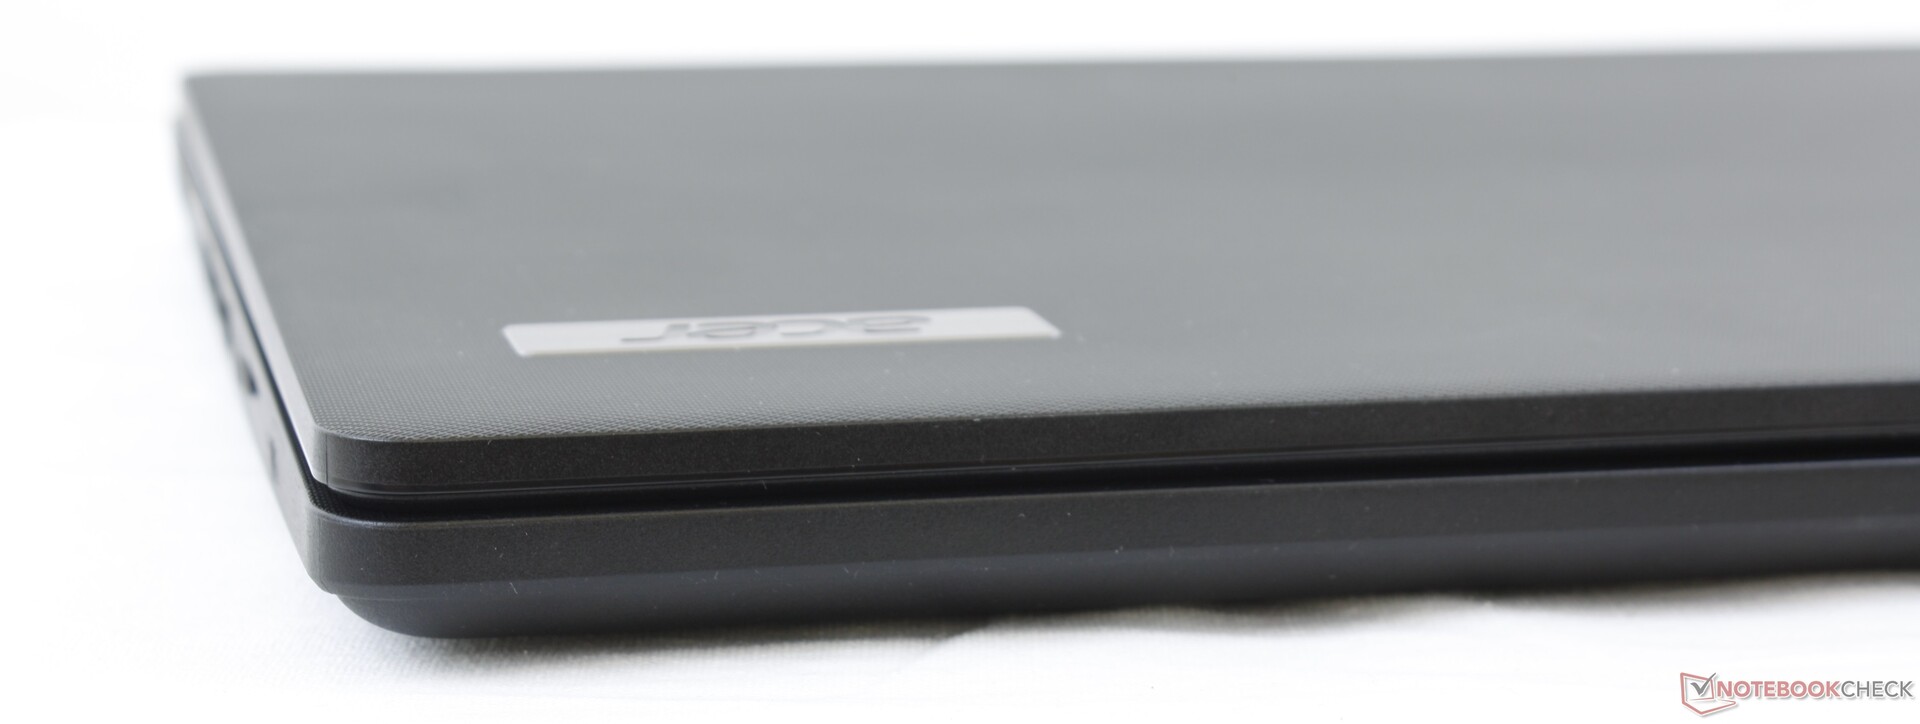
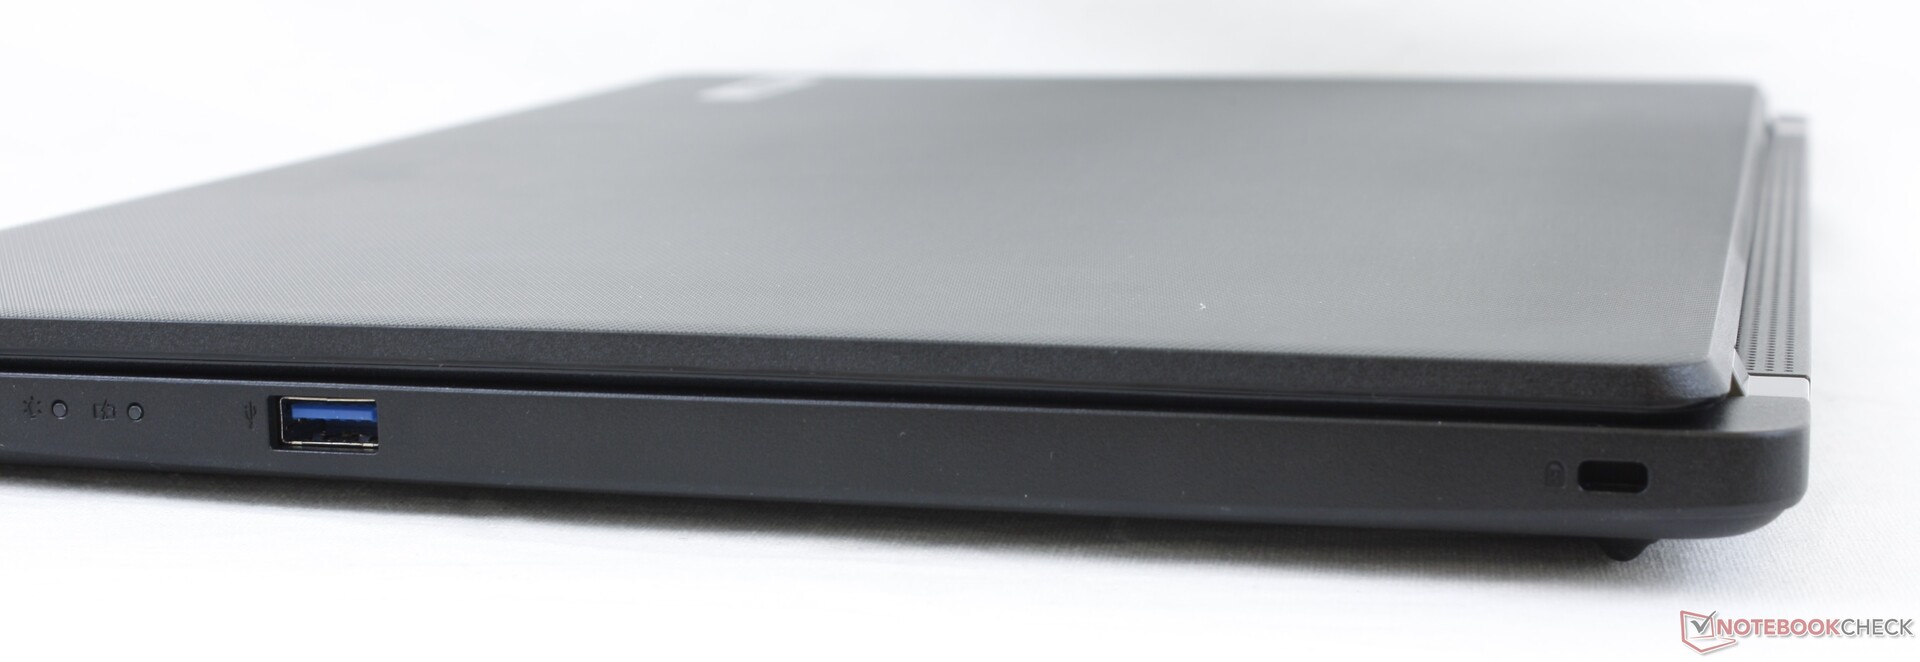
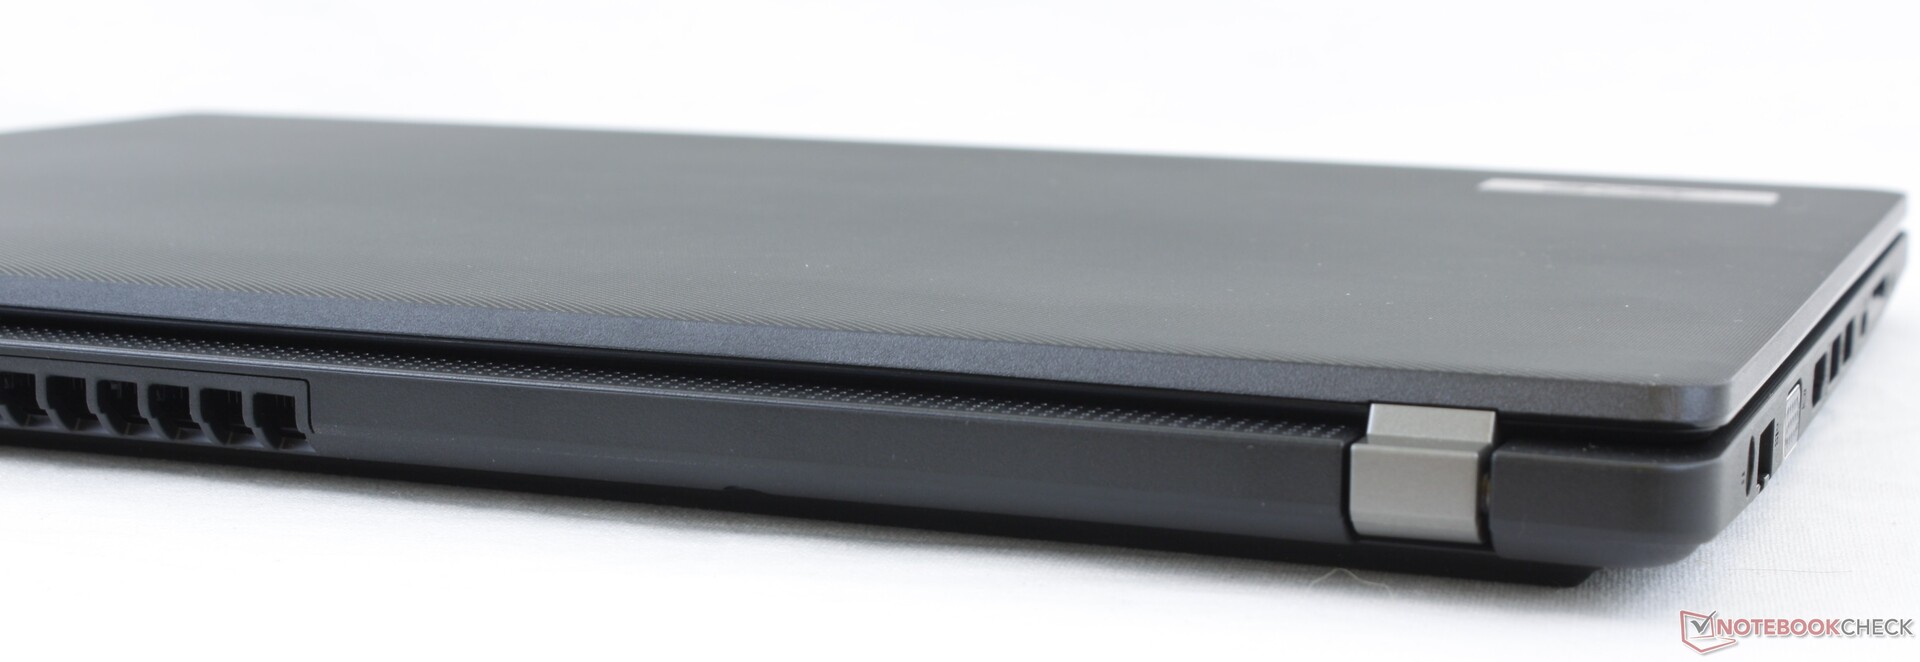
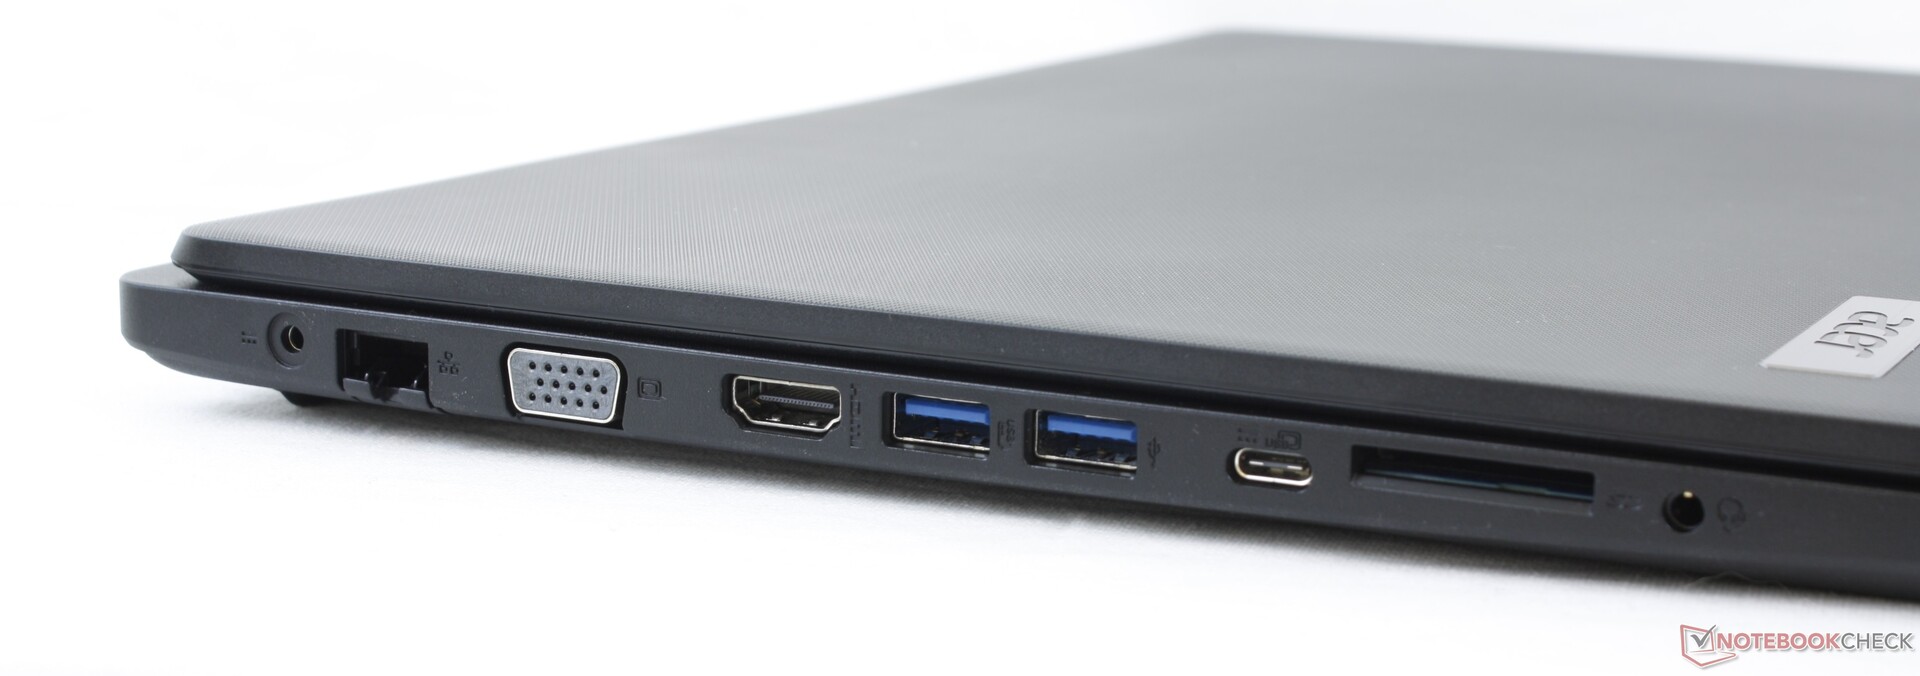
Se você valoriza um portátil corporativo leve com uma porta VGA integrada, o relativamente barato TravelMate P2 TMP215 pode ser o que você está procurando. É uma máquina básica sem enfeites muito parecida com sua antecessora, mas em um chassi menor e mais portátil com muitas portas.
No entanto, o sistema é prejudicado por algumas desvantagens. O PWM está presente em quase todos os níveis de brilho e o desempenho da CPU é mais lento do que o esperado. As teclas do teclado numérico são pequenas e desconfortáveis de usar e alguns usuários podem lamentar a remoção dos botões dedicados do mouse. Embora, supostamente seja um portátil empresarial de baixo custo, achamos que esses aspectos poderiam ter sido melhores sem afetar o preço do modelo. A tela média mandará embora muitos usuários que também podem querer transmitir vídeos em seus portáteis de trabalho.
O Acer TravelMate P2 TMP215 é notável por ser relativamente leve e barato, mantendo uma ampla seleção de portas. O concorrente HP ProBook 450 G7 deixa uma impressão geral melhor se você não se importa com um sistema um pouco maior e mais pesado.
Acer TravelMate P215-52
- 08/21/2020 v7 (old)
Allen Ngo
Price comparison
