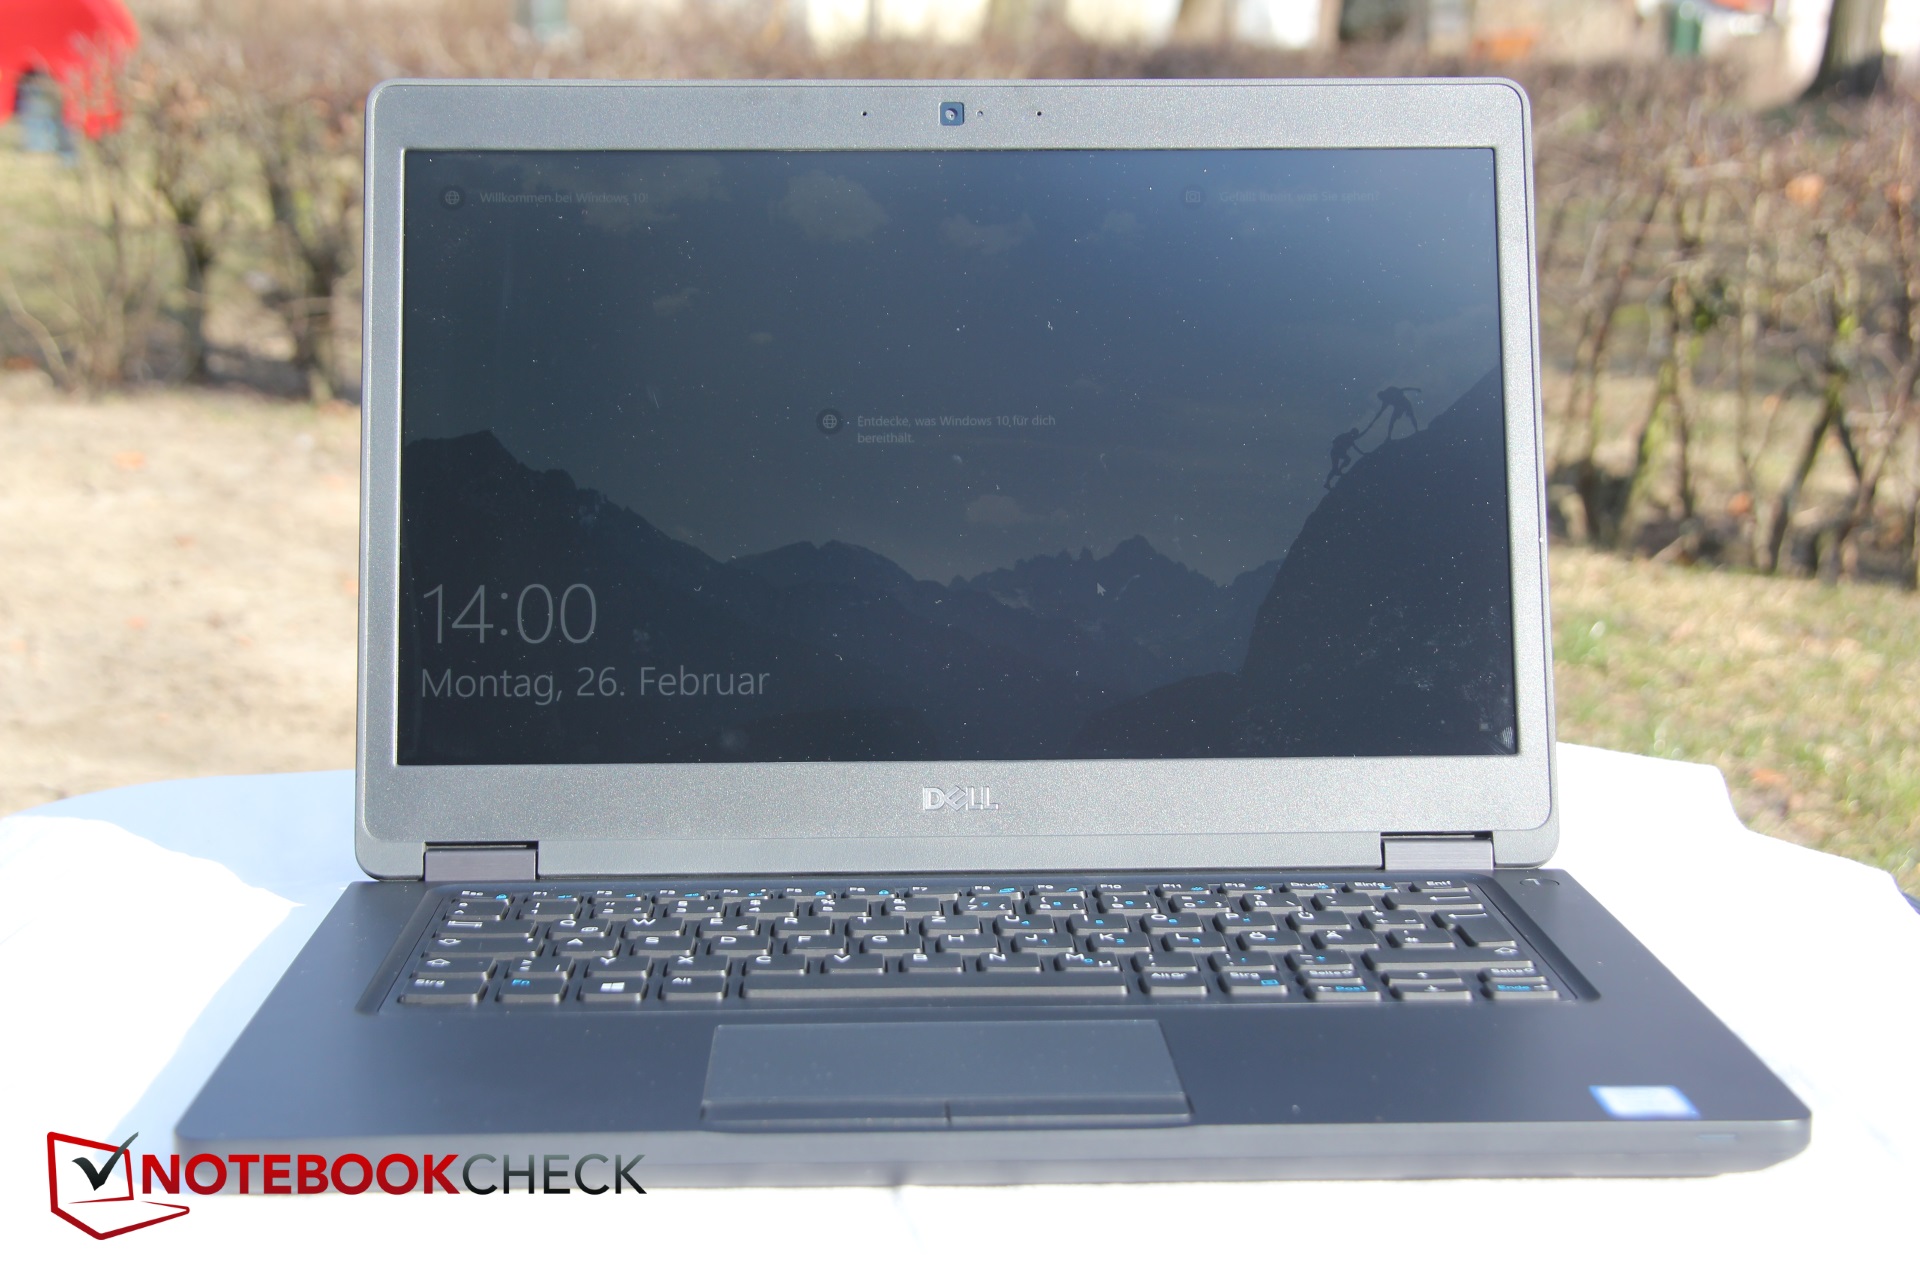
Breve Análise do Portátil Dell Latitude 5490 (Core i7-8650U, Touchscreen)
| BioShock Infinite | |
| 1280x720 Very Low Preset (classificar por valor) | |
| Dell Latitude 5490 | |
| HP EliteBook 840 G4-Z2V49ET ABD | |
| Lenovo ThinkPad T470-20HD002HGE | |
| 1366x768 Medium Preset (classificar por valor) | |
| Dell Latitude 5490 | |
| HP EliteBook 840 G4-Z2V49ET ABD | |
| Lenovo ThinkPad T470-20HD002HGE | |
| 1366x768 High Preset (classificar por valor) | |
| Dell Latitude 5490 | |
| HP EliteBook 840 G4-Z2V49ET ABD | |
| Lenovo ThinkPad T470-20HD002HGE | |
| 1920x1080 Ultra Preset, DX11 (DDOF) (classificar por valor) | |
| Dell Latitude 5490 | |
| HP EliteBook 840 G4-Z2V49ET ABD | |
| Lenovo ThinkPad T470-20HD002HGE | |
| SD Card Reader | |
| average JPG Copy Test (av. of 3 runs) | |
| Dell Latitude 5490-TD70X (Toshiba Exceria Pro SDXC 64 GB UHS-II) | |
| Dell Latitude 5490 (Toshiba Exceria Pro SDXC 64 GB UHS-II) | |
| Dell Latitude 5480 (Toshiba Exceria Pro SDXC 64 GB UHS-II) | |
| Lenovo ThinkPad T470-20HD002HGE (Toshiba Exceria Pro SDXC 64 GB UHS-II) | |
| HP EliteBook 840 G4-Z2V49ET ABD (Toshiba Exceria Pro SDXC 64 GB UHS-II) | |
| Média da turma Office (19.8 - 198.5, n=22, últimos 2 anos) | |
| maximum AS SSD Seq Read Test (1GB) | |
| Dell Latitude 5480 (Toshiba Exceria Pro SDXC 64 GB UHS-II) | |
| Dell Latitude 5490-TD70X (Toshiba Exceria Pro SDXC 64 GB UHS-II) | |
| Dell Latitude 5490 (Toshiba Exceria Pro SDXC 64 GB UHS-II) | |
| Lenovo ThinkPad T470-20HD002HGE (Toshiba Exceria Pro SDXC 64 GB UHS-II) | |
| HP EliteBook 840 G4-Z2V49ET ABD (Toshiba Exceria Pro SDXC 64 GB UHS-II) | |
| Média da turma Office (27.4 - 249, n=21, últimos 2 anos) | |
| Networking | |
| iperf3 transmit AX12 | |
| Dell Latitude 5490 | |
| Lenovo ThinkPad T470-20HD002HGE | |
| Dell Latitude 5490-TD70X | |
| HP EliteBook 840 G4-Z2V49ET ABD (jseb) | |
| Dell Latitude 5480 | |
| iperf3 receive AX12 | |
| Lenovo ThinkPad T470-20HD002HGE | |
| Dell Latitude 5490 | |
| Dell Latitude 5480 | |
| Dell Latitude 5490-TD70X | |
| HP EliteBook 840 G4-Z2V49ET ABD (jseb) | |
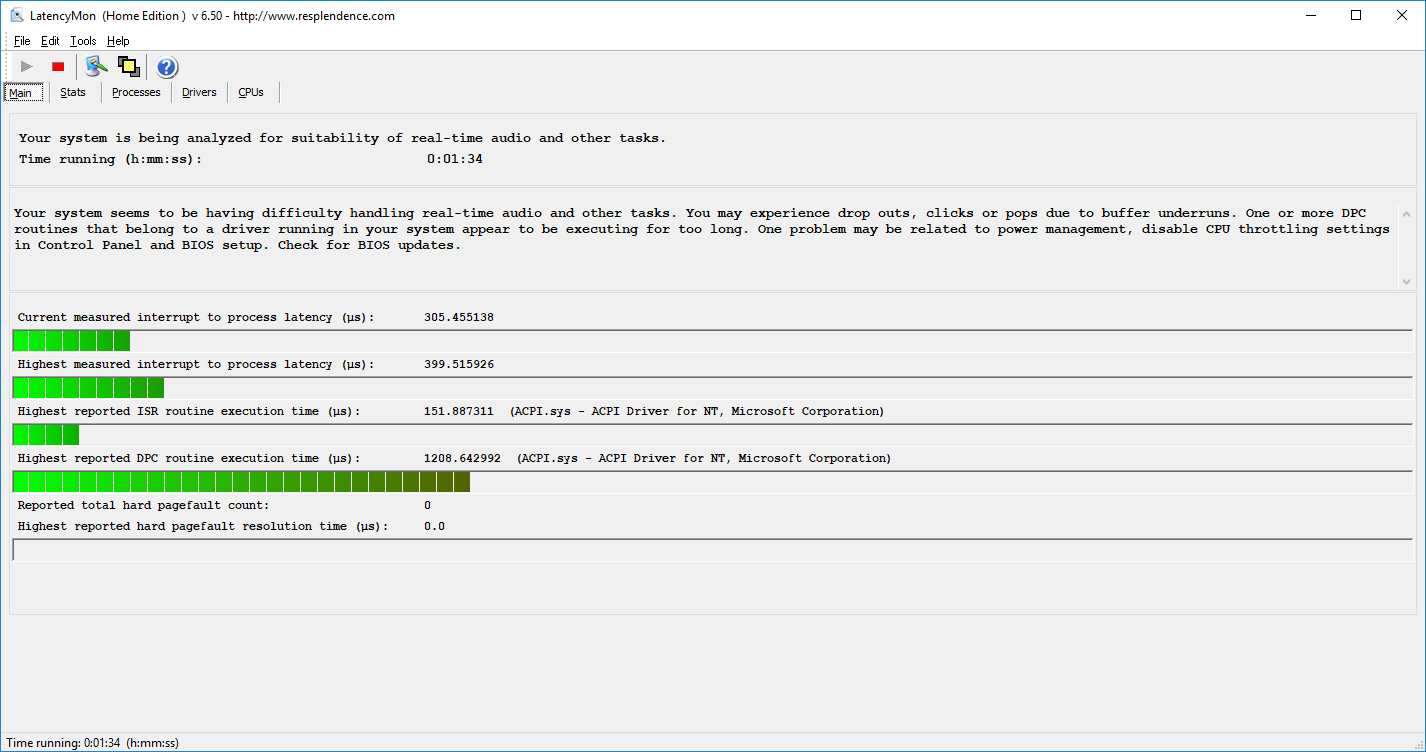
| |||||||||||||||||||||||||
iluminação: 87 %
iluminação com acumulador: 200.6 cd/m²
Contraste: 1254:1 (Preto: 0.16 cd/m²)
ΔE ColorChecker Calman: 8.36 | ∀{0.5-29.43 Ø4.71}
calibrated: 4.6
ΔE Greyscale Calman: 7.7 | ∀{0.09-98 Ø4.96}
54.2% sRGB (Argyll 1.6.3 3D)
34.5% AdobeRGB 1998 (Argyll 1.6.3 3D)
37.62% AdobeRGB 1998 (Argyll 3D)
54.6% sRGB (Argyll 3D)
36.42% Display P3 (Argyll 3D)
Gamma: 2.773
CCT: 6397 K
| Dell Latitude 5490 AUO133D, IPS, 14", 1920x1080 | Dell Latitude 5490-TD70X AU Optronics AUO263D, IPS, 14", 1920x1080 | Dell Latitude 5480 LG Philips LGD0553, IPS, 14", 1920x1080 | HP EliteBook 840 G4-Z2V49ET ABD AUO123D, TN, 14", 1920x1080 | Lenovo ThinkPad T480-20L6S01V00 Lenovo LP140WF6-SPB7, IPS, 14", 1920x1080 | Lenovo ThinkPad T470-20HD002HGE N140HCA-EAB, IPS, 14", 1920x1080 | |
|---|---|---|---|---|---|---|
| Display | 0% | 12% | 51% | 8% | 14% | |
| Display P3 Coverage (%) | 36.42 | 36.28 0% | 40.62 12% | 55.8 53% | 39.24 8% | 41.6 14% |
| sRGB Coverage (%) | 54.6 | 54.6 0% | 61.2 12% | 80.7 48% | 58.8 8% | 61.9 13% |
| AdobeRGB 1998 Coverage (%) | 37.62 | 37.48 0% | 41.96 12% | 57.7 53% | 40.56 8% | 43.06 14% |
| Response Times | -35% | -3% | -7% | -4% | -31% | |
| Response Time Grey 50% / Grey 80% * (ms) | 30.4 ? | 46.9 ? -54% | 32.8 ? -8% | 39 ? -28% | 35.6 ? -17% | 41.6 ? -37% |
| Response Time Black / White * (ms) | 27.2 ? | 31.2 ? -15% | 26.4 ? 3% | 23 ? 15% | 24.8 ? 9% | 34 ? -25% |
| PWM Frequency (Hz) | ||||||
| Screen | 11% | 11% | -28% | 14% | 11% | |
| Brightness middle (cd/m²) | 200.6 | 227 13% | 215.9 8% | 346 72% | 307 53% | 306 53% |
| Brightness (cd/m²) | 204 | 211 3% | 205 0% | 317 55% | 295 45% | 287 41% |
| Brightness Distribution (%) | 87 | 88 1% | 90 3% | 86 -1% | 90 3% | 88 1% |
| Black Level * (cd/m²) | 0.16 | 0.19 -19% | 0.22 -38% | 0.86 -438% | 0.25 -56% | 0.3 -88% |
| Contrast (:1) | 1254 | 1195 -5% | 981 -22% | 402 -68% | 1228 -2% | 1020 -19% |
| Colorchecker dE 2000 * | 8.36 | 5.6 33% | 5.1 39% | 8.64 -3% | 5.7 32% | 6.2 26% |
| Colorchecker dE 2000 max. * | 25.63 | 22.4 13% | 15.6 39% | 13.58 47% | 21.3 17% | 13.6 47% |
| Colorchecker dE 2000 calibrated * | 4.6 | 4.7 -2% | ||||
| Greyscale dE 2000 * | 7.7 | 2.4 69% | 4 48% | 11.24 -46% | 3.7 52% | 5.8 25% |
| Gamma | 2.773 79% | 2.44 90% | 2.41 91% | 2.62 84% | 2.11 104% | 2.04 108% |
| CCT | 6397 102% | 6506 100% | 6856 95% | 12530 52% | 7353 88% | 6277 104% |
| Color Space (Percent of AdobeRGB 1998) (%) | 34.5 | 34.5 0% | 41.96 22% | 52 51% | 37.4 8% | 39.62 15% |
| Color Space (Percent of sRGB) (%) | 54.2 | 54.4 0% | 61.15 13% | 80 48% | 58.7 8% | 61.44 13% |
| Média Total (Programa/Configurações) | -8% /
3% | 7% /
10% | 5% /
-9% | 6% /
11% | -2% /
6% |
* ... menor é melhor
Exibir tempos de resposta
| ↔ Tempo de resposta preto para branco | ||
|---|---|---|
| 27.2 ms ... ascensão ↗ e queda ↘ combinadas | ↗ 16.4 ms ascensão | 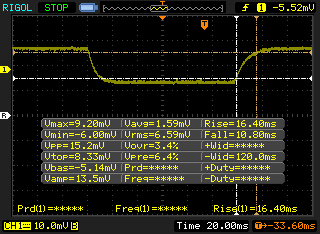 |
| ↘ 10.8 ms queda | ||
| A tela mostra taxas de resposta relativamente lentas em nossos testes e pode ser muito lenta para os jogadores. Em comparação, todos os dispositivos testados variam de 0.1 (mínimo) a 240 (máximo) ms. » 69 % de todos os dispositivos são melhores. Isso significa que o tempo de resposta medido é pior que a média de todos os dispositivos testados (19.8 ms). | ||
| ↔ Tempo de resposta 50% cinza a 80% cinza | ||
| 30.4 ms ... ascensão ↗ e queda ↘ combinadas | ↗ 16.8 ms ascensão | 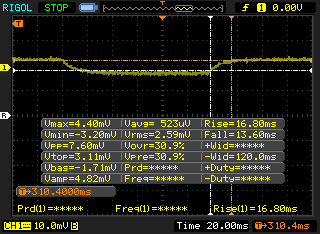 |
| ↘ 13.6 ms queda | ||
| A tela mostra taxas de resposta lentas em nossos testes e será insatisfatória para os jogadores. Em comparação, todos os dispositivos testados variam de 0.165 (mínimo) a 636 (máximo) ms. » 41 % de todos os dispositivos são melhores. Isso significa que o tempo de resposta medido é semelhante à média de todos os dispositivos testados (31 ms). | ||
Cintilação da tela / PWM (modulação por largura de pulso)
| Tela tremeluzindo / PWM não detectado |  | ||
[pwm_comparison] Em comparação: 52 % de todos os dispositivos testados não usam PWM para escurecer a tela. Se PWM foi detectado, uma média de 7757 (mínimo: 5 - máximo: 343500) Hz foi medida. | |||
| wPrime 2.10 - 1024m | |
| Dell Latitude 5480 | |
| Dell Latitude 5490-TD70X | |
| Média da turma Office (208 - 675, n=8, últimos 2 anos) | |
| Dell Latitude 5490 | |
| Média Intel Core i7-8650U (268 - 335, n=3) | |
* ... menor é melhor
| PCMark 10 - Score | |
| Média da turma Office (2601 - 9298, n=68, últimos 2 anos) | |
| Dell Latitude 5490 | |
| Lenovo ThinkPad T480-20L6S01V00 | |
| Média Intel Core i7-8650U, Intel UHD Graphics 620 (2403 - 4078, n=10) | |
| PCMark 8 Home Score Accelerated v2 | 4065 pontos | |
| PCMark 8 Creative Score Accelerated v2 | 5225 pontos | |
| PCMark 8 Work Score Accelerated v2 | 5200 pontos | |
| PCMark 10 Score | 4066 pontos | |
Ajuda | ||
| Dell Latitude 5490 Samsung PM961 MZVLW256HEHP | Dell Latitude 5490-TD70X Toshiba KSG60ZMV512G | HP EliteBook 840 G4-Z2V49ET ABD Samsung PM961 MZVLW256HEHP | Lenovo ThinkPad T480-20L6S01V00 Samsung SSD PM981 MZVLB512HAJQ | Média Samsung PM961 MZVLW256HEHP | |
|---|---|---|---|---|---|
| AS SSD | -20% | 64% | -457% | -33% | |
| Copy Game MB/s (MB/s) | 273.6 | 505 85% | 355.1 30% | 676 147% | 537 ? 96% |
| Copy Program MB/s (MB/s) | 214 | 213 0% | 269.7 26% | 254.8 19% | 343 ? 60% |
| Copy ISO MB/s (MB/s) | 514 | 426.6 -17% | 735 43% | 921 79% | 1004 ? 95% |
| Score Total (Points) | 1834 | 1067 -42% | 3006 64% | 2348 28% | 2565 ? 40% |
| Score Write (Points) | 449 | 381 -15% | 767 71% | 147 -67% | 587 ? 31% |
| Score Read (Points) | 916 | 455 -50% | 1524 66% | 1480 62% | 1378 ? 50% |
| Access Time Write * (ms) | 0.037 | 0.052 -41% | 0.027 27% | 2.515 -6697% | 0.4637 ? -1153% |
| Access Time Read * (ms) | 0.067 | 0.07 -4% | 0.044 34% | 0.041 39% | 0.06777 ? -1% |
| 4K-64 Write (MB/s) | 300.9 | 259.5 -14% | 510 69% | 96.2 -68% | 419 ? 39% |
| 4K-64 Read (MB/s) | 793 | 383.6 -52% | 1215 53% | 1278 61% | 1112 ? 40% |
| 4K Write (MB/s) | 93.6 | 91.7 -2% | 140.2 50% | 1.76 -98% | 91.6 ? -2% |
| 4K Read (MB/s) | 45.99 | 23.75 -48% | 49.21 7% | 58 26% | 45.1 ? -2% |
| Seq Write (MB/s) | 541 | 300.6 -44% | 1167 116% | 487.1 -10% | 960 ? 77% |
| Seq Read (MB/s) | 768 | 473.1 -38% | 2603 239% | 1441 88% | 2019 ? 163% |
* ... menor é melhor

| 3DMark 06 Standard Score | 11732 pontos | |
| 3DMark 11 Performance | 1989 pontos | |
| 3DMark Cloud Gate Standard Score | 8914 pontos | |
| 3DMark Fire Strike Score | 1062 pontos | |
Ajuda | ||
| baixo | média | alto | ultra | |
|---|---|---|---|---|
| BioShock Infinite (2013) | 64 | 35 | 29 | 10 |
Barulho
| Ocioso |
| 27.8 / 27.8 / 31 dB |
| Carga |
| 34.2 / 42.7 dB |
 | ||
30 dB silencioso 40 dB(A) audível 50 dB(A) ruidosamente alto |
||
min: | ||
| Dell Latitude 5490 UHD Graphics 620, i7-8650U, Samsung PM961 MZVLW256HEHP | Dell Latitude 5490-TD70X UHD Graphics 620, i5-8350U, Toshiba KSG60ZMV512G | Dell Latitude 5480 HD Graphics 620, i7-7600U, Toshiba SG5 256GB THNSNK256GVN8 | HP EliteBook 840 G4-Z2V49ET ABD HD Graphics 620, i5-7200U, Samsung PM961 MZVLW256HEHP | Lenovo ThinkPad T480-20L6S01V00 GeForce MX150, i5-8550U, Samsung SSD PM981 MZVLB512HAJQ | Lenovo ThinkPad T470-20HD002HGE HD Graphics 620, i5-7200U, Samsung PM961 NVMe MZVLW512HMJP | |
|---|---|---|---|---|---|---|
| Noise | -2% | -8% | -2% | 1% | 5% | |
| desligado / ambiente * (dB) | 27.8 | 28.8 -4% | 31 -12% | 29 -4% | 28 -1% | |
| Idle Minimum * (dB) | 27.8 | 28.8 -4% | 29.6 -6% | 31 -12% | 29 -4% | 28 -1% |
| Idle Average * (dB) | 27.8 | 28.8 -4% | 29.6 -6% | 31 -12% | 29 -4% | 28 -1% |
| Idle Maximum * (dB) | 31 | 30.9 -0% | 29.6 5% | 31 -0% | 29 6% | 29.4 5% |
| Load Average * (dB) | 34.2 | 35.6 -4% | 42 -23% | 33.5 2% | 35.6 -4% | 31.4 8% |
| Load Maximum * (dB) | 42.7 | 41.4 3% | 47.1 -10% | 33.7 21% | 35.6 17% | 34.6 19% |
| Witcher 3 ultra * (dB) | 32.5 |
* ... menor é melhor
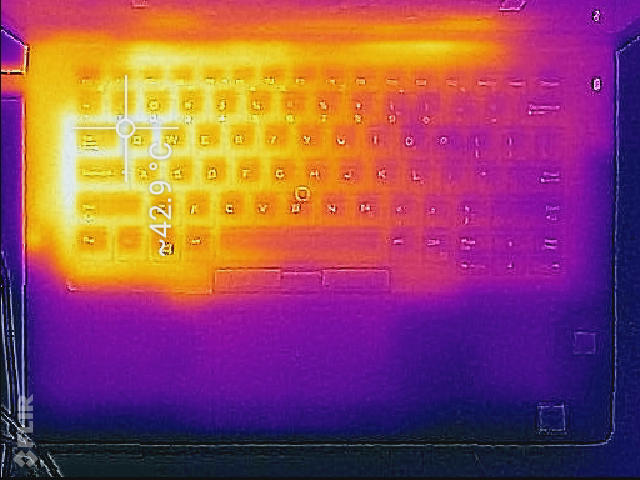
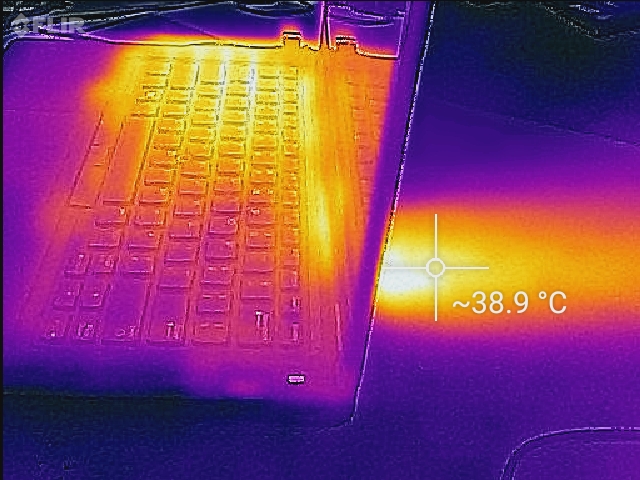
(±) A temperatura máxima no lado superior é 43.4 °C / 110 F, em comparação com a média de 34.3 °C / 94 F , variando de 21.2 a 62.5 °C para a classe Office.
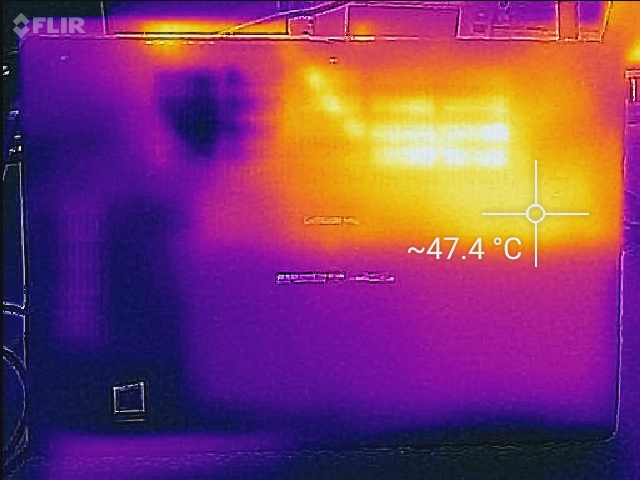
(-) A parte inferior aquece até um máximo de 47.8 °C / 118 F, em comparação com a média de 36.8 °C / 98 F
(+) Em uso inativo, a temperatura média para o lado superior é 26.3 °C / 79 F, em comparação com a média do dispositivo de 29.5 °C / ### class_avg_f### F.
(+) Os apoios para as mãos e o touchpad são mais frios que a temperatura da pele, com um máximo de 28.2 °C / 82.8 F e, portanto, são frios ao toque.
(±) A temperatura média da área do apoio para as mãos de dispositivos semelhantes foi 27.5 °C / 81.5 F (-0.7 °C / -1.3 F).
Dell Latitude 5490 análise de áudio
(±) | o volume do alto-falante é médio, mas bom (###valor### dB)
Graves 100 - 315Hz
(-) | quase nenhum baixo - em média 15.5% menor que a mediana
(±) | a linearidade dos graves é média (9.3% delta para a frequência anterior)
Médios 400 - 2.000 Hz
(+) | médios equilibrados - apenas 3.9% longe da mediana
(±) | a linearidade dos médios é média (9.5% delta para frequência anterior)
Altos 2 - 16 kHz
(+) | agudos equilibrados - apenas 1.5% longe da mediana
(+) | os máximos são lineares (1.7% delta da frequência anterior)
Geral 100 - 16.000 Hz
(±) | a linearidade do som geral é média (17.4% diferença em relação à mediana)
Comparado com a mesma classe
» 27% de todos os dispositivos testados nesta classe foram melhores, 7% semelhantes, 66% piores
» O melhor teve um delta de 7%, a média foi 21%, o pior foi 53%
Comparado com todos os dispositivos testados
» 33% de todos os dispositivos testados foram melhores, 8% semelhantes, 58% piores
» O melhor teve um delta de 4%, a média foi 23%, o pior foi 134%
Lenovo ThinkPad T470-20HD002HGE análise de áudio
(±) | o volume do alto-falante é médio, mas bom (###valor### dB)
Graves 100 - 315Hz
(-) | quase nenhum baixo - em média 16.6% menor que a mediana
(±) | a linearidade dos graves é média (8.8% delta para a frequência anterior)
Médios 400 - 2.000 Hz
(+) | médios equilibrados - apenas 4.3% longe da mediana
(+) | médios são lineares (6.7% delta para frequência anterior)
Altos 2 - 16 kHz
(±) | máximos mais altos - em média 5.4% maior que a mediana
(±) | a linearidade dos máximos é média (13.3% delta para frequência anterior)
Geral 100 - 16.000 Hz
(±) | a linearidade do som geral é média (18.7% diferença em relação à mediana)
Comparado com a mesma classe
» 35% de todos os dispositivos testados nesta classe foram melhores, 6% semelhantes, 59% piores
» O melhor teve um delta de 7%, a média foi 21%, o pior foi 53%
Comparado com todos os dispositivos testados
» 43% de todos os dispositivos testados foram melhores, 8% semelhantes, 49% piores
» O melhor teve um delta de 4%, a média foi 23%, o pior foi 134%
| desligado | |
| Ocioso | |
| Carga |
|
Key:
min: | |
| Dell Latitude 5490 i7-8650U, UHD Graphics 620, Samsung PM961 MZVLW256HEHP, IPS, 1920x1080, 14" | Dell Latitude 5490-TD70X i5-8350U, UHD Graphics 620, Toshiba KSG60ZMV512G, IPS, 1920x1080, 14" | Dell Latitude 5480 i7-7600U, HD Graphics 620, Toshiba SG5 256GB THNSNK256GVN8, IPS, 1920x1080, 14" | HP EliteBook 840 G4-Z2V49ET ABD i5-7200U, HD Graphics 620, Samsung PM961 MZVLW256HEHP, TN, 1920x1080, 14" | Lenovo ThinkPad T470-20HD002HGE i5-7200U, HD Graphics 620, Samsung PM961 NVMe MZVLW512HMJP, IPS, 1920x1080, 14" | |
|---|---|---|---|---|---|
| Power Consumption | 0% | -3% | 19% | 19% | |
| Idle Minimum * (Watt) | 3.9 | 3.3 15% | 6.64 -70% | 2.9 26% | 3.21 18% |
| Idle Average * (Watt) | 6.2 | 5.54 11% | 6.67 -8% | 5.6 10% | 6.15 1% |
| Idle Maximum * (Watt) | 7.7 | 6.59 14% | 7.78 -1% | 8.15 -6% | 6.82 11% |
| Load Average * (Watt) | 43.9 | 42.4 3% | 30.83 30% | 30.6 30% | 28.5 35% |
| Load Maximum * (Watt) | 47.7 | 67.6 -42% | 31.7 34% | 31 35% | 34.5 28% |
* ... menor é melhor
| Dell Latitude 5490 i7-8650U, UHD Graphics 620, 68 Wh | Dell Latitude 5490-TD70X i5-8350U, UHD Graphics 620, 68 Wh | Dell Latitude 5480 i7-7600U, HD Graphics 620, 68 Wh | HP EliteBook 840 G4-Z2V49ET ABD i5-7200U, HD Graphics 620, 51 Wh | Lenovo ThinkPad T470-20HD002HGE i5-7200U, HD Graphics 620, 48 Wh | |
|---|---|---|---|---|---|
| Duração da bateria | 29% | 39% | -18% | -37% | |
| WiFi v1.3 (h) | 11.6 | 15 29% | 16.1 39% | 9.5 -18% | 7.3 -37% |
| Reader / Idle (h) | 25.9 | 24.1 | 19.3 | ||
| Load (h) | 1.6 | 2.7 | 3.1 | 1.8 |
Pro
Contra

Para uma máquina centrada na produtividade, o Latitude 5490 certamente atende a maioria dos requisitos. Ele apresenta um forte desempenho de aplicativos, uma carcaça robusta e bem construída, ampla seleção de portas, excelentes dispositivos de entrada e bateria de duração excepcionalmente longa. Também é bastante silencioso e discreto durante o uso típico, por isso é adequado para um ambiente de escritório. As vantagens que esta configuração de $1.788 traz sobre o dispositivos que avaliamos em março são: o seu muito mais rápido, desempenho de múltiplos núcleos e single-core marginalmente mais rápido, um SSD NVMe de melhor desempenho, mais recursos de segurança, um teclado retroiluminado e uma tela táctil. Tudo isso é bem-vindo (apesar do custo - que discutiremos em um momento), exceto pela tela táctil, que torna a tela ruim ainda pior, convertendo-a de um painel antirreflexo escuro para um painel sombrio, escuro, e altamente refletivo que às vezes é quase inutilizável. Já dissemos isso antes, mas o 5490 precisa desesperadamente de uma tela muito mais brilhante com um acabamento antirreflexo.
Nenhuma máquina é perfeita e, pelo menos em termos de desempenho e duração da bateria, o Latitude 5490 tem poucos concorrentes em sua classe. Se apenas a tela fosse melhor, poderíamos recomendá-lo de todo coração.
Além desta queixa principal, existem alguns outros problemas: a máquina é bastante pesada, falta Thunderbolt 3 e o consumo de energia e as temperaturas da superfície não são ideais. Alguns concorrentes—como o HP EliteBook 840 G4 e Lenovo ThinkPad T480—lidam com esses itens de forma mais efetiva. O próprio Latitude 7490 e 7390 da Dell, também são excelentes alternativas (embora mais caras) para este dispositivo, que possuem muito poucas falhas. No entanto, nenhuma máquina é perfeita e, pelo menos em termos de desempenho e duração da bateria, o Latitude 5490 tem poucos concorrentes em sua classe. Se apenas a tela fosse melhor, poderíamos recomendá-lo de todo coração.
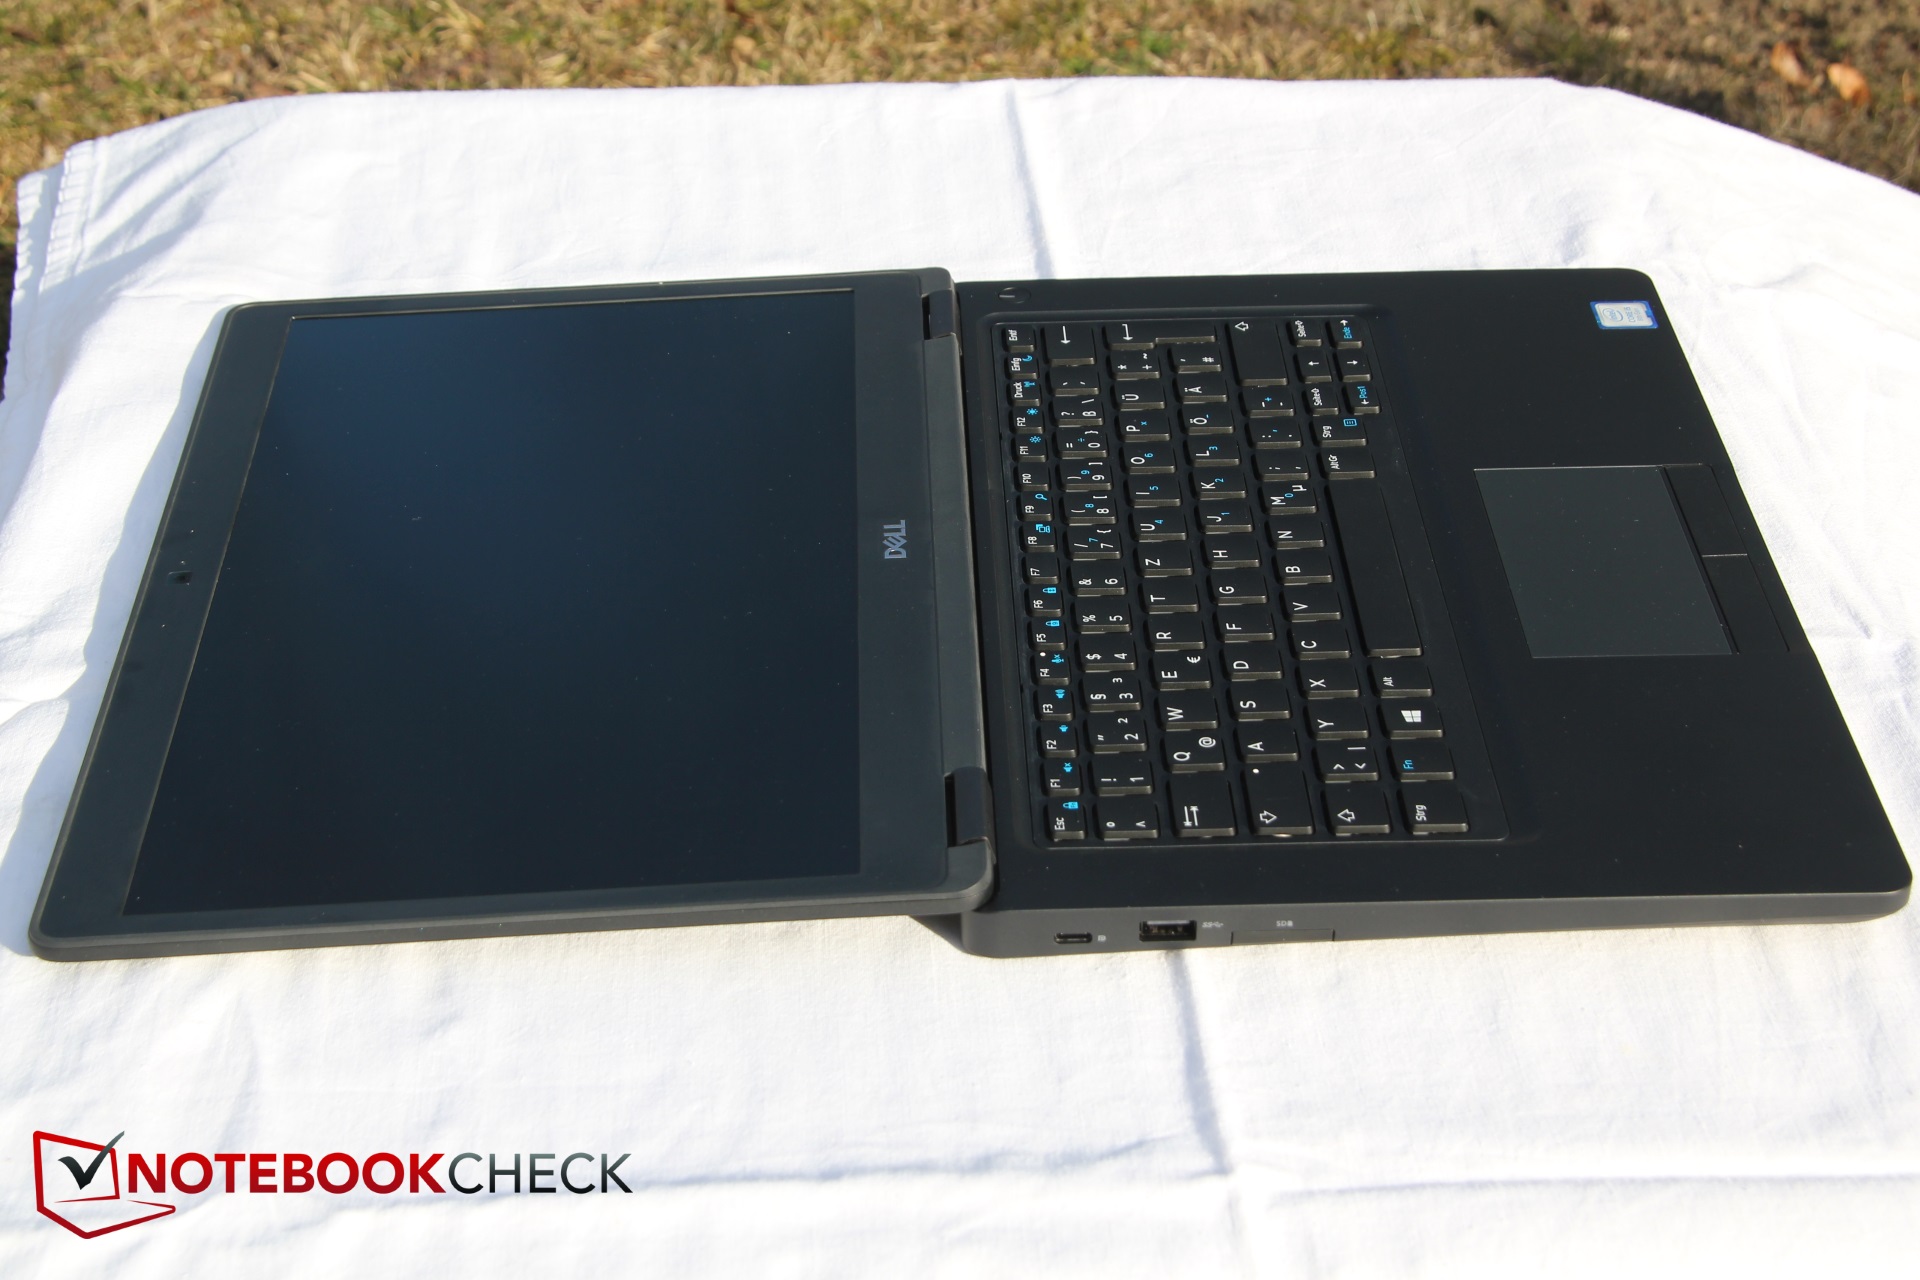
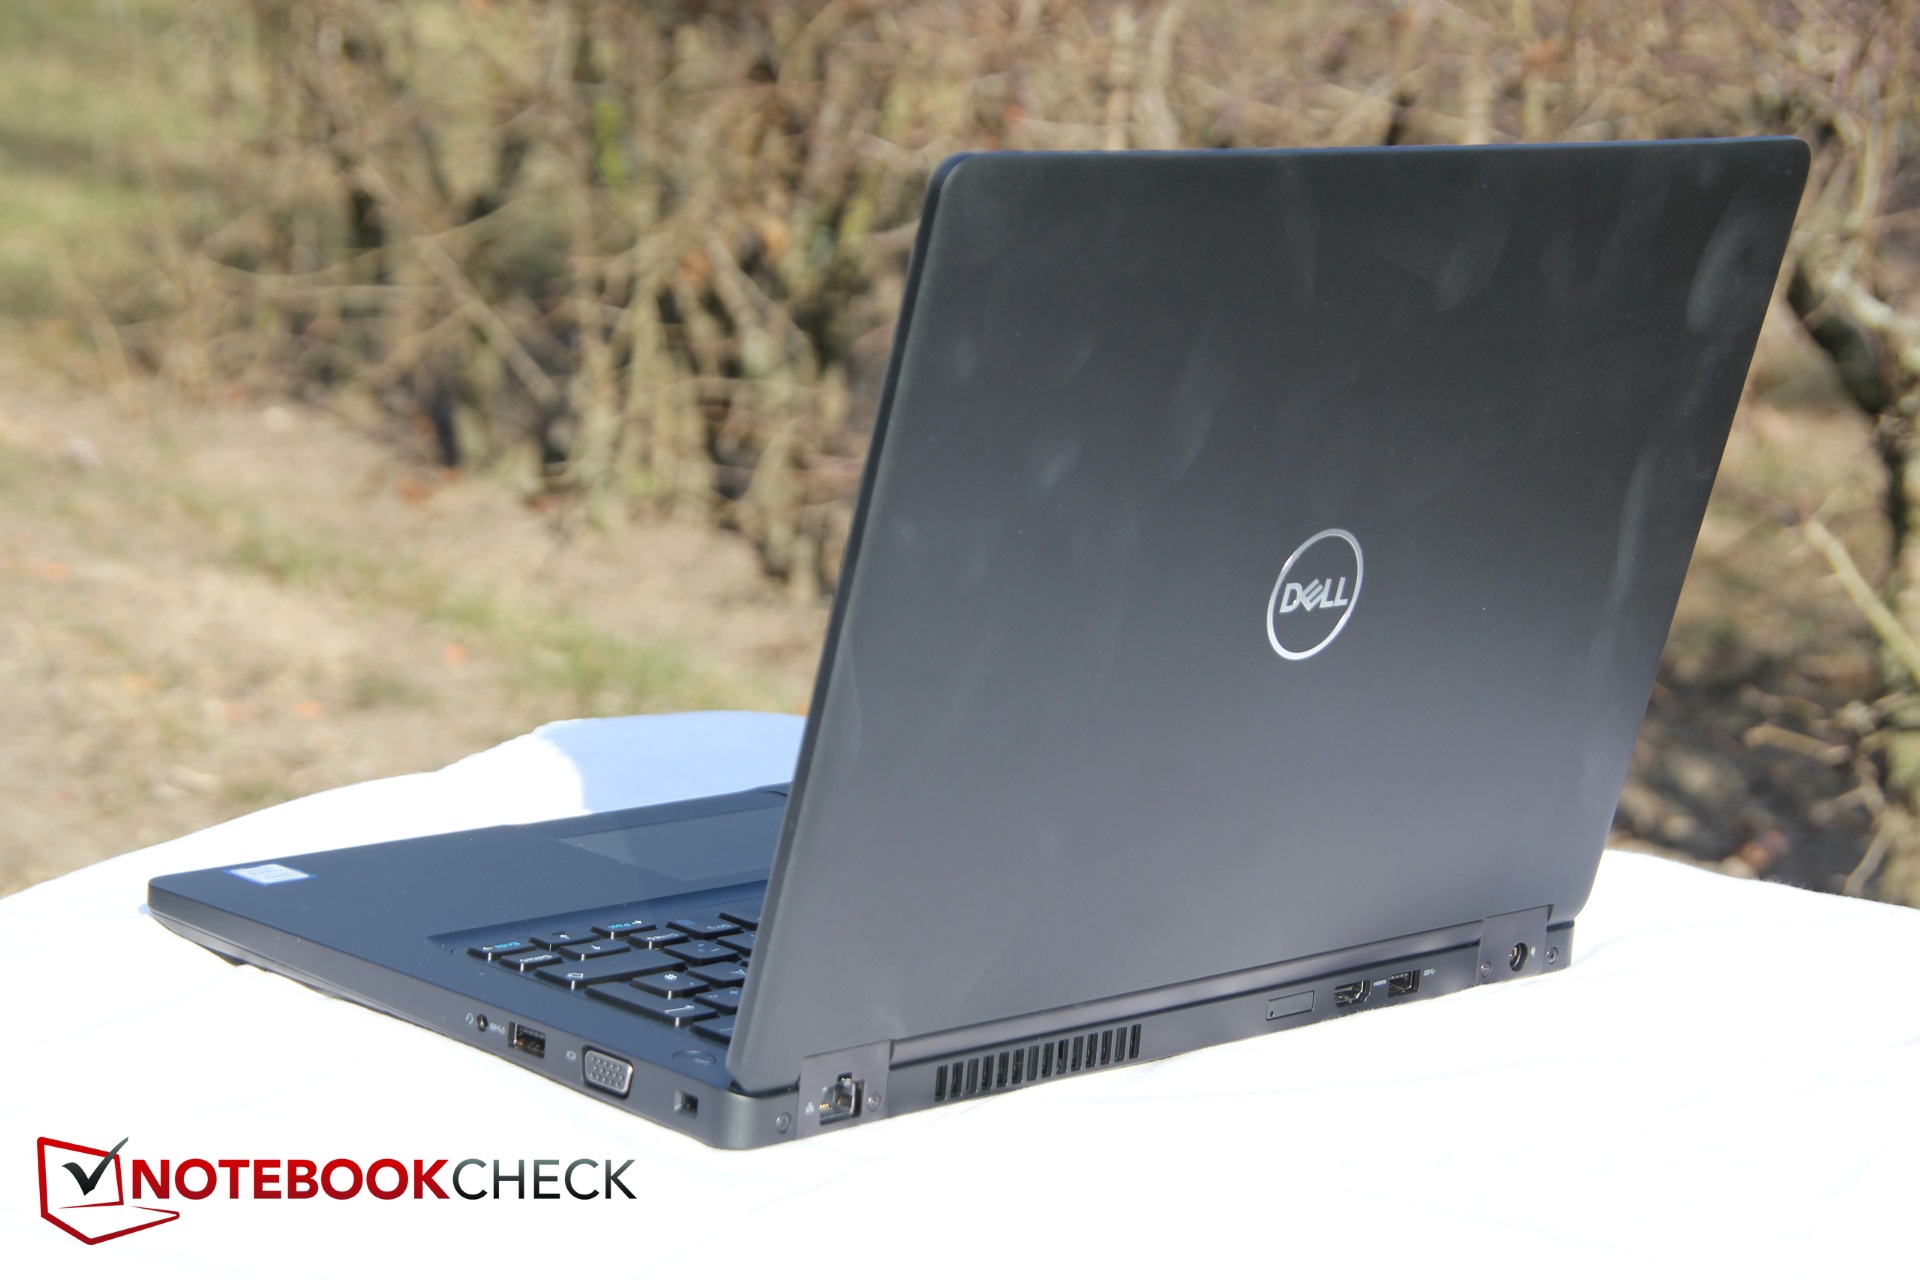
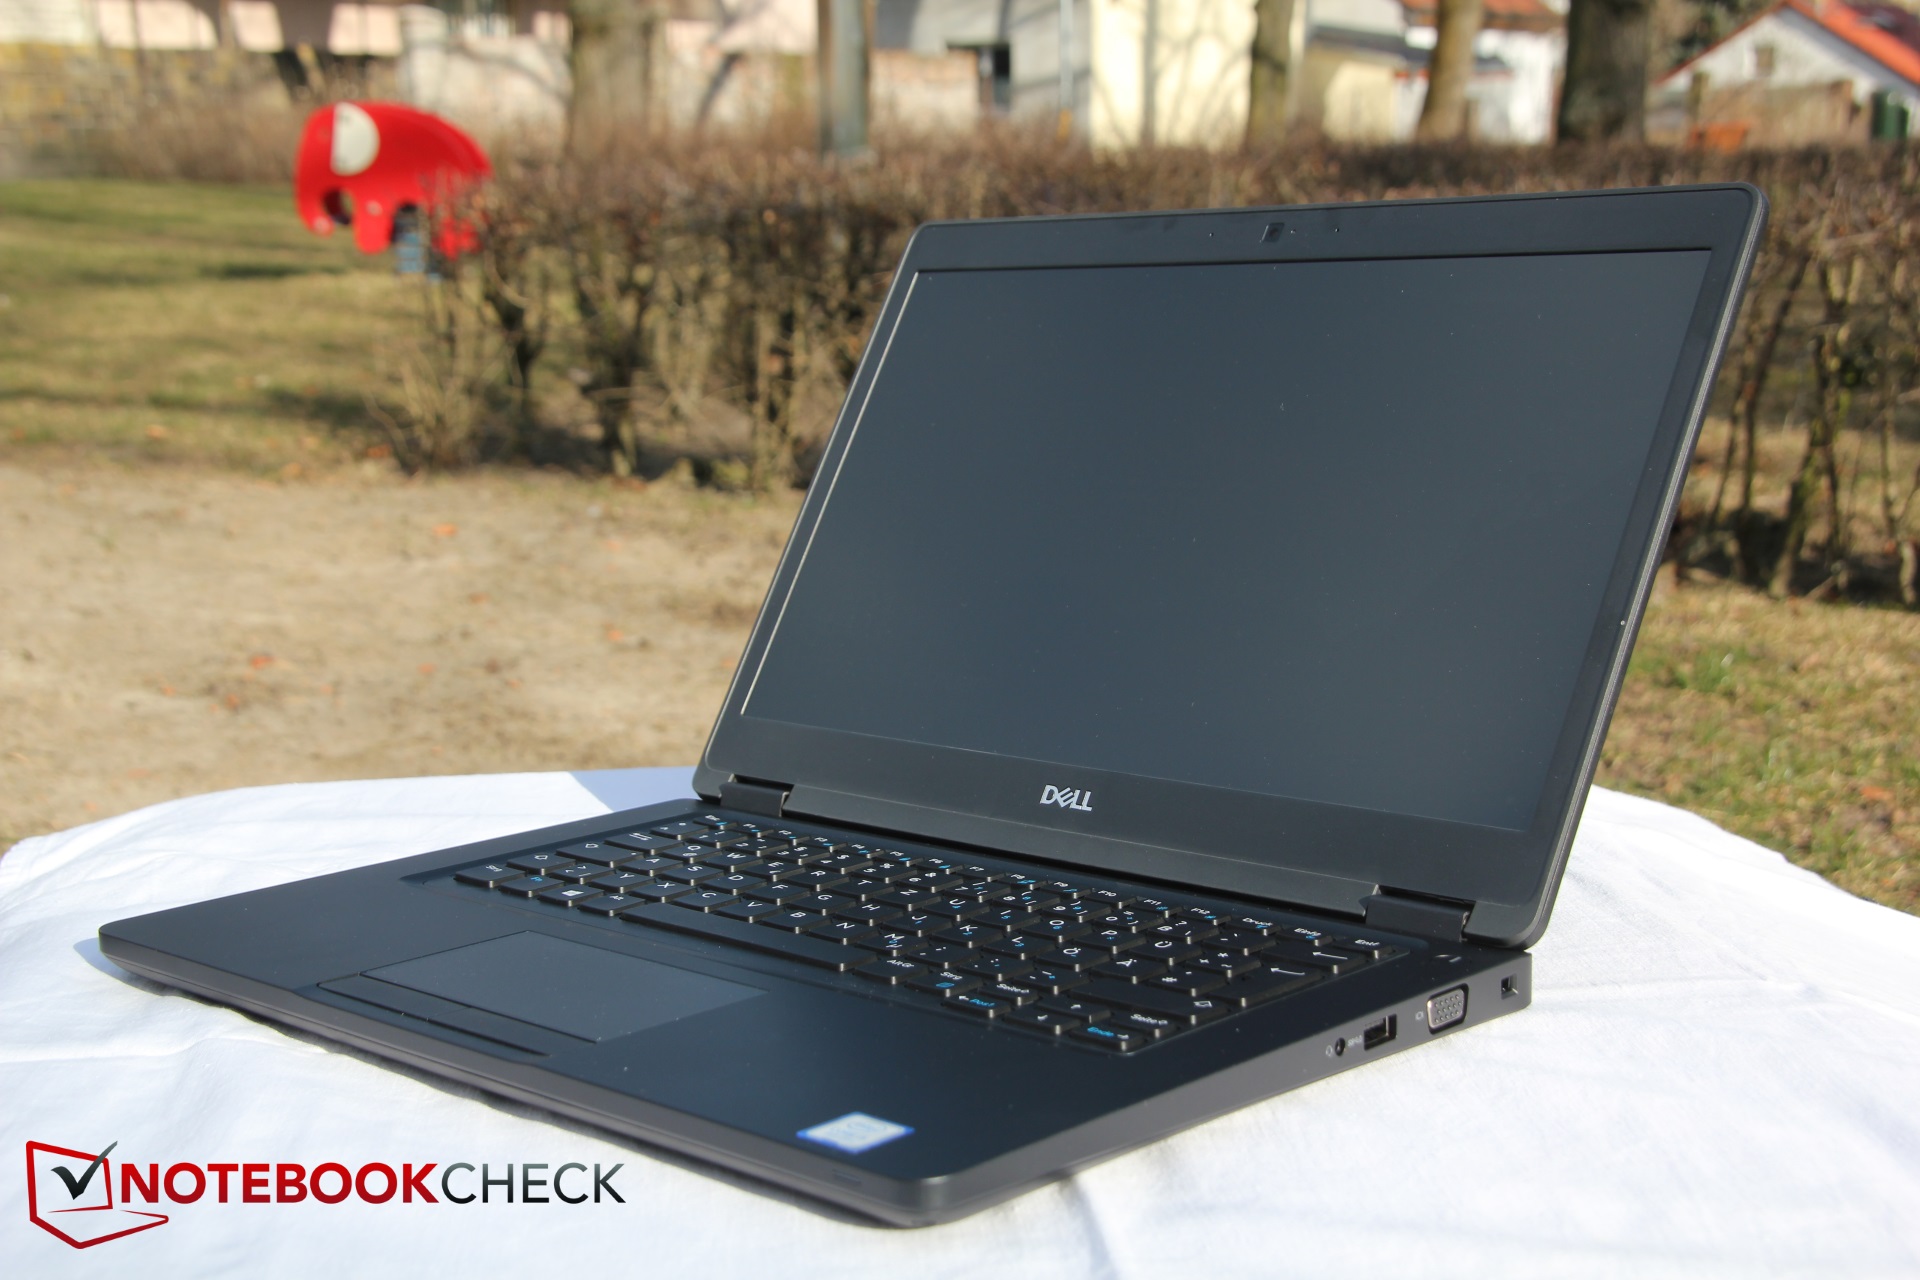
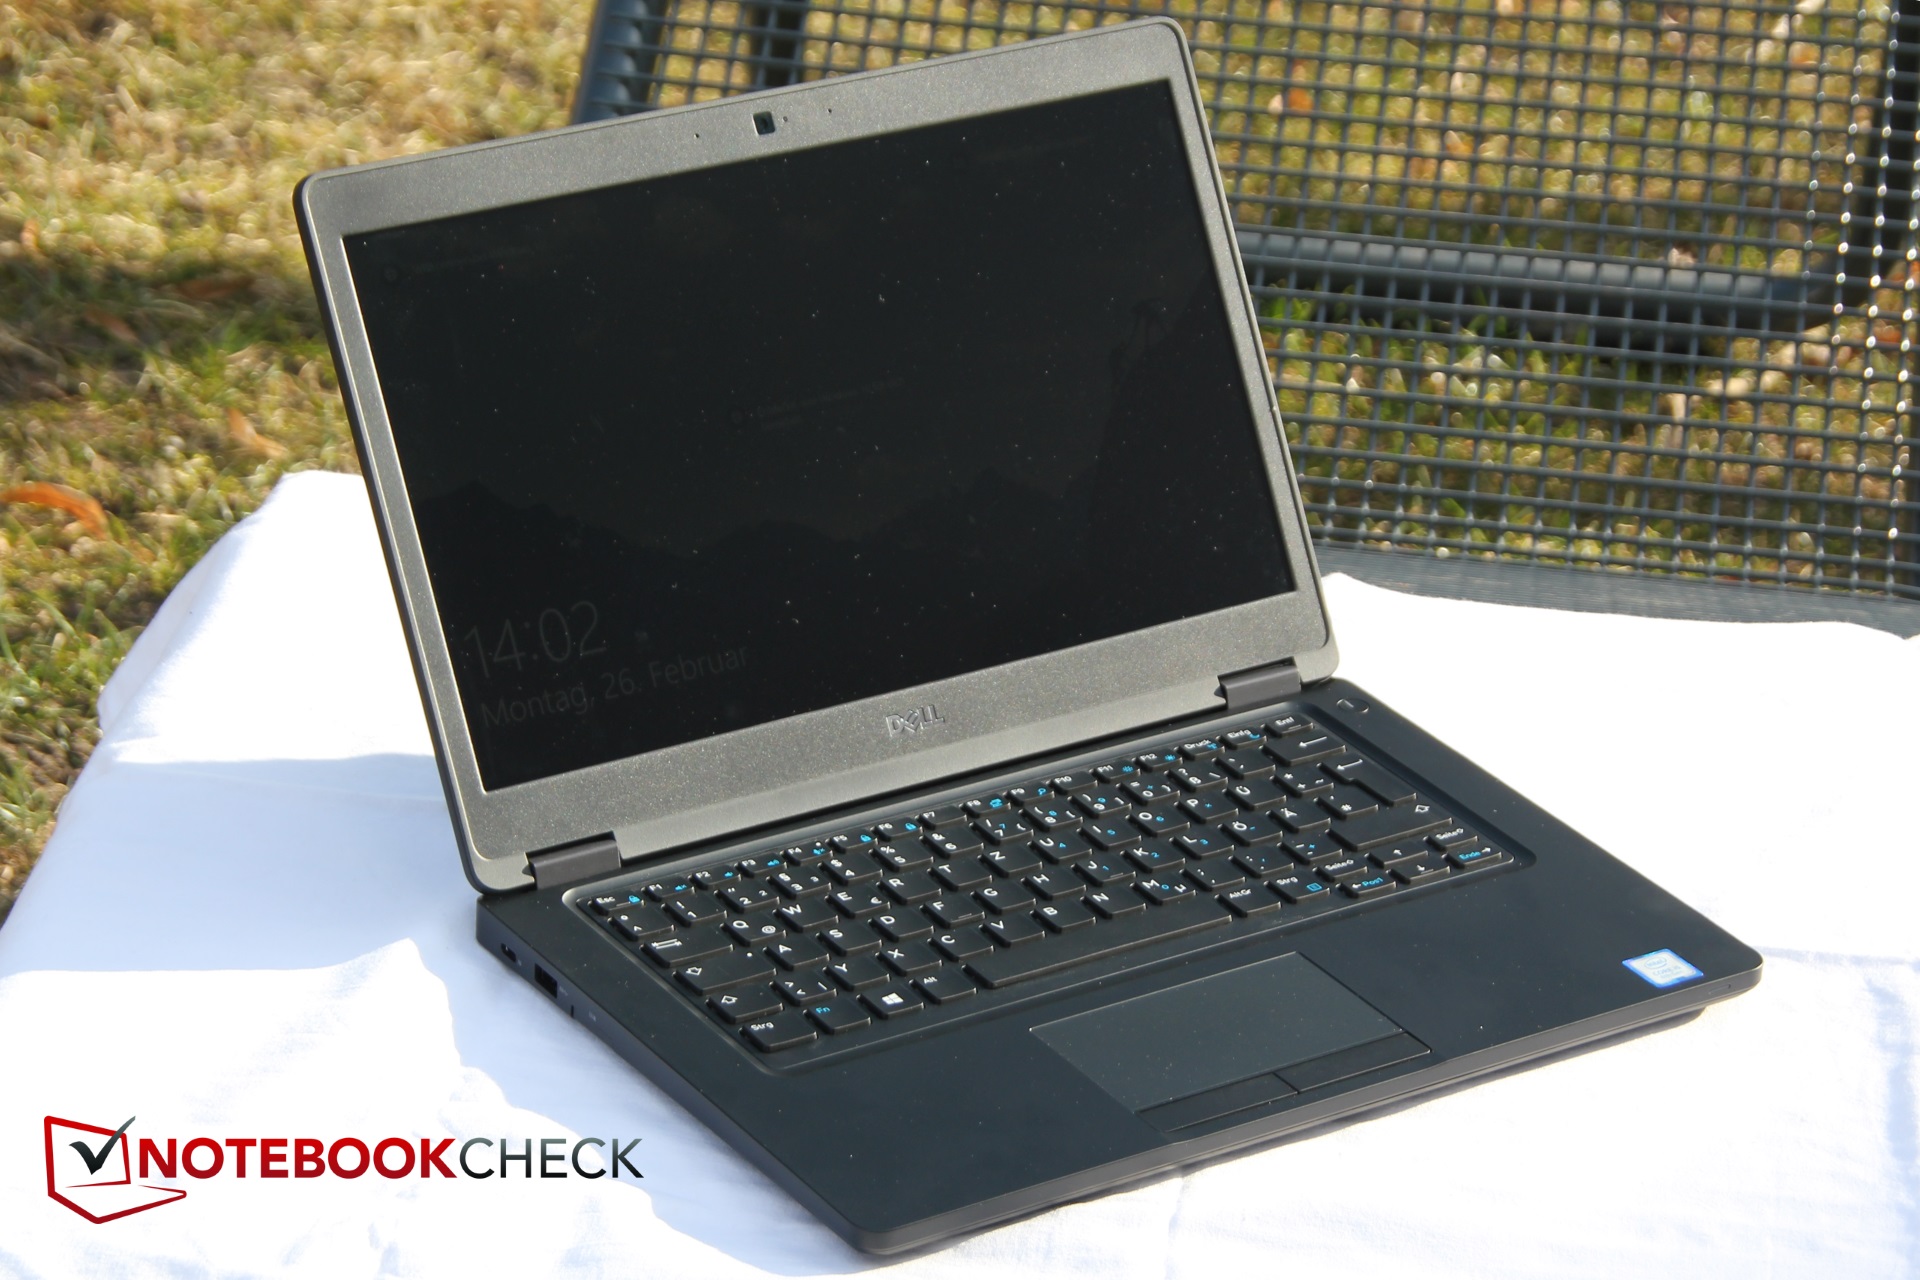
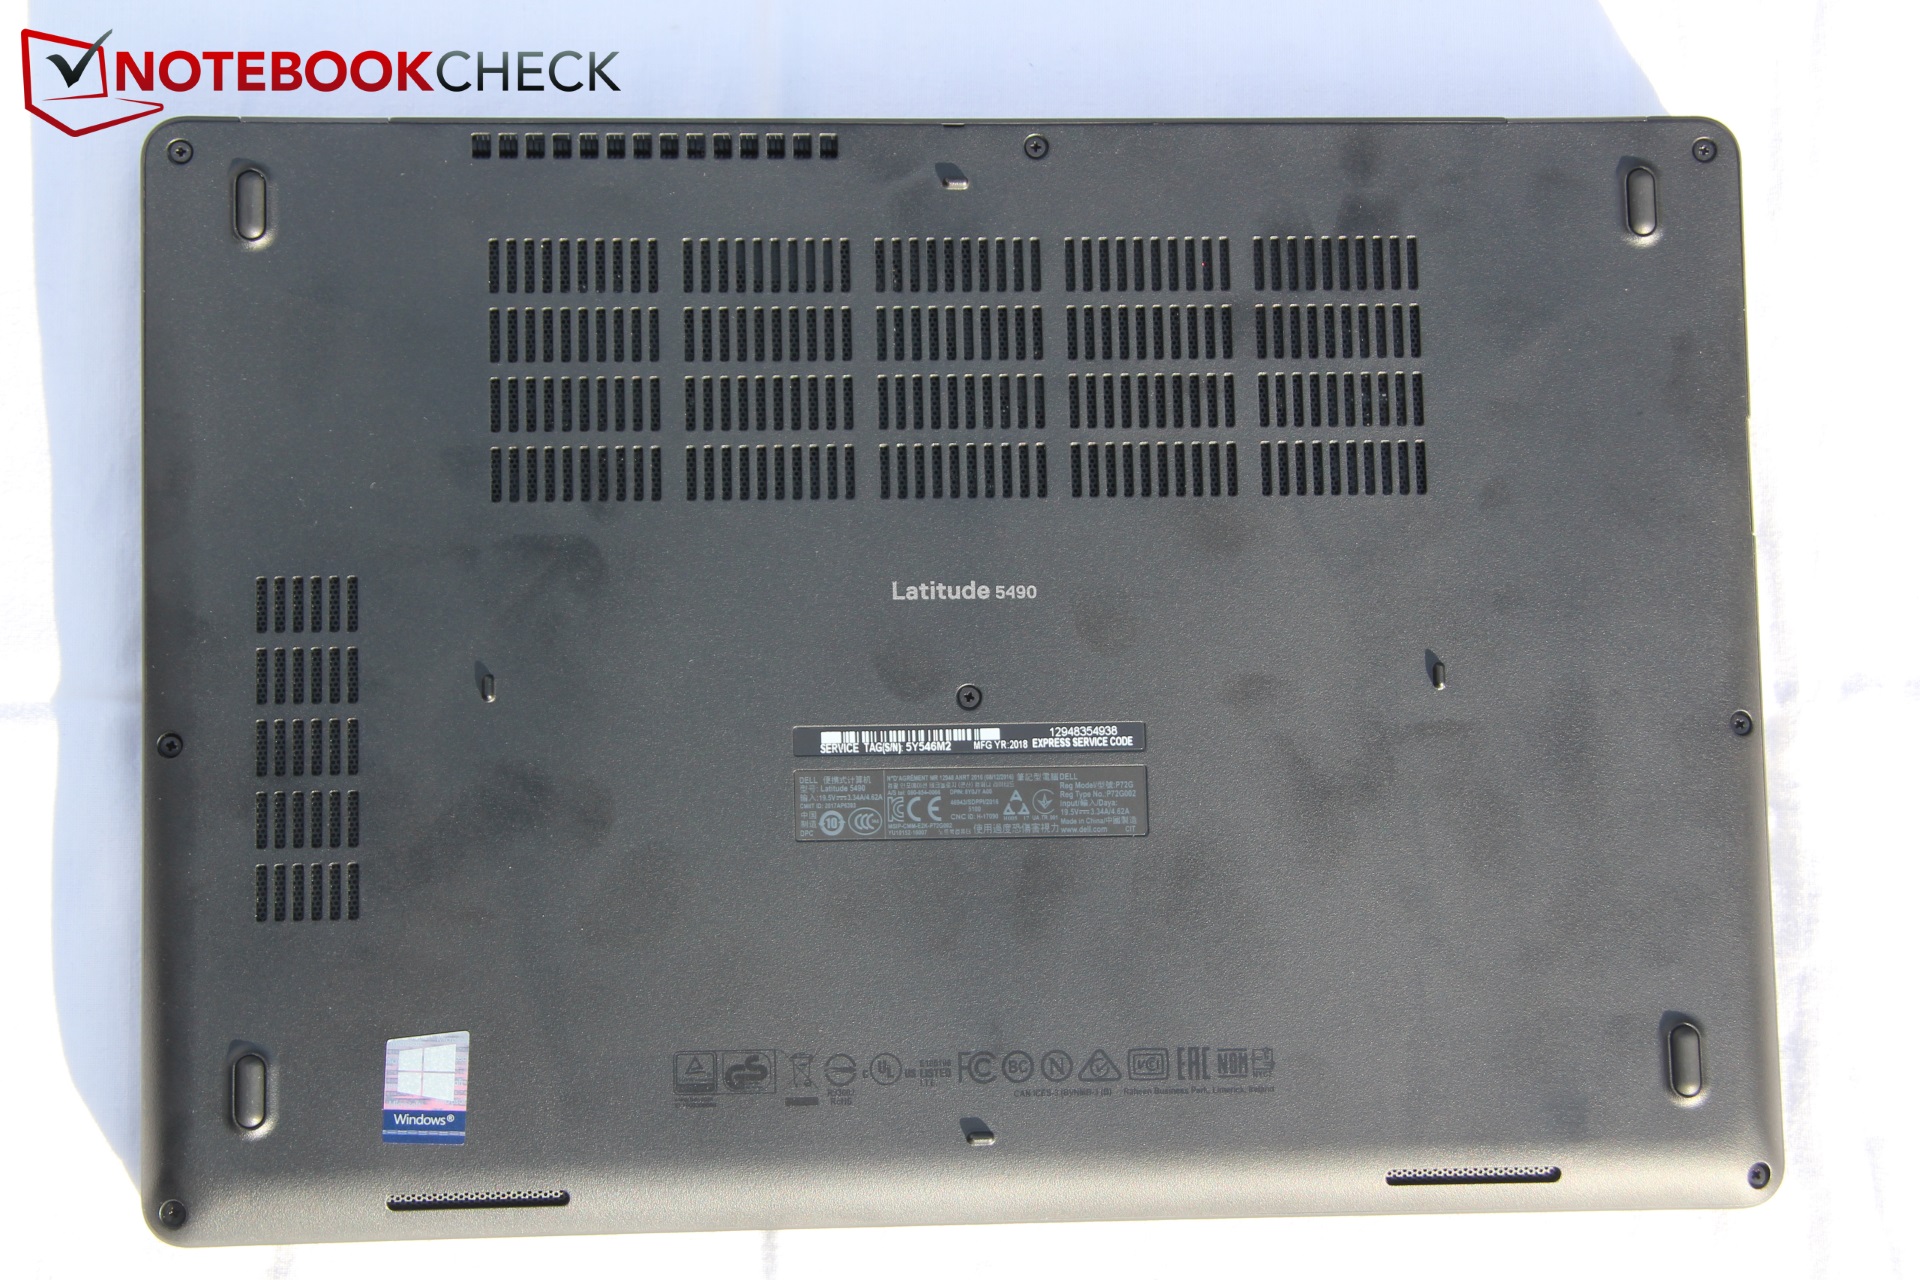
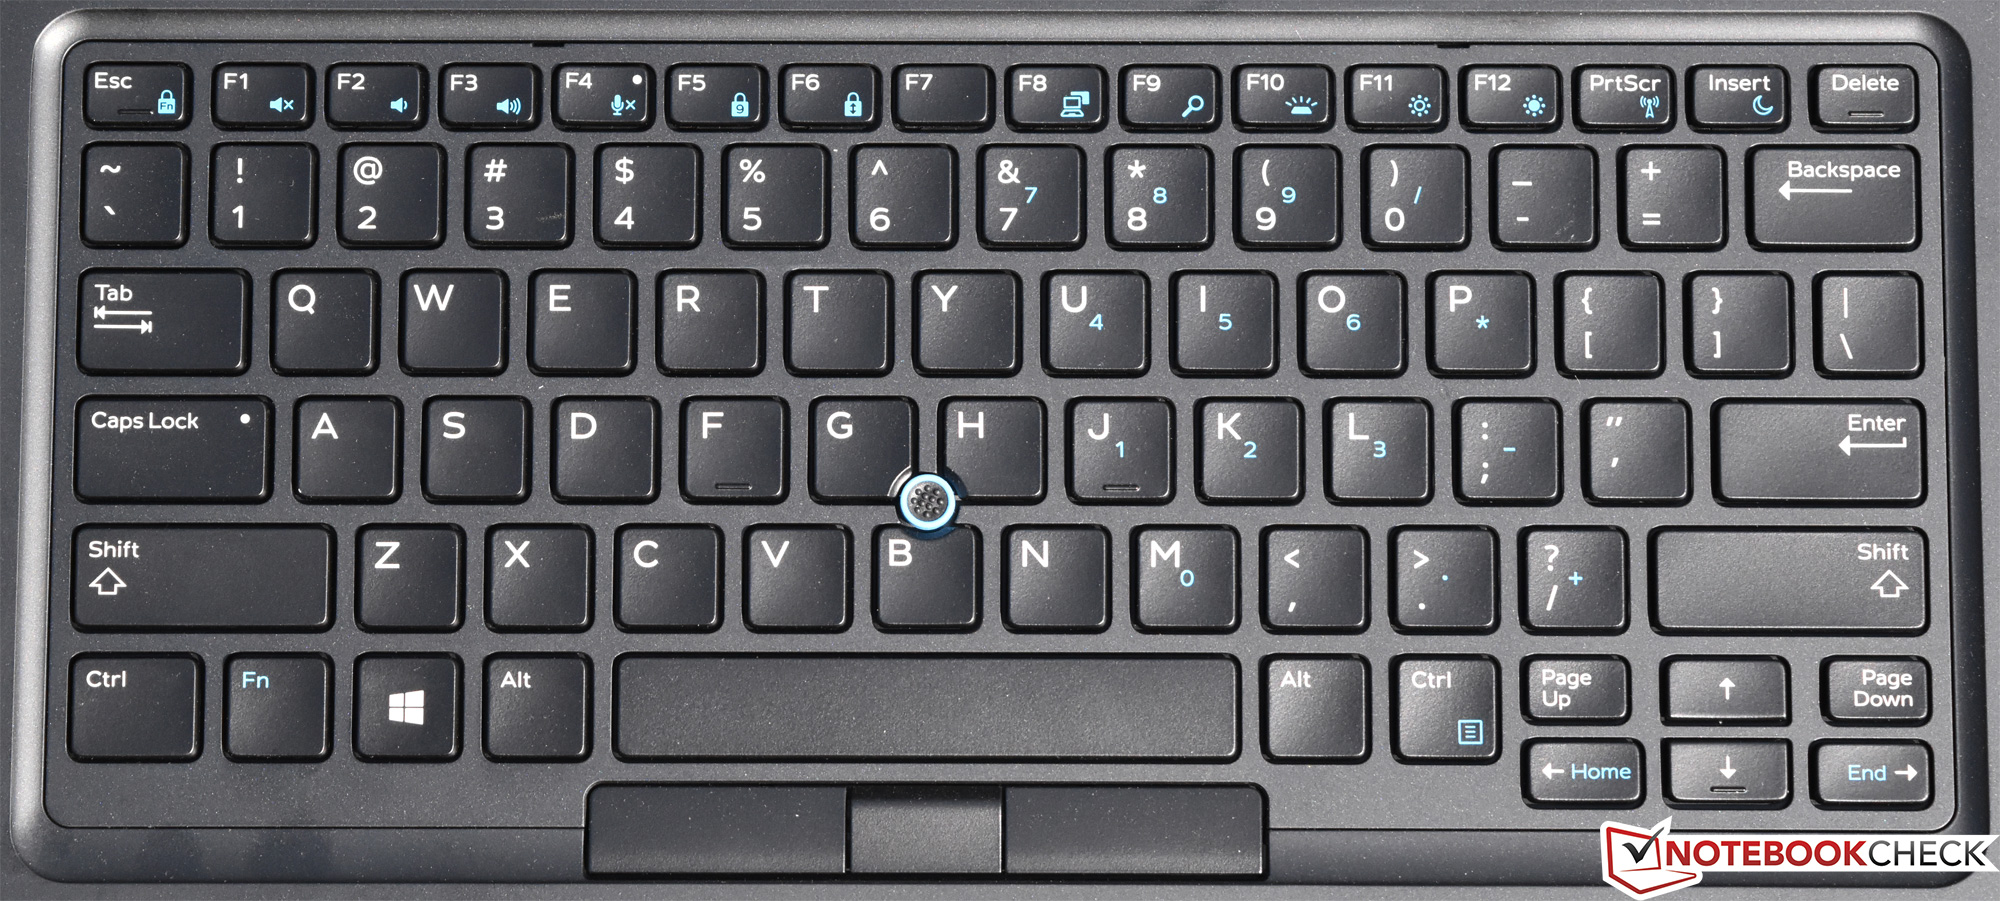
Dell Latitude 5490
- 05/12/2018 v6 (old)
Steve Schardein
Price comparison
