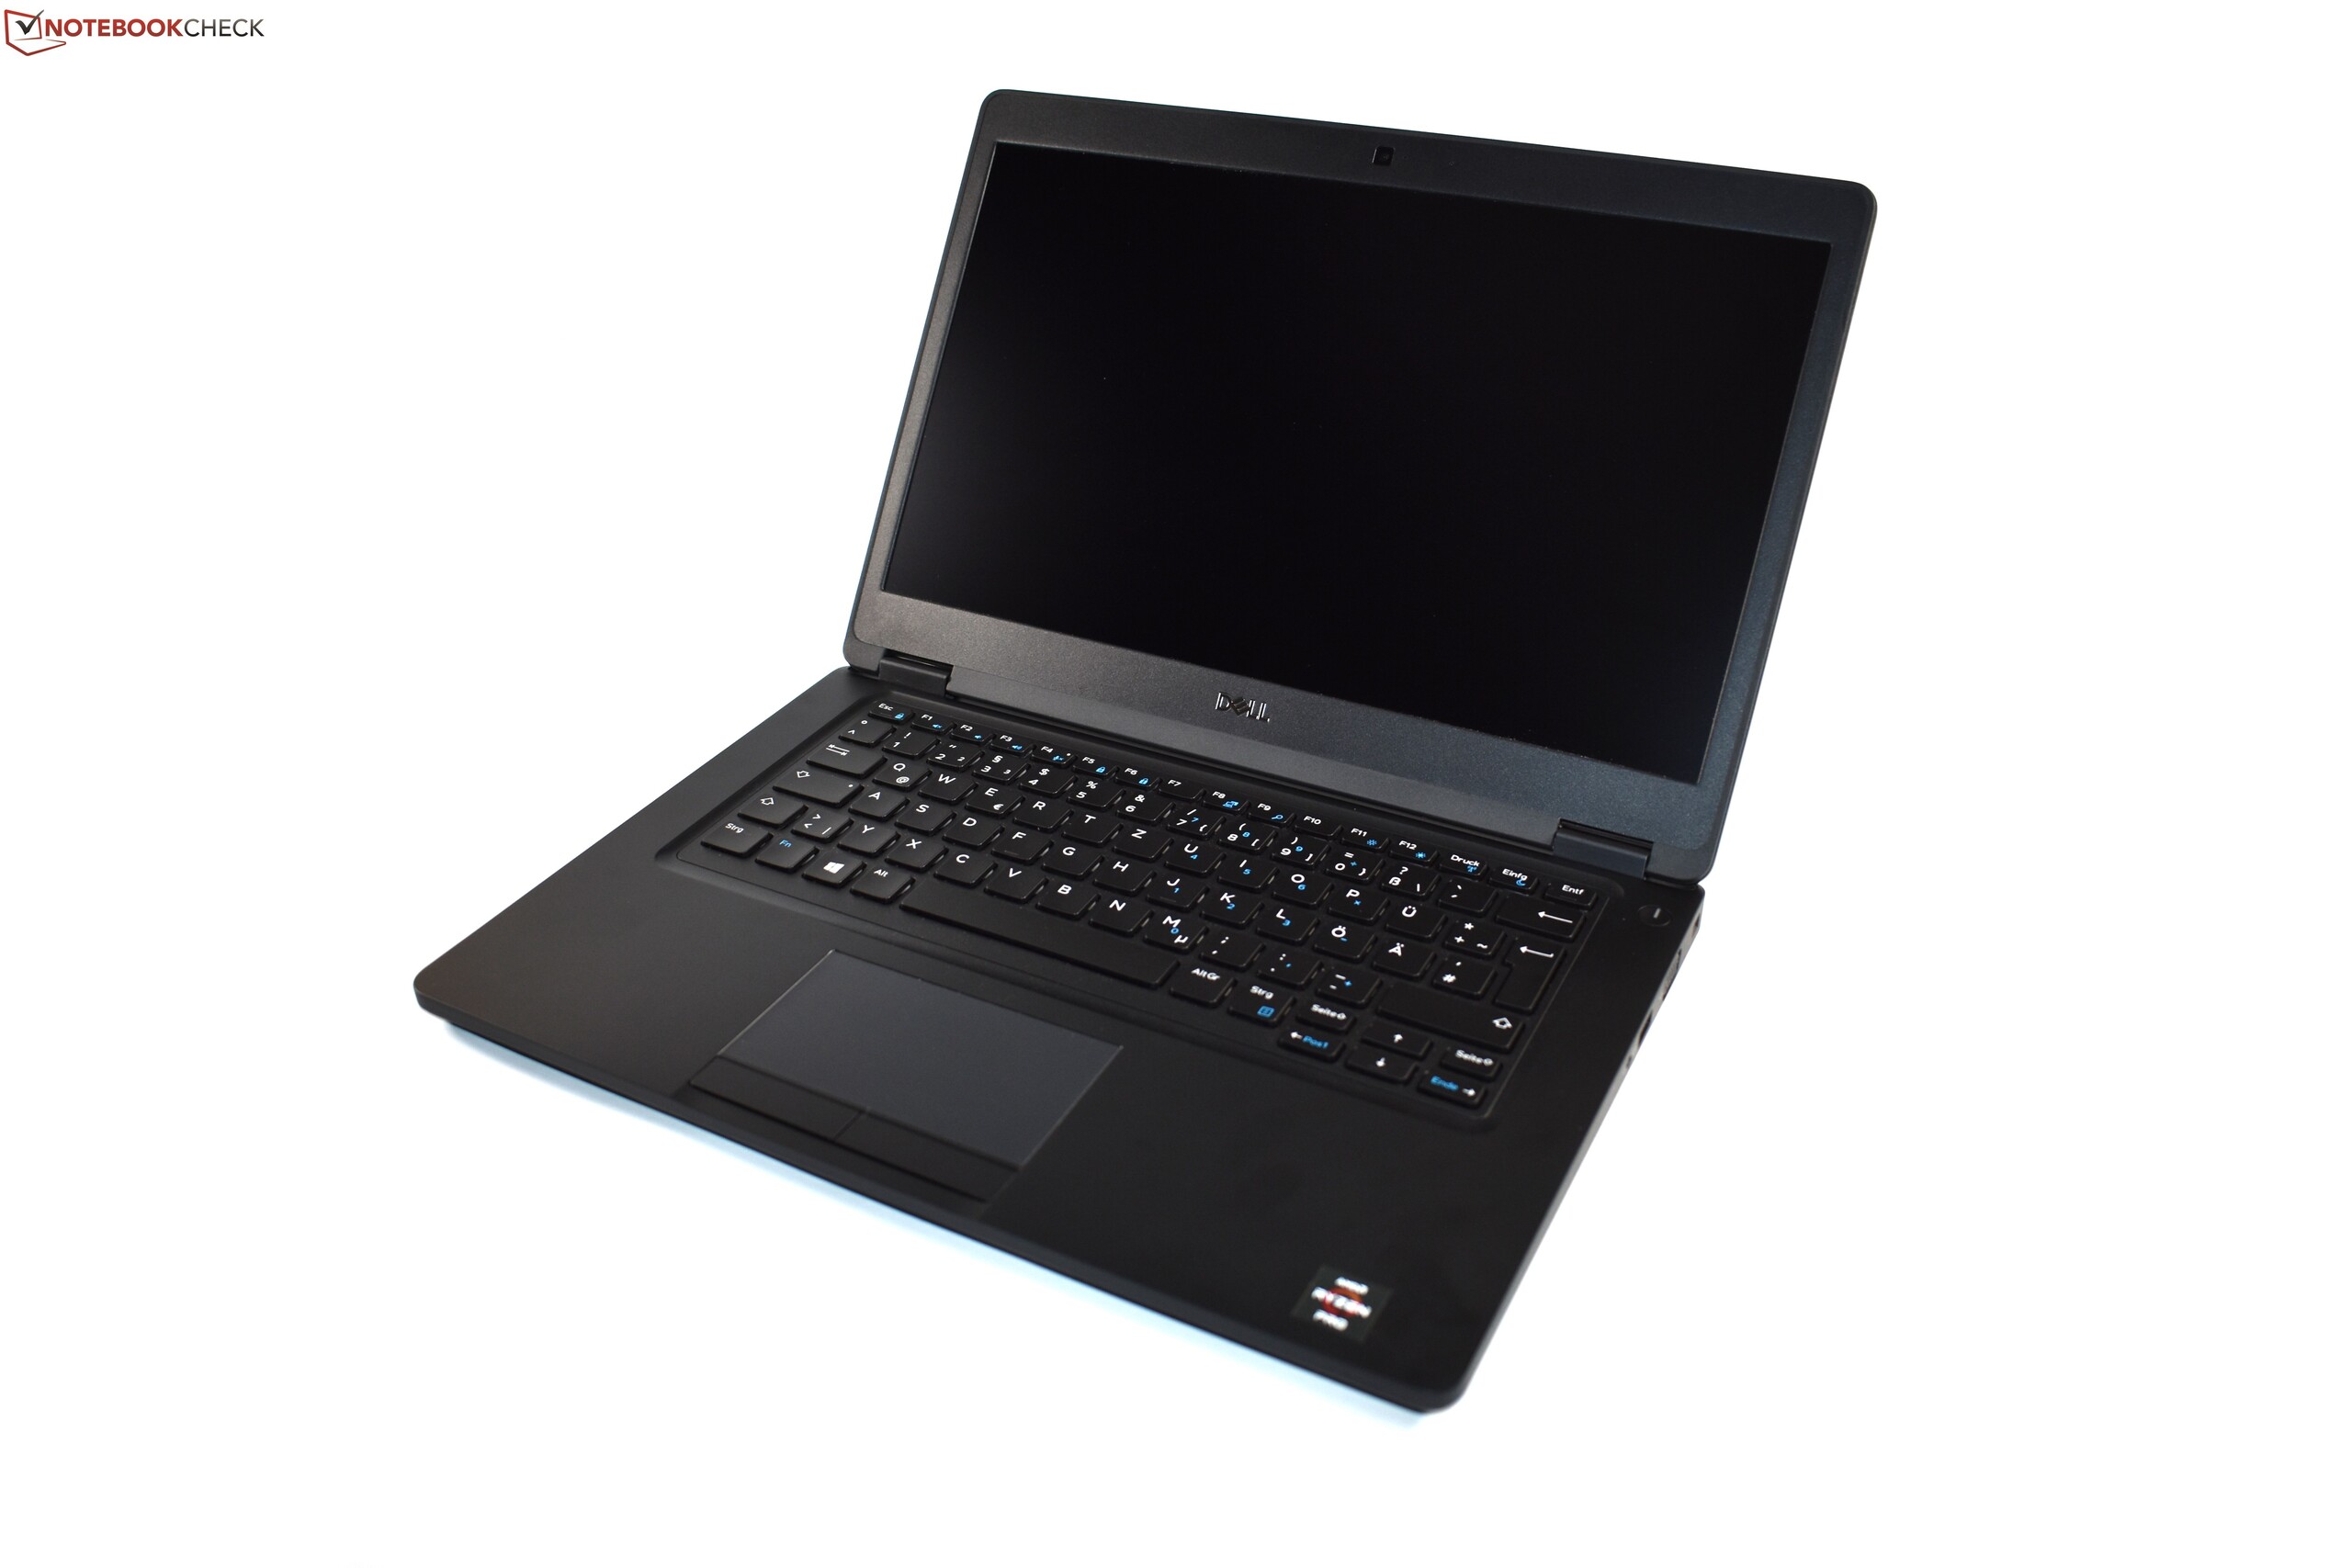
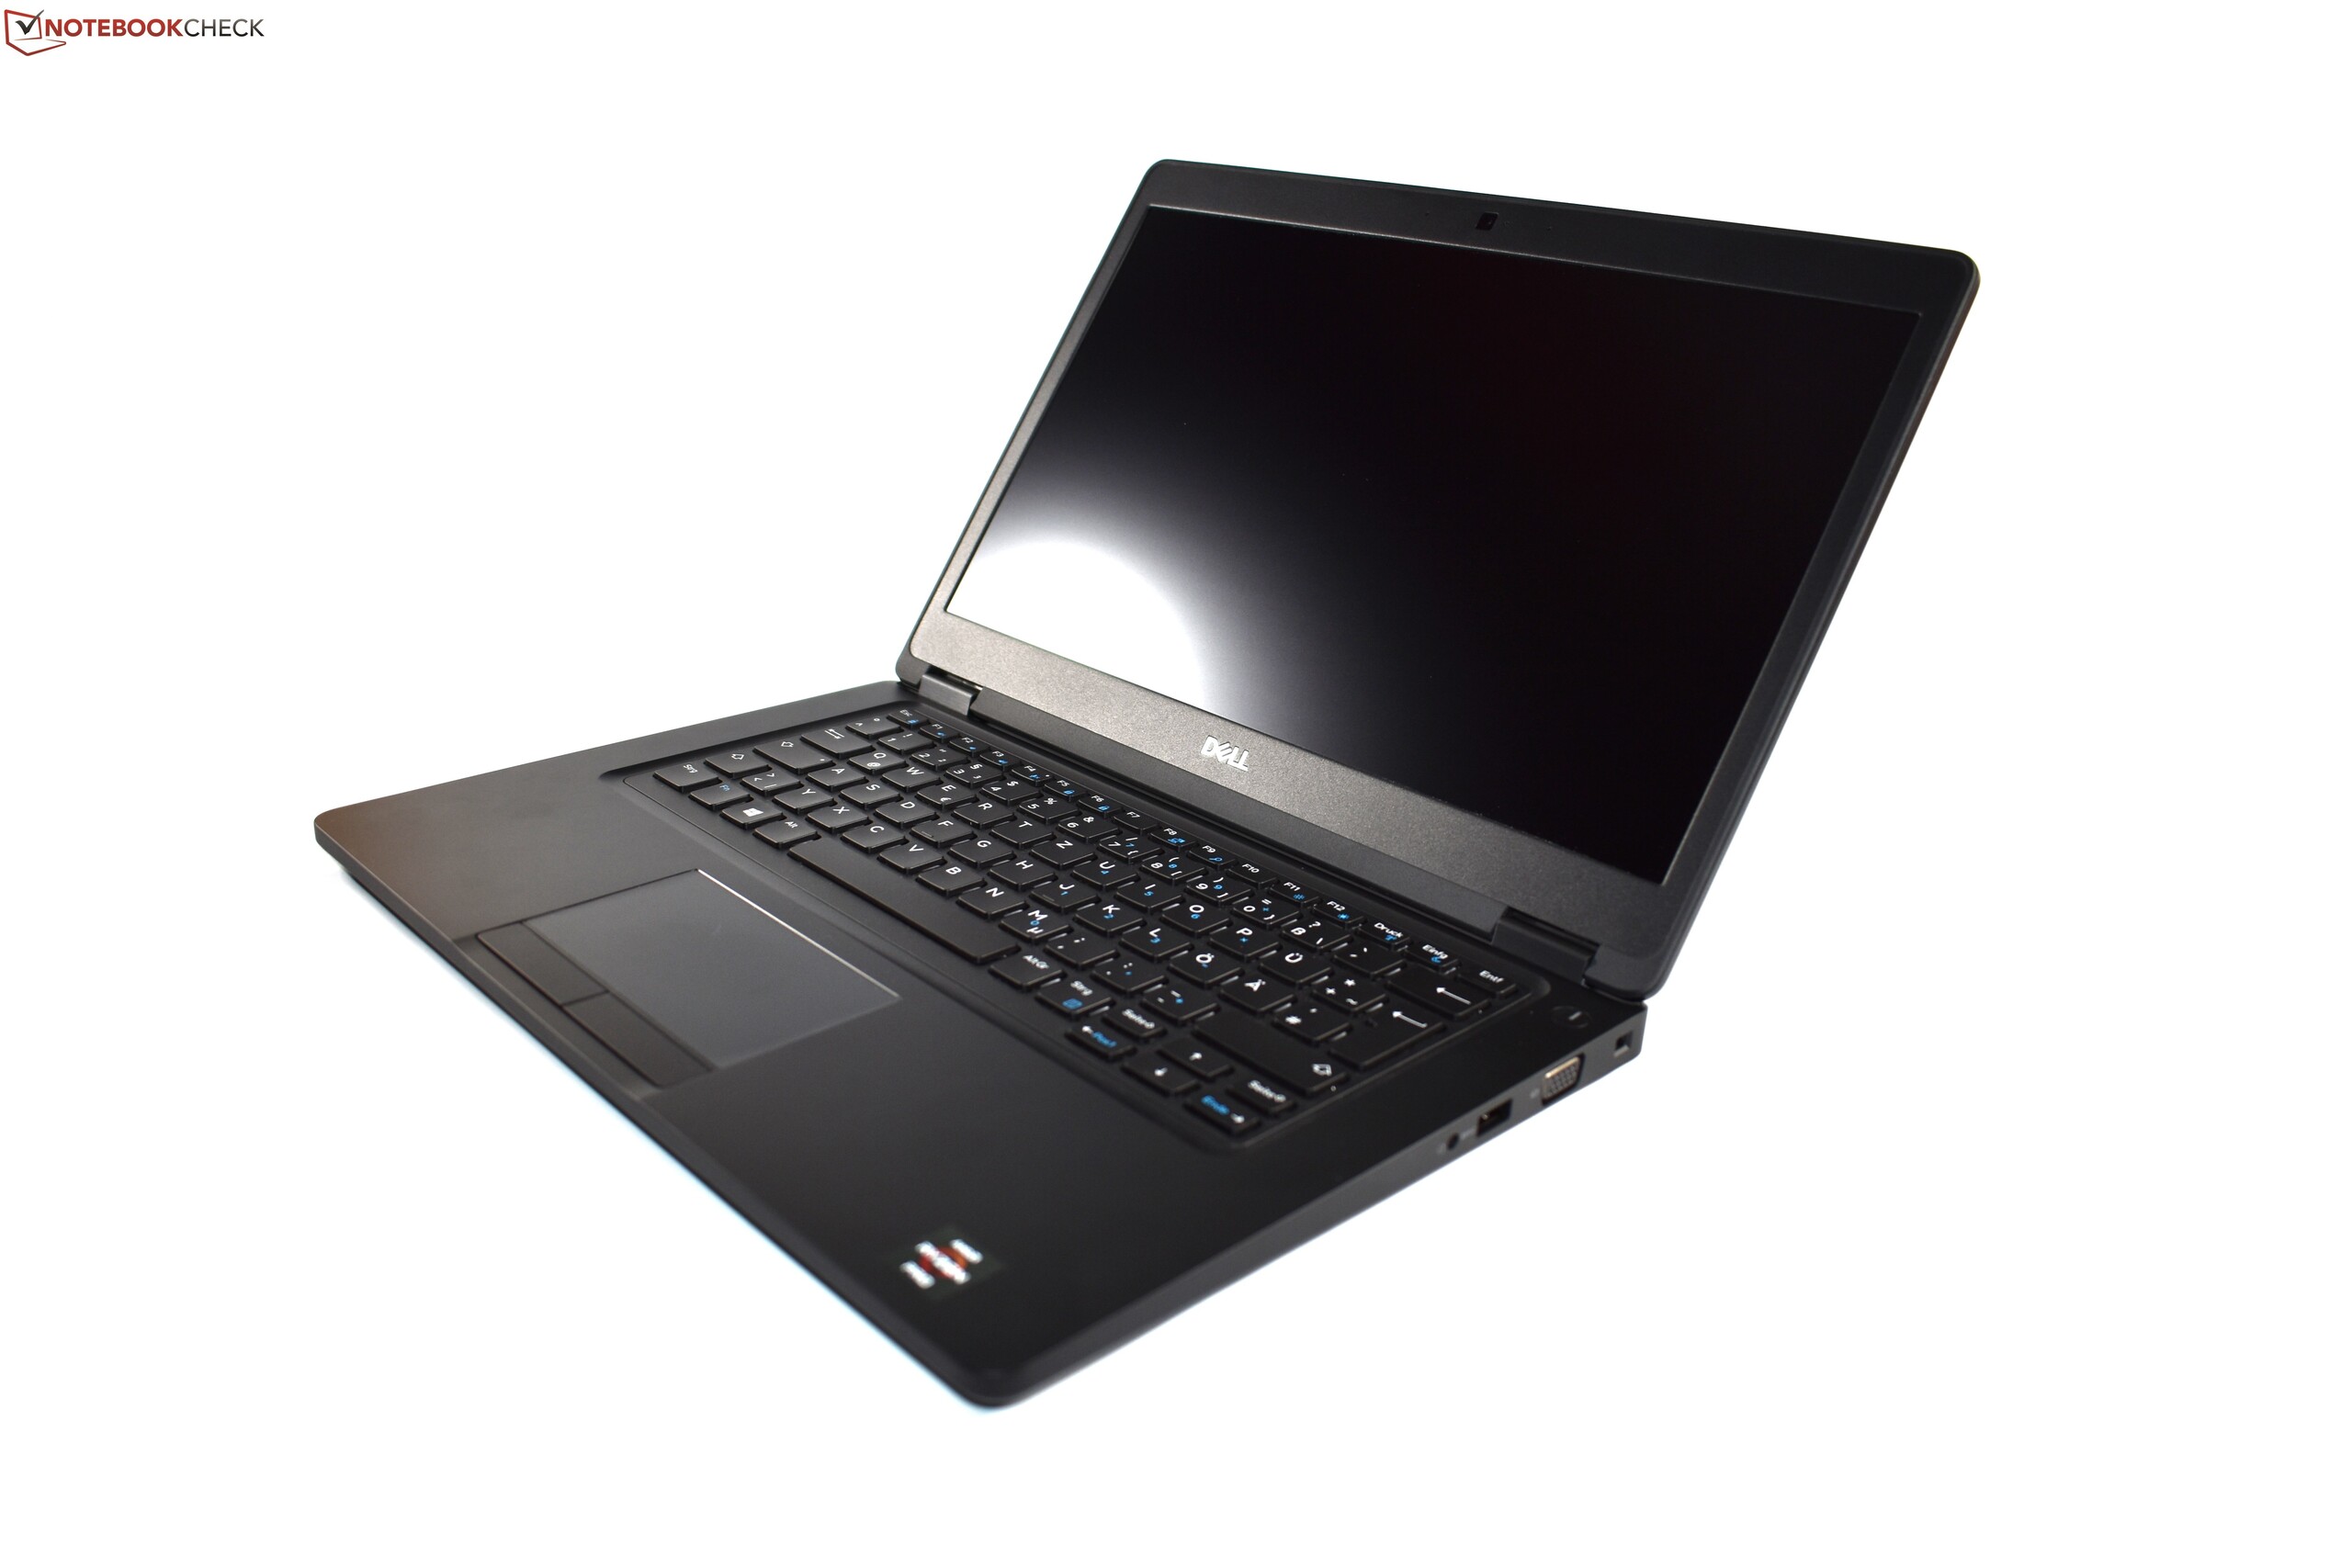
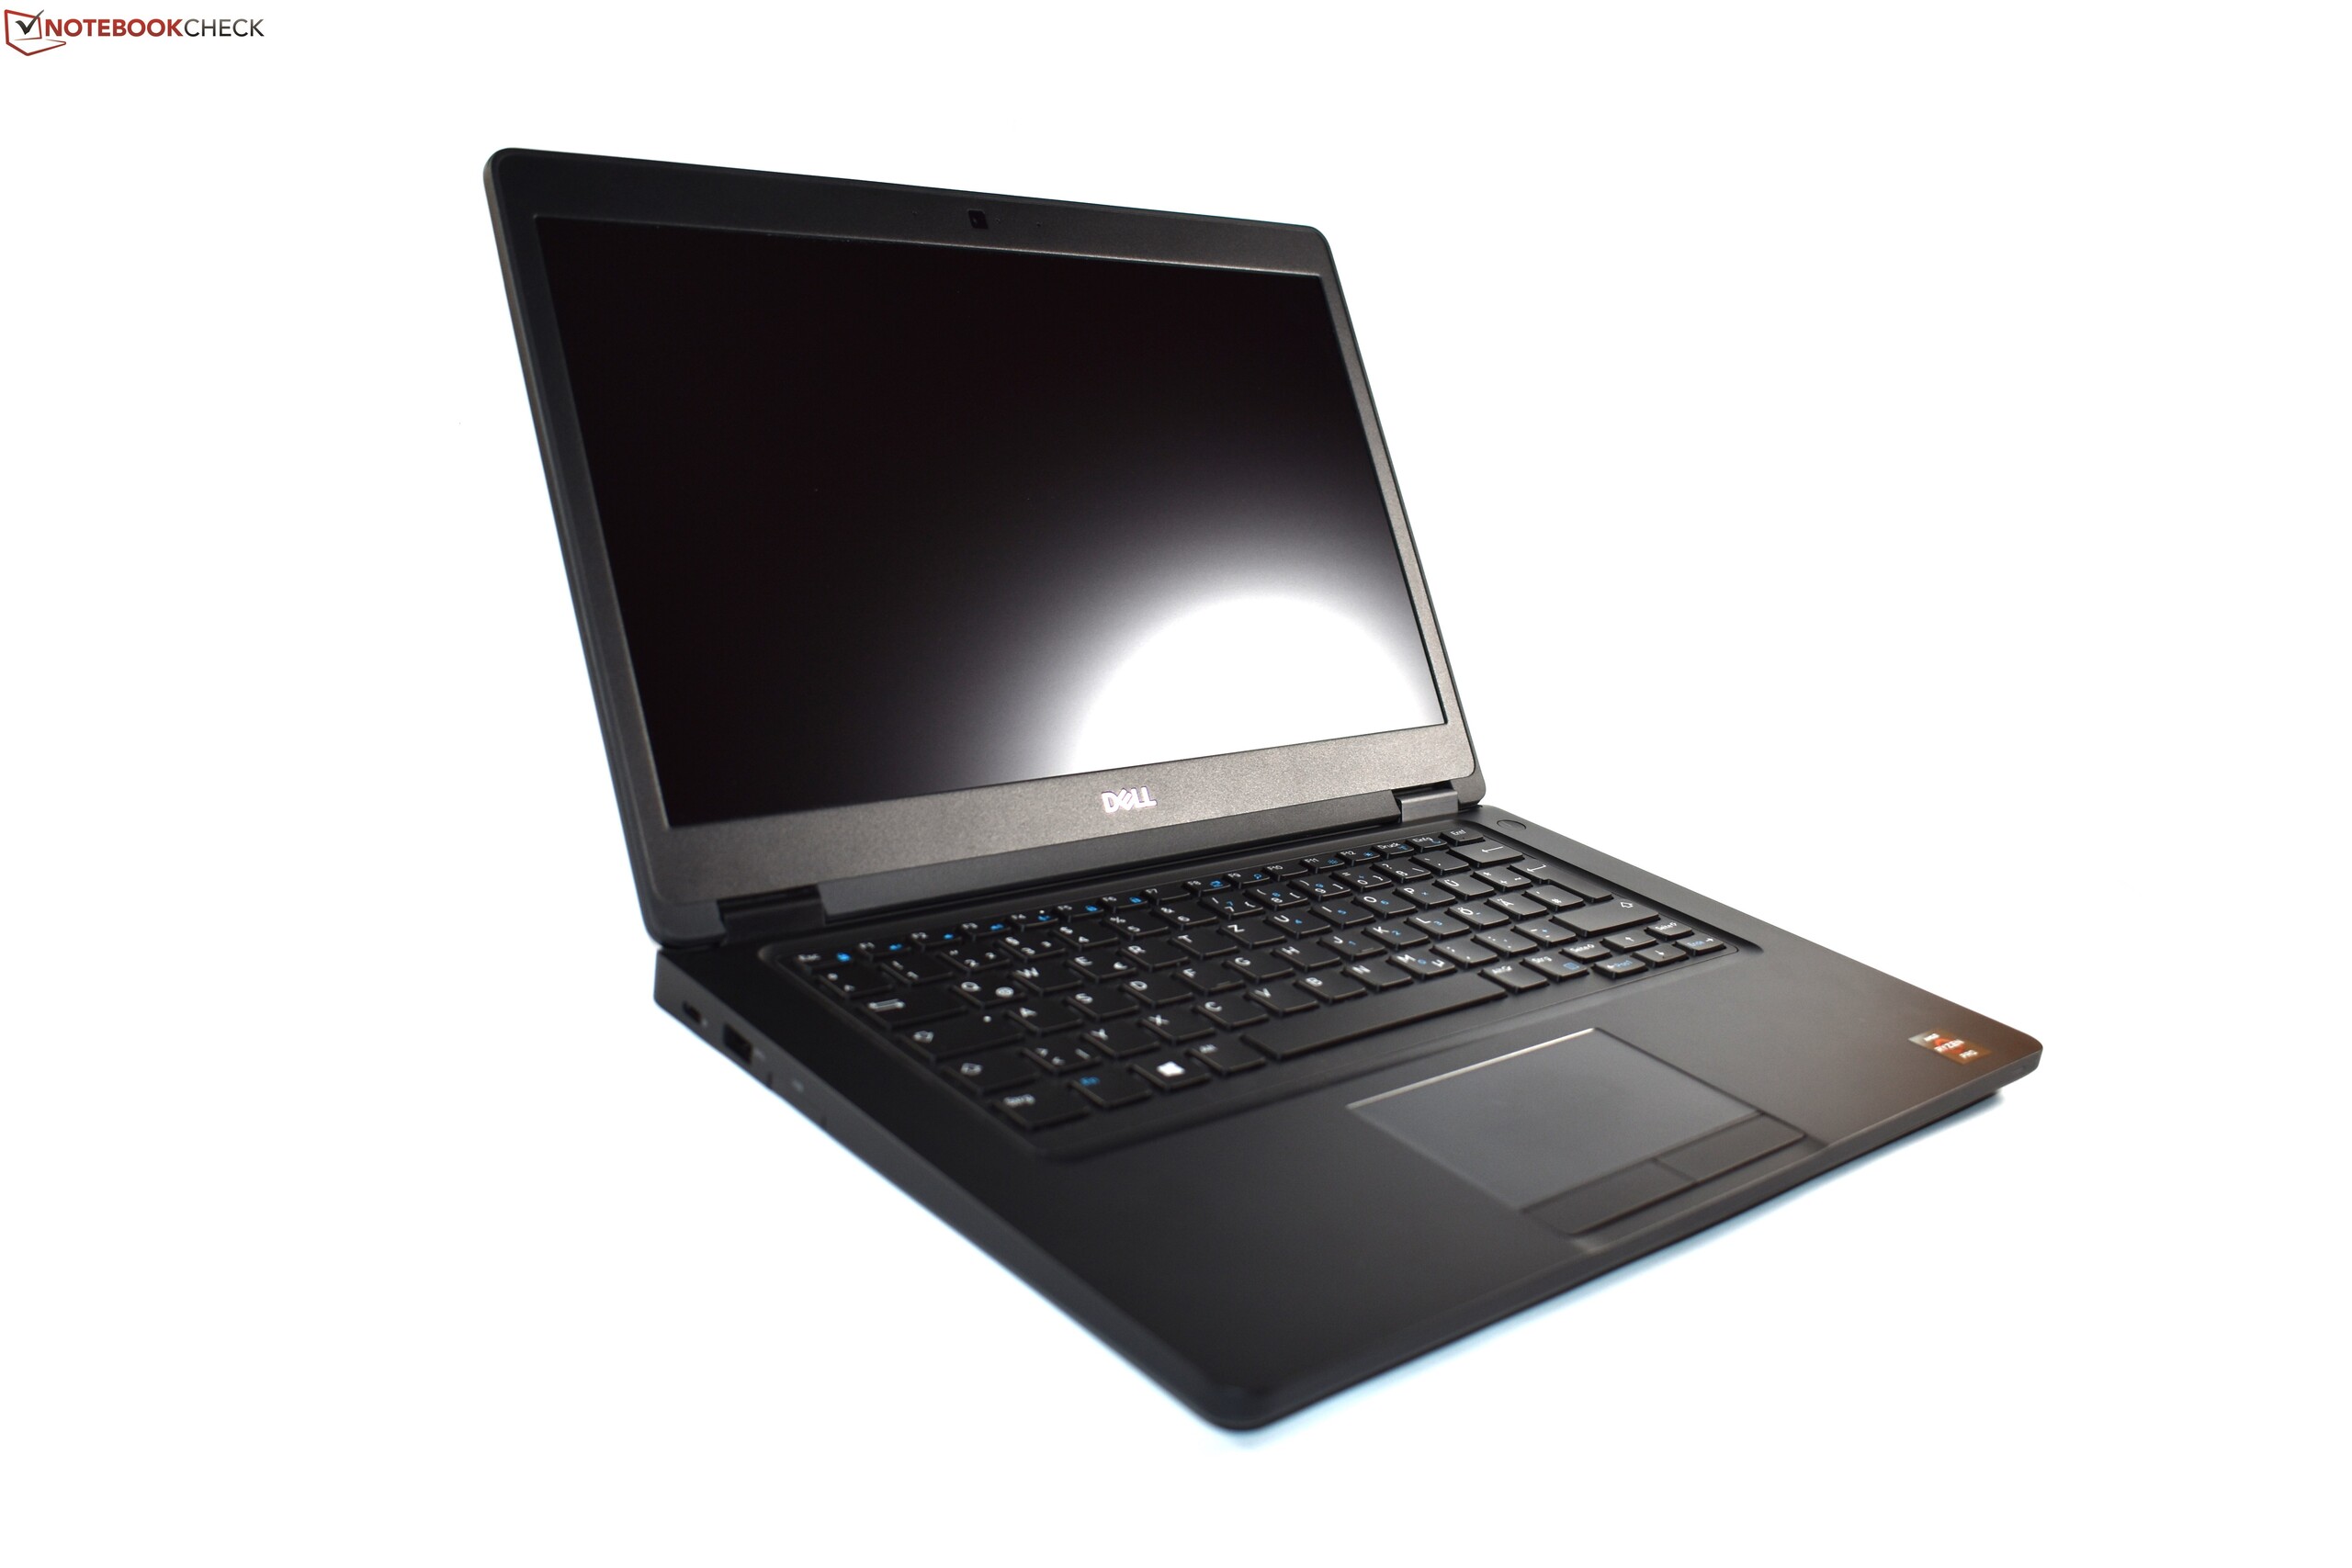
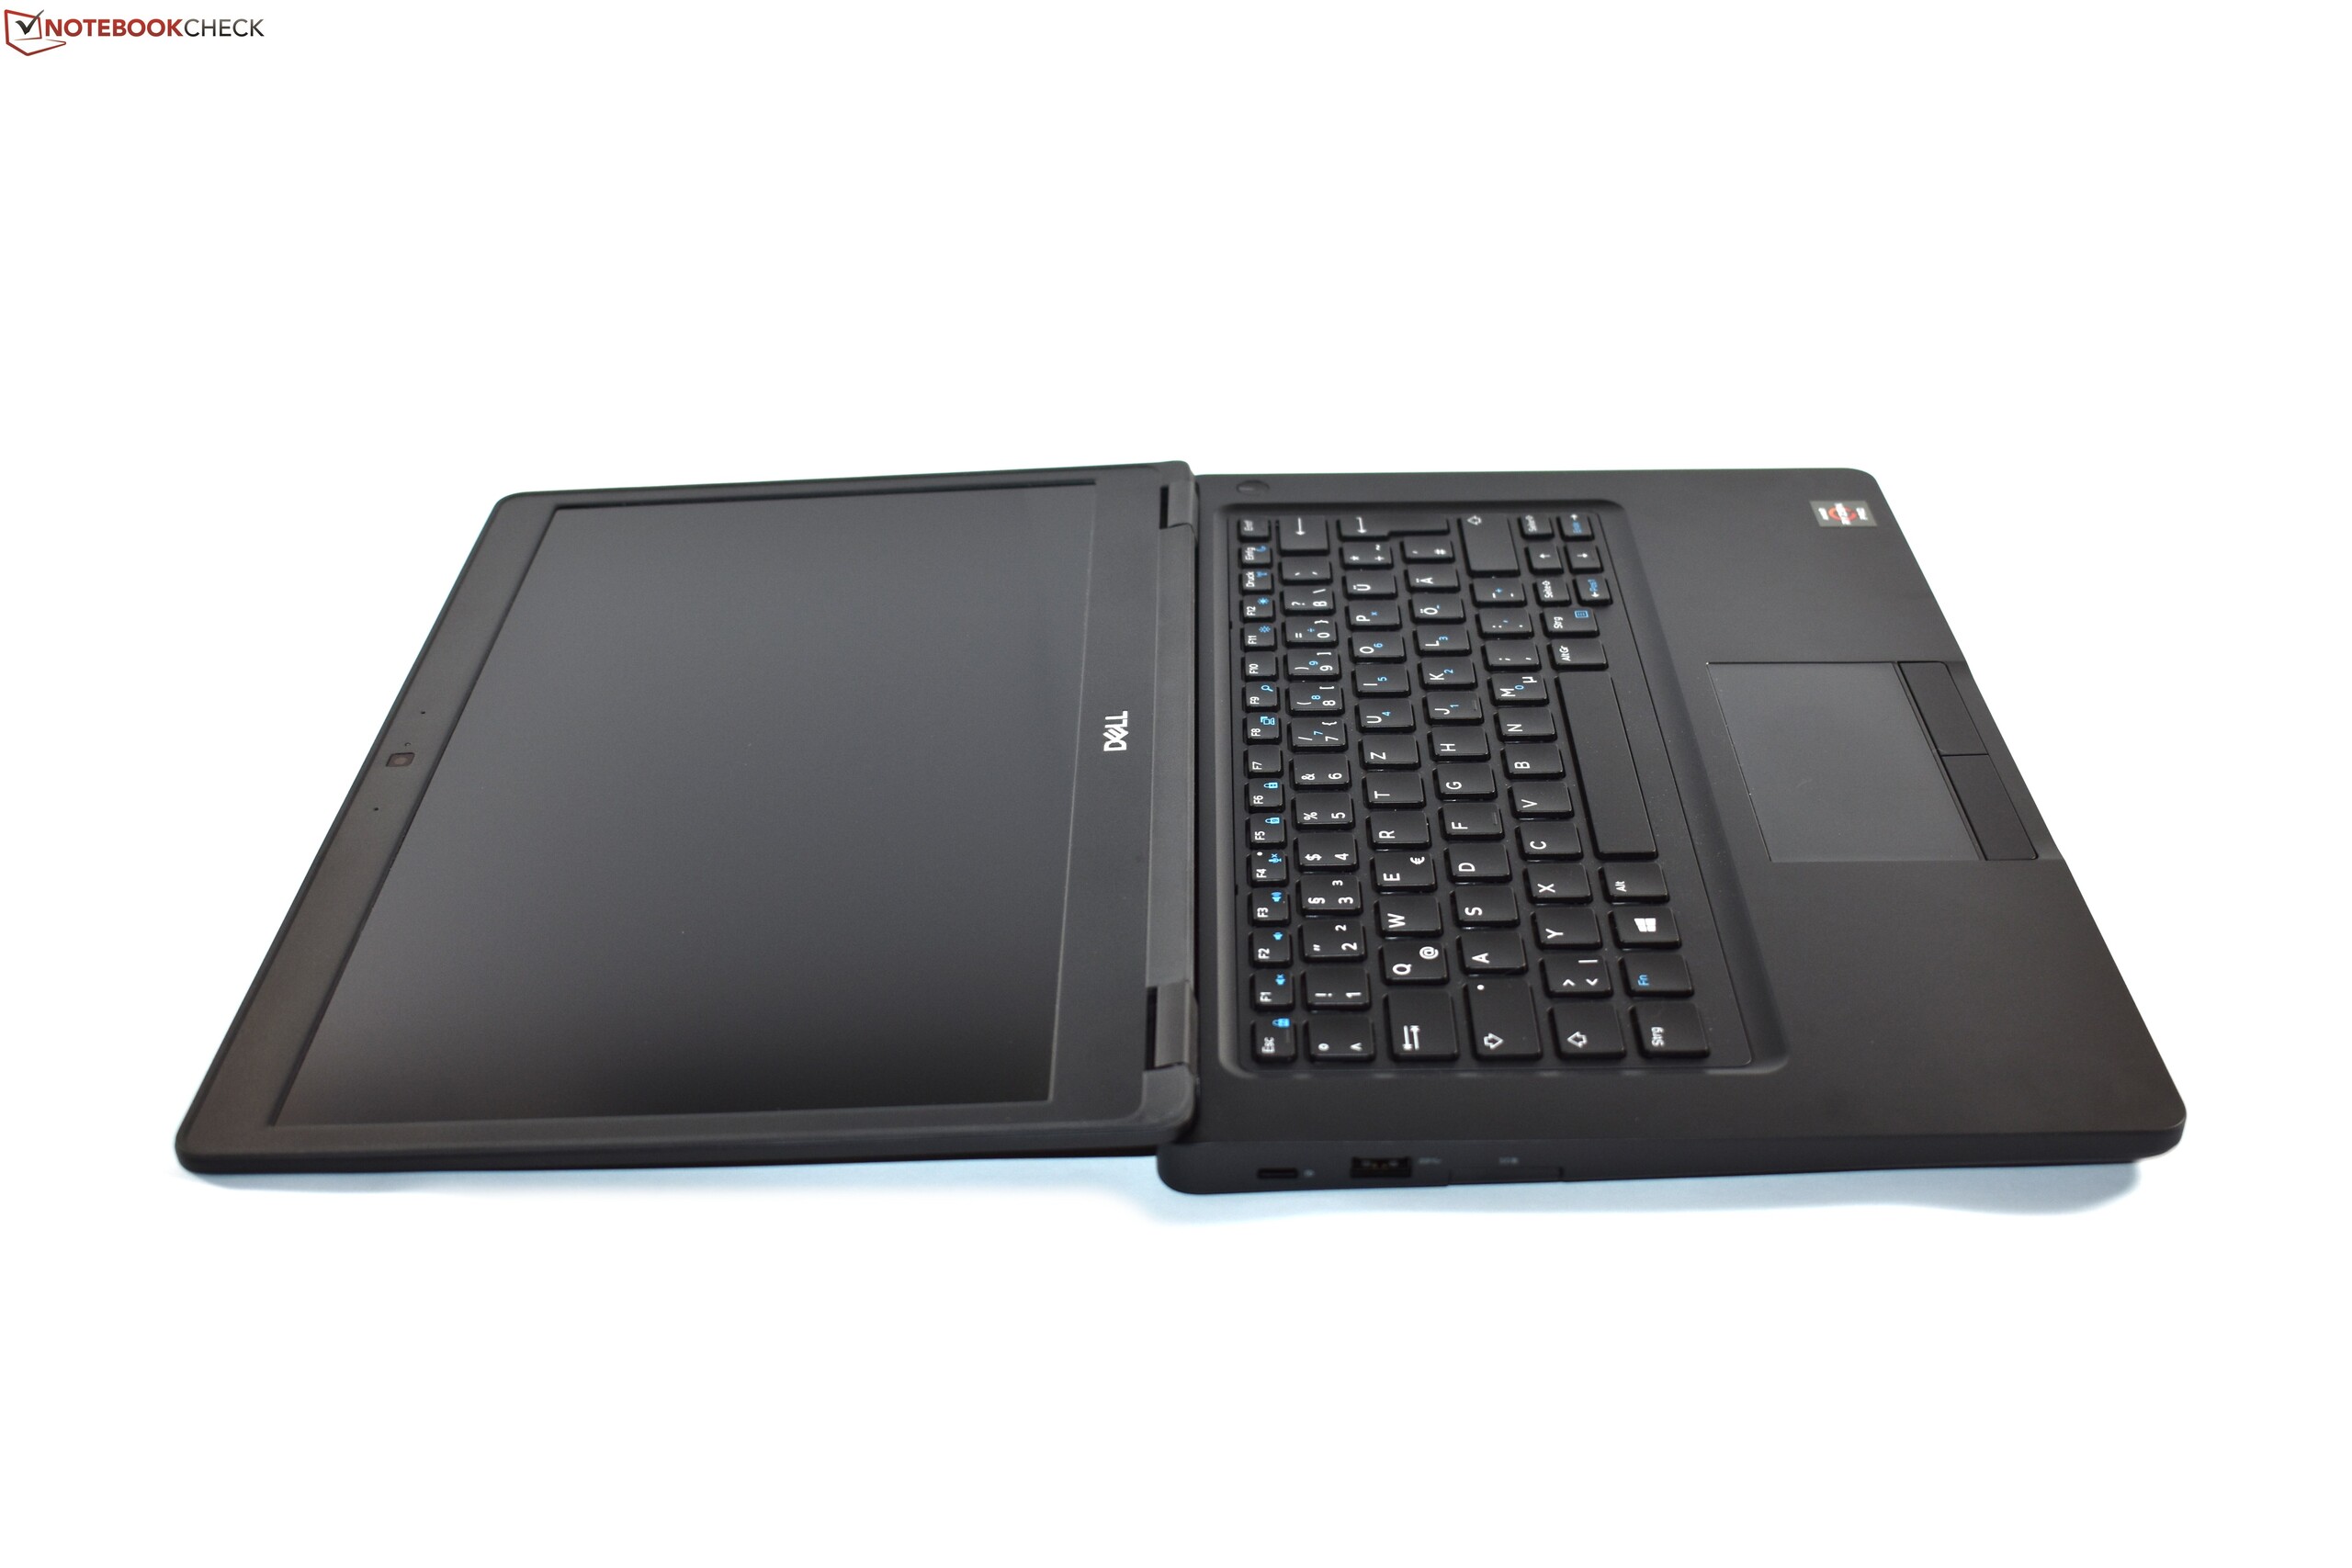
Breve Análise do Portátil Dell Latitude 5495 (Ryzen 7 Pro, FHD)
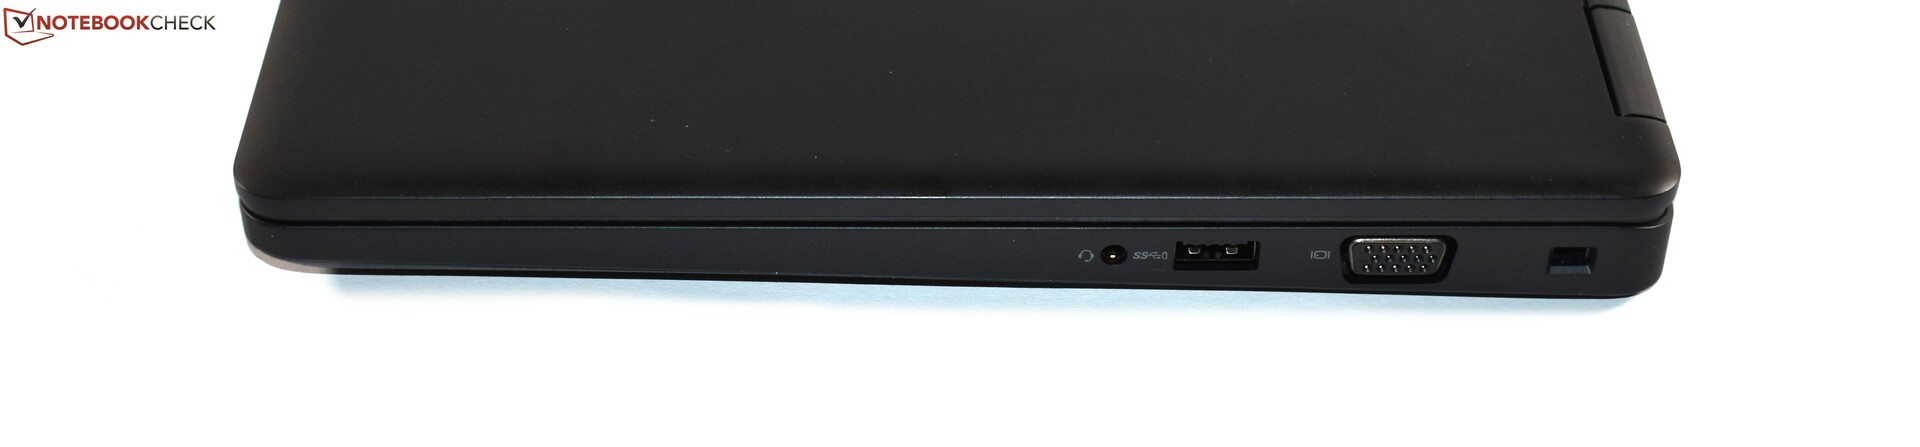
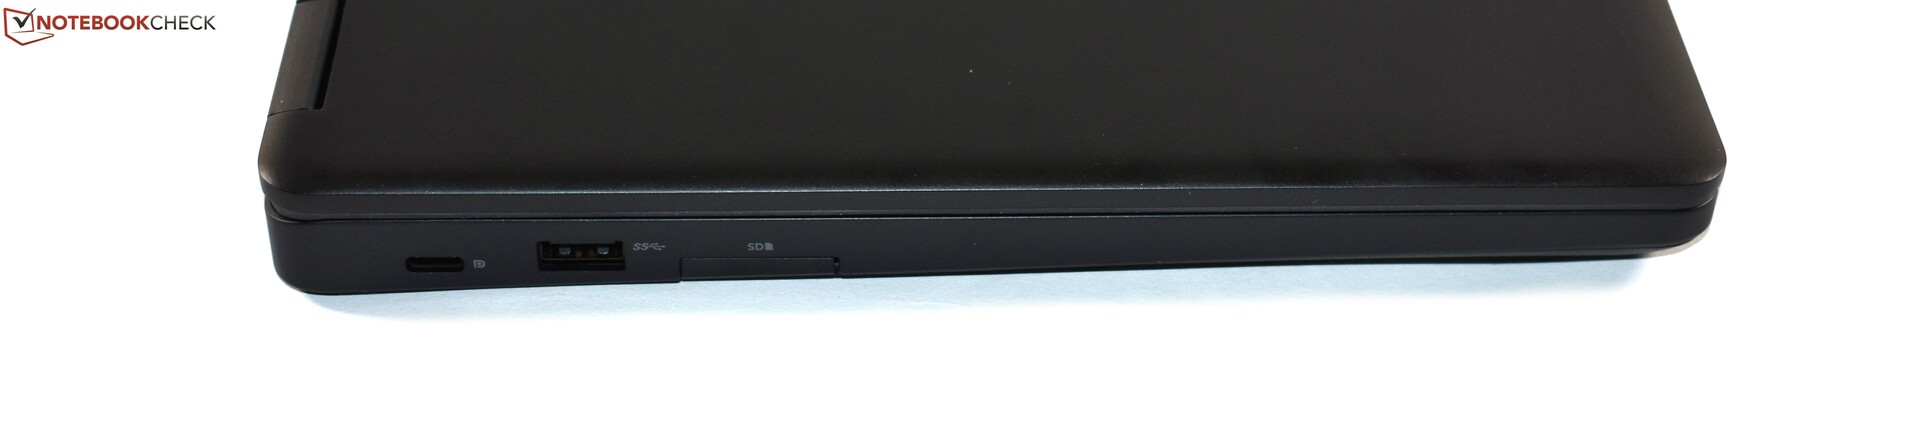
| SD Card Reader | |
| average JPG Copy Test (av. of 3 runs) | |
| Dell Latitude 5490-TD70X (Toshiba Exceria Pro SDXC 64 GB UHS-II) | |
| Dell Latitude 14 5495 (Toshiba Exceria Pro SDXC 64 GB UHS-II) | |
| Lenovo ThinkPad A485-20MU000CGE (Toshiba Exceria Pro SDXC 64 GB UHS-II) | |
| Média da turma Office (22.4 - 198.5, n=22, últimos 2 anos) | |
| maximum AS SSD Seq Read Test (1GB) | |
| Dell Latitude 5490-TD70X (Toshiba Exceria Pro SDXC 64 GB UHS-II) | |
| Dell Latitude 14 5495 (Toshiba Exceria Pro SDXC 64 GB UHS-II) | |
| Lenovo ThinkPad A485-20MU000CGE (Toshiba Exceria Pro SDXC 64 GB UHS-II) | |
| Média da turma Office (27.4 - 249, n=20, últimos 2 anos) | |
| |||||||||||||||||||||||||
iluminação: 89 %
iluminação com acumulador: 210 cd/m²
Contraste: 922:1 (Preto: 0.23 cd/m²)
ΔE ColorChecker Calman: 4.34 | ∀{0.5-29.43 Ø4.73}
ΔE Greyscale Calman: 2.81 | ∀{0.09-98 Ø4.97}
61% sRGB (Argyll 1.6.3 3D)
39% AdobeRGB 1998 (Argyll 1.6.3 3D)
42.32% AdobeRGB 1998 (Argyll 3D)
61.4% sRGB (Argyll 3D)
40.94% Display P3 (Argyll 3D)
Gamma: 2.22
CCT: 6286 K
| Dell Latitude 14 5495 CMN14C9, , 1920x1080, 14" | Dell Latitude 5490-TD70X AU Optronics AUO263D, , 1920x1080, 14" | Lenovo ThinkPad A485-20MU000CGE NV140FHM-N46, , 1920x1080, 14" | HP EliteBook 745 G5 3UN74EA AUO383D, , 1920x1080, 14" | |
|---|---|---|---|---|
| Display | -11% | -2% | 47% | |
| Display P3 Coverage (%) | 40.94 | 36.28 -11% | 40.24 -2% | 61.3 50% |
| sRGB Coverage (%) | 61.4 | 54.6 -11% | 60 -2% | 87.6 43% |
| AdobeRGB 1998 Coverage (%) | 42.32 | 37.48 -11% | 41.57 -2% | 62.3 47% |
| Response Times | -9% | -13% | 16% | |
| Response Time Grey 50% / Grey 80% * (ms) | 41 ? | 46.9 ? -14% | 44.8 ? -9% | 35 ? 15% |
| Response Time Black / White * (ms) | 30 ? | 31.2 ? -4% | 35.2 ? -17% | 25 ? 17% |
| PWM Frequency (Hz) | 25000 ? | 1000 ? | ||
| Screen | -13% | -13% | 36% | |
| Brightness middle (cd/m²) | 212 | 227 7% | 275 30% | 421 99% |
| Brightness (cd/m²) | 200 | 211 6% | 272 36% | 398 99% |
| Brightness Distribution (%) | 89 | 88 -1% | 85 -4% | 86 -3% |
| Black Level * (cd/m²) | 0.23 | 0.19 17% | 0.26 -13% | 0.27 -17% |
| Contrast (:1) | 922 | 1195 30% | 1058 15% | 1559 69% |
| Colorchecker dE 2000 * | 4.34 | 5.6 -29% | 5.9 -36% | 4.08 6% |
| Colorchecker dE 2000 max. * | 9.01 | 22.4 -149% | 20 -122% | 7.48 17% |
| Greyscale dE 2000 * | 2.81 | 2.4 15% | 3.6 -28% | 2.92 -4% |
| Gamma | 2.22 99% | 2.44 90% | 2.36 93% | 2.32 95% |
| CCT | 6286 103% | 6506 100% | 6798 96% | 7043 92% |
| Color Space (Percent of AdobeRGB 1998) (%) | 39 | 34.5 -12% | 38.1 -2% | 57 46% |
| Color Space (Percent of sRGB) (%) | 61 | 54.4 -11% | 59.6 -2% | 87 43% |
| Colorchecker dE 2000 calibrated * | 4.9 | |||
| Média Total (Programa/Configurações) | -11% /
-12% | -9% /
-11% | 33% /
35% |
* ... menor é melhor
Exibir tempos de resposta
| ↔ Tempo de resposta preto para branco | ||
|---|---|---|
| 30 ms ... ascensão ↗ e queda ↘ combinadas | ↗ 19 ms ascensão | 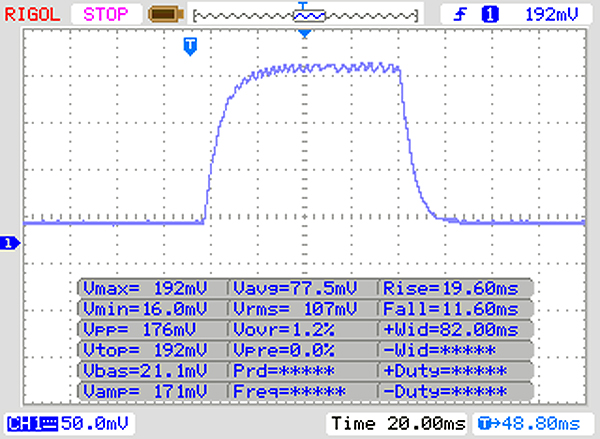 |
| ↘ 11 ms queda | ||
| A tela mostra taxas de resposta lentas em nossos testes e será insatisfatória para os jogadores. Em comparação, todos os dispositivos testados variam de 0.1 (mínimo) a 240 (máximo) ms. » 80 % de todos os dispositivos são melhores. Isso significa que o tempo de resposta medido é pior que a média de todos os dispositivos testados (19.9 ms). | ||
| ↔ Tempo de resposta 50% cinza a 80% cinza | ||
| 41 ms ... ascensão ↗ e queda ↘ combinadas | ↗ 24 ms ascensão | 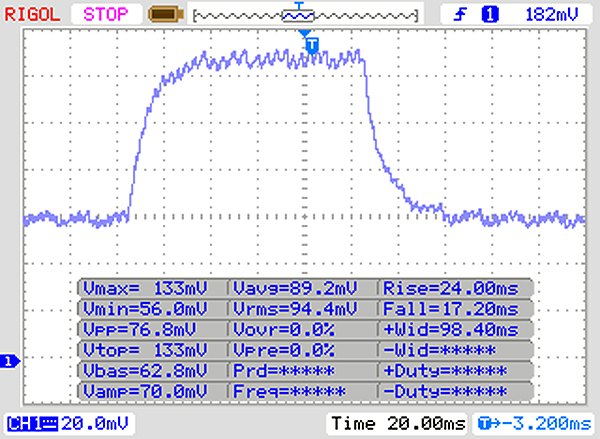 |
| ↘ 17 ms queda | ||
| A tela mostra taxas de resposta lentas em nossos testes e será insatisfatória para os jogadores. Em comparação, todos os dispositivos testados variam de 0.165 (mínimo) a 636 (máximo) ms. » 65 % de todos os dispositivos são melhores. Isso significa que o tempo de resposta medido é pior que a média de todos os dispositivos testados (31.1 ms). | ||
Cintilação da tela / PWM (modulação por largura de pulso)
| Tela tremeluzindo/PWM detectado | 25000 Hz | ≤ 30 % configuração de brilho | 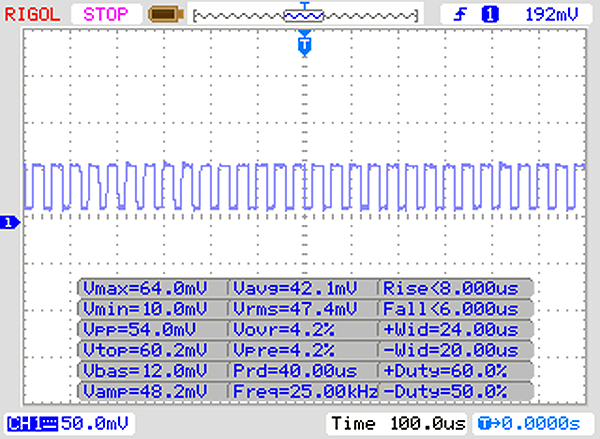 |
A luz de fundo da tela pisca em 25000 Hz (pior caso, por exemplo, utilizando PWM) Cintilação detectada em uma configuração de brilho de 30 % e abaixo. Não deve haver cintilação ou PWM acima desta configuração de brilho. A frequência de 25000 Hz é bastante alta, então a maioria dos usuários sensíveis ao PWM não deve notar nenhuma oscilação. [pwm_comparison] Em comparação: 52 % de todos os dispositivos testados não usam PWM para escurecer a tela. Se PWM foi detectado, uma média de 7798 (mínimo: 5 - máximo: 343500) Hz foi medida. | |||
| PCMark 8 Home Score Accelerated v2 | 3256 pontos | |
| PCMark 8 Work Score Accelerated v2 | 2438 pontos | |
| PCMark 10 Score | 2585 pontos | |
Ajuda | ||
| Dell Latitude 14 5495 Intel SSDSCKKF256G8 | Dell Latitude 5490-TD70X Toshiba KSG60ZMV512G | Lenovo ThinkPad A485-20MU000CGE Samsung SSD PM981 MZVLB256HAHQ | HP EliteBook 745 G5 3UN74EA Toshiba XG5 KXG50ZNV256G | Média Intel SSDSCKKF256G8 | |
|---|---|---|---|---|---|
| CrystalDiskMark 5.2 / 6 | 31% | 146% | 108% | 0% | |
| Write 4K (MB/s) | 48.45 | 90.4 87% | 114.8 137% | 119.5 147% | 48.5 ? 0% |
| Read 4K (MB/s) | 25.11 | 28.24 12% | 41.33 65% | 31.9 27% | 25.1 ? 0% |
| Write Seq (MB/s) | 341.2 | 433.7 27% | 1271 273% | 351.1 3% | 341 ? 0% |
| Read Seq (MB/s) | 521 | 469.3 -10% | 1171 125% | 1665 220% | 521 ? 0% |
| Write 4K Q32T1 (MB/s) | 202 | 297.6 47% | 218.4 8% | 268.4 33% | 202 ? 0% |
| Read 4K Q32T1 (MB/s) | 243.5 | 293.9 21% | 308.5 27% | 333.1 37% | 244 ? 0% |
| Write Seq Q32T1 (MB/s) | 320.8 | 534 66% | 1460 355% | 351.8 10% | 321 ? 0% |
| Read Seq Q32T1 (MB/s) | 555 | 531 -4% | 1529 175% | 2705 387% | 555 ? 0% |

| 3DMark 11 Performance | 3129 pontos | |
| 3DMark Cloud Gate Standard Score | 8942 pontos | |
| 3DMark Fire Strike Score | 1659 pontos | |
Ajuda | ||
| baixo | média | alto | ultra | |
|---|---|---|---|---|
| BioShock Infinite (2013) | 85.7 | 14.4 | ||
| The Witcher 3 (2015) | 33 | 10.7 | ||
| Rise of the Tomb Raider (2016) | 37.6 | 12.3 |
Barulho
| Ocioso |
| 30.7 / 30.7 / 30.7 dB |
| Carga |
| 35.4 / 43 dB |
 | ||
30 dB silencioso 40 dB(A) audível 50 dB(A) ruidosamente alto |
||
min: | ||
(+) A temperatura máxima no lado superior é 37.1 °C / 99 F, em comparação com a média de 34.3 °C / 94 F , variando de 21.2 a 62.5 °C para a classe Office.
(-) A parte inferior aquece até um máximo de 45.6 °C / 114 F, em comparação com a média de 36.8 °C / 98 F
(+) Em uso inativo, a temperatura média para o lado superior é 23.1 °C / 74 F, em comparação com a média do dispositivo de 29.5 °C / ### class_avg_f### F.
(+) Os apoios para as mãos e o touchpad são mais frios que a temperatura da pele, com um máximo de 27.2 °C / 81 F e, portanto, são frios ao toque.
(±) A temperatura média da área do apoio para as mãos de dispositivos semelhantes foi 27.5 °C / 81.5 F (+0.3 °C / 0.5 F).
Dell Latitude 14 5495 análise de áudio
(±) | o volume do alto-falante é médio, mas bom (###valor### dB)
Graves 100 - 315Hz
(-) | quase nenhum baixo - em média 17.1% menor que a mediana
(±) | a linearidade dos graves é média (9.7% delta para a frequência anterior)
Médios 400 - 2.000 Hz
(±) | médios mais altos - em média 5.5% maior que a mediana
(±) | a linearidade dos médios é média (8.6% delta para frequência anterior)
Altos 2 - 16 kHz
(+) | agudos equilibrados - apenas 2.1% longe da mediana
(+) | os máximos são lineares (5.3% delta da frequência anterior)
Geral 100 - 16.000 Hz
(±) | a linearidade do som geral é média (17.5% diferença em relação à mediana)
Comparado com a mesma classe
» 27% de todos os dispositivos testados nesta classe foram melhores, 7% semelhantes, 66% piores
» O melhor teve um delta de 7%, a média foi 21%, o pior foi 53%
Comparado com todos os dispositivos testados
» 34% de todos os dispositivos testados foram melhores, 8% semelhantes, 58% piores
» O melhor teve um delta de 4%, a média foi 24%, o pior foi 134%
HP EliteBook 745 G5 3UN74EA análise de áudio
(-) | alto-falantes não muito altos (###valor### dB)
Graves 100 - 315Hz
(-) | quase nenhum baixo - em média 27.1% menor que a mediana
(±) | a linearidade dos graves é média (10.7% delta para a frequência anterior)
Médios 400 - 2.000 Hz
(+) | médios equilibrados - apenas 2.4% longe da mediana
(±) | a linearidade dos médios é média (8.6% delta para frequência anterior)
Altos 2 - 16 kHz
(+) | agudos equilibrados - apenas 2.7% longe da mediana
(+) | os máximos são lineares (5.6% delta da frequência anterior)
Geral 100 - 16.000 Hz
(±) | a linearidade do som geral é média (20.2% diferença em relação à mediana)
Comparado com a mesma classe
» 43% de todos os dispositivos testados nesta classe foram melhores, 10% semelhantes, 46% piores
» O melhor teve um delta de 7%, a média foi 21%, o pior foi 53%
Comparado com todos os dispositivos testados
» 52% de todos os dispositivos testados foram melhores, 8% semelhantes, 39% piores
» O melhor teve um delta de 4%, a média foi 24%, o pior foi 134%
| desligado | |
| Ocioso | |
| Carga |
|
Key:
min: | |
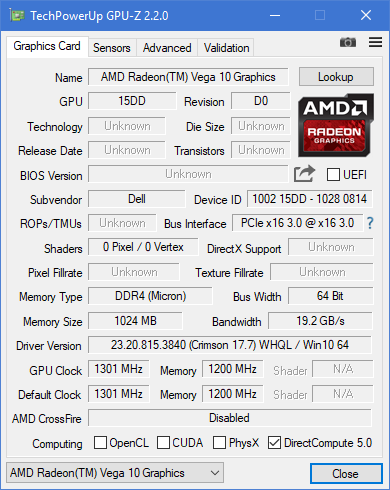
| Dell Latitude 14 5495 R7 2700U, Vega 10, Intel SSDSCKKF256G8, IPS LED, 1920x1080, 14" | Dell Latitude 5490-TD70X i5-8350U, UHD Graphics 620, Toshiba KSG60ZMV512G, IPS, 1920x1080, 14" | Lenovo ThinkPad A485-20MU000CGE R5 PRO 2500U, Vega 8, Samsung SSD PM981 MZVLB256HAHQ, IPS LED, 1920x1080, 14" | HP EliteBook 745 G5 3UN74EA R7 2700U, Vega 10, Toshiba XG5 KXG50ZNV256G, IPS LED, 1920x1080, 14" | Média AMD Radeon RX Vega 10 | Média da turma Office | |
|---|---|---|---|---|---|---|
| Power Consumption | -10% | -30% | -16% | -13% | -23% | |
| Idle Minimum * (Watt) | 4.3 | 3.3 23% | 5.3 -23% | 4.9 -14% | 4.73 ? -10% | 4.4 ? -2% |
| Idle Average * (Watt) | 6.6 | 5.54 16% | 8.3 -26% | 8.1 -23% | 7.61 ? -15% | 7.32 ? -11% |
| Idle Maximum * (Watt) | 7.7 | 6.59 14% | 11.4 -48% | 10.6 -38% | 9.63 ? -25% | 8.56 ? -11% |
| Load Average * (Watt) | 32 | 42.4 -33% | 42 -31% | 32.2 -1% | 33.3 ? -4% | 42.5 ? -33% |
| Load Maximum * (Watt) | 40 | 67.6 -69% | 48.8 -22% | 42.3 -6% | 45.1 ? -13% | 64.1 ? -60% |
* ... menor é melhor
| Dell Latitude 14 5495 R7 2700U, Vega 10, 61 Wh | Dell Latitude 5490-TD70X i5-8350U, UHD Graphics 620, 68 Wh | Lenovo ThinkPad A485-20MU000CGE R5 PRO 2500U, Vega 8, 48 Wh | HP EliteBook 745 G5 3UN74EA R7 2700U, Vega 10, 50 Wh | Média da turma Office | |
|---|---|---|---|---|---|
| Duração da bateria | 21% | -45% | -35% | 18% | |
| Reader / Idle (h) | 18.2 | 25.9 42% | 11.2 -38% | 10.7 -41% | 23.7 ? 30% |
| H.264 (h) | 11.8 | 13.2 12% | 6.1 -48% | 7.1 -40% | 15 ? 27% |
| WiFi v1.3 (h) | 9.4 | 15 60% | 5.5 -41% | 6.6 -30% | 12.9 ? 37% |
| Load (h) | 2.3 | 1.6 -30% | 1.1 -52% | 1.6 -30% | 1.807 ? -21% |
Pro
Contra
O Dell Latitude 5495 pode ser um portátil muito bom com o AMD Ryzen mobile. O foco aqui está no "poderia", dado que a Dell faz quase tantas coisas erradas quanto coisas certas.
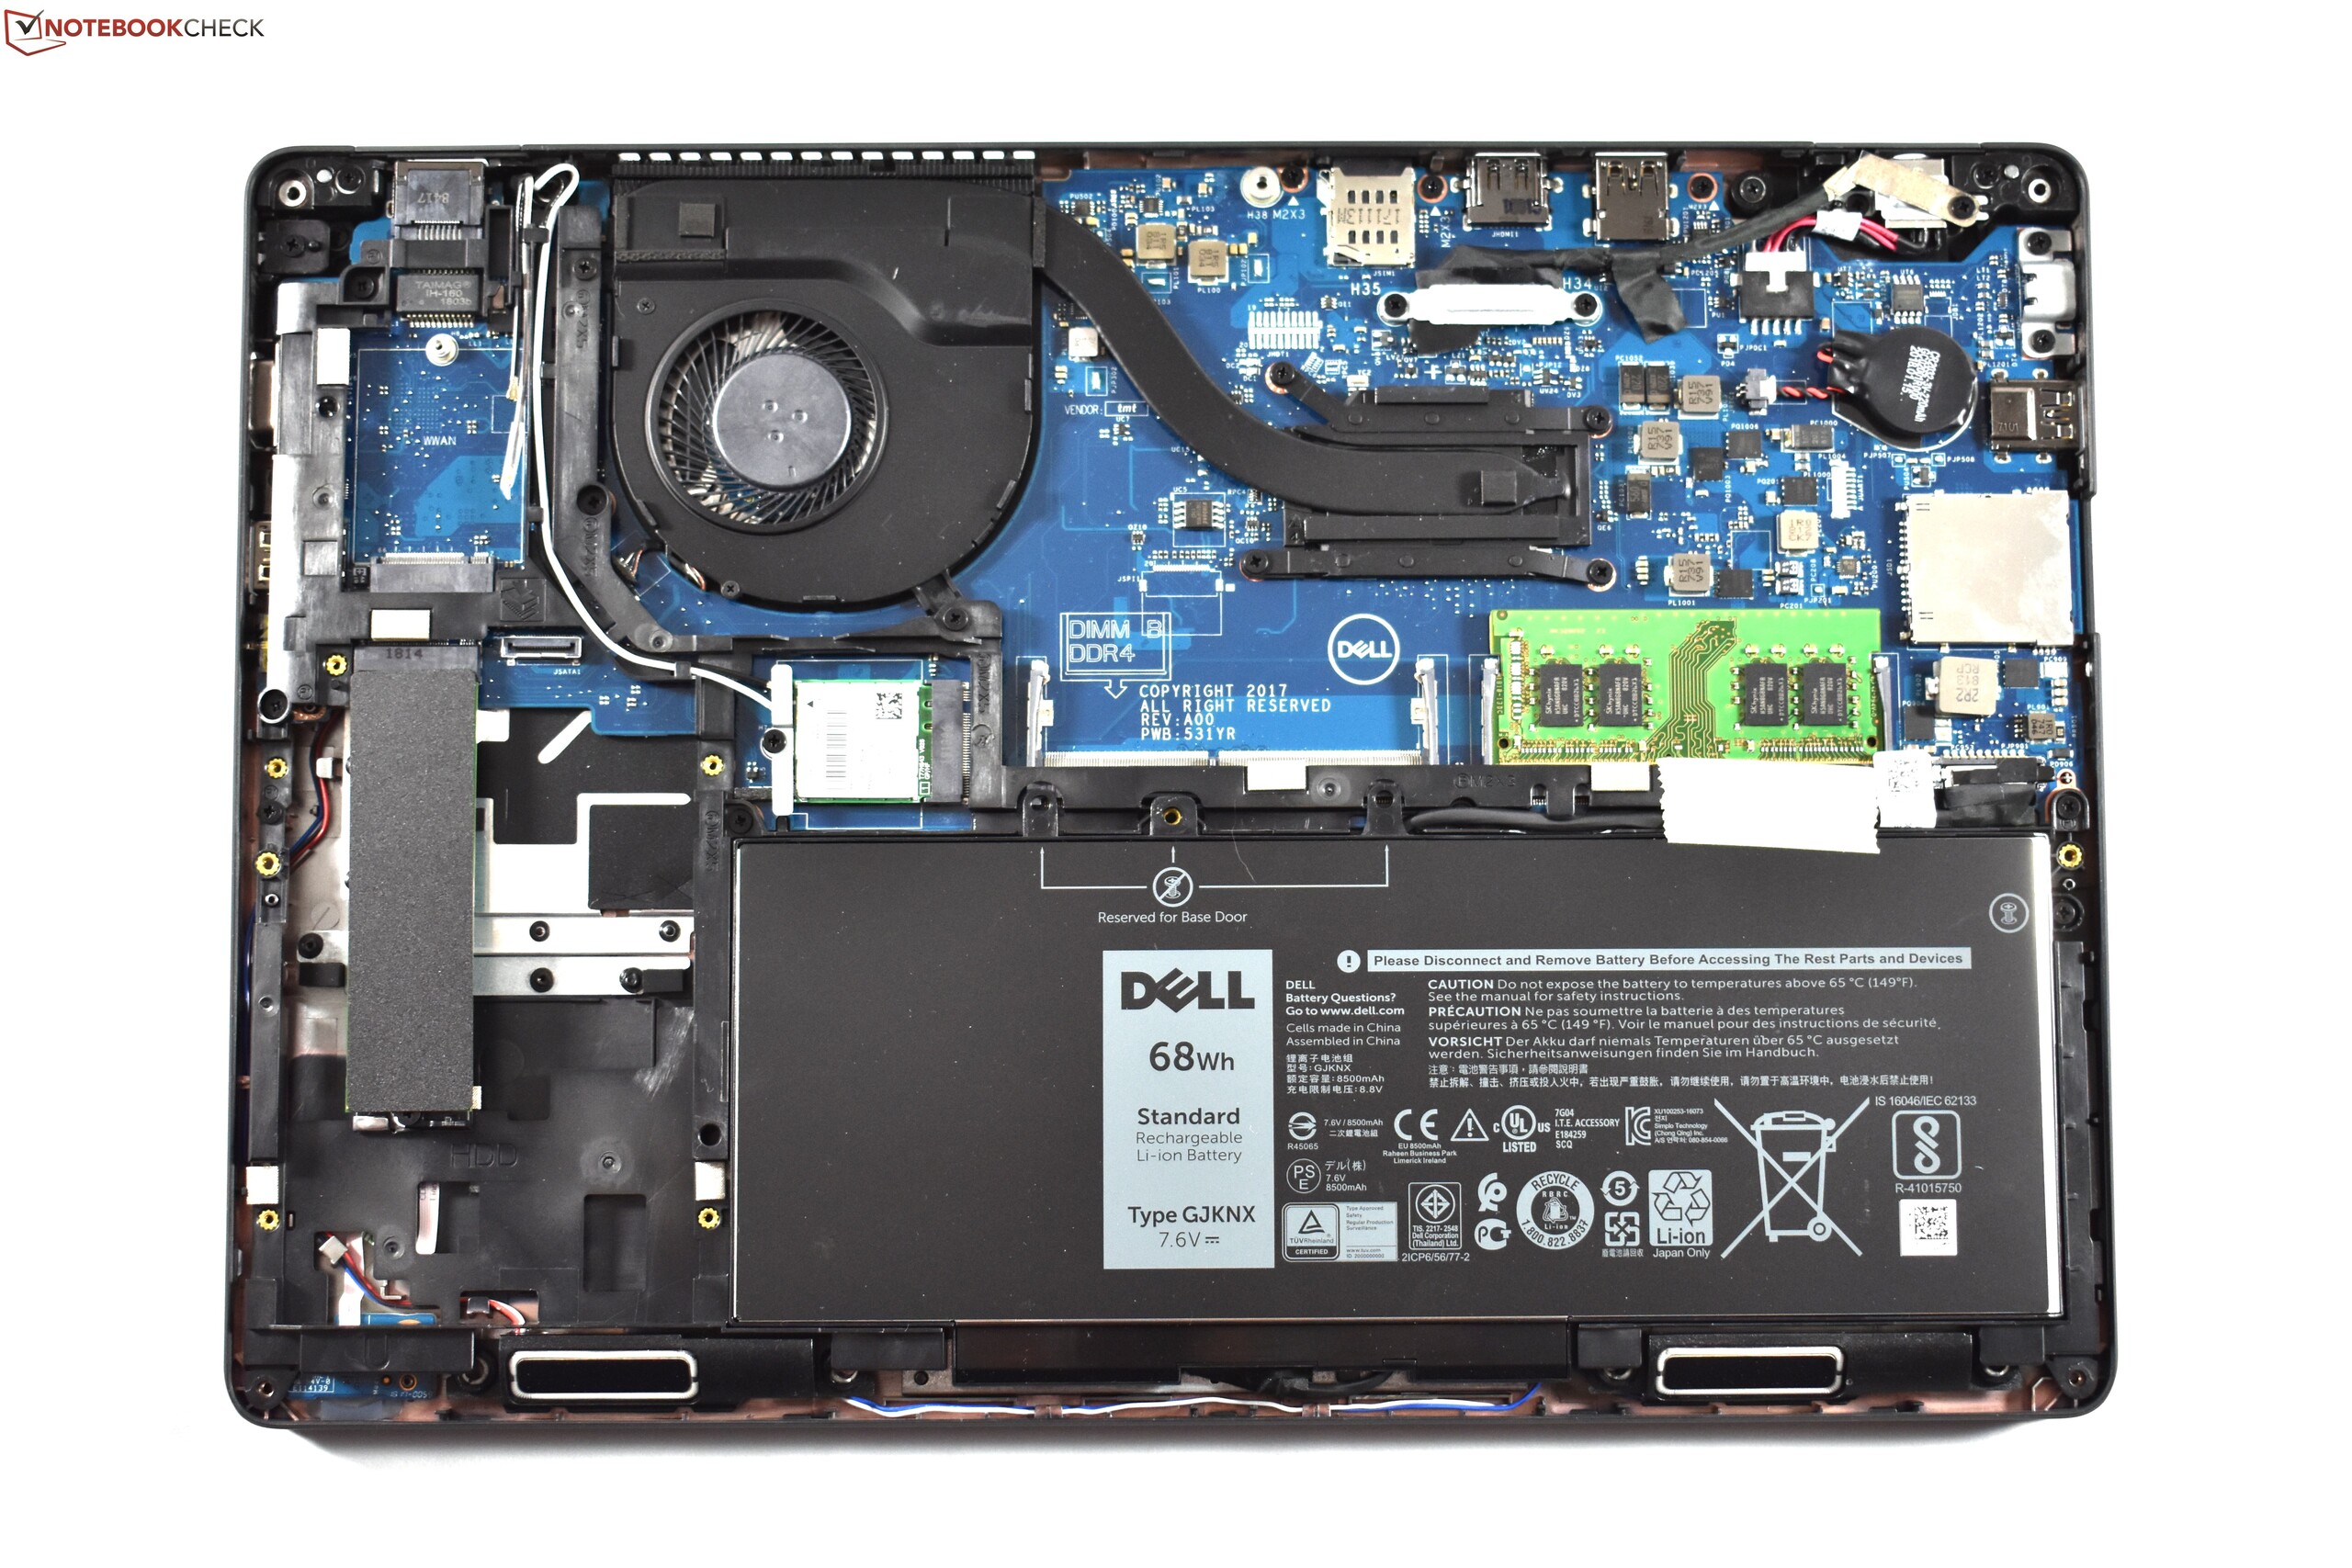
Primeiro: Estávamos muito interessados em saber se o Latitude utilizaria o potencial de desempenho de Ryzen - o veredicto nesse aspecto é "muito bom". O Latitude 5495 consegue derrotar seu modelo irmão Intel Dell Latitude 5490 dado que os concorrentes conhecidos como o Lenovo ThinkPad A485 e o HP EliteBook 745 G5. Ambos também são muito piores em termos de duração da bateria, apesar da bateria do Latitude ter uma capacidade menor do que a anunciada. Além dessas vantagens, o Latitude 5495 também oferece um leitor de cartões SD muito rápido, um chassi robusto com boa capacidade de atualização e, principalmente, bons dispositivos de entrada. Além disso, o ventilador permaneceu silencioso durante o modo ocioso, enquanto o chassi não esquentou muito, mesmo sob uso intenso.
Onde há luz também há sombra. Neste caso, a sombra é representada pela tela. A tela brilha com luz, mas vagamente, com apenas 200 cd/m² em média. Isto deveria e poderia ser melhor, dado que 200 cd/m² podem inclusive ser problemáticos em interiores claros. Além disso, a tela exibiu bleeding de luz de fundo e sua cobertura de espaço de cor foi insuficiente. A tela é a questão mais gritante, mas não a única. O chassi é mais pesado e muito mais grosso do que os concorrentes, o que provavelmente explica como a Dell conseguiu colocar uma bateria tão grande. O Dell Latitude 5495 também sente falta de recursos que esperamos encontrar em um portátil comercial dessa faixa de preço. Exemplos são um leitor de digitais, um Pointing Stick ou um teclado retro iluminado - esses recursos estão disponíveis apenas como opções caras. O Thunderbolt 3 também não está disponível, embora, neste caso, nem mesmo como uma opção. Além disso, a Dell faz recortes no SSD - essa é a única maneira que podemos explicar o lento SSD SATA III. O mesmo vale para a garantia padrão curta de apenas 12 meses.
Avaliação difícil: O Dell Latitude 5495 tem muitos aspectos positivos, mas também muitos inconvenientes.
Nesses casos, é difícil para nós recomendar um dispositivo ou aconselhar a não comprá-lo. O Dell Latitude 5495 certamente tem suas vantagens, mas, para nós, a tela escura é simplesmente inadmissível - mas também sabemos que muitos clientes corporativos geralmente têm prioridades diferentes da qualidade da tela. Considerando tudo, nós provavelmente preferimos os competidores Lenovo ThinkPad A485 e HP EliteBook 745 G5, apesar de que sua pior duração da bateria seja um grande argumento para o Latitude. Em qualquer caso, ainda é verdade que o portátil perfeito com AMD Ryzen ainda não foi inventado.
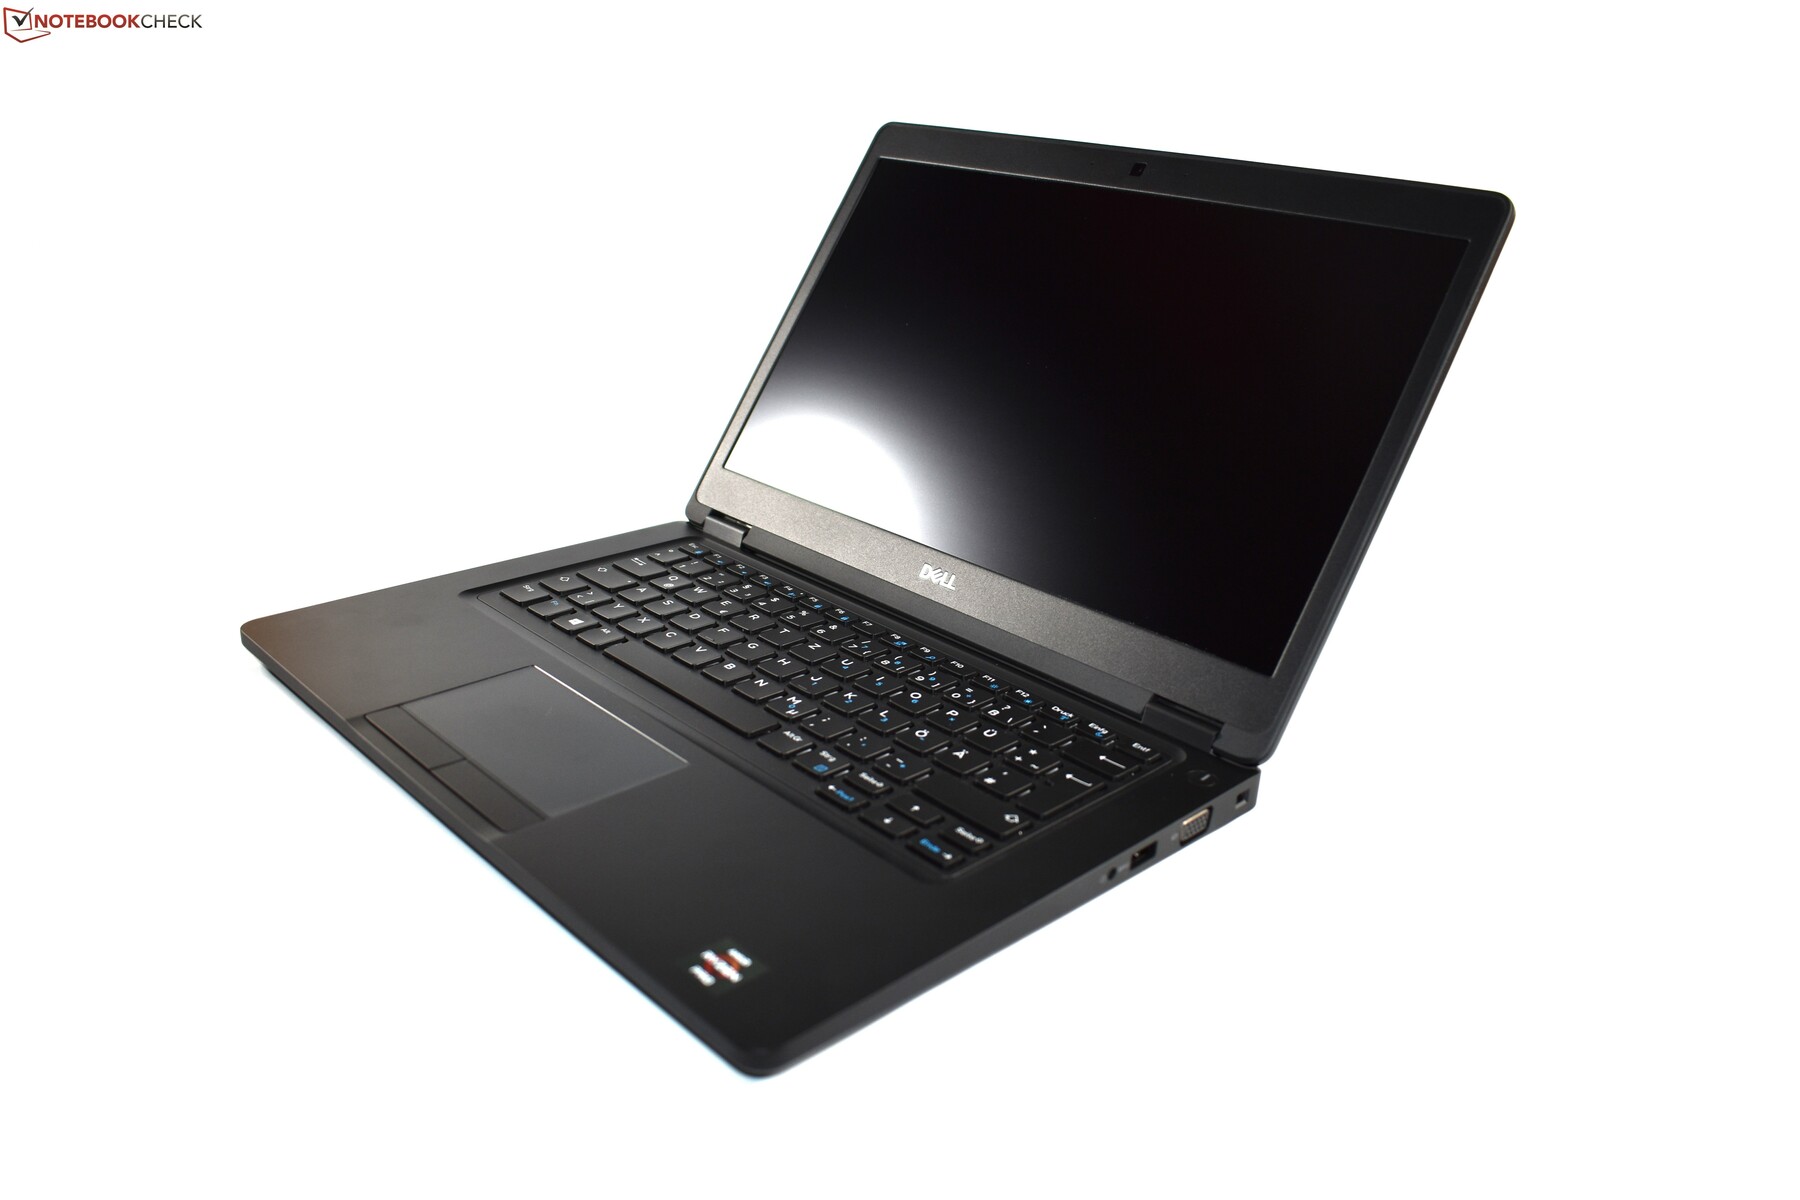
Dell Latitude 14 5495
- 04/06/2019 v6 (old)
Benjamin Herzig
Price comparison
