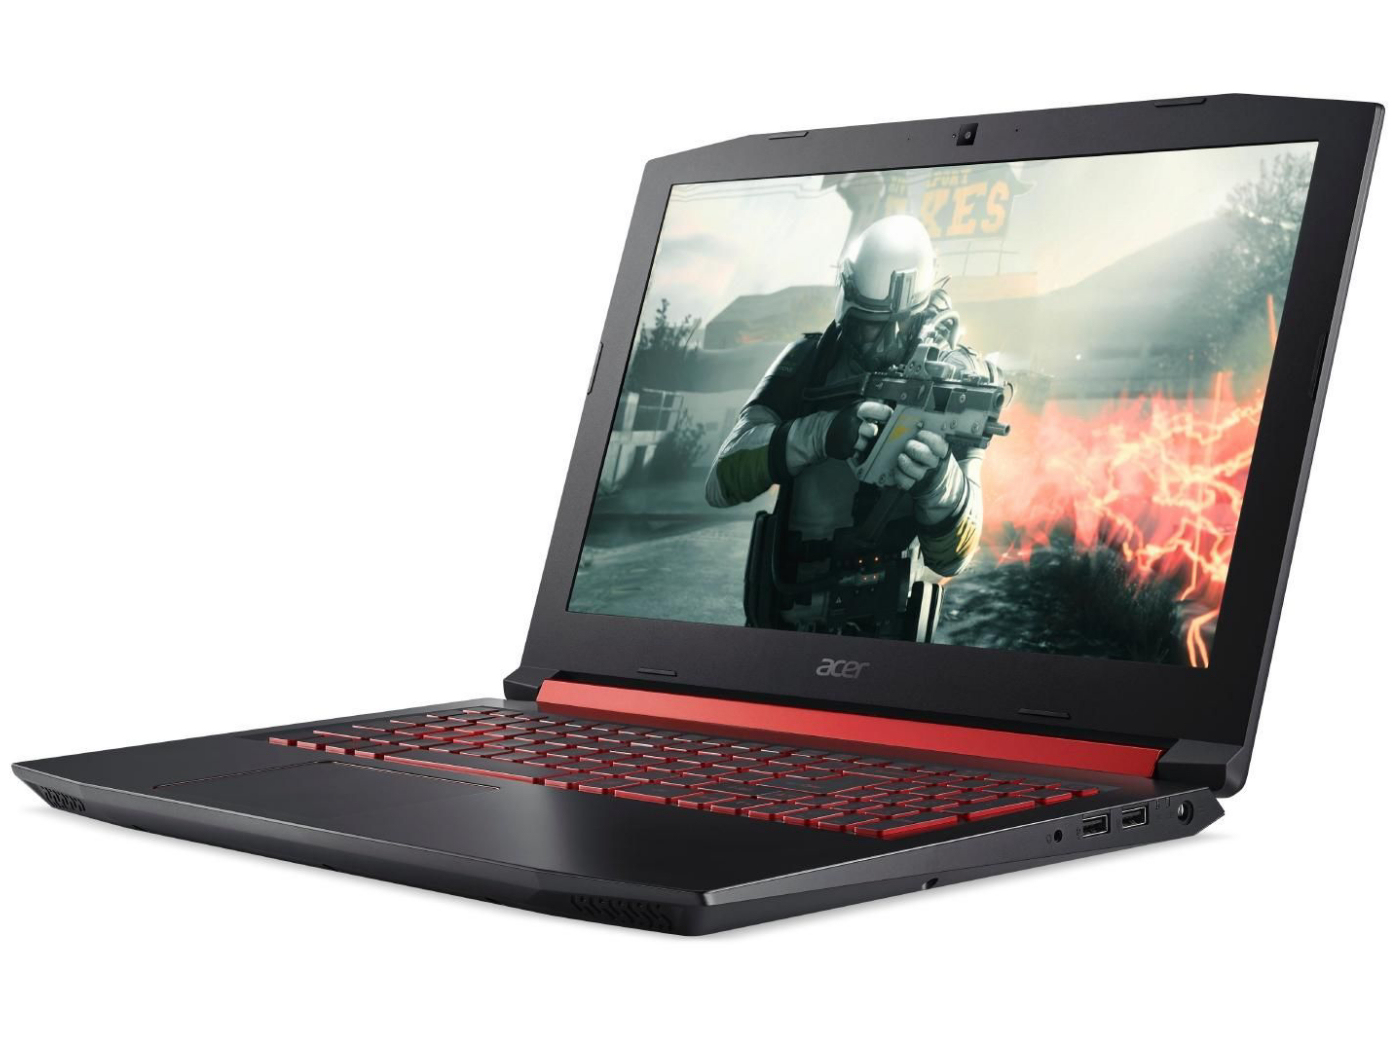
Breve Análise do Portátil Acer Nitro 5 (7700HQ, GTX 1050 Ti)
| |||||||||||||||||||||||||
iluminação: 91 %
iluminação com acumulador: 281 cd/m²
Contraste: 1104:1 (Preto: 0.25 cd/m²)
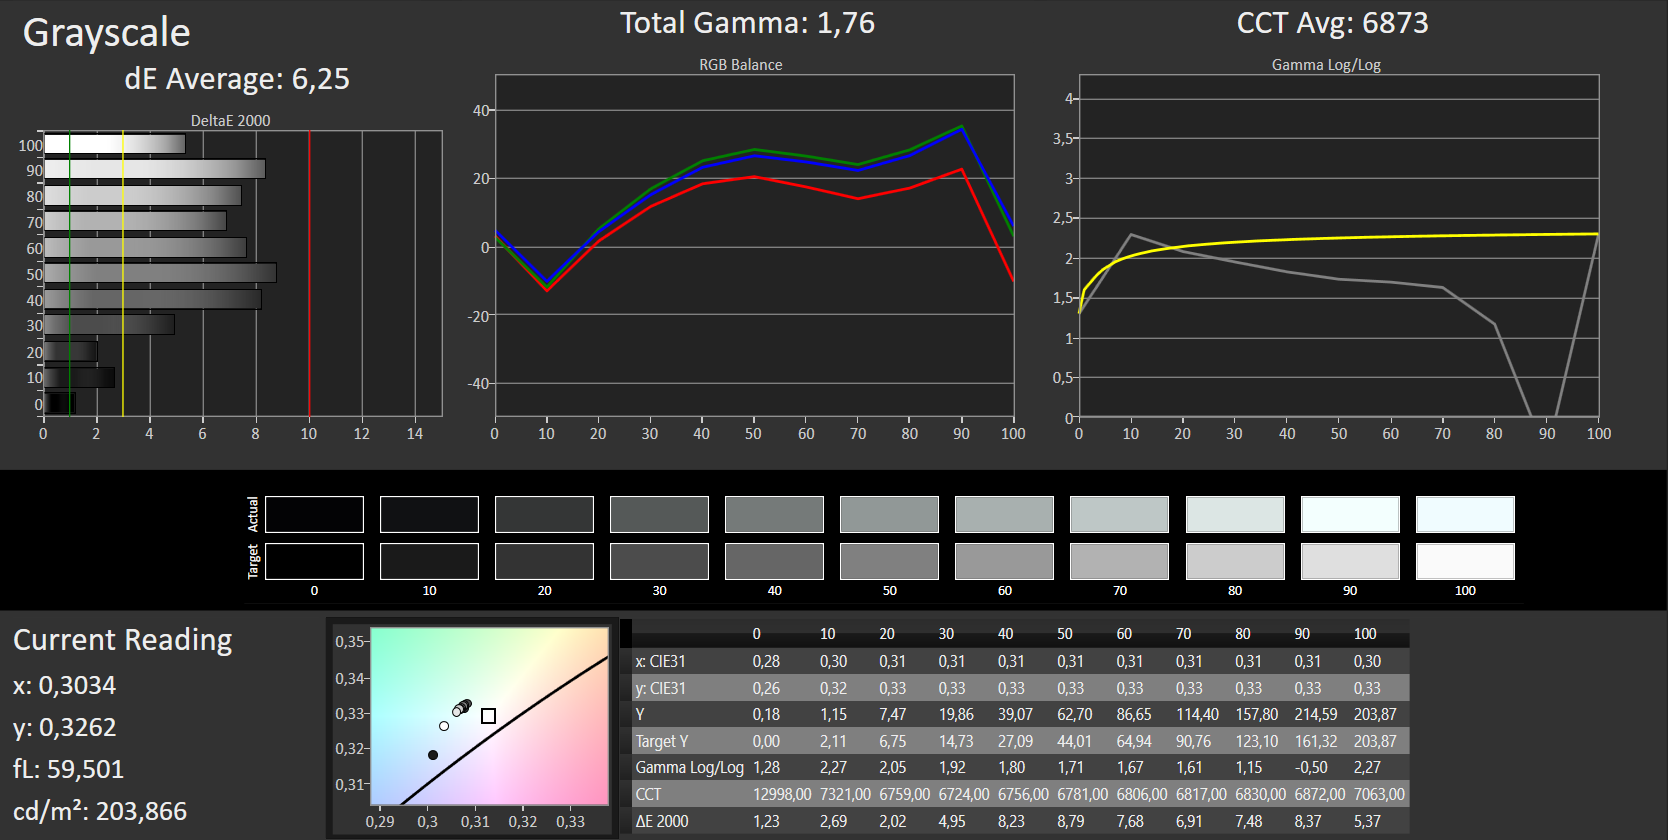
ΔE ColorChecker Calman: 5.06 | ∀{0.5-29.43 Ø4.72}
ΔE Greyscale Calman: 6.25 | ∀{0.09-98 Ø4.97}
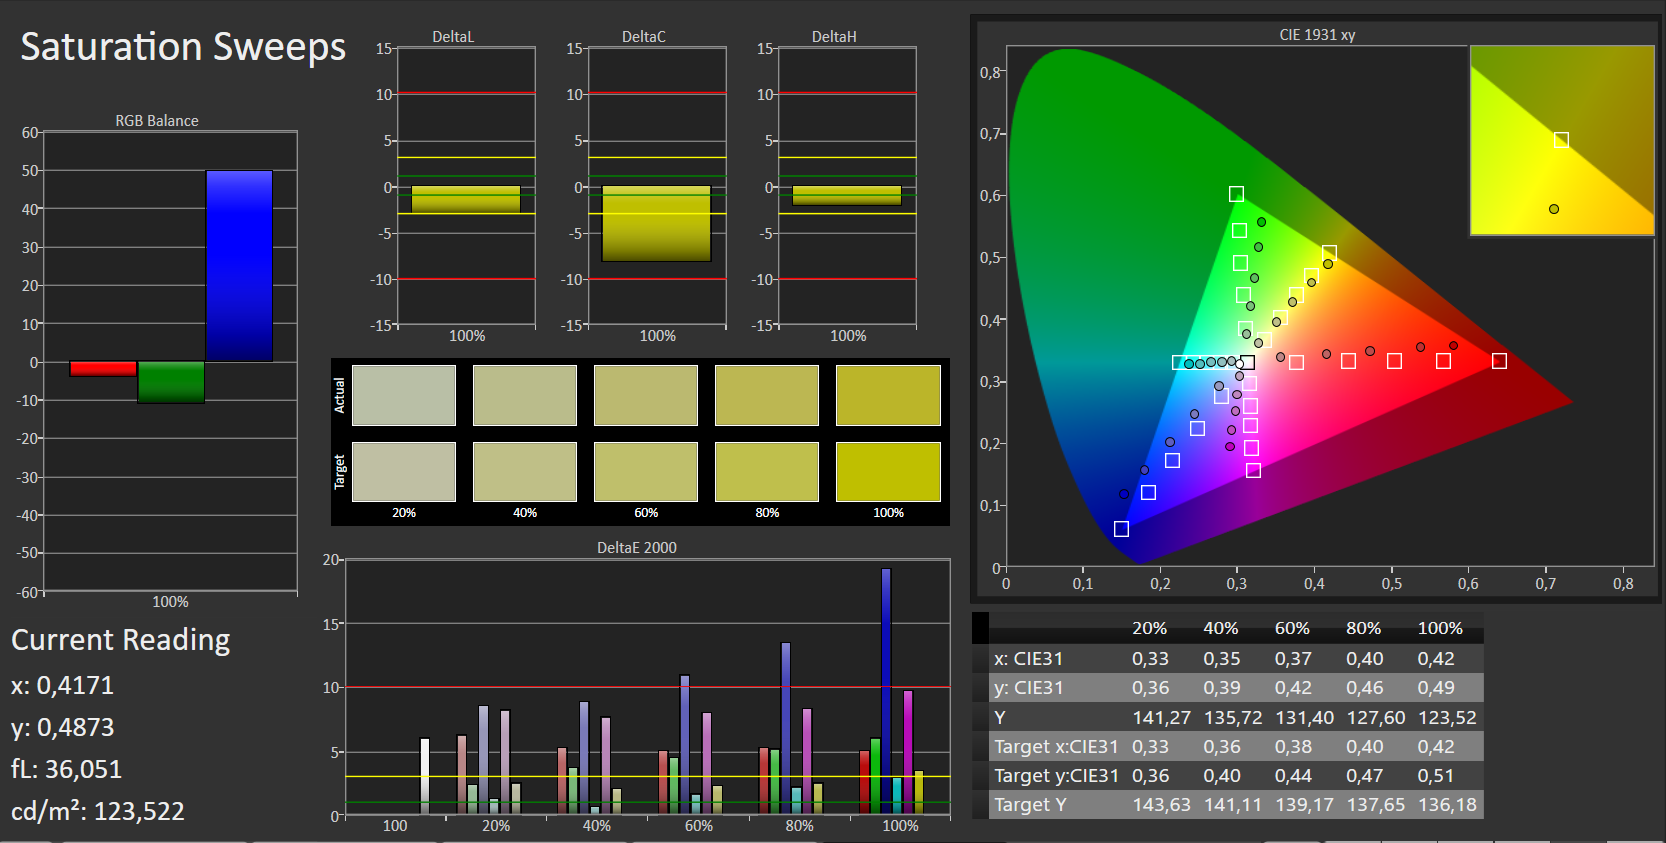
62% sRGB (Argyll 1.6.3 3D)
40% AdobeRGB 1998 (Argyll 1.6.3 3D)
43.17% AdobeRGB 1998 (Argyll 3D)
62.2% sRGB (Argyll 3D)
41.7% Display P3 (Argyll 3D)
Gamma: 1.76
CCT: 6873 K
| Acer Nitro 5 AN515-51-788E IPS, 1920x1080, 15.6" | HP Omen 15-ax213ng IPS, 1920x1080, 15.6" | Acer Aspire VX5-591G-75C4 VX15 IPS, 1920x1080, 15.6" | Dell Inspiron 15 7000 7567 TN, 1920x1080, 15.6" | Lenovo Legion Y520-15IKBN-80WK001KUS IPS, 1920x1080, 15.6" | Asus FX502VM-AS73 TN LED, 1920x1080, 15.6" | Medion Erazer X6603 AH-IPS, LED, 1920x1080, 15.6" | |
|---|---|---|---|---|---|---|---|
| Display | -7% | -7% | -13% | -9% | -12% | ||
| Display P3 Coverage (%) | 41.7 | 38.59 -7% | 38.88 -7% | 36.42 -13% | 38.28 -8% | 36.82 -12% | |
| sRGB Coverage (%) | 62.2 | 58 -7% | 58.2 -6% | 54.9 -12% | 56.9 -9% | 54.9 -12% | |
| AdobeRGB 1998 Coverage (%) | 43.17 | 39.87 -8% | 40.2 -7% | 37.62 -13% | 39.47 -9% | 38.09 -12% | |
| Response Times | -24% | 16% | -34% | -66% | 9% | -32% | |
| Response Time Grey 50% / Grey 80% * (ms) | 35 ? | 42 ? -20% | 22 ? 37% | 36 ? -3% | 58.8 ? -68% | 28.4 ? 19% | 46 ? -31% |
| Response Time Black / White * (ms) | 22 ? | 28 ? -27% | 23 ? -5% | 36 ? -64% | 36 ? -64% | 22.4 ? -2% | 29 ? -32% |
| PWM Frequency (Hz) | 21550 ? | 2174 ? | |||||
| Screen | 7% | -3% | -54% | -29% | -33% | -15% | |
| Brightness middle (cd/m²) | 276 | 230 -17% | 281 2% | 246 -11% | 239 -13% | 209.5 -24% | 252 -9% |
| Brightness (cd/m²) | 265 | 228 -14% | 257 -3% | 235 -11% | 244 -8% | 205 -23% | 246 -7% |
| Brightness Distribution (%) | 91 | 88 -3% | 85 -7% | 75 -18% | 88 -3% | 92 1% | 94 3% |
| Black Level * (cd/m²) | 0.25 | 0.21 16% | 0.32 -28% | 0.55 -120% | 0.35 -40% | 0.69 -176% | 0.23 8% |
| Contrast (:1) | 1104 | 1095 -1% | 878 -20% | 447 -60% | 683 -38% | 304 -72% | 1096 -1% |
| Colorchecker dE 2000 * | 5.06 | 4.01 21% | 5.16 -2% | 10.97 -117% | 7.3 -44% | 4.7 7% | 7.83 -55% |
| Colorchecker dE 2000 max. * | 10.13 | 7.26 28% | 9.09 10% | 24.7 -144% | 19.7 -94% | 15.5 -53% | |
| Greyscale dE 2000 * | 6.25 | 3.18 49% | 4.57 27% | 14.25 -128% | 4.9 22% | 1.8 71% | 7.11 -14% |
| Gamma | 1.76 125% | 2.52 87% | 2.59 85% | 1.83 120% | 2.19 100% | 2.23 99% | 2.19 100% |
| CCT | 6873 95% | 6814 95% | 6931 94% | 11200 58% | 7332 89% | 6975 93% | 7930 82% |
| Color Space (Percent of AdobeRGB 1998) (%) | 40 | 37 -7% | 37 -7% | 35 -12% | 35 -12% | 36.2 -9% | 35 -12% |
| Color Space (Percent of sRGB) (%) | 62 | 58 -6% | 58 -6% | 55 -11% | 55 -11% | 56.6 -9% | 55 -11% |
| Média Total (Programa/Configurações) | -8% /
-0% | 2% /
-1% | -34% /
-42% | -48% /
-35% | -11% /
-22% | -20% /
-17% |
* ... menor é melhor
Cintilação da tela / PWM (modulação por largura de pulso)
| Tela tremeluzindo / PWM não detectado | ||
[pwm_comparison] Em comparação: 52 % de todos os dispositivos testados não usam PWM para escurecer a tela. Se PWM foi detectado, uma média de 7772 (mínimo: 5 - máximo: 343500) Hz foi medida. | ||

Exibir tempos de resposta
| ↔ Tempo de resposta preto para branco | ||
|---|---|---|
| 22 ms ... ascensão ↗ e queda ↘ combinadas | ↗ 12 ms ascensão | 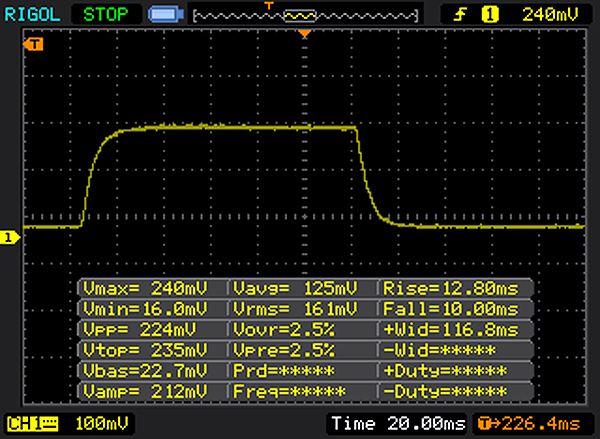 |
| ↘ 10 ms queda | ||
| A tela mostra boas taxas de resposta em nossos testes, mas pode ser muito lenta para jogadores competitivos. Em comparação, todos os dispositivos testados variam de 0.1 (mínimo) a 240 (máximo) ms. » 49 % de todos os dispositivos são melhores. Isso significa que o tempo de resposta medido é pior que a média de todos os dispositivos testados (19.8 ms). | ||
| ↔ Tempo de resposta 50% cinza a 80% cinza | ||
| 35 ms ... ascensão ↗ e queda ↘ combinadas | ↗ 16 ms ascensão | 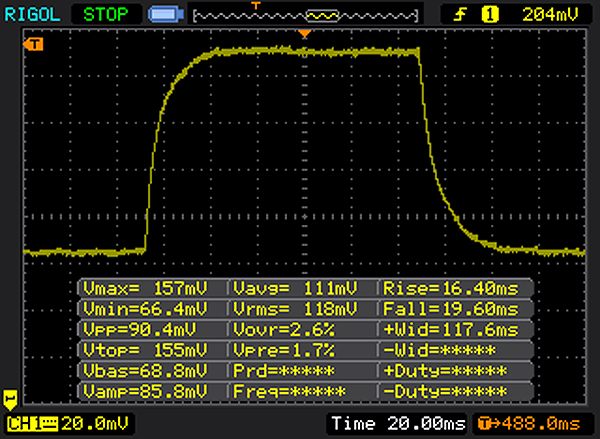 |
| ↘ 19 ms queda | ||
| A tela mostra taxas de resposta lentas em nossos testes e será insatisfatória para os jogadores. Em comparação, todos os dispositivos testados variam de 0.165 (mínimo) a 636 (máximo) ms. » 49 % de todos os dispositivos são melhores. Isso significa que o tempo de resposta medido é pior que a média de todos os dispositivos testados (31 ms). | ||
| Cinebench R10 | |
| Rendering Multiple CPUs 32Bit | |
| Acer Nitro 5 AN515-51-788E | |
| Medion Erazer X6603 | |
| Asus FX502VM-AS73 | |
| Rendering Single 32Bit | |
| Acer Nitro 5 AN515-51-788E | |
| Medion Erazer X6603 | |
| Asus FX502VM-AS73 | |
| Geekbench 3 | |
| 32 Bit Multi-Core Score | |
| Acer Nitro 5 AN515-51-788E | |
| 32 Bit Single-Core Score | |
| Acer Nitro 5 AN515-51-788E | |
| Geekbench 4.0 | |
| 64 Bit Multi-Core Score | |
| Acer Nitro 5 AN515-51-788E | |
| 64 Bit Single-Core Score | |
| Acer Nitro 5 AN515-51-788E | |
| Geekbench 4.4 | |
| 64 Bit Multi-Core Score | |
| Acer Nitro 5 AN515-51-788E | |
| 64 Bit Single-Core Score | |
| Acer Nitro 5 AN515-51-788E | |
| JetStream 1.1 - 1.1 Total | |
| Medion Erazer X6603 (Edge 38.14393.1066.0) | |
| HP Omen 15-ax213ng (Edge 40.15063.0.0) | |
| Lenovo Legion Y520-15IKBN-80WK001KUS | |
| Dell Inspiron 15 7000 7567 (EDGE 38.1439.3.00) | |
| Acer Nitro 5 AN515-51-788E (Edge 40) | |
| Asus FX502VM-AS73 (Edge 38.14393.0.0) | |
| PCMark 7 Score | 6346 pontos | |
| PCMark 8 Home Score Accelerated v2 | 4177 pontos | |
| PCMark 8 Creative Score Accelerated v2 | 5291 pontos | |
| PCMark 8 Work Score Accelerated v2 | 5096 pontos | |
| PCMark 10 Score | 4474 pontos | |
Ajuda | ||

| Acer Nitro 5 AN515-51-788E Intel SSD 600p SSDPEKKW256G7 | HP Omen 15-ax213ng Samsung PM961 MZVLW256HEHP | Acer Aspire VX5-591G-75C4 VX15 Toshiba MQ01ABD100 | Dell Inspiron 15 7000 7567 Intel SSDSCKKF256H6 | Lenovo Legion Y520-15IKBN-80WK001KUS Samsung PM961 MZVLW256HEHP | Asus FX502VM-AS73 SK Hynix HFS256G39TND-N210A | Medion Erazer X6603 Samsung PM961 MZVLW256HEHP | |
|---|---|---|---|---|---|---|---|
| CrystalDiskMark 3.0 | 75% | -95% | -30% | 64% | -40% | 63% | |
| Read Seq (MB/s) | 945 | 1657 75% | 101.5 -89% | 485.8 -49% | 2170 130% | 503 -47% | 2170 130% |
| Write Seq (MB/s) | 559 | 1208 116% | 100.6 -82% | 422.8 -24% | 1202 115% | 138.2 -75% | 1100 97% |
| Read 512 (MB/s) | 639 | 806 26% | 28.33 -96% | 338.9 -47% | 786 23% | 343.5 -46% | 788 23% |
| Write 512 (MB/s) | 561 | 807 44% | 28.31 -95% | 304 -46% | 822 47% | 137.8 -75% | 831 48% |
| Read 4k (MB/s) | 24.24 | 62.6 158% | 0.327 -99% | 27.11 12% | 58.9 143% | 29.36 21% | 59 143% |
| Write 4k (MB/s) | 122.7 | 176.9 44% | 0.846 -99% | 85.4 -30% | 146.4 19% | 70.9 -42% | 147.2 20% |
| Read 4k QD32 (MB/s) | 288.5 | 650 125% | 0.718 -100% | 279.6 -3% | 457.7 59% | 369.9 28% | 464 61% |
| Write 4k QD32 (MB/s) | 504 | 557 11% | 0.893 -100% | 255.1 -49% | 392.9 -22% | 99.7 -80% | 398.7 -21% |
| 3DMark 06 Standard Score | 27190 pontos | |
| 3DMark 11 Performance | 9084 pontos | |
| 3DMark Ice Storm Standard Score | 124922 pontos | |
| 3DMark Cloud Gate Standard Score | 22182 pontos | |
| 3DMark Fire Strike Score | 6730 pontos | |
| 3DMark Fire Strike Extreme Score | 3554 pontos | |
| 3DMark Time Spy Score | 2446 pontos | |
Ajuda | ||
| 3DMark | |
| 1920x1080 Fire Strike Physics | |
| Acer Nitro 5 AN515-51-788E (CoolBoost on) | |
| Acer Nitro 5 AN515-51-788E | |
| 1280x720 Cloud Gate Standard Physics | |
| Acer Nitro 5 AN515-51-788E (CoolBoost on) | |
| Acer Nitro 5 AN515-51-788E | |
| 3DMark 06 - CPU - CPU Score | |
| Acer Nitro 5 AN515-51-788E (CoolBoost on) | |
| Acer Nitro 5 AN515-51-788E | |
| 3DMark 11 - 1280x720 Performance Physics | |
| Acer Nitro 5 AN515-51-788E (CoolBoost on) | |
| Acer Nitro 5 AN515-51-788E | |
| baixo | média | alto | ultra | |
|---|---|---|---|---|
| Tomb Raider (2013) | 423.3 | 304.5 | 196.3 | 89 |
| BioShock Infinite (2013) | 260.7 | 206.7 | 185.8 | 74.1 |
| The Witcher 3 (2015) | 141.1 | 86.3 | 47.4 | 24.2 |
| Prey (2017) | 142.5 | 102.6 | 82.8 | 66.8 |
| Rocket League (2017) | 247.6 | 178.5 | 111.3 | |
| Dirt 4 (2017) | 249.9 | 114.5 | 59.6 | 36.1 |
| Playerunknown's Battlegrounds (PUBG) (2017) | 126 | 58.8 | 51.5 | 35.9 |
| F1 2017 (2017) | 178 | 91 | 71 | 44 |
| Ark Survival Evolved (2017) | 94.9 | 31.3 | 22.7 | 14.6 |
| BioShock Infinite - 1920x1080 Ultra Preset, DX11 (DDOF) | |
| Asus FX502VM-AS73 | |
| Acer Nitro 5 AN515-51-788E | |
| Lenovo Legion Y520-15IKBN-80WK001KUS | |
| Medion Erazer X6603 | |
| Dell Inspiron 15 7000 7567 | |
| HP Omen 15-ax213ng | |
| The Witcher 3 - 1920x1080 High Graphics & Postprocessing (Nvidia HairWorks Off) | |
| HP Omen 15-ax213ng | |
| Acer Nitro 5 AN515-51-788E | |
| Acer Aspire VX5-591G-75C4 VX15 | |
| Prey - 1920x1080 Very High Preset AA:2TX SM AF:16x | |
| Acer Nitro 5 AN515-51-788E | |
Barulho
| Ocioso |
| 30.6 / 30.7 / 30.7 dB |
| Carga |
| 43 / 45.8 dB |
 | ||
30 dB silencioso 40 dB(A) audível 50 dB(A) ruidosamente alto |
||
min: | ||
| Acer Nitro 5 AN515-51-788E i7-7700HQ, GeForce GTX 1050 Ti Mobile | HP Omen 15-ax213ng i7-7700HQ, GeForce GTX 1050 Ti Mobile | Acer Aspire VX5-591G-75C4 VX15 i7-7700HQ, GeForce GTX 1050 Ti Mobile | Dell Inspiron 15 7000 7567 i7-7700HQ, GeForce GTX 1050 Ti Mobile | Lenovo Legion Y520-15IKBN-80WK001KUS i7-7700HQ, GeForce GTX 1050 Ti Mobile | Asus FX502VM-AS73 i7-7700HQ, GeForce GTX 1060 Mobile | Medion Erazer X6603 i7-7700HQ, GeForce GTX 1050 Ti Mobile | |
|---|---|---|---|---|---|---|---|
| Noise | -11% | 3% | -2% | 3% | -3% | 3% | |
| desligado / ambiente * (dB) | 30.6 | 30 2% | 30.4 1% | 30.3 1% | 27.7 9% | 28.7 6% | 30.9 -1% |
| Idle Minimum * (dB) | 30.6 | 32 -5% | 31.4 -3% | 30.9 -1% | 30.5 -0% | 30.6 -0% | 30.9 -1% |
| Idle Average * (dB) | 30.7 | 34 -11% | 31.4 -2% | 30.9 -1% | 30.5 1% | 30.6 -0% | 30.9 -1% |
| Idle Maximum * (dB) | 30.7 | 36 -17% | 31.4 -2% | 31 -1% | 30.6 -0% | 31 -1% | 31.6 -3% |
| Load Average * (dB) | 43 | 48 -12% | 36.8 14% | 46.5 -8% | 40 7% | 46.2 -7% | 38.5 10% |
| Witcher 3 ultra * (dB) | 39.7 | 49 -23% | 40 -1% | ||||
| Load Maximum * (dB) | 45.8 | 51 -11% | 41.3 10% | 46.8 -2% | 42.6 7% | 52.3 -14% | 40.8 11% |
* ... menor é melhor
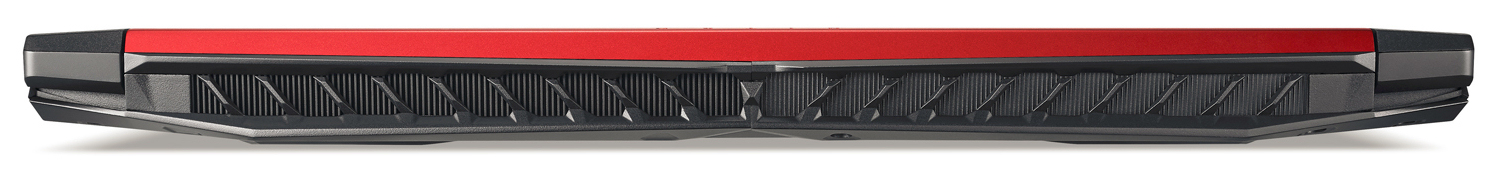
(±) A temperatura máxima no lado superior é 41.1 °C / 106 F, em comparação com a média de 40.4 °C / 105 F , variando de 21.2 a 68.8 °C para a classe Gaming.
(+) A parte inferior aquece até um máximo de 38.8 °C / 102 F, em comparação com a média de 43.2 °C / 110 F
(+) Em uso inativo, a temperatura média para o lado superior é 24.4 °C / 76 F, em comparação com a média do dispositivo de 33.9 °C / ### class_avg_f### F.
(±) Jogando The Witcher 3, a temperatura média para o lado superior é 32.5 °C / 91 F, em comparação com a média do dispositivo de 33.9 °C / ## #class_avg_f### F.
(+) Os apoios para as mãos e o touchpad são mais frios que a temperatura da pele, com um máximo de 27.6 °C / 81.7 F e, portanto, são frios ao toque.
(±) A temperatura média da área do apoio para as mãos de dispositivos semelhantes foi 28.8 °C / 83.8 F (+1.2 °C / 2.1 F).
| Acer Nitro 5 AN515-51-788E i7-7700HQ, GeForce GTX 1050 Ti Mobile | HP Omen 15-ax213ng i7-7700HQ, GeForce GTX 1050 Ti Mobile | Acer Aspire VX5-591G-75C4 VX15 i7-7700HQ, GeForce GTX 1050 Ti Mobile | Dell Inspiron 15 7000 7567 i7-7700HQ, GeForce GTX 1050 Ti Mobile | Lenovo Legion Y520-15IKBN-80WK001KUS i7-7700HQ, GeForce GTX 1050 Ti Mobile | Asus FX502VM-AS73 i7-7700HQ, GeForce GTX 1060 Mobile | Medion Erazer X6603 i7-7700HQ, GeForce GTX 1050 Ti Mobile | |
|---|---|---|---|---|---|---|---|
| Heat | -20% | -9% | 6% | -15% | -23% | 3% | |
| Maximum Upper Side * (°C) | 41.1 | 52.4 -27% | 47 -14% | 43.4 -6% | 46.8 -14% | 53.2 -29% | 44.3 -8% |
| Maximum Bottom * (°C) | 38.8 | 54.2 -40% | 47 -21% | 37.7 3% | 55.8 -44% | 56.8 -46% | 39.5 -2% |
| Idle Upper Side * (°C) | 28.7 | 30.5 -6% | 28.4 1% | 24.3 15% | 27.6 4% | 28.8 -0% | 24.8 14% |
| Idle Bottom * (°C) | 26.9 | 28.2 -5% | 27.1 -1% | 23.6 12% | 28.4 -6% | 31.4 -17% | 24.6 9% |
* ... menor é melhor
Acer Nitro 5 AN515-51-788E análise de áudio
(-) | alto-falantes não muito altos (###valor### dB)
Graves 100 - 315Hz
(±) | graves reduzidos - em média 13.5% menor que a mediana
(±) | a linearidade dos graves é média (12.7% delta para a frequência anterior)
Médios 400 - 2.000 Hz
(+) | médios equilibrados - apenas 3.8% longe da mediana
(±) | a linearidade dos médios é média (10.7% delta para frequência anterior)
Altos 2 - 16 kHz
(+) | agudos equilibrados - apenas 2.1% longe da mediana
(+) | os máximos são lineares (5.8% delta da frequência anterior)
Geral 100 - 16.000 Hz
(±) | a linearidade do som geral é média (18.1% diferença em relação à mediana)
Comparado com a mesma classe
» 57% de todos os dispositivos testados nesta classe foram melhores, 8% semelhantes, 35% piores
» O melhor teve um delta de 6%, a média foi 18%, o pior foi 132%
Comparado com todos os dispositivos testados
» 38% de todos os dispositivos testados foram melhores, 8% semelhantes, 54% piores
» O melhor teve um delta de 4%, a média foi 24%, o pior foi 134%
Apple MacBook 12 (Early 2016) 1.1 GHz análise de áudio
(+) | os alto-falantes podem tocar relativamente alto (###valor### dB)
Graves 100 - 315Hz
(±) | graves reduzidos - em média 11.3% menor que a mediana
(±) | a linearidade dos graves é média (14.2% delta para a frequência anterior)
Médios 400 - 2.000 Hz
(+) | médios equilibrados - apenas 2.4% longe da mediana
(+) | médios são lineares (5.5% delta para frequência anterior)
Altos 2 - 16 kHz
(+) | agudos equilibrados - apenas 2% longe da mediana
(+) | os máximos são lineares (4.5% delta da frequência anterior)
Geral 100 - 16.000 Hz
(+) | o som geral é linear (10.2% diferença em relação à mediana)
Comparado com a mesma classe
» 7% de todos os dispositivos testados nesta classe foram melhores, 2% semelhantes, 91% piores
» O melhor teve um delta de 5%, a média foi 18%, o pior foi 53%
Comparado com todos os dispositivos testados
» 5% de todos os dispositivos testados foram melhores, 1% semelhantes, 94% piores
» O melhor teve um delta de 4%, a média foi 24%, o pior foi 134%
| desligado | |
| Ocioso | |
| Carga |
|
Key:
min: | |
| Acer Nitro 5 AN515-51-788E i7-7700HQ, GeForce GTX 1050 Ti Mobile | HP Omen 15-ax213ng i7-7700HQ, GeForce GTX 1050 Ti Mobile | Acer Aspire VX5-591G-75C4 VX15 i7-7700HQ, GeForce GTX 1050 Ti Mobile | Dell Inspiron 15 7000 7567 i7-7700HQ, GeForce GTX 1050 Ti Mobile | Lenovo Legion Y520-15IKBN-80WK001KUS i7-7700HQ, GeForce GTX 1050 Ti Mobile | Asus FX502VM-AS73 i7-7700HQ, GeForce GTX 1060 Mobile | Medion Erazer X6603 i7-7700HQ, GeForce GTX 1050 Ti Mobile | |
|---|---|---|---|---|---|---|---|
| Power Consumption | -32% | -32% | 2% | -21% | -97% | -2% | |
| Idle Minimum * (Watt) | 4.1 | 6 -46% | 7 -71% | 4.4 -7% | 8.5 -107% | 14.9 -263% | 4.7 -15% |
| Idle Average * (Watt) | 6.9 | 11 -59% | 10.2 -48% | 6.8 1% | 9.1 -32% | 15.1 -119% | 7.6 -10% |
| Idle Maximum * (Watt) | 9.5 | 18 -89% | 14 -47% | 8.3 13% | 9.7 -2% | 15.2 -60% | 9.2 3% |
| Load Average * (Watt) | 83 | 81 2% | 78 6% | 81 2% | 79.9 4% | 105.8 -27% | 81 2% |
| Witcher 3 ultra * (Watt) | 108 | 90 17% | 97.7 10% | ||||
| Load Maximum * (Watt) | 126 | 146 -16% | 127 -1% | 127 -1% | 121.5 4% | 148.8 -18% | 112 11% |
* ... menor é melhor
| Acer Nitro 5 AN515-51-788E i7-7700HQ, GeForce GTX 1050 Ti Mobile, 48 Wh | HP Omen 15-ax213ng i7-7700HQ, GeForce GTX 1050 Ti Mobile, 63.3 Wh | Acer Aspire VX5-591G-75C4 VX15 i7-7700HQ, GeForce GTX 1050 Ti Mobile, 52.5 Wh | Dell Inspiron 15 7000 7567 i7-7700HQ, GeForce GTX 1050 Ti Mobile, 74 Wh | Lenovo Legion Y520-15IKBN-80WK001KUS i7-7700HQ, GeForce GTX 1050 Ti Mobile, 45 Wh | Asus FX502VM-AS73 i7-7700HQ, GeForce GTX 1060 Mobile, 64 Wh | Medion Erazer X6603 i7-7700HQ, GeForce GTX 1050 Ti Mobile, 45 Wh | |
|---|---|---|---|---|---|---|---|
| Duração da bateria | 0% | -21% | 40% | -37% | -30% | -38% | |
| Reader / Idle (h) | 14.9 | 12.8 -14% | 5.4 -64% | 19.6 32% | 8.5 -43% | 6.1 -59% | 5.7 -62% |
| H.264 (h) | 5.2 | 3.3 -37% | 7.6 46% | 3.8 -27% | |||
| WiFi v1.3 (h) | 6.7 | 7.1 6% | 5 -25% | 10.4 55% | 4 -40% | 4.6 -31% | 4.3 -36% |
| Load (h) | 1.1 | 1.6 45% | 1.4 27% | 1.4 27% | 0.8 -27% | 1.1 0% | 0.8 -27% |
Pro
Contra
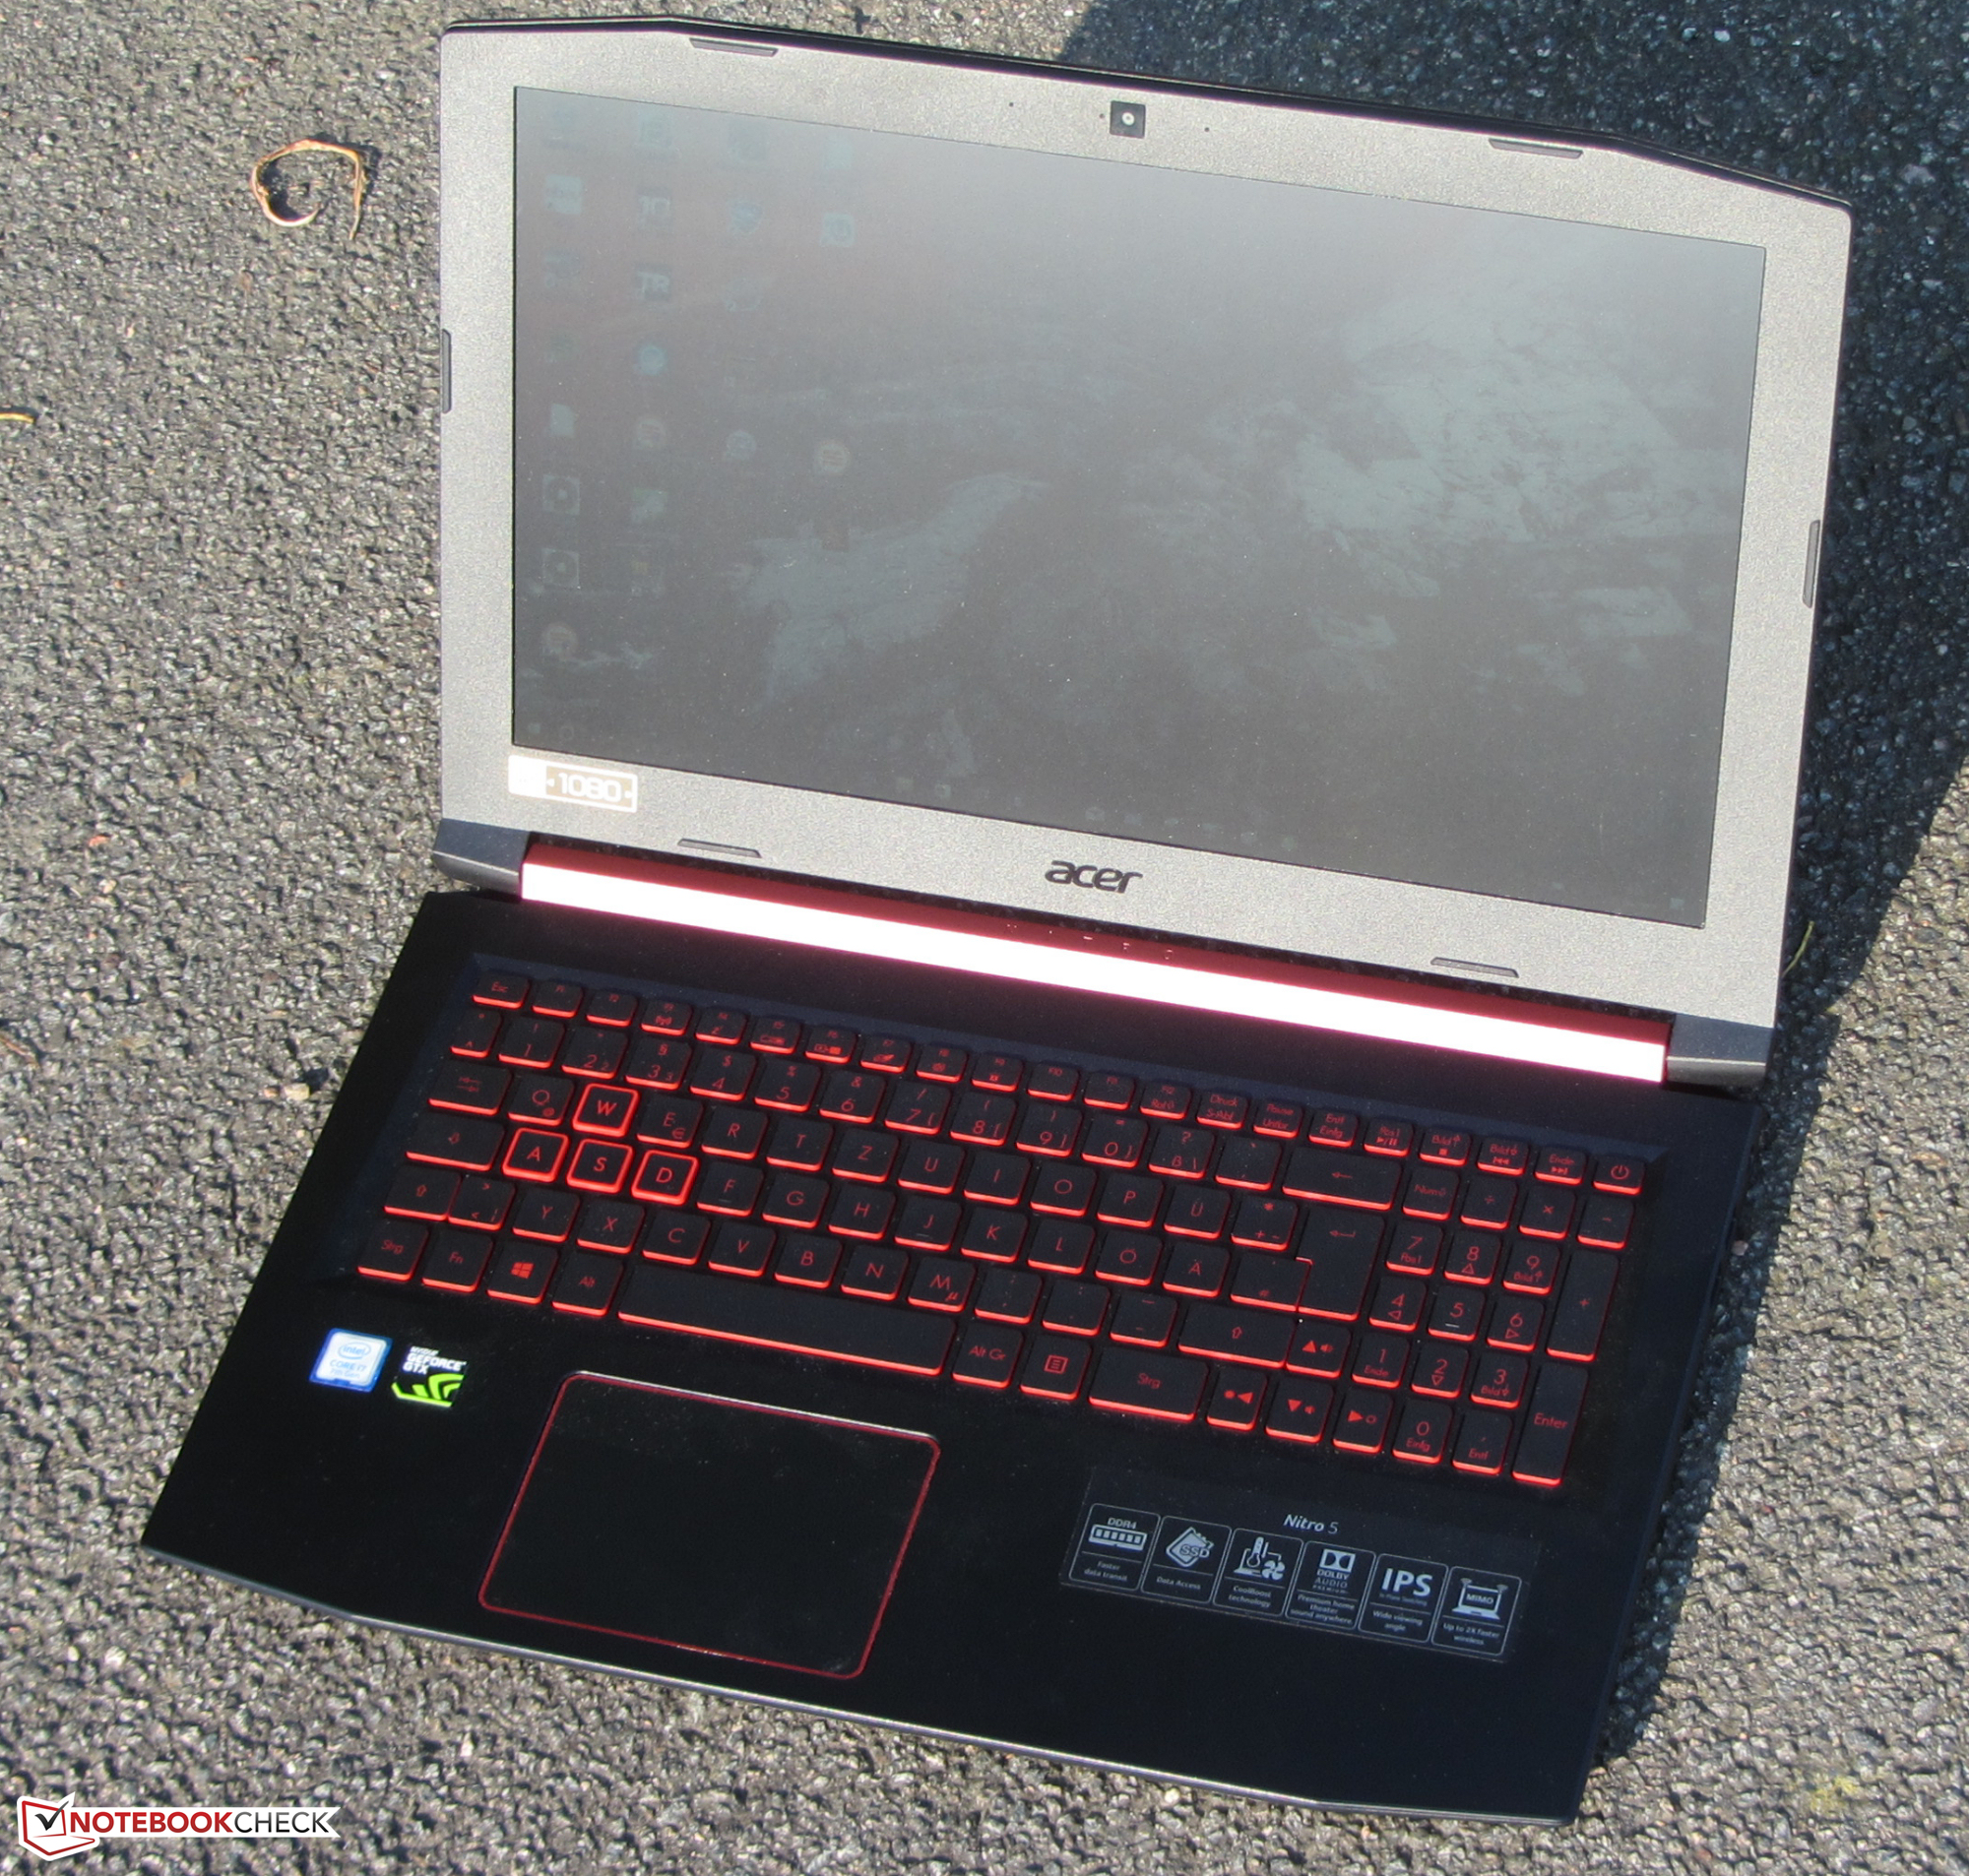
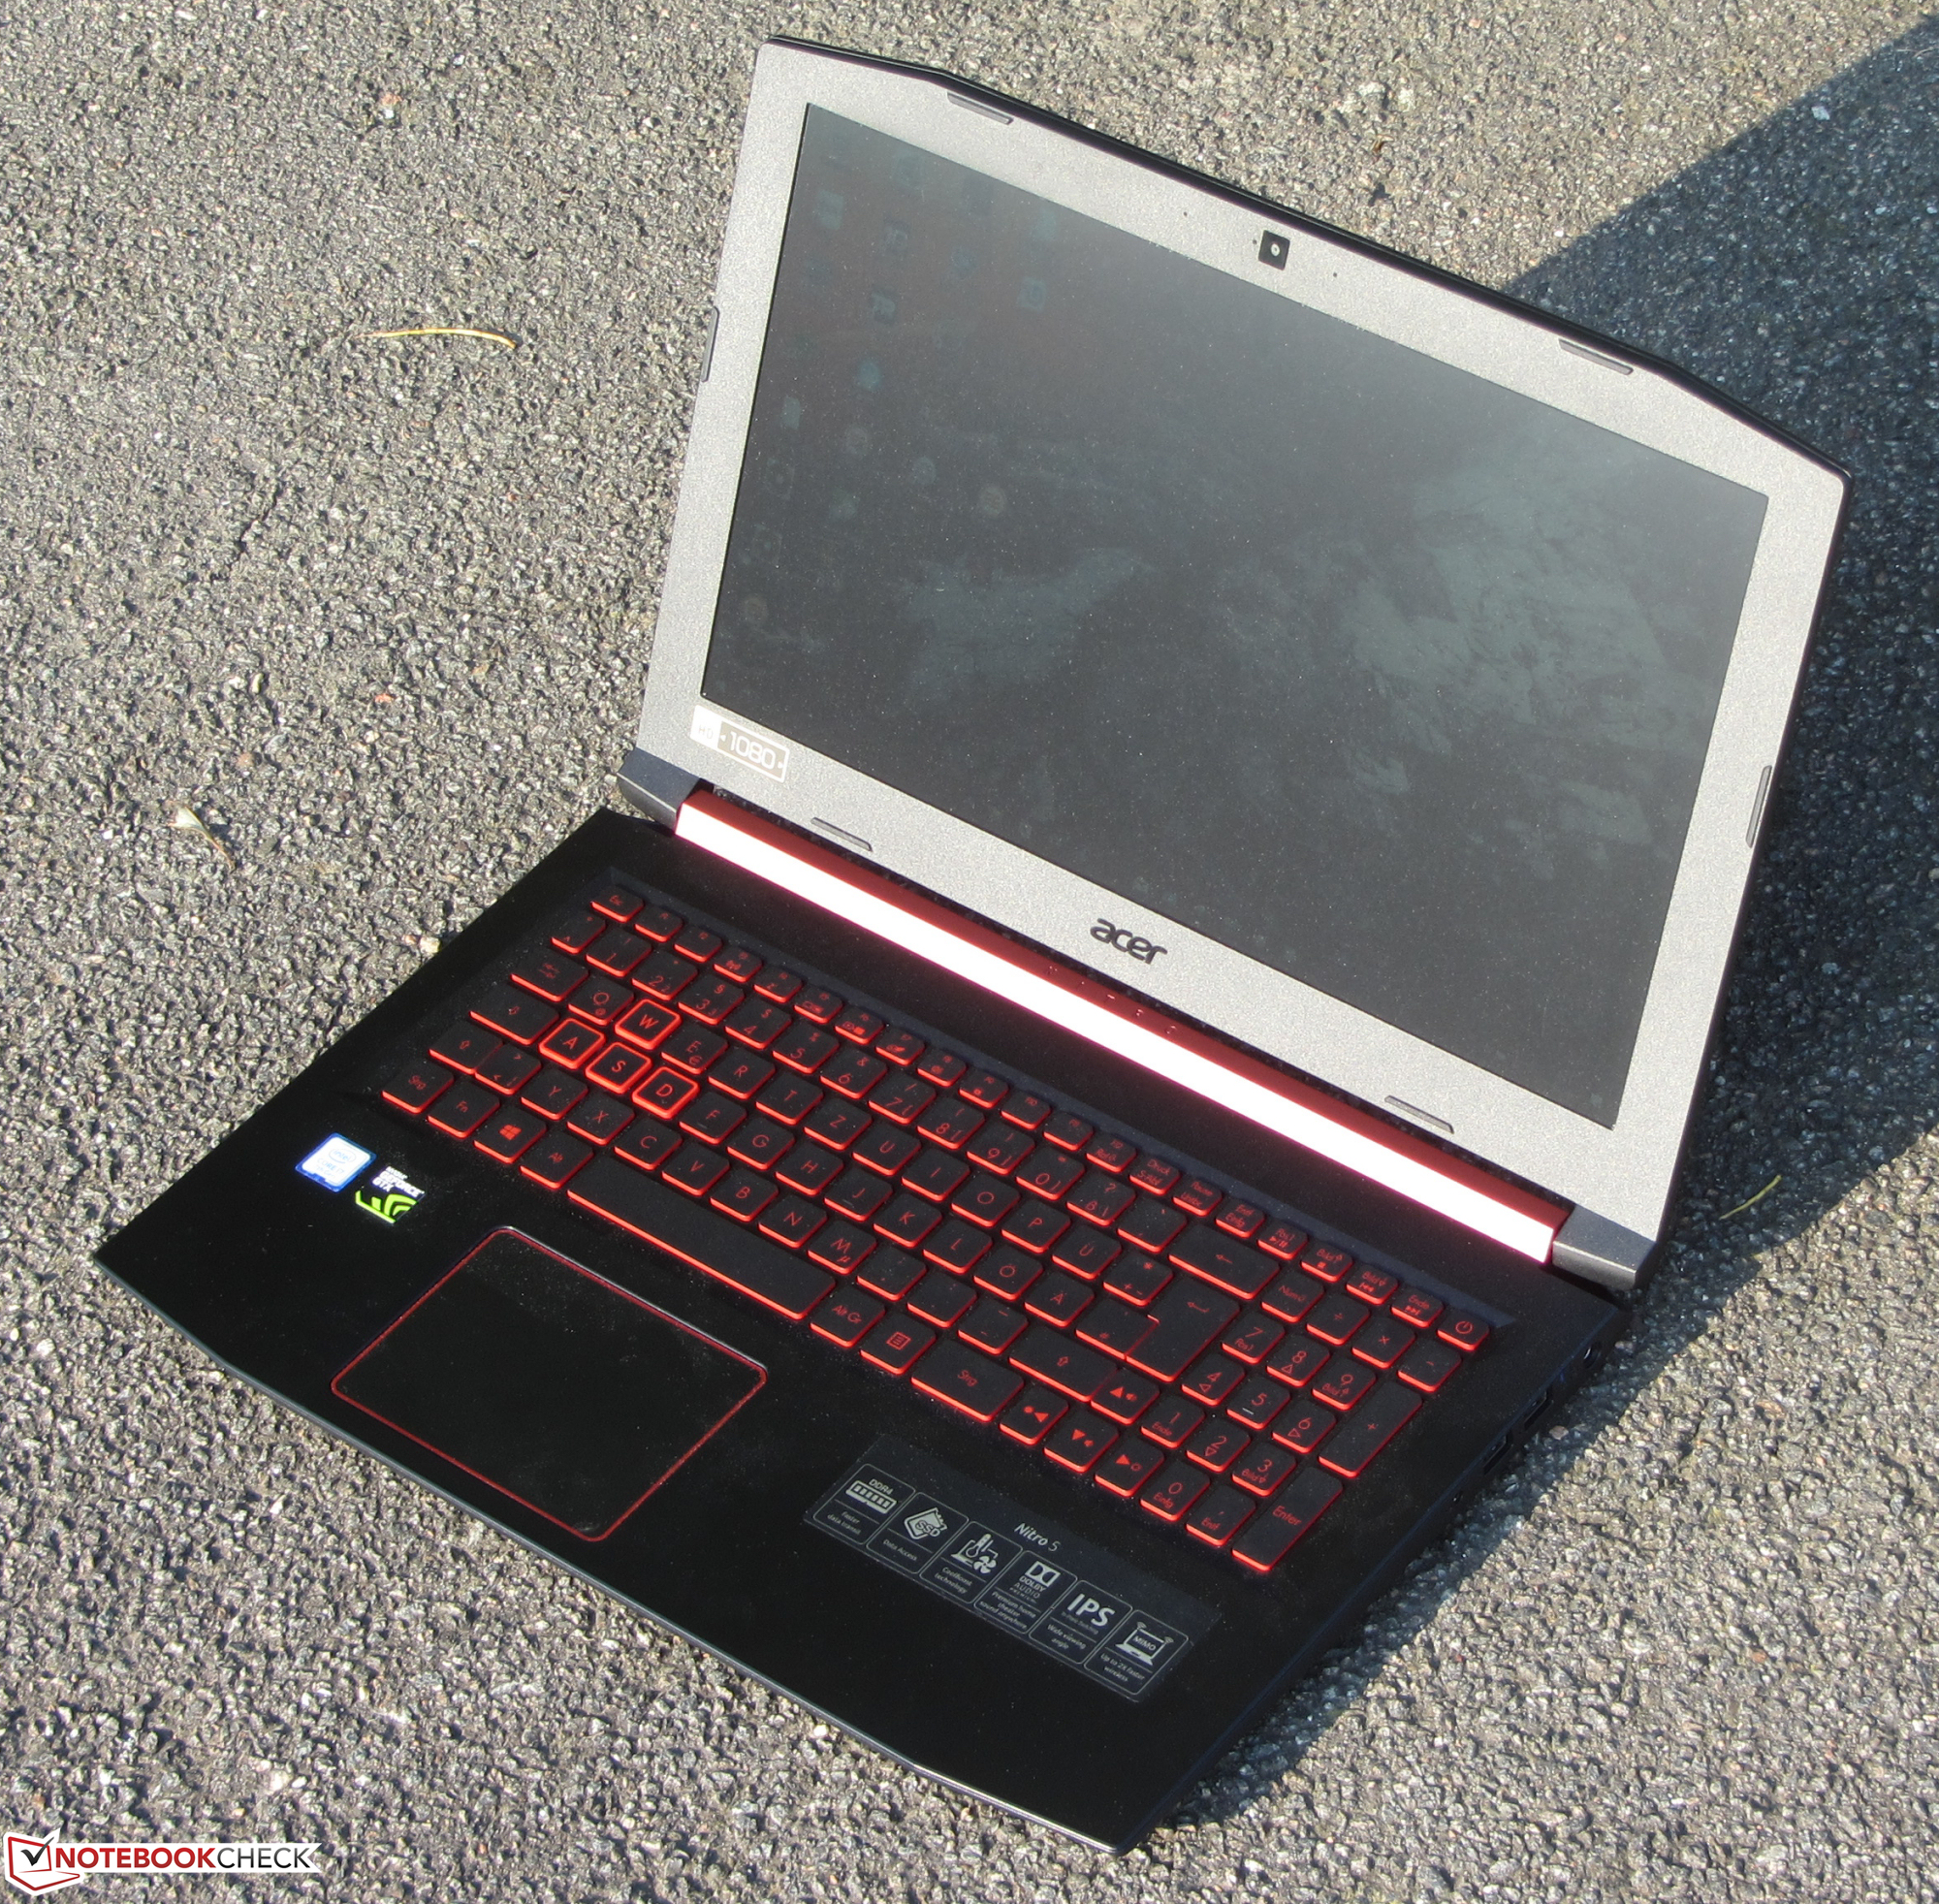
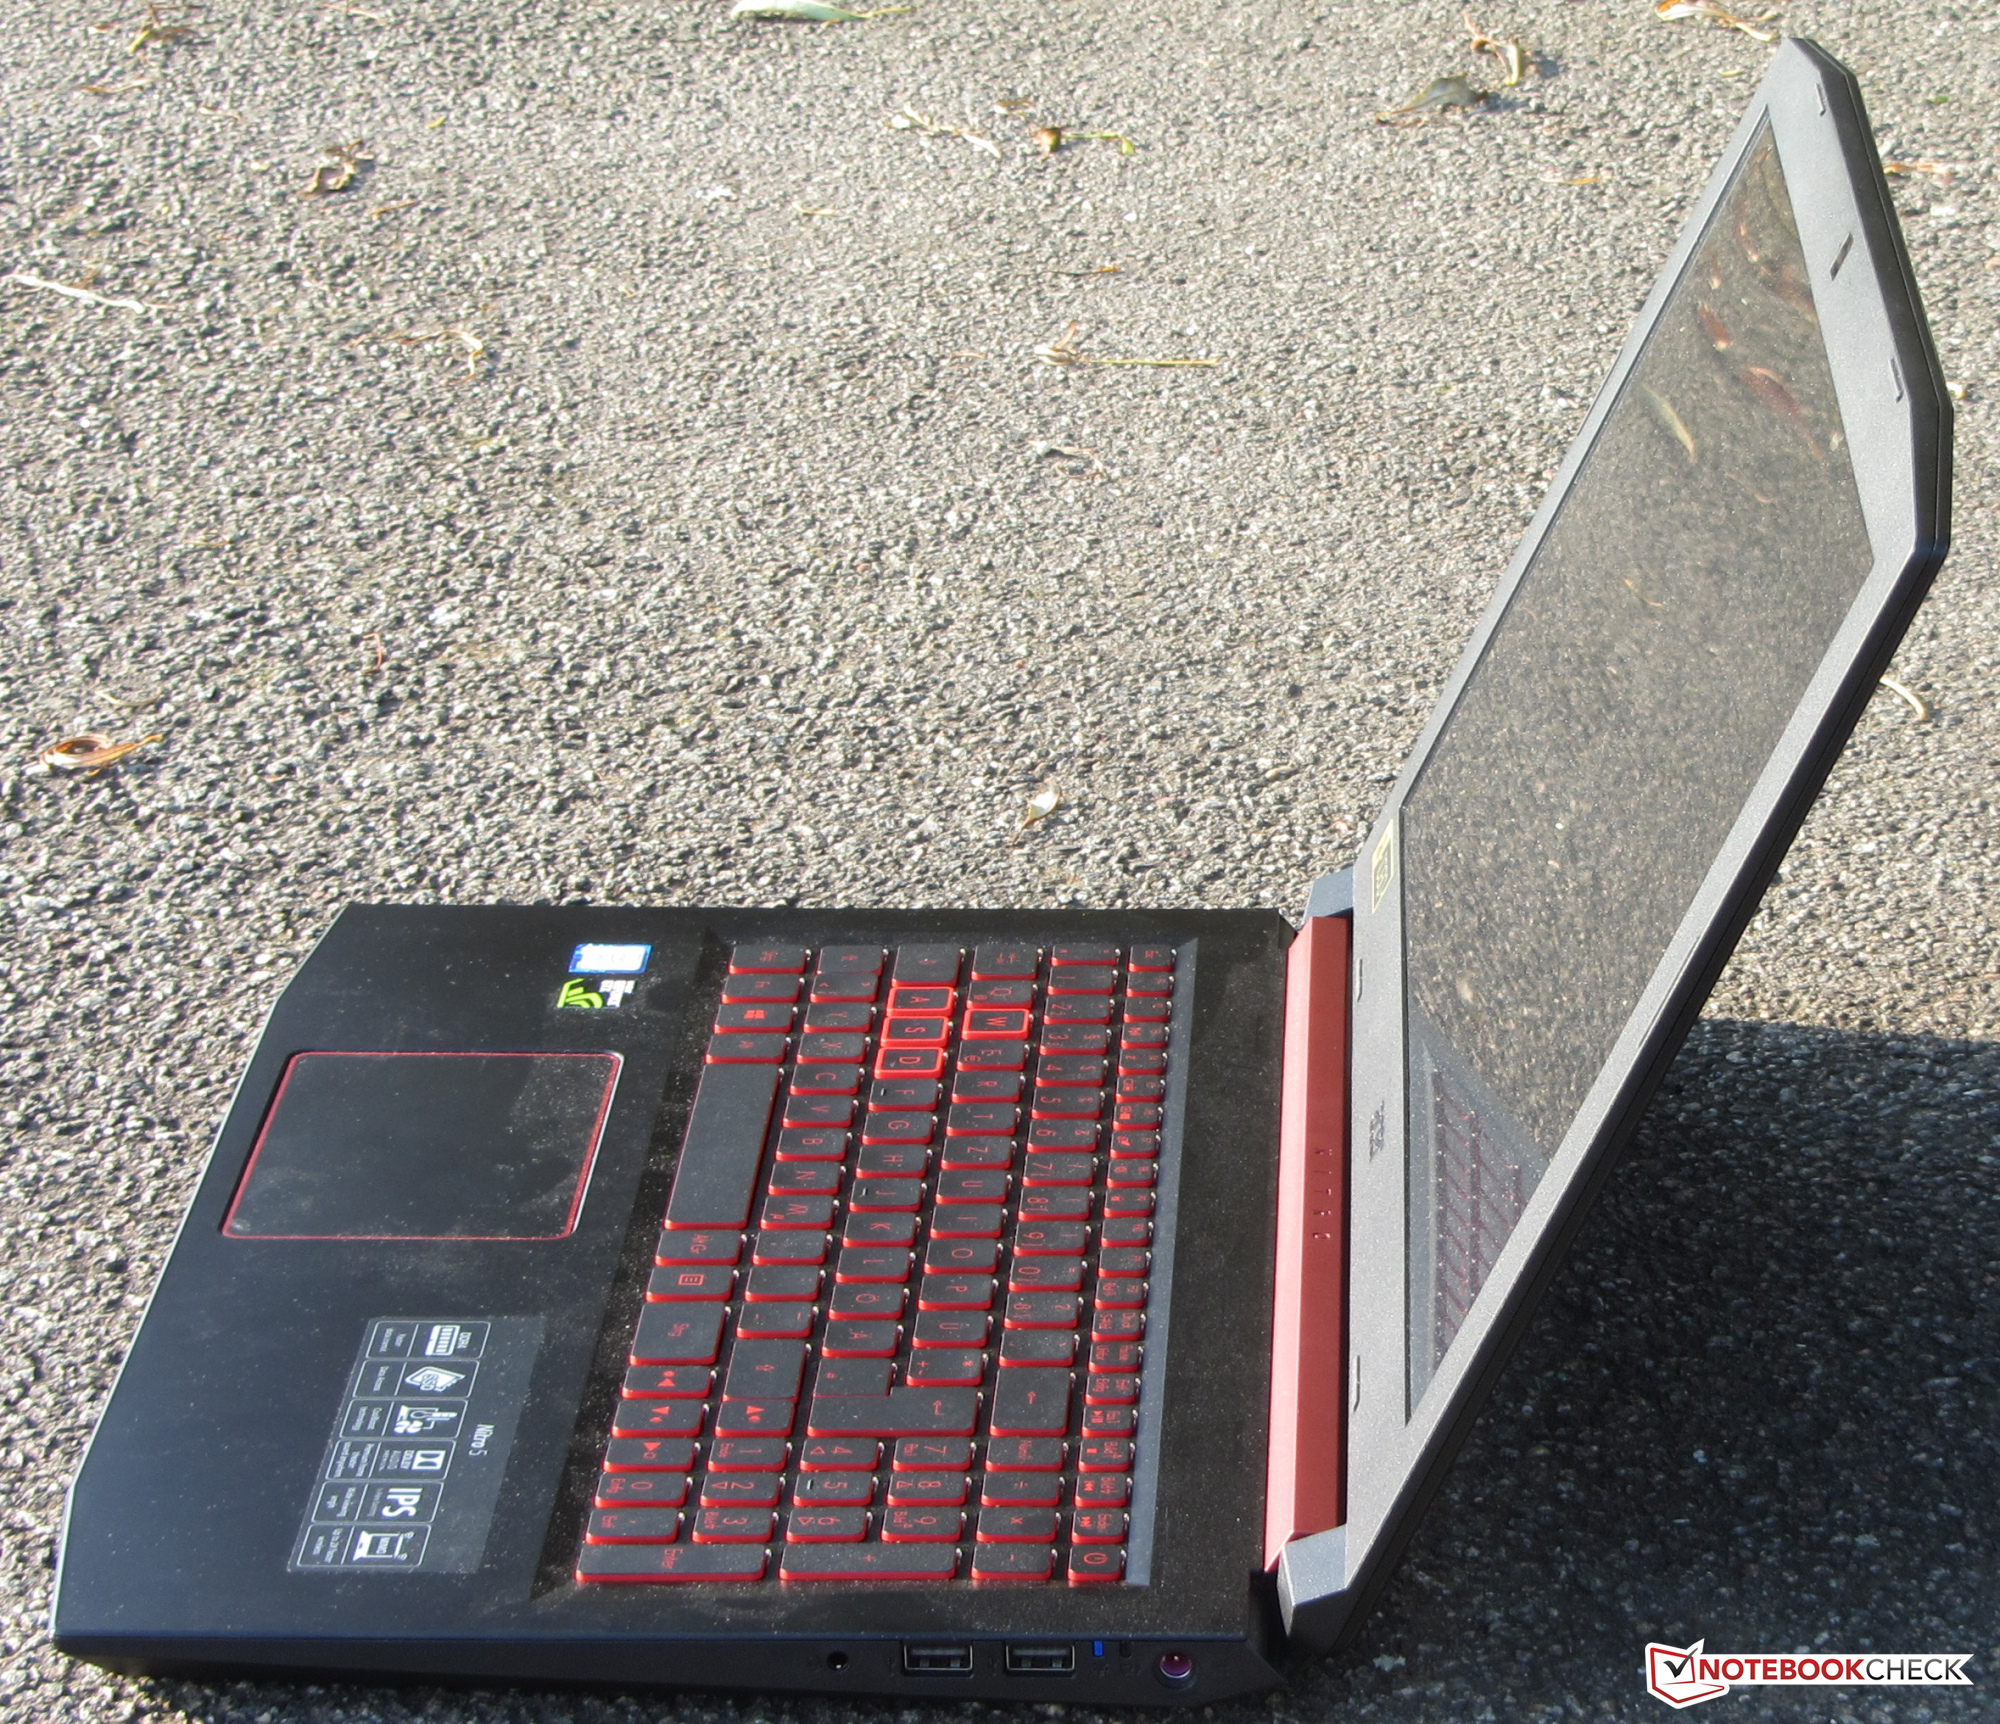
"Portátil poderoso para jogos casuais" - é assim que a Acer descreve o Nitro 5 - uma descrição muito adequada. O processador Core i7 oferece poder de processamento suficiente para todas as áreas importantes de uso. Combinado com o núcleo de gráficos GeForce GTX1050 Ti, o aparelho pode exibir todos os jogos atuais sem problemas na tela Full HD mate. Mas você terá que renunciar às configurações de alta qualidade - a GPU não está feita para isso.
O Nitro 5 é um bom poli funcional com foco em jogos de computador.
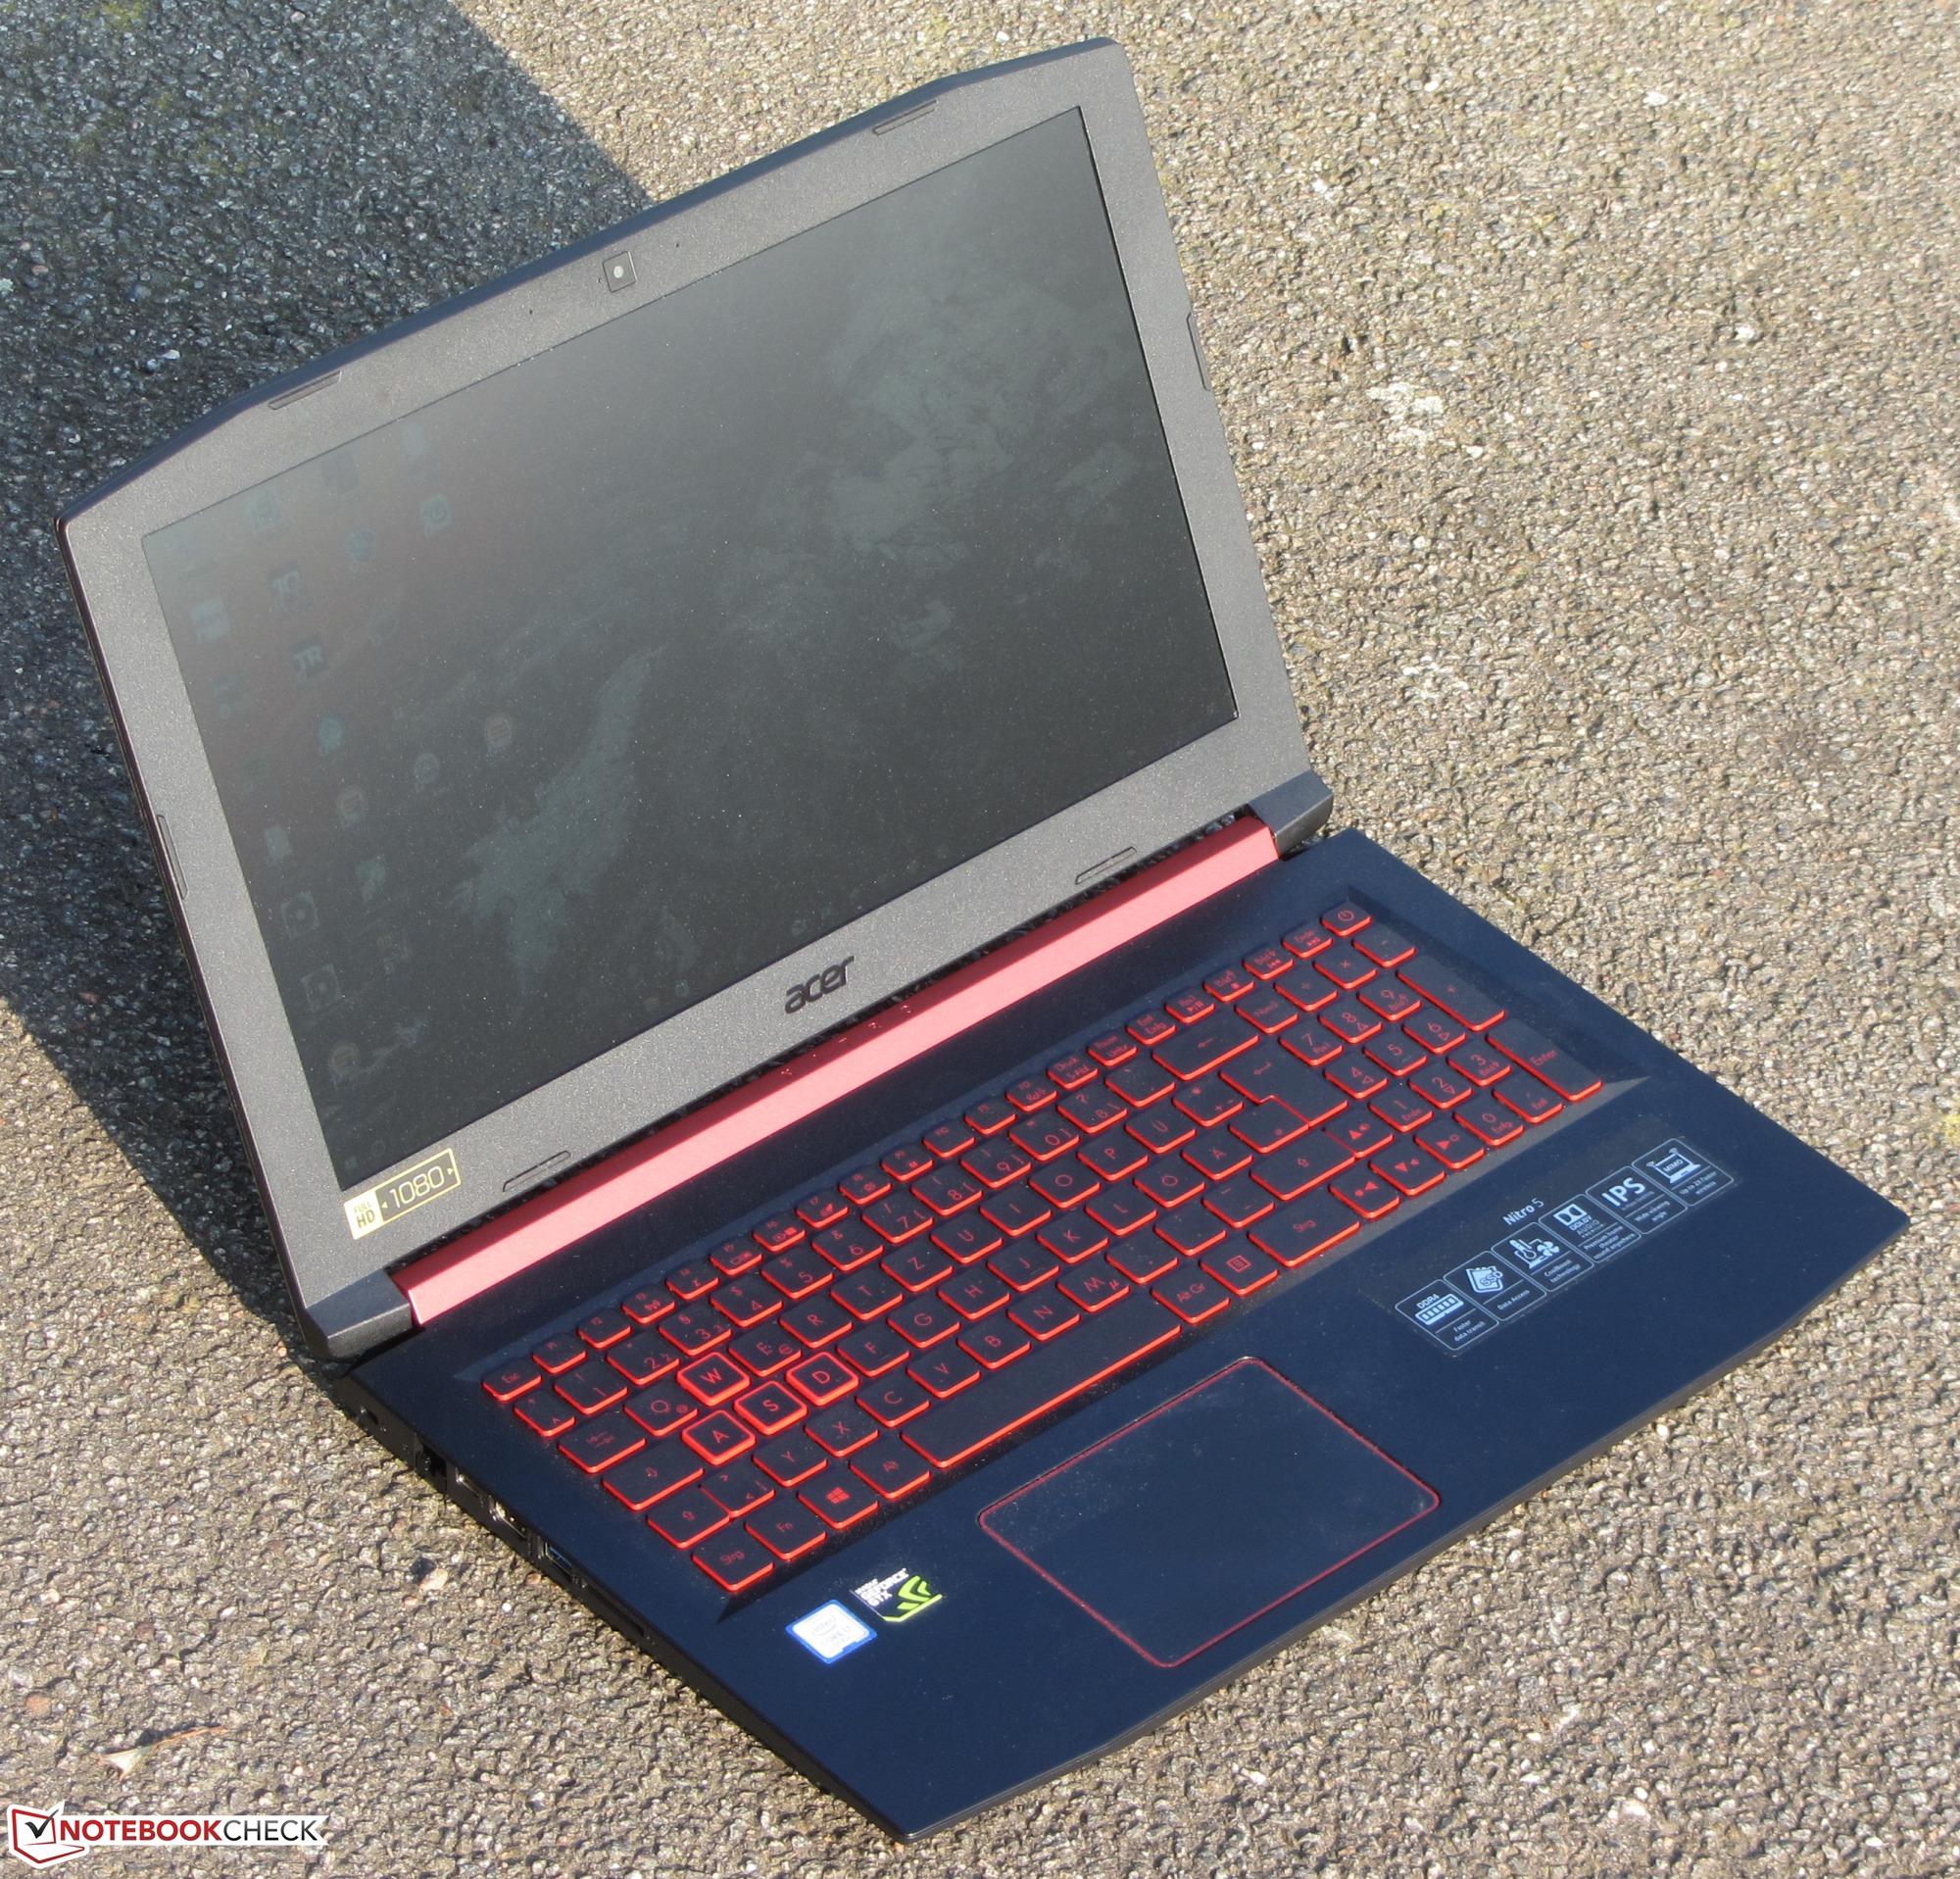
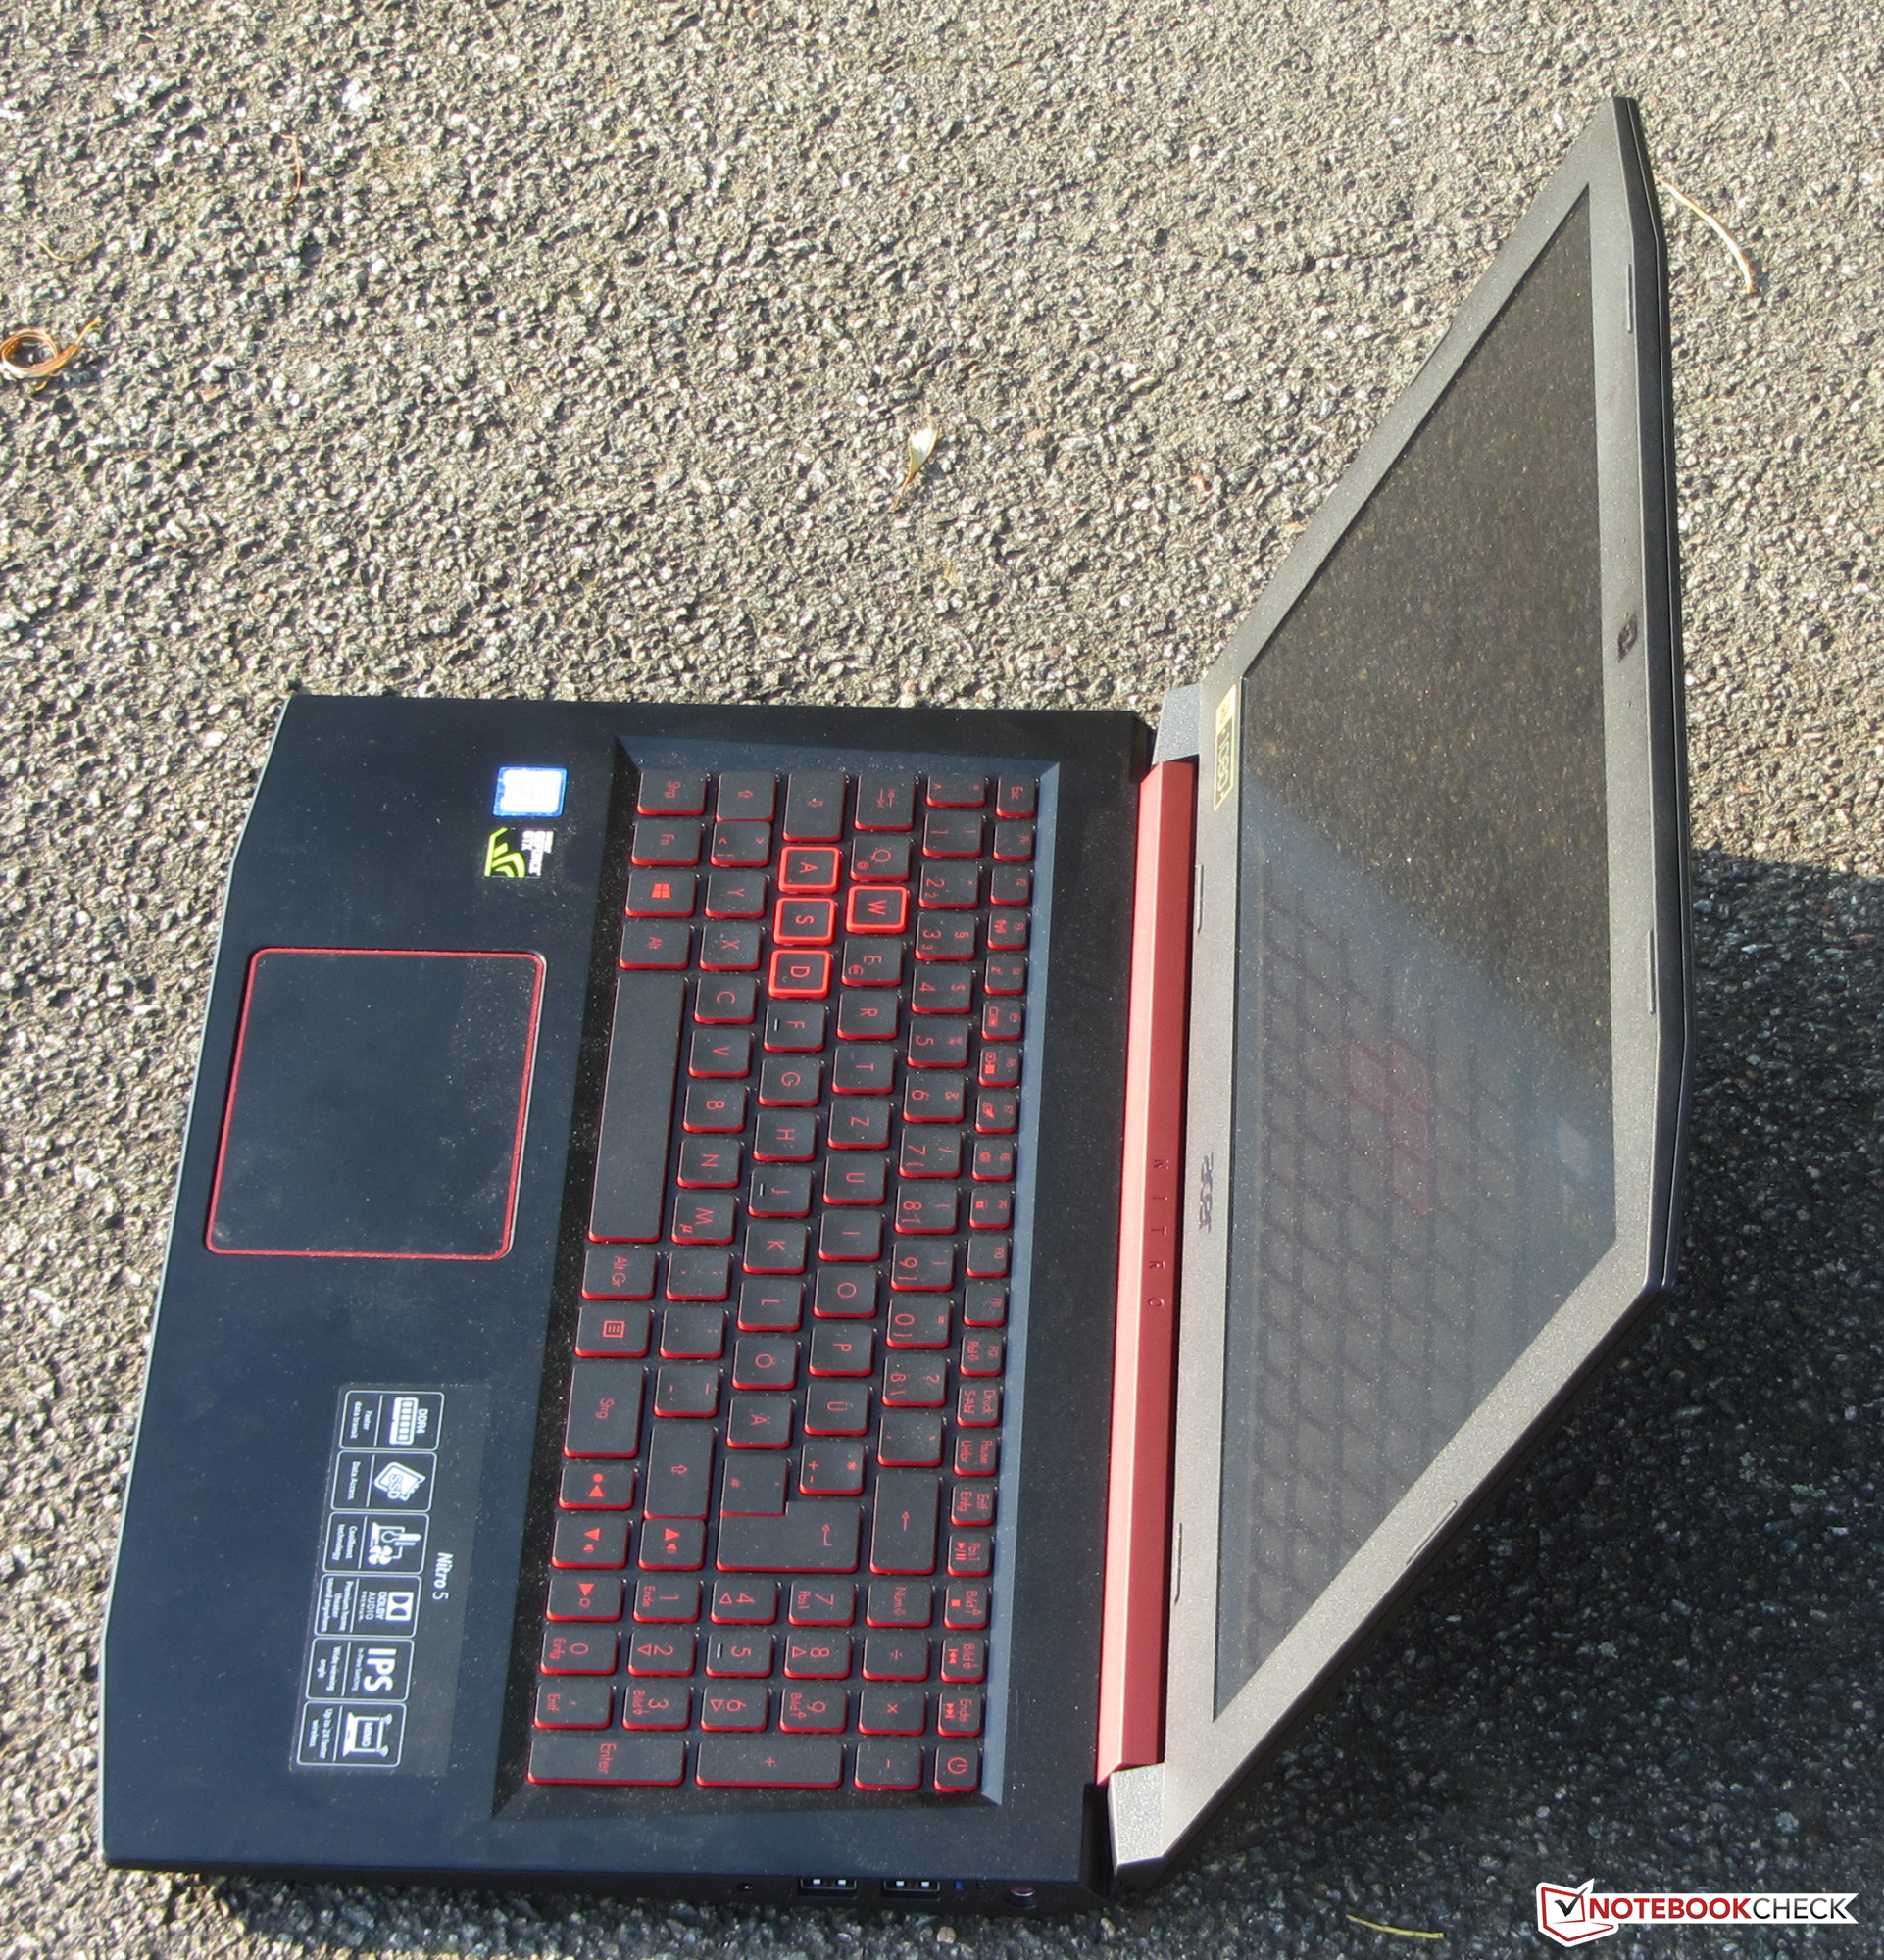
Mas o aparelho também faz um bom trabalho em áreas de uso geral (escritório, internet). Dificilmente faz ruído sob baixa carga baixa e modo inativo, e dificilmente esquenta, mesmo sob uso intenso. Além disso, o dispositivo possui um teclado retro iluminado que é adequado para a digitação regular e bons tempos de duração da bateria. O SSD rápido garante um sistema rápido que pode depender do armazenamento fornecido por um disco rígido de 2,5 polegadas.
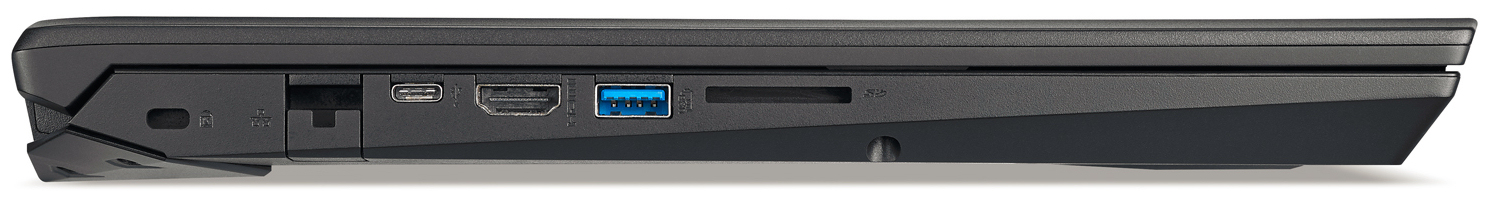
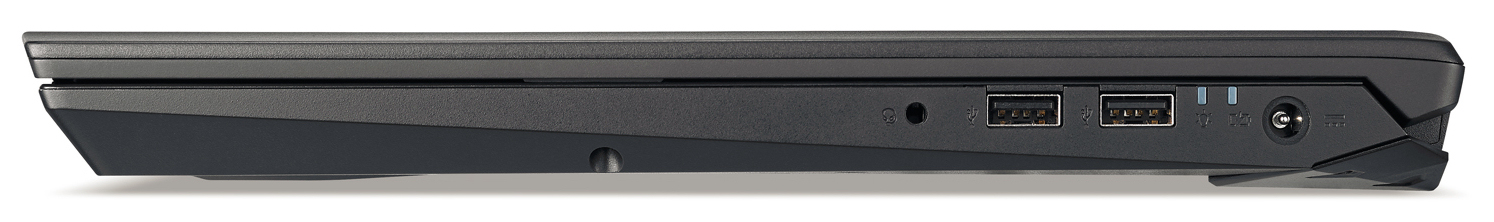
A tela IPS mate tem ângulos de visão estáveis e bom contraste. No entanto, o brilho poderia ser melhor. Também acreditamos que o fabricante poderia ter feito melhor na área de conectividade. Por um preço de $1.080, deveria incluir uma porta Thunderbolt 3 e DisplayPort. O ruído alto da ventoinha de resfriamento sob uso intenso também poderia ser melhorado.
Acer Nitro 5 AN515-51-788E
- 08/07/2018 v6 (old)
Sascha Mölck