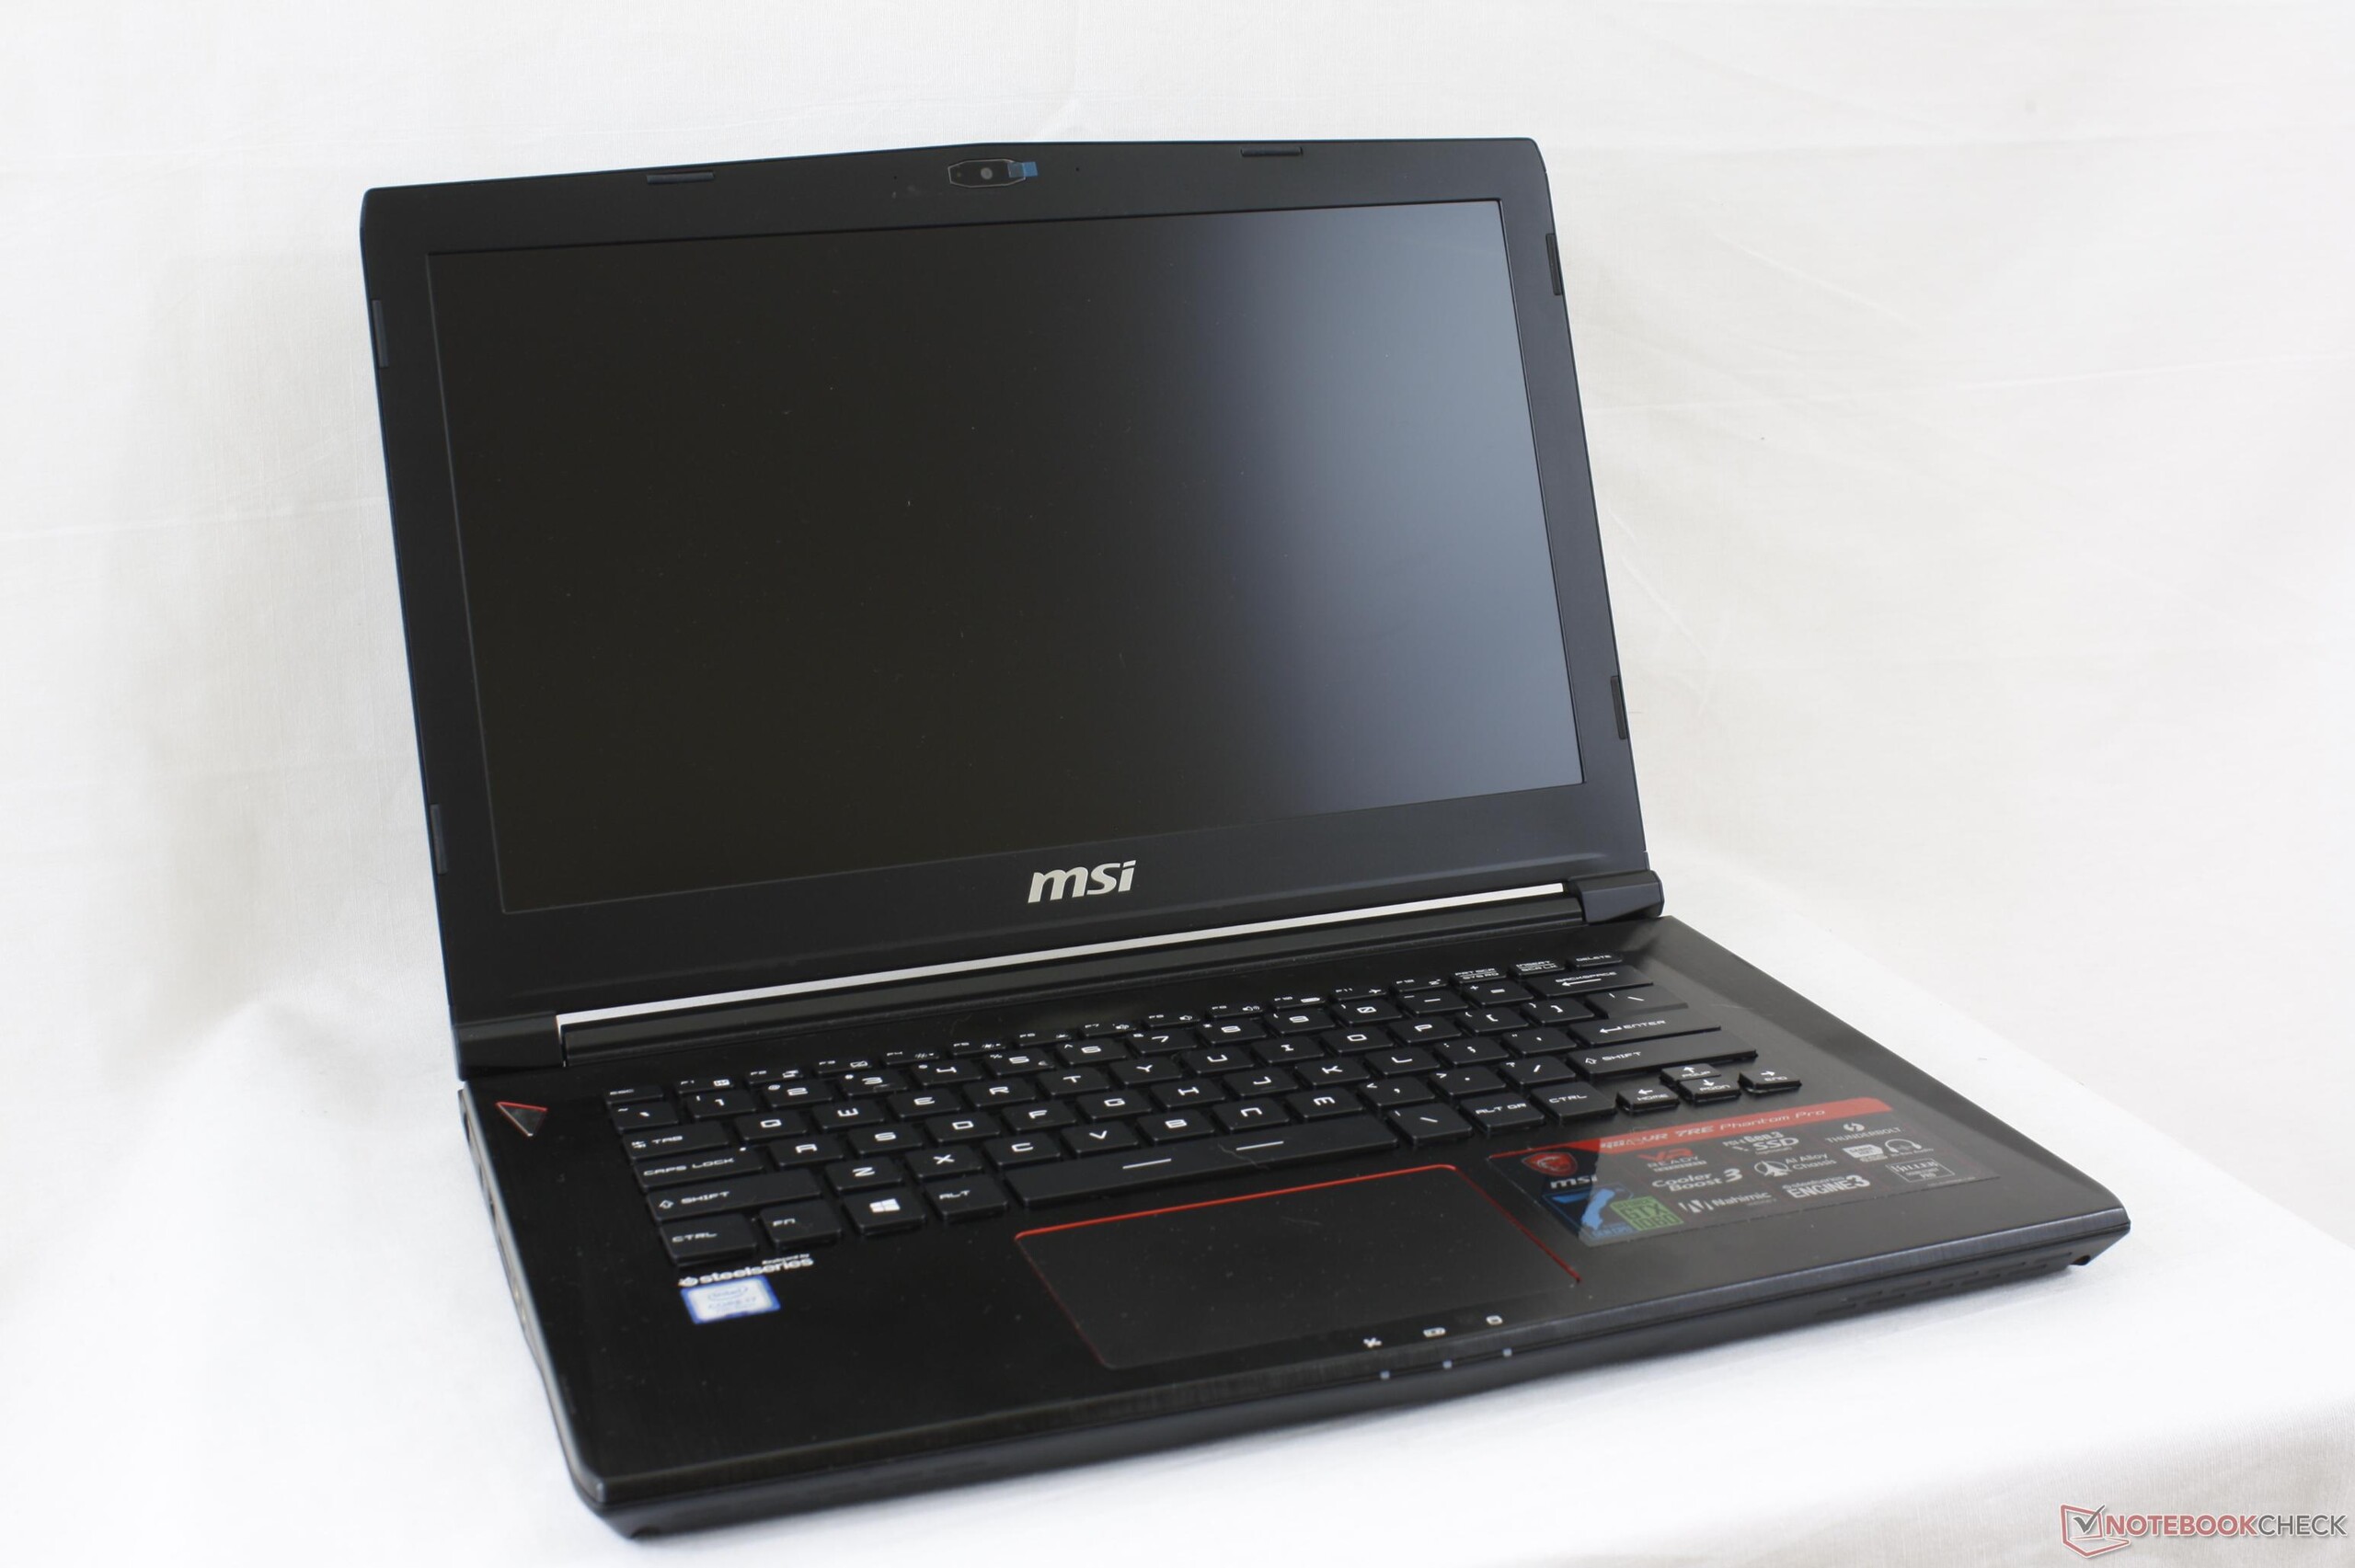
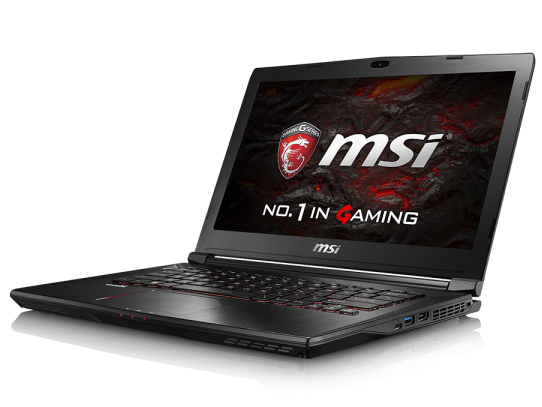
Breve Análise do Portátil MSI GS43VR 7RE (i7-7700HQ, GTX 1060)
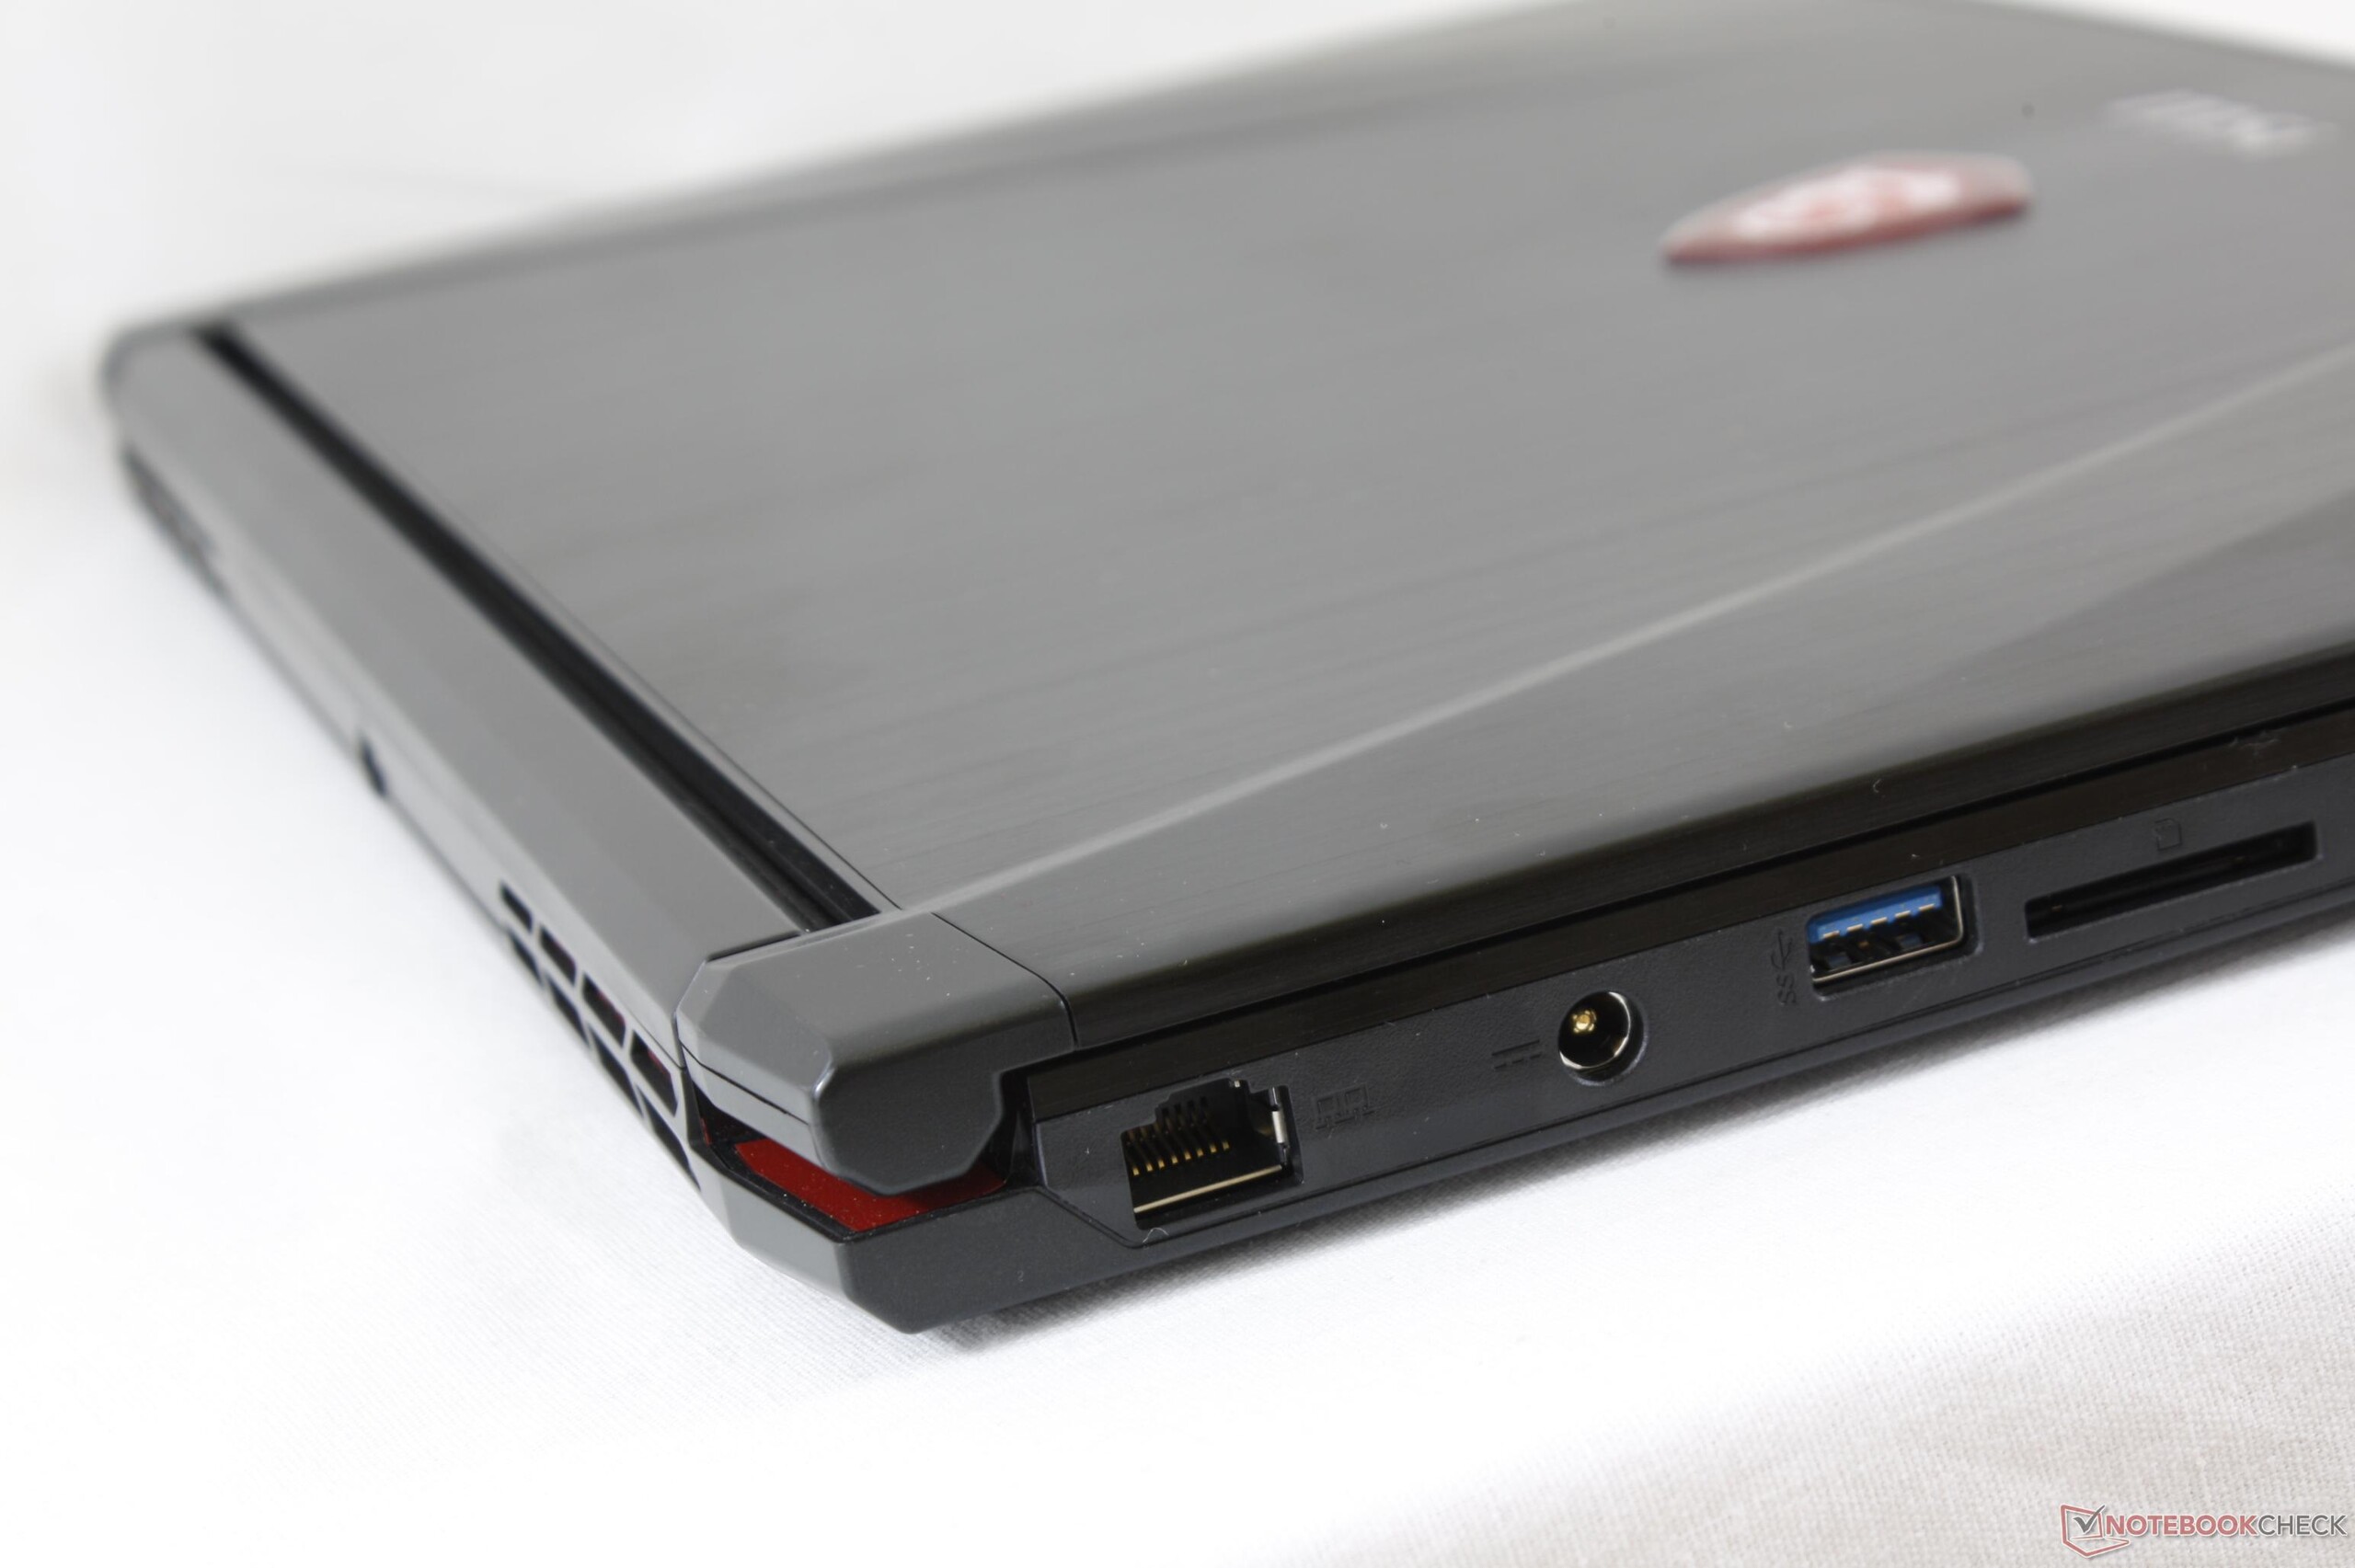
| SD Card Reader | |
| average JPG Copy Test (av. of 3 runs) | |
| Dell XPS 15 9560 (i7-7700HQ, UHD) | |
| Eurocom Sky MX5 R3 | |
| MSI GS63VR 7RF-228US | |
| MSI GS43VR 7RE-069US | |
| maximum AS SSD Seq Read Test (1GB) | |
| Dell XPS 15 9560 (i7-7700HQ, UHD) | |
| Eurocom Sky MX5 R3 | |
| MSI GS63VR 7RF-228US | |
| MSI GS43VR 7RE-069US | |
| Networking | |
| iperf3 transmit AX12 | |
| MSI GS63VR 7RF-228US | |
| MSI GS43VR 7RE-069US | |
| Razer Blade (2016) FHD | |
| iperf3 receive AX12 | |
| MSI GS63VR 7RF-228US | |
| MSI GS43VR 7RE-069US | |
| Razer Blade (2016) FHD | |
| |||||||||||||||||||||||||
iluminação: 86 %
iluminação com acumulador: 306.6 cd/m²
Contraste: 1095:1 (Preto: 0.28 cd/m²)
ΔE ColorChecker Calman: 3.9 | ∀{0.5-29.43 Ø4.71}
ΔE Greyscale Calman: 2 | ∀{0.09-98 Ø4.96}
86.1% sRGB (Argyll 1.6.3 3D)
56.1% AdobeRGB 1998 (Argyll 1.6.3 3D)
62.8% AdobeRGB 1998 (Argyll 3D)
85.9% sRGB (Argyll 3D)
66.3% Display P3 (Argyll 3D)
Gamma: 2.14
CCT: 6626 K
| MSI GS43VR 7RE-069US ID: LGD046D, Name: LG Philips LP140WF3-SPD1, IPS, 14", 1920x1080 | MSI GS43VR 6RE-006US Name: LG Philips LP140WF3-SPD1, ID: LGD046D, IPS, 14", 1920x1080 | Razer Blade (2016) FHD LG Philips LP140WF3-SPD1 (LGD046D), IPS, 14", 1920x1080 | Aorus x3 Plus v7 Sharp SHP1401, IGZO TFT, 13.9", 3200x1800 | Apple MacBook Pro 15 2016 (2.6 GHz, 450) IPS, 15.4", 2880x1800 | Asus Zephyrus GX501 AUO B156HAN04.2 (AUO42ED), IPS, 15.6", 1920x1080 | |
|---|---|---|---|---|---|---|
| Display | 0% | -3% | 6% | 3% | ||
| Display P3 Coverage (%) | 66.3 | 65.5 -1% | 65.2 -2% | 66.1 0% | 64.8 -2% | |
| sRGB Coverage (%) | 85.9 | 86.4 1% | 83.4 -3% | 96.5 12% | 91.8 7% | |
| AdobeRGB 1998 Coverage (%) | 62.8 | 63.1 0% | 60.9 -3% | 67.5 7% | 65.9 5% | |
| Response Times | -14% | -42% | -24% | -57% | -27% | |
| Response Time Grey 50% / Grey 80% * (ms) | 31.6 ? | 31.6 ? -0% | 47 ? -49% | 38 ? -20% | 47.3 ? -50% | 40.4 ? -28% |
| Response Time Black / White * (ms) | 19.2 ? | 24.4 ? -27% | 26 ? -35% | 24.4 ? -27% | 31.2 ? -63% | 24 ? -25% |
| PWM Frequency (Hz) | 21190 ? | 201.6 ? | 117000 ? | |||
| Screen | 3% | -15% | 12% | 37% | -23% | |
| Brightness middle (cd/m²) | 306.6 | 288.4 -6% | 272 -11% | 348 14% | 483 58% | 328 7% |
| Brightness (cd/m²) | 291 | 282 -3% | 277 -5% | 359 23% | 465 60% | 305 5% |
| Brightness Distribution (%) | 86 | 83 -3% | 84 -2% | 73 -15% | 92 7% | 83 -3% |
| Black Level * (cd/m²) | 0.28 | 0.35 -25% | 0.26 7% | 0.29 -4% | 0.33 -18% | 0.25 11% |
| Contrast (:1) | 1095 | 824 -25% | 1046 -4% | 1200 10% | 1464 34% | 1312 20% |
| Colorchecker dE 2000 * | 3.9 | 2.61 33% | 4.59 -18% | 2.4 38% | 1.4 64% | 6.02 -54% |
| Colorchecker dE 2000 max. * | 9 | 7.34 18% | 8.49 6% | 5.1 43% | 3 67% | 10.14 -13% |
| Greyscale dE 2000 * | 2 | 1.18 41% | 4.28 -114% | 2.3 -15% | 1.5 25% | 6.32 -216% |
| Gamma | 2.14 103% | 2.24 98% | 2.23 99% | 2.21 100% | 2.34 94% | 2.28 96% |
| CCT | 6626 98% | 6506 100% | 6848 95% | 6206 105% | 6650 98% | 8194 79% |
| Color Space (Percent of AdobeRGB 1998) (%) | 56.1 | 56.4 1% | 55 -2% | 62 11% | 60 7% | |
| Color Space (Percent of sRGB) (%) | 86.1 | 86.4 0% | 83 -4% | 96 11% | 92 7% | |
| Média Total (Programa/Configurações) | -4% /
0% | -20% /
-16% | -2% /
6% | -10% /
18% | -16% /
-18% |
* ... menor é melhor
Exibir tempos de resposta
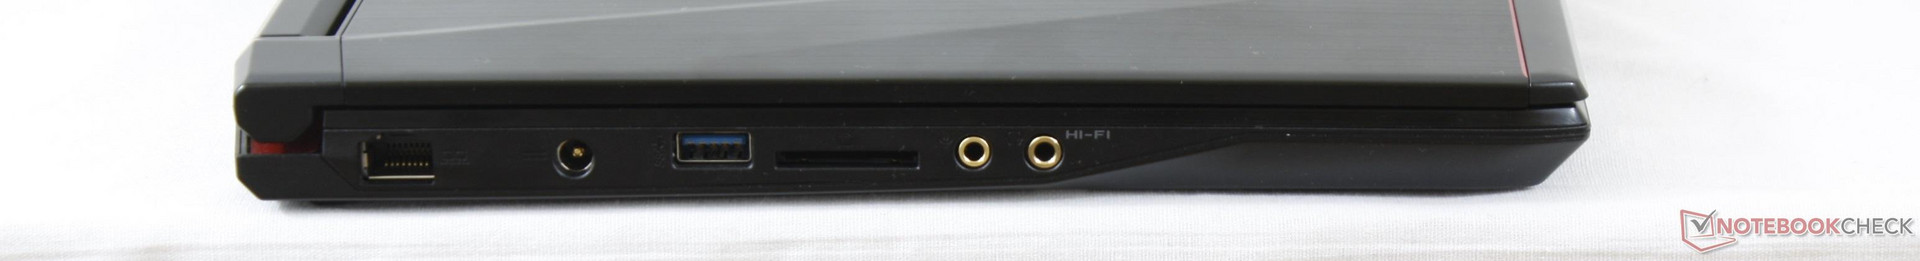
| ↔ Tempo de resposta preto para branco | ||
|---|---|---|
| 19.2 ms ... ascensão ↗ e queda ↘ combinadas | ↗ 10 ms ascensão | 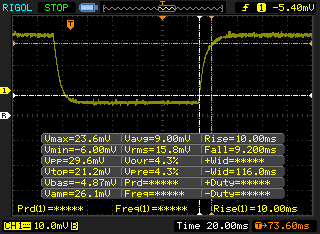 |
| ↘ 9.2 ms queda | ||
| A tela mostra boas taxas de resposta em nossos testes, mas pode ser muito lenta para jogadores competitivos. Em comparação, todos os dispositivos testados variam de 0.1 (mínimo) a 240 (máximo) ms. » 43 % de todos os dispositivos são melhores. Isso significa que o tempo de resposta medido é semelhante à média de todos os dispositivos testados (19.8 ms). | ||
| ↔ Tempo de resposta 50% cinza a 80% cinza | ||
| 31.6 ms ... ascensão ↗ e queda ↘ combinadas | ↗ 15.6 ms ascensão | 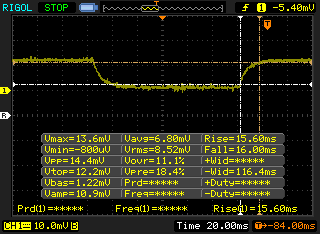 |
| ↘ 16 ms queda | ||
| A tela mostra taxas de resposta lentas em nossos testes e será insatisfatória para os jogadores. Em comparação, todos os dispositivos testados variam de 0.165 (mínimo) a 636 (máximo) ms. » 43 % de todos os dispositivos são melhores. Isso significa que o tempo de resposta medido é semelhante à média de todos os dispositivos testados (31 ms). | ||
Cintilação da tela / PWM (modulação por largura de pulso)
| Tela tremeluzindo/PWM detectado | 21190 Hz | ≤ 99 % configuração de brilho |  |
A luz de fundo da tela pisca em 21190 Hz (pior caso, por exemplo, utilizando PWM) Cintilação detectada em uma configuração de brilho de 99 % e abaixo. Não deve haver cintilação ou PWM acima desta configuração de brilho. A frequência de 21190 Hz é bastante alta, então a maioria dos usuários sensíveis ao PWM não deve notar nenhuma oscilação. [pwm_comparison] Em comparação: 52 % de todos os dispositivos testados não usam PWM para escurecer a tela. Se PWM foi detectado, uma média de 7757 (mínimo: 5 - máximo: 343500) Hz foi medida. | |||
| Cinebench R10 | |
| Rendering Multiple CPUs 32Bit | |
| Eurocom Tornado F5 | |
| Dell Precision 3520 | |
| MSI GS43VR 7RE-069US | |
| EVGA SC15 | |
| MSI GS43VR 6RE-006US | |
| MSI GP62-2QEi781FD | |
| Eurocom Shark 4 | |
| Lenovo IdeaPad Y50 | |
| Rendering Single 32Bit | |
| Eurocom Tornado F5 | |
| EVGA SC15 | |
| MSI GS43VR 7RE-069US | |
| Dell Precision 3520 | |
| MSI GP62-2QEi781FD | |
| Eurocom Shark 4 | |
| Lenovo IdeaPad Y50 | |
| MSI GS43VR 6RE-006US | |
| wPrime 2.10 - 1024m | |
| Lenovo IdeaPad Y50 | |
| Eurocom Shark 4 | |
| MSI GS43VR 6RE-006US | |
| MSI GS43VR 7RE-069US | |
| EVGA SC15 | |
| MSI GP62-2QEi781FD | |
| Eurocom Tornado F5 | |
* ... menor é melhor
| PCMark 8 | |
| Home Score Accelerated v2 | |
| Eurocom Tornado F5 | |
| EVGA SC15 | |
| MSI GS43VR 7RE-069US | |
| Lenovo IdeaPad Y50 | |
| Work Score Accelerated v2 | |
| Eurocom Tornado F5 | |
| EVGA SC15 | |
| MSI GS43VR 7RE-069US | |
| Lenovo IdeaPad Y50 | |
| Creative Score Accelerated v2 | |
| Eurocom Tornado F5 | |
| EVGA SC15 | |
| MSI GS43VR 7RE-069US | |
| Lenovo IdeaPad Y50 | |
| PCMark 8 Home Score Accelerated v2 | 3918 pontos | |
| PCMark 8 Creative Score Accelerated v2 | 5250 pontos | |
| PCMark 8 Work Score Accelerated v2 | 4672 pontos | |
| PCMark 10 Score | 4807 pontos | |
Ajuda | ||
| MSI GS43VR 7RE-069US SK Hynix HFS128G39MNC-3510A | MSI GS63VR 7RF-228US Samsung SM961 MZVKW512HMJP m.2 PCI-e | Razer Blade (2016) FHD | Gigabyte Aero 14 GA-K106Q416-PL-B02 Liteonit CV3-8D256 | Aorus x3 Plus v7 Toshiba NVMe THNSN5512GPU7 | |
|---|---|---|---|---|---|
| AS SSD | 204% | 209% | -11% | 118% | |
| Copy Game MB/s (MB/s) | 332.1 | 1082 226% | 1014 205% | ||
| Copy Program MB/s (MB/s) | 225.4 | 401.9 78% | 399.4 77% | ||
| Copy ISO MB/s (MB/s) | 382.1 | 1666 336% | 1459 282% | ||
| Score Total (Points) | 1126 | 3756 234% | 4067 261% | 917 -19% | 2570 128% |
| Score Write (Points) | 435 | 1468 237% | 1522 250% | 298 -31% | 933 114% |
| Score Read (Points) | 455 | 1549 240% | 1710 276% | 411 -10% | 1112 144% |
| Access Time Write * (ms) | 0.115 | 0.029 75% | 0.032 72% | 0.074 36% | 0.05 57% |
| Access Time Read * (ms) | 0.106 | 0.041 61% | 0.036 66% | 0.089 16% | 0.11 -4% |
| 4K-64 Write (MB/s) | 312.5 | 1185 279% | 1234 295% | 218.9 -30% | 692 121% |
| 4K-64 Read (MB/s) | 373.9 | 1229 229% | 1403 275% | 333 -11% | 857 129% |
| 4K Write (MB/s) | 86.2 | 127.6 48% | 116.6 35% | 50 -42% | 128.6 49% |
| 4K Read (MB/s) | 30.35 | 48.01 58% | 47.65 57% | 26.32 -13% | 41.4 36% |
| Seq Write (MB/s) | 366.6 | 1550 323% | 1715 368% | 291.4 -21% | 1117 205% |
| Seq Read (MB/s) | 509 | 2719 434% | 2594 410% | 517 2% | 2131 319% |
* ... menor é melhor

| 3DMark | |
| 1920x1080 Fire Strike Graphics | |
| Eurocom Sky MX5 R3 | |
| Asus Zephyrus GX501 | |
| Asus G701VO-CS74K | |
| Nvidia GeForce GTX 1060 Founders Edition 6 GB | |
| MSI GS43VR 7RE-069US | |
| EVGA SC15 | |
| HP Omen 15-ce002ng | |
| EVGA SC17 | |
| MSI GP62 7REX-1045US | |
| Asus Strix GL502VT-DS74 | |
| Fire Strike Extreme Graphics | |
| Eurocom Sky MX5 R3 | |
| Asus G701VO-CS74K | |
| MSI GS43VR 7RE-069US | |
| EVGA SC15 | |
| EVGA SC17 | |
| MSI GP62 7REX-1045US | |
| Asus Strix GL502VT-DS74 | |
| 3840x2160 Fire Strike Ultra Graphics | |
| Eurocom Sky MX5 R3 | |
| Asus Zephyrus GX501 | |
| Asus G701VO-CS74K | |
| Nvidia GeForce GTX 1060 Founders Edition 6 GB | |
| MSI GS43VR 7RE-069US | |
| EVGA SC15 | |
| EVGA SC17 | |
| MSI GP62 7REX-1045US | |
| 3DMark 11 | |
| 1280x720 Performance GPU | |
| Asus Zephyrus GX501 | |
| Eurocom Sky MX5 R3 | |
| Nvidia GeForce GTX 1060 Founders Edition 6 GB | |
| Asus G701VO-CS74K | |
| EVGA SC15 | |
| MSI GS43VR 7RE-069US | |
| HP Omen 15-ce002ng | |
| EVGA SC17 | |
| Asus Strix GL502VT-DS74 | |
| MSI GP62 7REX-1045US | |
| 1280x720 Performance Combined | |
| Nvidia GeForce GTX 1060 Founders Edition 6 GB | |
| Eurocom Sky MX5 R3 | |
| EVGA SC17 | |
| Asus G701VO-CS74K | |
| Asus Zephyrus GX501 | |
| EVGA SC15 | |
| MSI GS43VR 7RE-069US | |
| HP Omen 15-ce002ng | |
| Asus Strix GL502VT-DS74 | |
| MSI GP62 7REX-1045US | |
| 3DMark 11 Performance | 12917 pontos | |
| 3DMark Ice Storm Standard Score | 85006 pontos | |
| 3DMark Cloud Gate Standard Score | 24792 pontos | |
| 3DMark Fire Strike Score | 10096 pontos | |
| 3DMark Fire Strike Extreme Score | 5293 pontos | |
Ajuda | ||
| Rise of the Tomb Raider - 1920x1080 Very High Preset AA:FX AF:16x | |
| Alienware 17 R4 | |
| Asus Zephyrus GX501 | |
| Eurocom Sky MX5 R3 | |
| MSI GS43VR 7RE-069US | |
| Nvidia GeForce GTX 1060 Founders Edition 6 GB | |
| Nvidia GeForce GTX 1060 Founders Edition 6 GB | |
| MSI GT72VR 6RD-063US | |
| Aorus X5S v5 | |
| Lenovo Legion Y520-15IKBN-80WK001KUS | |
| The Witcher 3 - 1920x1080 Ultra Graphics & Postprocessing (HBAO+) | |
| Alienware 17 R4 | |
| Eurocom Sky MX5 R3 | |
| Asus Zephyrus GX501 | |
| Nvidia GeForce GTX 1060 Founders Edition 6 GB | |
| MSI GS43VR 7RE-069US | |
| Lenovo Legion Y520-15IKBN-80WK001KUS | |
| BioShock Infinite - 1920x1080 Ultra Preset, DX11 (DDOF) | |
| Alienware 17 R4 | |
| Eurocom Sky MX5 R3 | |
| MSI GS43VR 7RE-069US | |
| MSI GT72VR 6RD-063US | |
| Aorus X5S v5 | |
| Lenovo Legion Y520-15IKBN-80WK001KUS | |
| baixo | média | alto | ultra | |
|---|---|---|---|---|
| BioShock Infinite (2013) | 105.6 | |||
| Metro: Last Light (2013) | 80.2 | |||
| Thief (2014) | 77.1 | |||
| The Witcher 3 (2015) | 79 | 41 | ||
| Batman: Arkham Knight (2015) | 88 | 60 | ||
| Metal Gear Solid V (2015) | 60 | |||
| Fallout 4 (2015) | 71.5 | |||
| Rise of the Tomb Raider (2016) | 68.8 | |||
| Ashes of the Singularity (2016) | 58.1 | |||
| Overwatch (2016) | 106 | |||
| Mafia 3 (2016) | 42 | |||
| Prey (2017) | 106.7 |
Barulho
| Ocioso |
| 33 / 34.5 / 35 dB |
| Carga |
| 54.2 / 54.2 dB |
 | ||
30 dB silencioso 40 dB(A) audível 50 dB(A) ruidosamente alto |
||
min: | ||
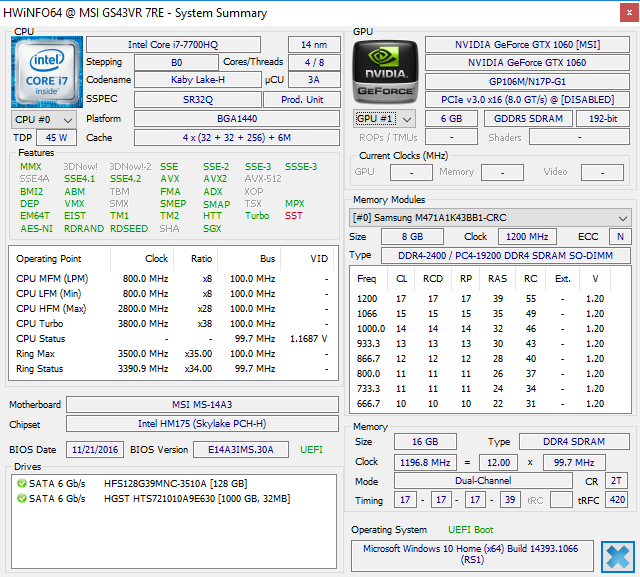
| MSI GS43VR 7RE-069US GeForce GTX 1060 Mobile, i7-7700HQ, SK Hynix HFS128G39MNC-3510A | MSI GS63VR 7RF-228US GeForce GTX 1060 Mobile, i7-7700HQ, Samsung SM961 MZVKW512HMJP m.2 PCI-e | Razer Blade (2016) FHD GeForce GTX 1060 Mobile, 6700HQ | Gigabyte Aero 14 GA-K106Q416-PL-B02 GeForce GTX 1060 Mobile, i7-7700HQ, Liteonit CV3-8D256 | Aorus x3 Plus v7 GeForce GTX 1060 Mobile, i7-7820HK, Toshiba NVMe THNSN5512GPU7 | Apple MacBook Pro 15 2016 (2.6 GHz, 450) Radeon Pro 450, 6700HQ, Apple SSD SM0256L | |
|---|---|---|---|---|---|---|
| Noise | 10% | -2% | 7% | -1% | 12% | |
| desligado / ambiente * (dB) | 28 | 28.8 -3% | 31 -11% | 29.1 -4% | 30.4 -9% | |
| Idle Minimum * (dB) | 33 | 33.1 -0% | 35 -6% | 31.3 5% | 31.4 5% | 30.6 7% |
| Idle Average * (dB) | 34.5 | 33.1 4% | 36 -4% | 31.3 9% | 37 -7% | 30.6 11% |
| Idle Maximum * (dB) | 35 | 34 3% | 37 -6% | 31.3 11% | 40.8 -17% | 30.6 13% |
| Load Average * (dB) | 54.2 | 37.2 31% | 43 21% | 50.3 7% | 50 8% | 34.7 36% |
| Witcher 3 ultra * (dB) | 56.7 | 46.1 19% | 53.6 5% | |||
| Load Maximum * (dB) | 54.2 | 47.1 13% | 57 -5% | 53.4 1% | 53.6 1% | 46.3 15% |
* ... menor é melhor
(-) A temperatura máxima no lado superior é 47.8 °C / 118 F, em comparação com a média de 40.4 °C / 105 F , variando de 21.2 a 68.8 °C para a classe Gaming.
(-) A parte inferior aquece até um máximo de 63.2 °C / 146 F, em comparação com a média de 43.2 °C / 110 F
(+) Em uso inativo, a temperatura média para o lado superior é 28.6 °C / 83 F, em comparação com a média do dispositivo de 33.9 °C / ### class_avg_f### F.
(±) Jogando The Witcher 3, a temperatura média para o lado superior é 36.4 °C / 98 F, em comparação com a média do dispositivo de 33.9 °C / ## #class_avg_f### F.
(+) Os apoios para as mãos e o touchpad estão atingindo a temperatura máxima da pele (32 °C / 89.6 F) e, portanto, não estão quentes.
(-) A temperatura média da área do apoio para as mãos de dispositivos semelhantes foi 28.8 °C / 83.8 F (-3.2 °C / -5.8 F).
MSI GS43VR 7RE-069US análise de áudio
(±) | o volume do alto-falante é médio, mas bom (###valor### dB)
Graves 100 - 315Hz
(-) | quase nenhum baixo - em média 21.9% menor que a mediana
(±) | a linearidade dos graves é média (7.2% delta para a frequência anterior)
Médios 400 - 2.000 Hz
(+) | médios equilibrados - apenas 3.5% longe da mediana
(±) | a linearidade dos médios é média (7.6% delta para frequência anterior)
Altos 2 - 16 kHz
(±) | máximos mais altos - em média 5.7% maior que a mediana
(±) | a linearidade dos máximos é média (11% delta para frequência anterior)
Geral 100 - 16.000 Hz
(±) | a linearidade do som geral é média (27.5% diferença em relação à mediana)
Comparado com a mesma classe
» 93% de todos os dispositivos testados nesta classe foram melhores, 1% semelhantes, 5% piores
» O melhor teve um delta de 6%, a média foi 18%, o pior foi 132%
Comparado com todos os dispositivos testados
» 84% de todos os dispositivos testados foram melhores, 3% semelhantes, 13% piores
» O melhor teve um delta de 4%, a média foi 23%, o pior foi 134%
Apple MacBook 12 (Early 2016) 1.1 GHz análise de áudio
(+) | os alto-falantes podem tocar relativamente alto (###valor### dB)
Graves 100 - 315Hz
(±) | graves reduzidos - em média 11.3% menor que a mediana
(±) | a linearidade dos graves é média (14.2% delta para a frequência anterior)
Médios 400 - 2.000 Hz
(+) | médios equilibrados - apenas 2.4% longe da mediana
(+) | médios são lineares (5.5% delta para frequência anterior)
Altos 2 - 16 kHz
(+) | agudos equilibrados - apenas 2% longe da mediana
(+) | os máximos são lineares (4.5% delta da frequência anterior)
Geral 100 - 16.000 Hz
(+) | o som geral é linear (10.2% diferença em relação à mediana)
Comparado com a mesma classe
» 7% de todos os dispositivos testados nesta classe foram melhores, 2% semelhantes, 90% piores
» O melhor teve um delta de 5%, a média foi 18%, o pior foi 53%
Comparado com todos os dispositivos testados
» 5% de todos os dispositivos testados foram melhores, 1% semelhantes, 94% piores
» O melhor teve um delta de 4%, a média foi 23%, o pior foi 134%
| desligado | |
| Ocioso | |
| Carga |
|
Key:
min: | |
| MSI GS43VR 7RE-069US i7-7700HQ, GeForce GTX 1060 Mobile, SK Hynix HFS128G39MNC-3510A, IPS, 1920x1080, 14" | Alienware 13 R3 i7-7700HQ, GeForce GTX 1060 Mobile, Toshiba NVMe THNSN5256GPUK, OLED, 2560x1440, 13.3" | Razer Blade (2016) FHD 6700HQ, GeForce GTX 1060 Mobile, , IPS, 1920x1080, 14" | Gigabyte Aero 14 GA-K106Q416-PL-B02 i7-7700HQ, GeForce GTX 1060 Mobile, Liteonit CV3-8D256, , 2560x1440, 14" | Aorus x3 Plus v7 i7-7820HK, GeForce GTX 1060 Mobile, Toshiba NVMe THNSN5512GPU7, IGZO TFT, 3200x1800, 13.9" | Apple MacBook Pro 15 2016 (2.6 GHz, 450) 6700HQ, Radeon Pro 450, Apple SSD SM0256L, IPS, 2880x1800, 15.4" | |
|---|---|---|---|---|---|---|
| Power Consumption | -6% | -33% | -44% | -33% | 32% | |
| Idle Minimum * (Watt) | 9.1 | 7 23% | 14 -54% | 12 -32% | 15.1 -66% | 2.9 68% |
| Idle Average * (Watt) | 11.9 | 12 -1% | 18 -51% | 18.1 -52% | 15.8 -33% | 9.7 18% |
| Idle Maximum * (Watt) | 12.2 | 18 -48% | 21 -72% | 21.3 -75% | 16.7 -37% | 10.1 17% |
| Load Average * (Watt) | 77 | 76 1% | 70 9% | 127.2 -65% | 110.9 -44% | 65 16% |
| Witcher 3 ultra * (Watt) | 126.4 | 135 -7% | ||||
| Load Maximum * (Watt) | 153 | 161 -5% | 146 5% | 149.4 2% | 170.4 -11% | 89.5 42% |
* ... menor é melhor
| MSI GS43VR 7RE-069US i7-7700HQ, GeForce GTX 1060 Mobile, 61 Wh | MSI GS63VR 7RF-228US i7-7700HQ, GeForce GTX 1060 Mobile, 65 Wh | Razer Blade (2016) FHD 6700HQ, GeForce GTX 1060 Mobile, 70 Wh | Gigabyte Aero 14 GA-K106Q416-PL-B02 i7-7700HQ, GeForce GTX 1060 Mobile, 94.24 Wh | Aorus x3 Plus v7 i7-7820HK, GeForce GTX 1060 Mobile, 74 Wh | Apple MacBook Pro 15 2016 (2.6 GHz, 450) 6700HQ, Radeon Pro 450, 76 Wh | |
|---|---|---|---|---|---|---|
| Duração da bateria | 2% | 54% | -13% | 30% | 107% | |
| Reader / Idle (h) | 9 | 6.4 -29% | 12.7 41% | 7.8 -13% | 8 -11% | |
| WiFi v1.3 (h) | 2.9 | 3.9 34% | 7.1 145% | 4.9 69% | 10 245% | |
| Load (h) | 1.3 | 1.3 0% | 1 -23% | 1.7 31% | 0.9 -31% | |
| WiFi (h) | 5.2 |
Pro
Contra
O GS43VR 7RE dificilmente pode ser considerado uma atualização sobre o GS43VR 6RE. O desempenho da CPU é um pouco melhor, mas o potencial do Turbo Boost ainda é afogado e, portanto, os usuários não podem nem aproveitar ao máximo a atualização Kaby Lake. Dado que a experiência principal continua a ser a mesma, a parte mais importante deste lançamento do Kaby Lake GS43VR é que o mais antigo Skylake GS43VR será mais barato.
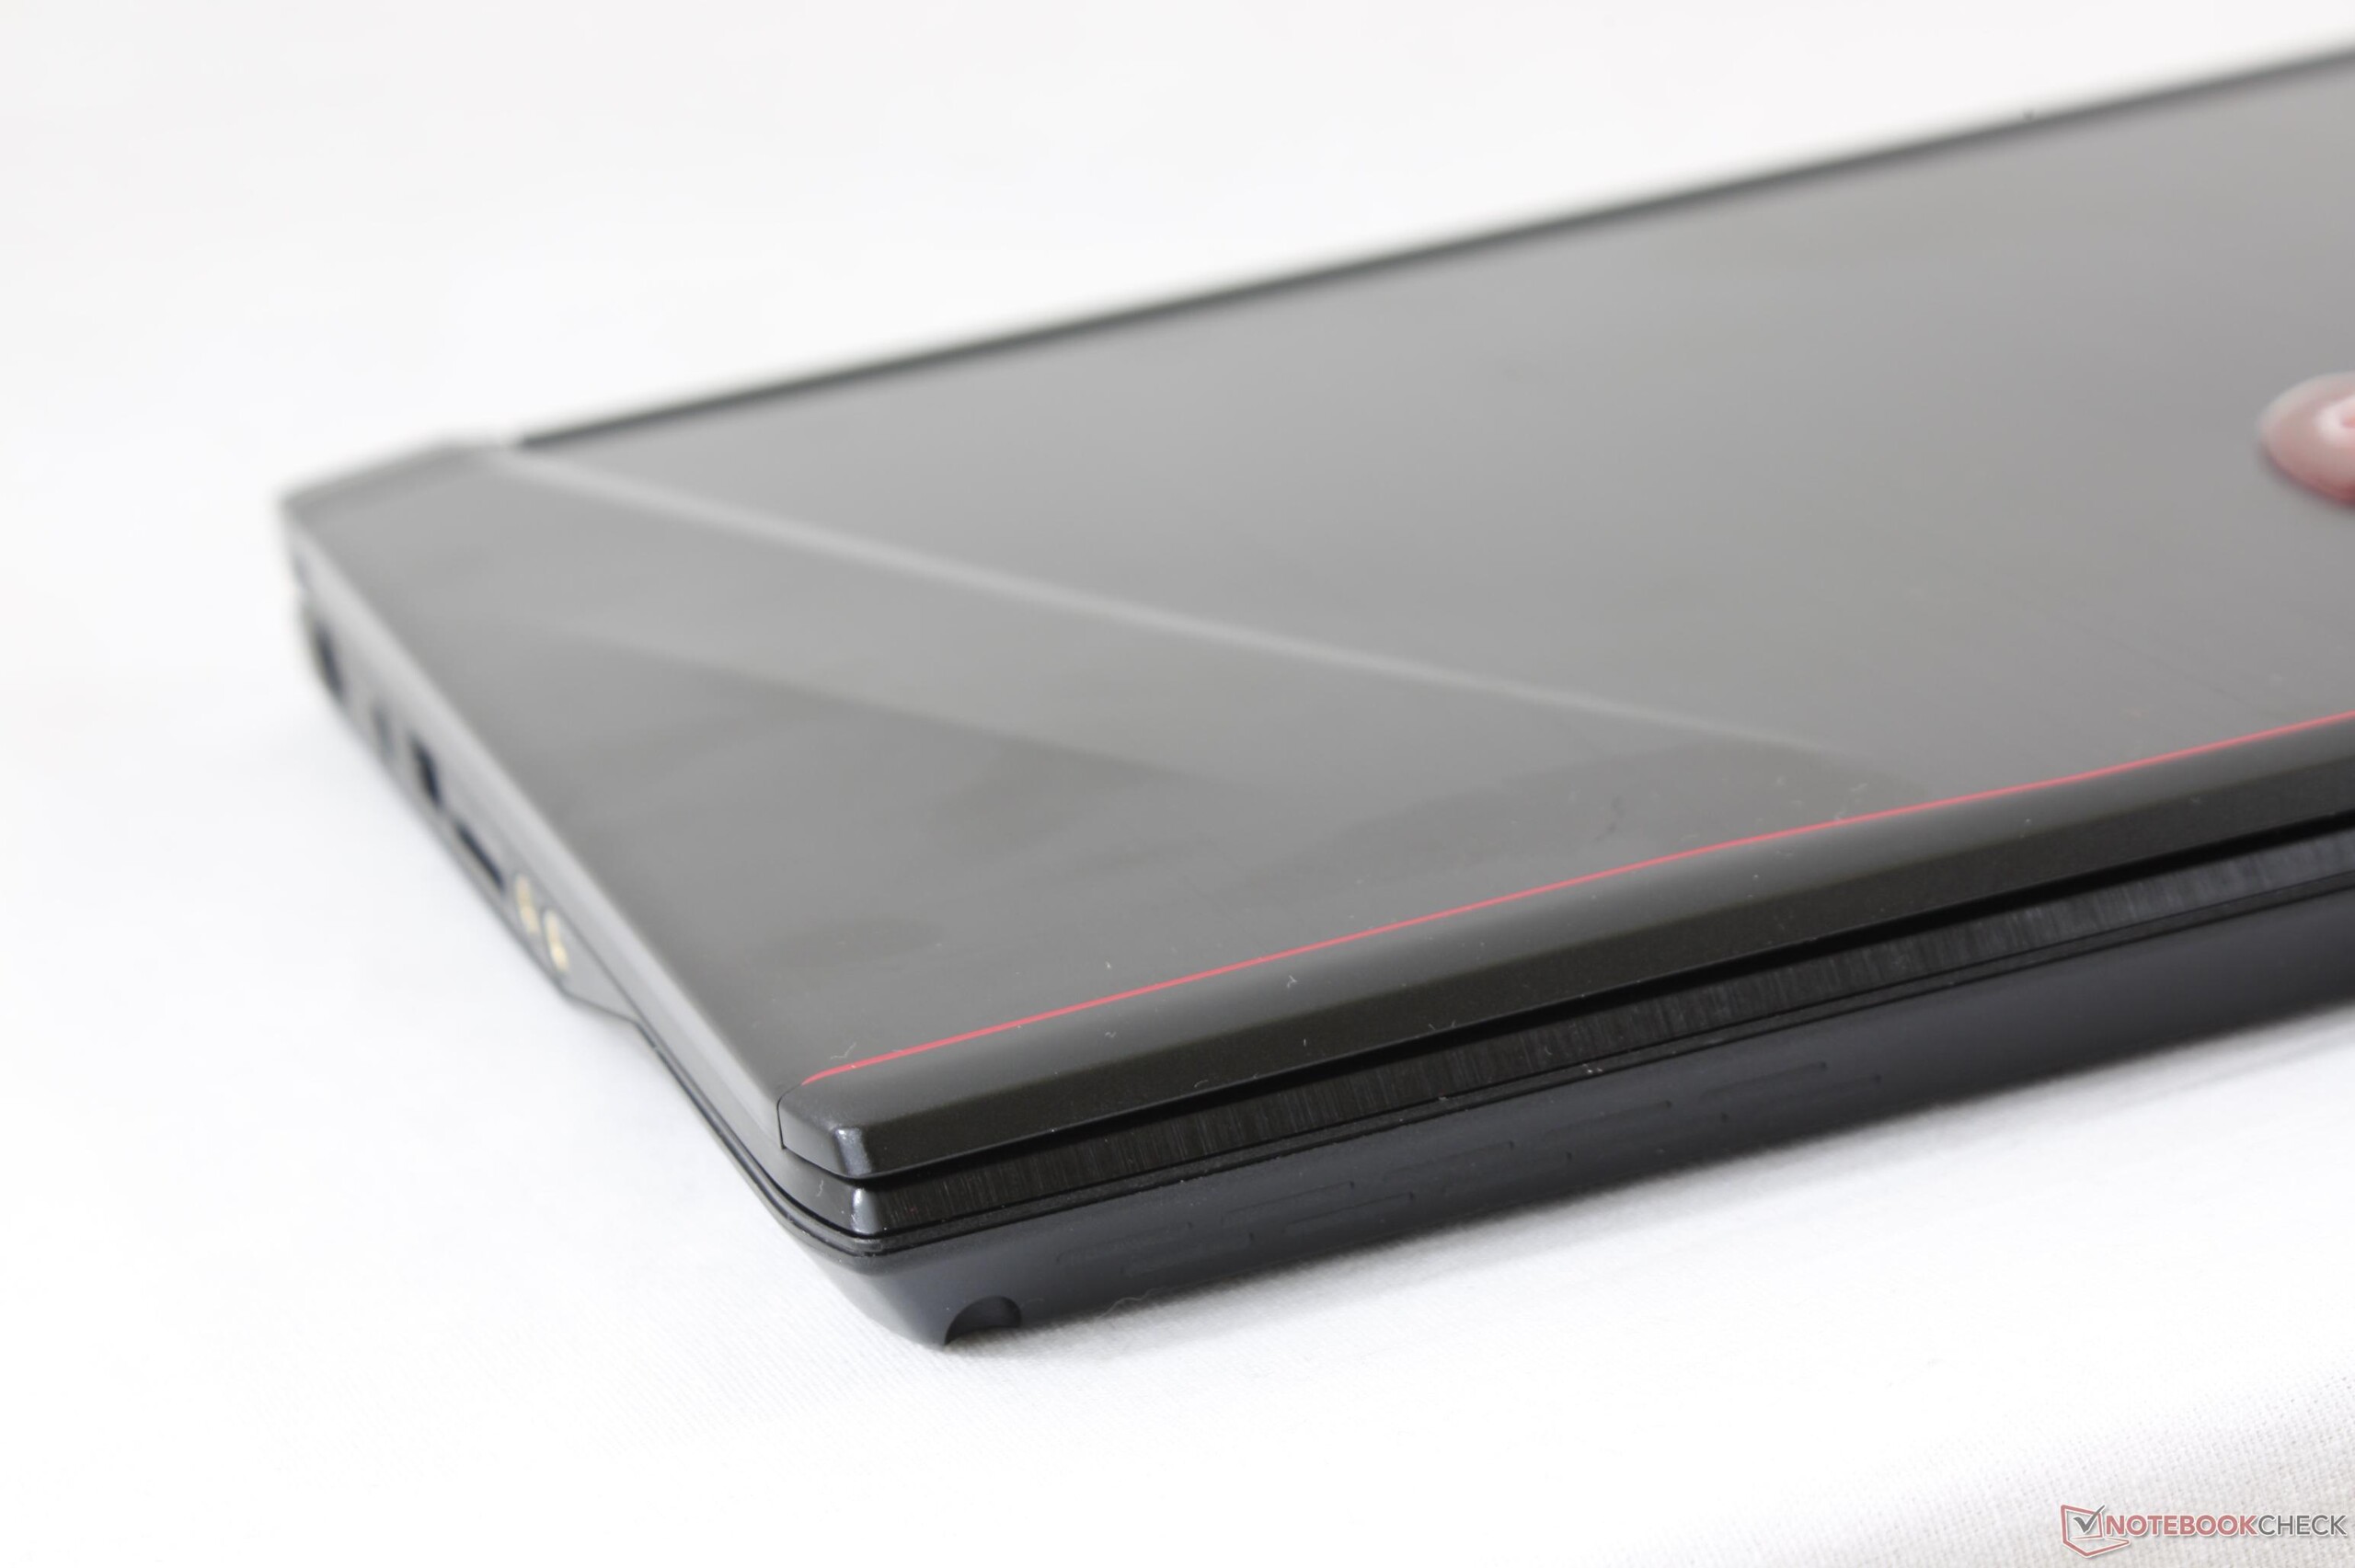
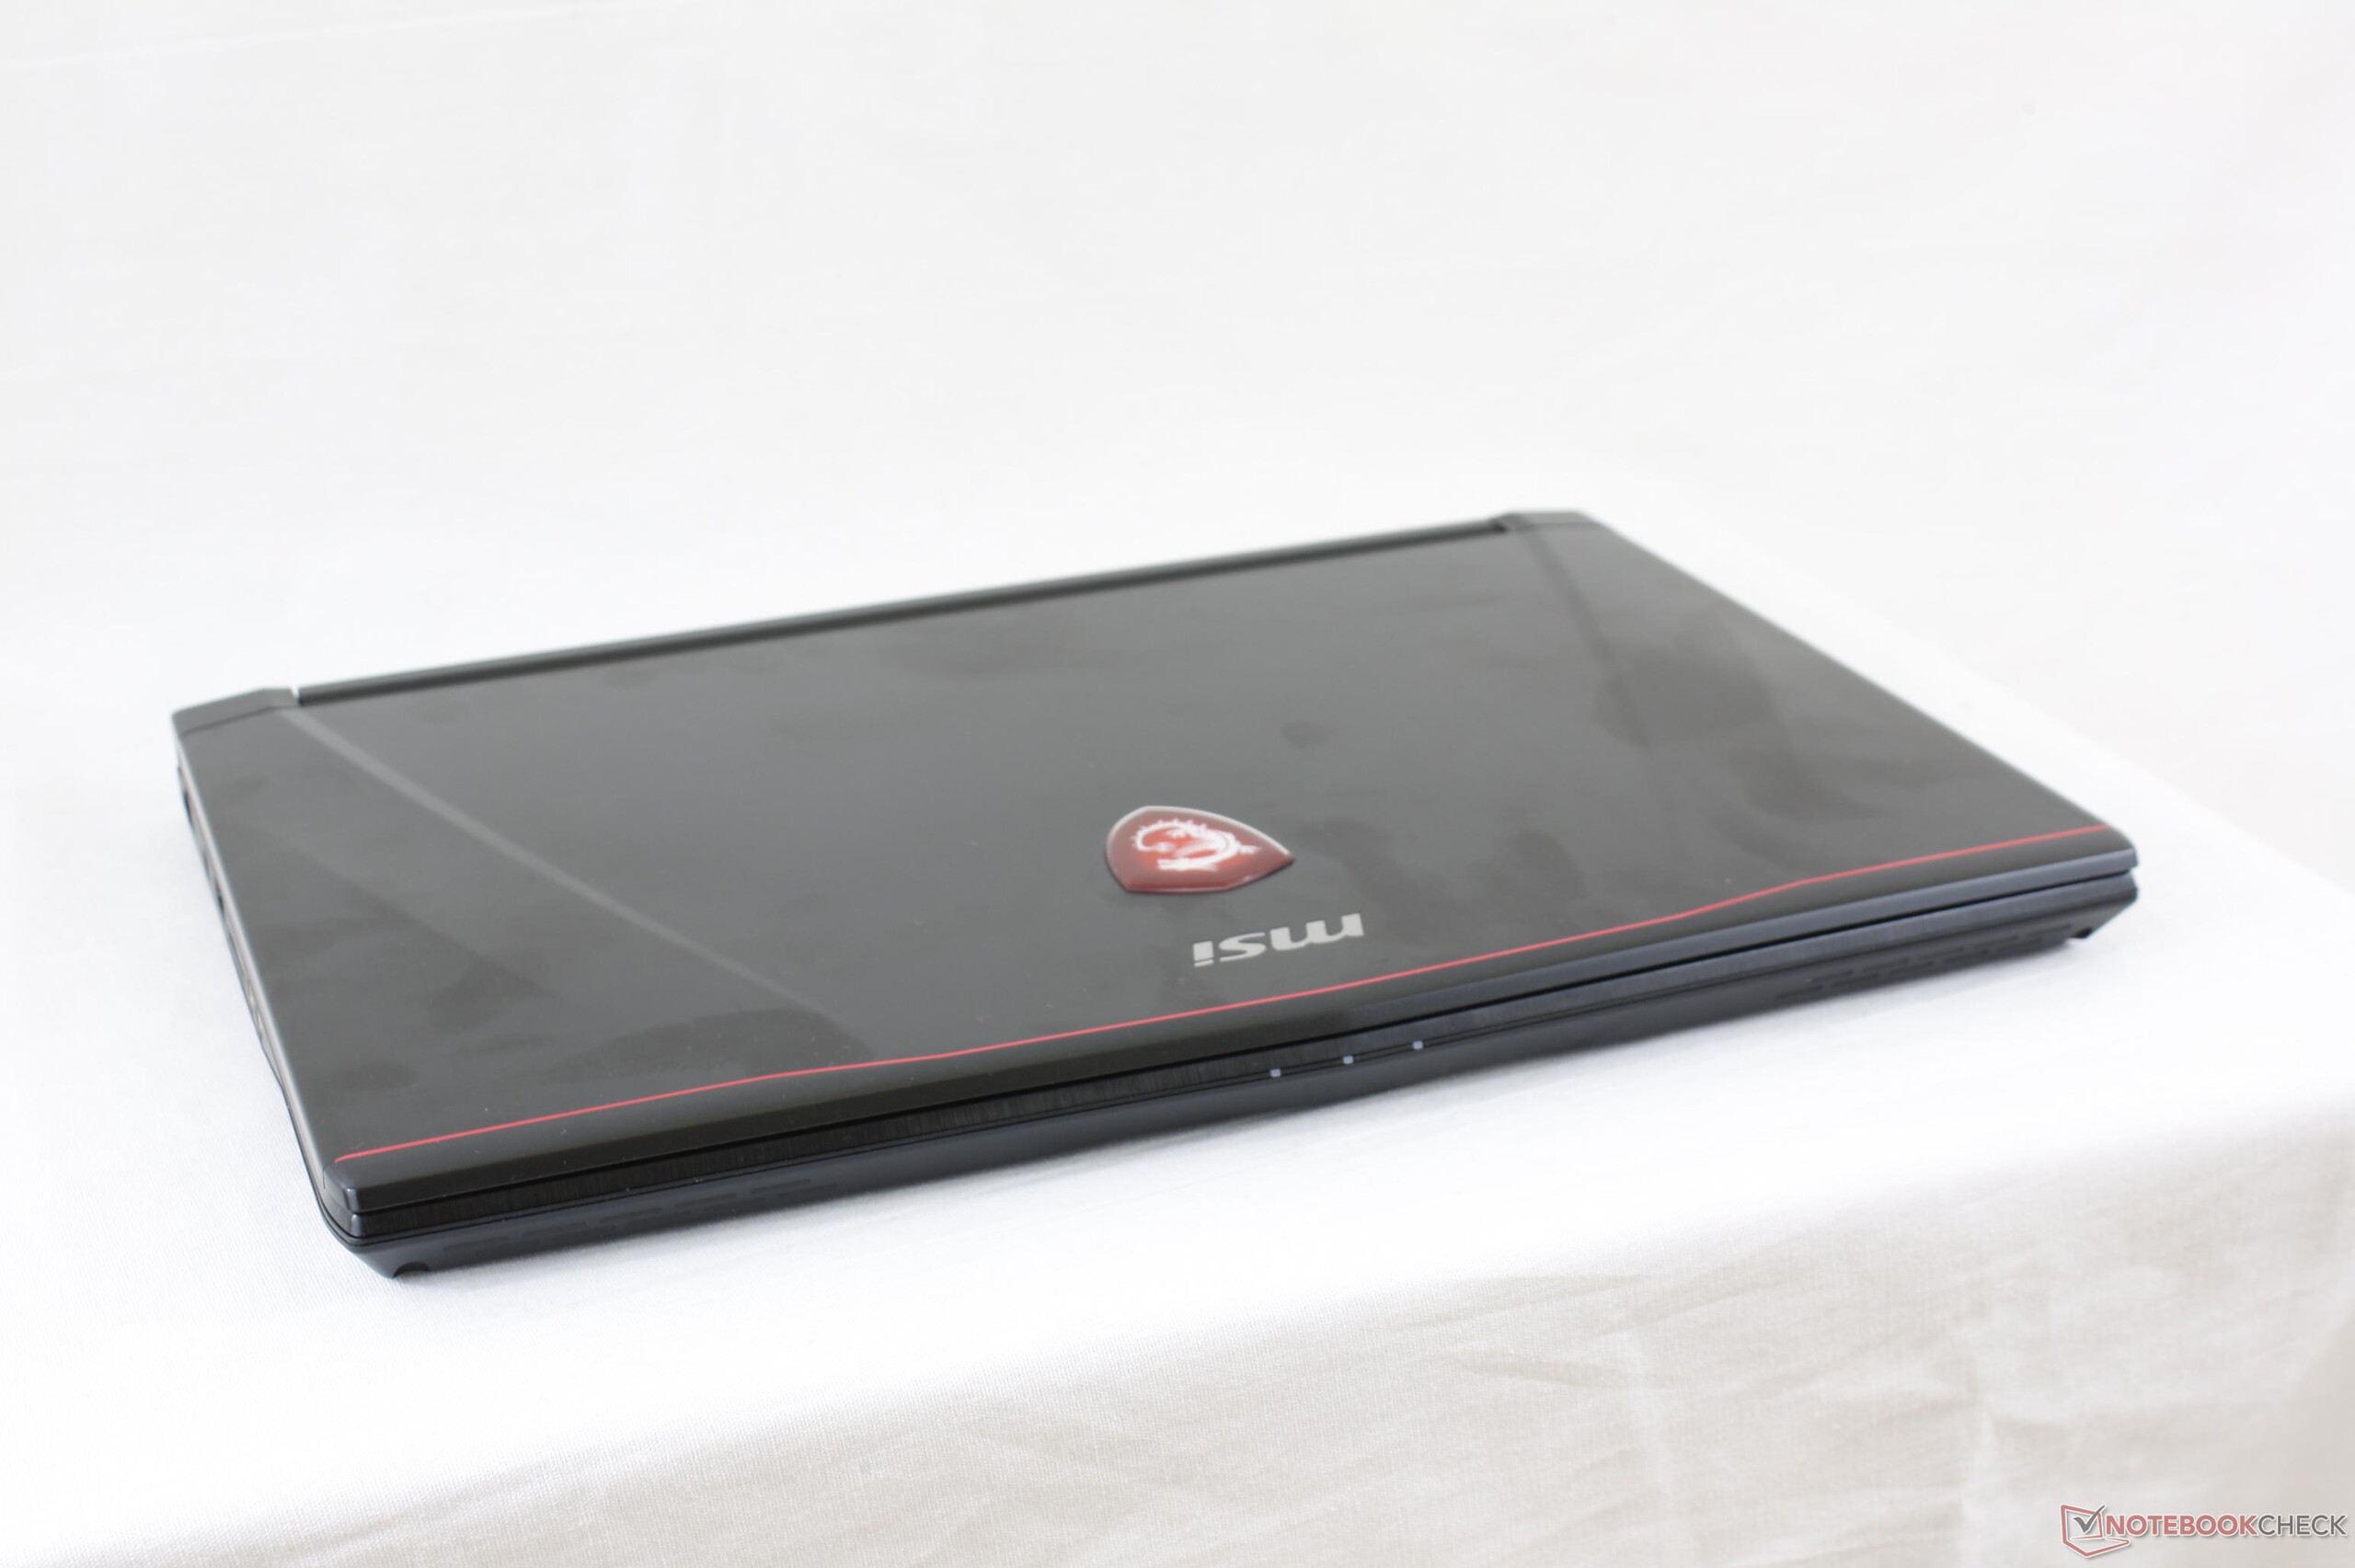
A MSI poderia ter feito mais algumas mudanças para justificar melhor a compra do Kabi Lake GS43VR em relação ao modelo do ano passado. Teclas RGB multi-zona, HDMI 2.0, leitor de cartão SD mais rápido, mais opções de telas (G-Sync, tempos de resposta de 3 ou 5 ms), e talvez ainda menos bloatware poderiam ter passado por um longo caminho. É claro que a atual iteração GS43 poderia se beneficiar de uma atualização completa do design para recuperar o atraso com as novas aparências das mais conhecidas séries GE63VR e GT. O grande passo deve tornar possíveis todos os recursos faltantes acima mencionados e, quem sabe, melhorar a rigidez do chassi e o barulho da ventoinha ao longo do caminho. Neste caso, o Alienware 13 e o Razer Blade se sentem mais fortes e mais resistentes que o que a MSI tem para oferecer nesta categoria de tamanho.
Com um tamanho de tela de apenas 14 polegadas, o GS43VR é apenas recomendado para jogadores que estão constantemente em movimento e desejam o desempenho de um PC de jogos, que seja tão portátil quanto possível. caso contrário, o GT72 ou GT73são máquinas de jogo significativamente melhores em termos de ruído da ventoinha, qualidade do chassi, conectividade e o grande número de opções pelo preço. Sugerimos que os novos proprietários do GS43VR se familiarizem com os controles da ventoinha e desinstalem o bloatware que parece dificultar a duração da bateria.
O GS43VR não combina com a sensação ou a qualidade de um Alienware 13 ou de um Razer Blade de 14 polegadas e está atrasado para uma revisão do design. Com $1500 USD, o MSI custa o mesmo que o Dell de $1550 USD e é mais barato do que o Razer de $1900 USD. Se o MSI é indispensável, então, investir no Skylake GS43VR mais antigo economizará algumas centenas de dólares sem sacrificar o desempenho nos jogos.
MSI GS43VR 7RE-069US
- 07/27/2017 v6 (old)
Allen Ngo
Price comparison
