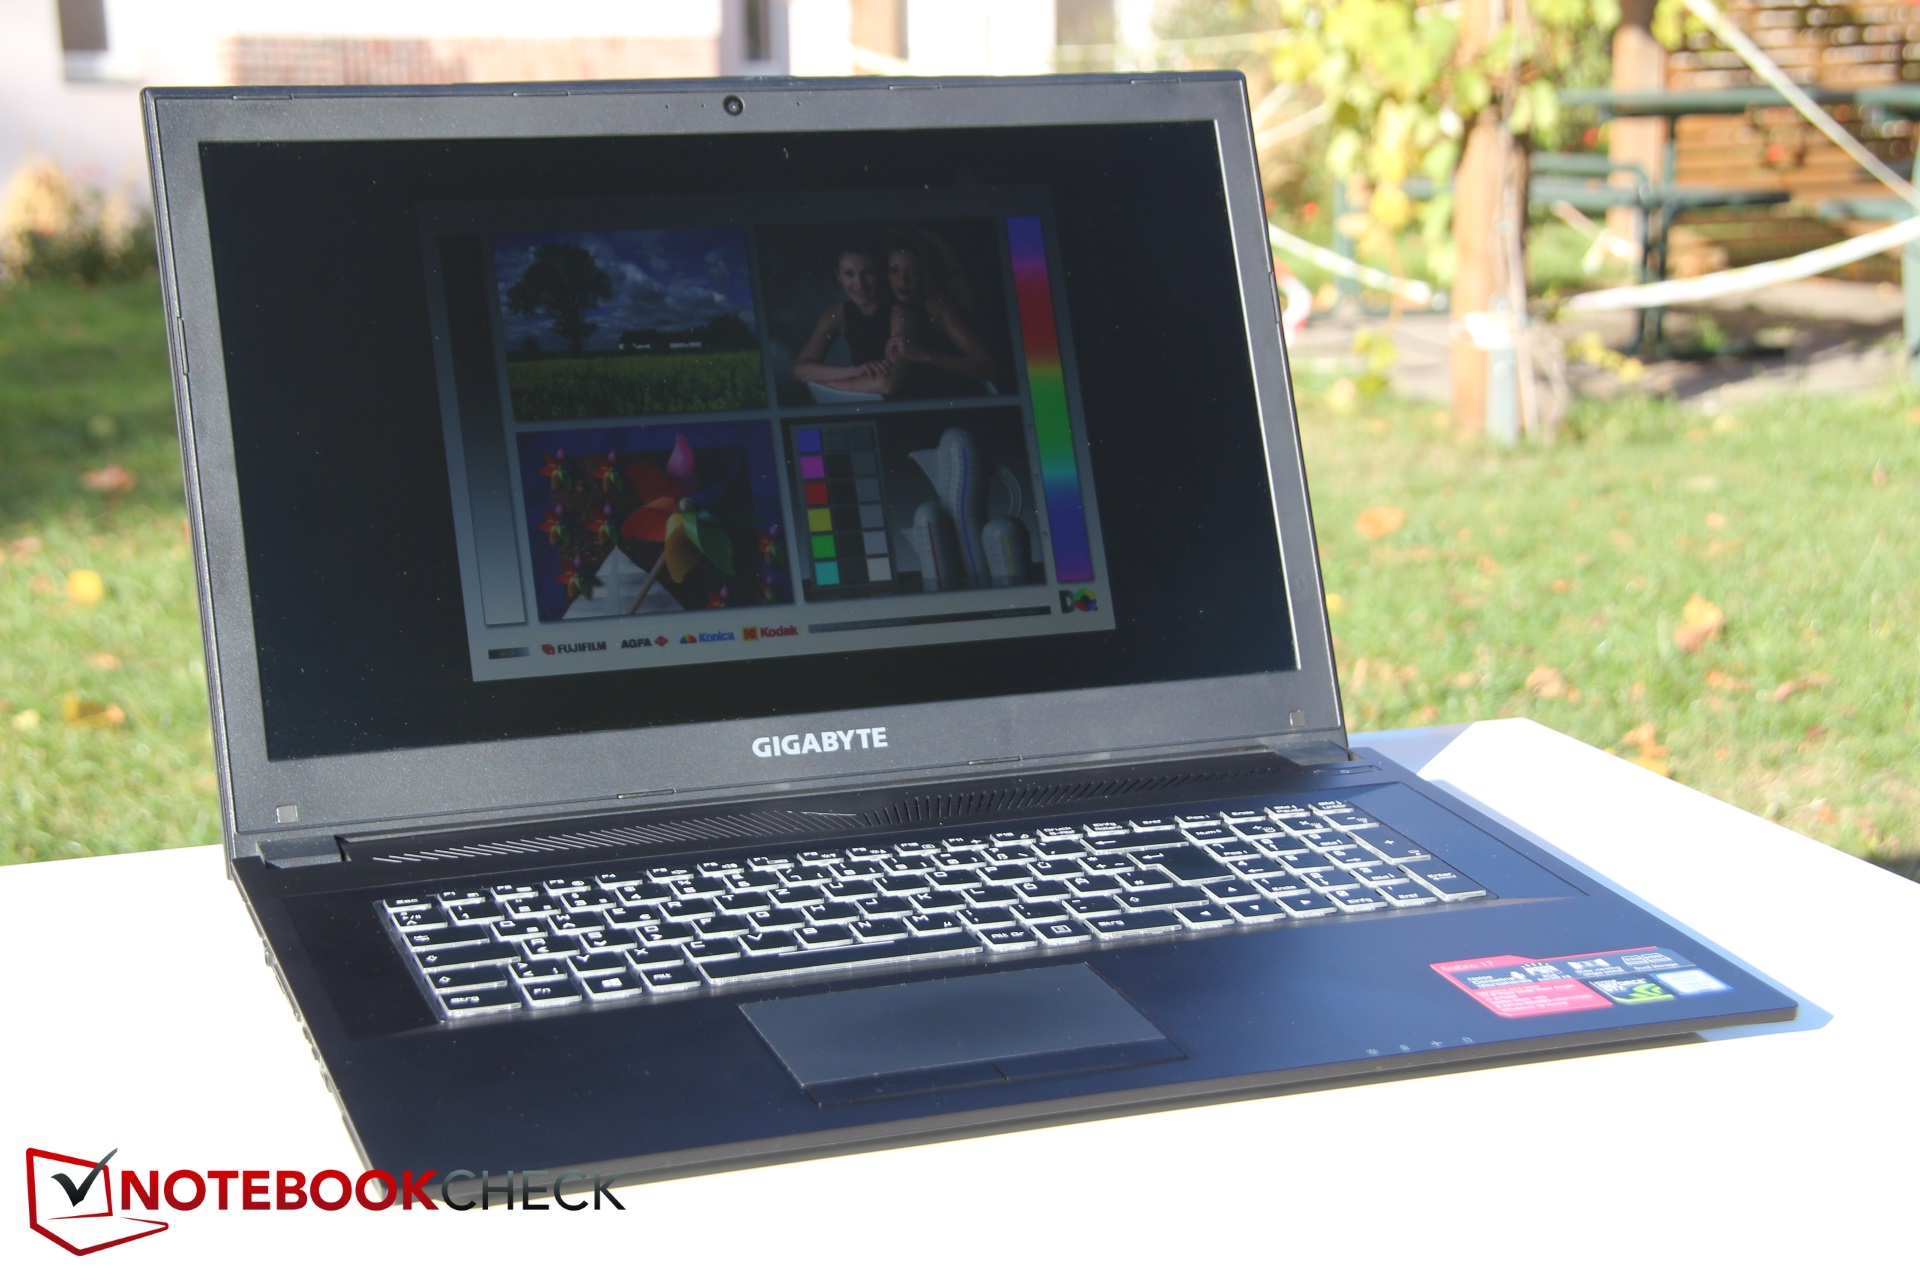
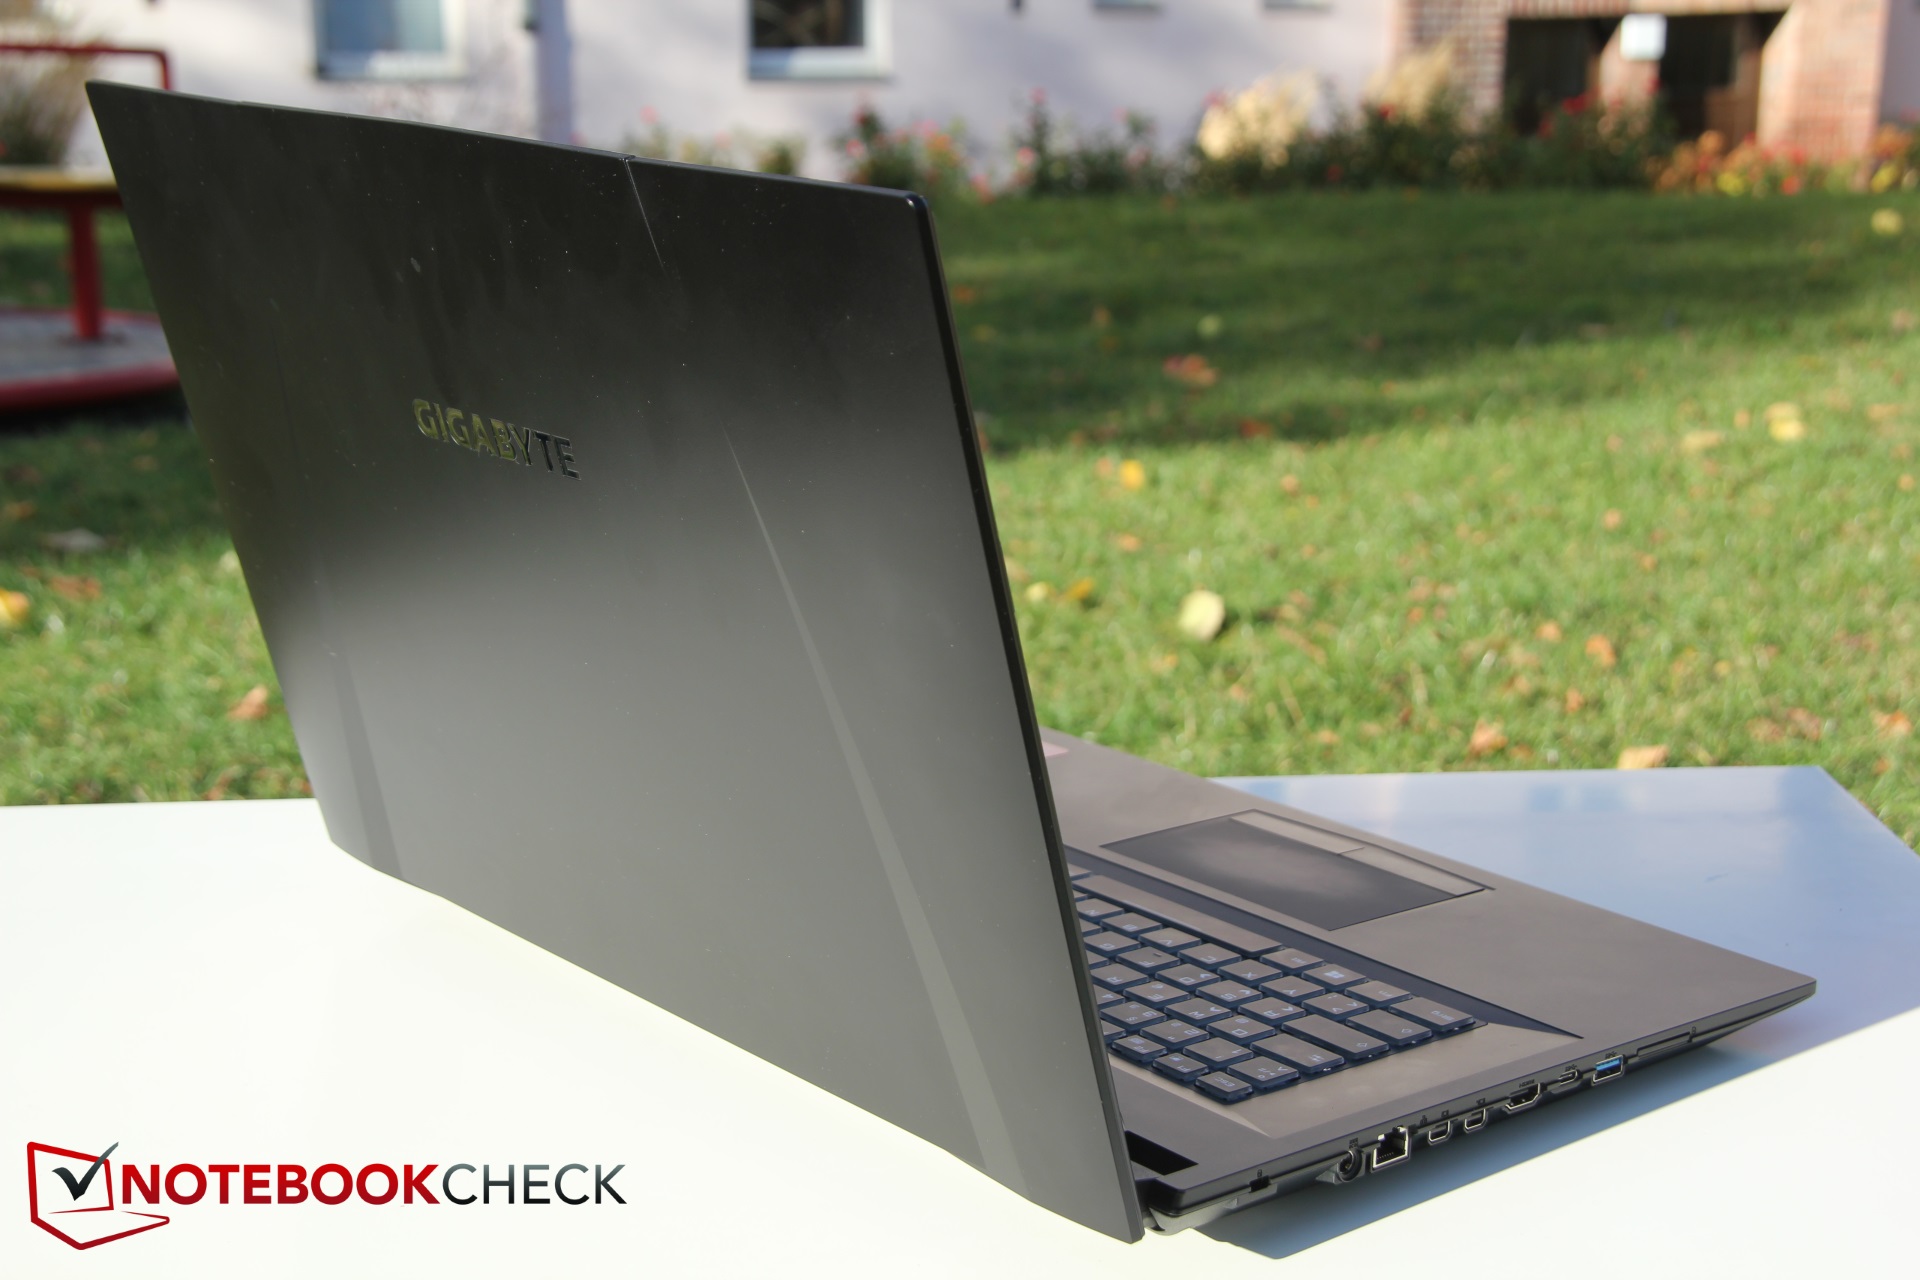
Breve Análise do Portátil Gigabyte Sabre 17 (i7-8750H, GTX 1060)
| SD Card Reader | |
| average JPG Copy Test (av. of 3 runs) | |
| Média da turma Multimedia (23 - 531, n=44, últimos 2 anos) | |
| Asus Strix GL703GM-DS74 (Toshiba Exceria Pro SDXC 64 GB UHS-II) | |
| Gigabyte Sabre 17-W8 (Toshiba Exceria Pro SDXC 64 GB UHS-II) | |
| Razer Blade Pro RZ09-0220 (Toshiba Exceria Pro SDXC 64 GB UHS-II) | |
| MSI GP72VR 7RFX (Toshiba Exceria Pro SDXC 64 GB UHS-II) | |
| maximum AS SSD Seq Read Test (1GB) | |
| Média da turma Multimedia (27.9 - 1455, n=43, últimos 2 anos) | |
| Asus Strix GL703GM-DS74 (Toshiba Exceria Pro SDXC 64 GB UHS-II) | |
| Gigabyte Sabre 17-W8 (Toshiba Exceria Pro SDXC 64 GB UHS-II) | |
| Razer Blade Pro RZ09-0220 (Toshiba Exceria Pro SDXC 64 GB UHS-II) | |
| MSI GP72VR 7RFX (Toshiba Exceria Pro SDXC 64 GB UHS-II) | |
| Networking | |
| iperf3 transmit AX12 | |
| Asus TUF FX705GM | |
| Razer Blade Pro RZ09-0220 | |
| Asus Strix GL703GM-DS74 | |
| Gigabyte Sabre 17-W8 | |
| MSI GP72VR 7RFX | |
| iperf3 receive AX12 | |
| Asus TUF FX705GM | |
| Asus Strix GL703GM-DS74 | |
| Razer Blade Pro RZ09-0220 | |
| Gigabyte Sabre 17-W8 | |
| MSI GP72VR 7RFX | |
| |||||||||||||||||||||||||
iluminação: 82 %
iluminação com acumulador: 327 cd/m²
Contraste: 1207:1 (Preto: 0.27 cd/m²)
ΔE ColorChecker Calman: 9.11 | ∀{0.5-29.43 Ø4.72}
calibrated: 2.62
ΔE Greyscale Calman: 11.17 | ∀{0.09-98 Ø4.97}
100% sRGB (Argyll 1.6.3 3D)
76% AdobeRGB 1998 (Argyll 1.6.3 3D)
85.1% AdobeRGB 1998 (Argyll 3D)
100% sRGB (Argyll 3D)
89.9% Display P3 (Argyll 3D)
Gamma: 2.28
CCT: 12475 K
| Gigabyte Sabre 17-W8 Chi Mei CMN1747, , 1920x1080, 17.3" | Asus TUF FX705GM AU Optronics B173HAN04.0 (AUO409D), , 1920x1080, 17.3" | Asus Strix GL703GM-DS74 Chi Mei CMN1747 M173JJE-G32, , 1920x1080, 17.3" | Razer Blade Pro RZ09-0220 ID: AUO169D, Name: AU Optronics B173HAN01.6, , 1920x1080, 17.3" | MSI GP72VR 7RFX CMN1747, , 1920x1080, 17.3" | |
|---|---|---|---|---|---|
| Display | -22% | 0% | -21% | 1% | |
| Display P3 Coverage (%) | 89.9 | 62.4 -31% | 90 0% | 64 -29% | 89.9 0% |
| sRGB Coverage (%) | 100 | 88.8 -11% | 100 0% | 89.7 -10% | 99.7 0% |
| AdobeRGB 1998 Coverage (%) | 85.1 | 63.8 -25% | 84.8 0% | 64.9 -24% | 86.5 2% |
| Response Times | -4% | 5% | -337% | -79% | |
| Response Time Grey 50% / Grey 80% * (ms) | 9 ? | 7.4 ? 18% | 8.8 ? 2% | 36.8 ? -309% | 21.6 ? -140% |
| Response Time Black / White * (ms) | 8 ? | 10 ? -25% | 7.4 ? 7% | 37.2 ? -365% | 9.4 ? -18% |
| PWM Frequency (Hz) | 25000 ? | 25510 ? | 25000 ? | ||
| Screen | 18% | 10% | 13% | -72% | |
| Brightness middle (cd/m²) | 326 | 234 -28% | 297.8 -9% | 367.4 13% | 309 -5% |
| Brightness (cd/m²) | 309 | 228 -26% | 285 -8% | 363 17% | 290 -6% |
| Brightness Distribution (%) | 82 | 85 4% | 84 2% | 86 5% | 88 7% |
| Black Level * (cd/m²) | 0.27 | 0.2 26% | 0.33 -22% | 0.32 -19% | 0.22 19% |
| Contrast (:1) | 1207 | 1170 -3% | 902 -25% | 1148 -5% | 1405 16% |
| Colorchecker dE 2000 * | 9.11 | 2.16 76% | 3.68 60% | 3.8 58% | 7.2 21% |
| Colorchecker dE 2000 max. * | 14.14 | 3.39 76% | 7.71 45% | 10.4 26% | 12.8 9% |
| Colorchecker dE 2000 calibrated * | 2.62 | 2.02 23% | 2.71 -3% | ||
| Greyscale dE 2000 * | 11.17 | 2 82% | 5 55% | 3.5 69% | 98 -777% |
| Gamma | 2.28 96% | 2.46 89% | 2.06 107% | 2.18 101% | 1.96 112% |
| CCT | 12475 52% | 6394 102% | 6728 97% | 6467 101% | 10963 59% |
| Color Space (Percent of AdobeRGB 1998) (%) | 76 | 58 -24% | 84.77 12% | 58.1 -24% | 77 1% |
| Color Space (Percent of sRGB) (%) | 100 | 89 -11% | 99.97 0% | 89.3 -11% | 100 0% |
| Média Total (Programa/Configurações) | -3% /
8% | 5% /
7% | -115% /
-41% | -50% /
-58% |
* ... menor é melhor
Exibir tempos de resposta
| ↔ Tempo de resposta preto para branco | ||
|---|---|---|
| 8 ms ... ascensão ↗ e queda ↘ combinadas | ↗ 6 ms ascensão | 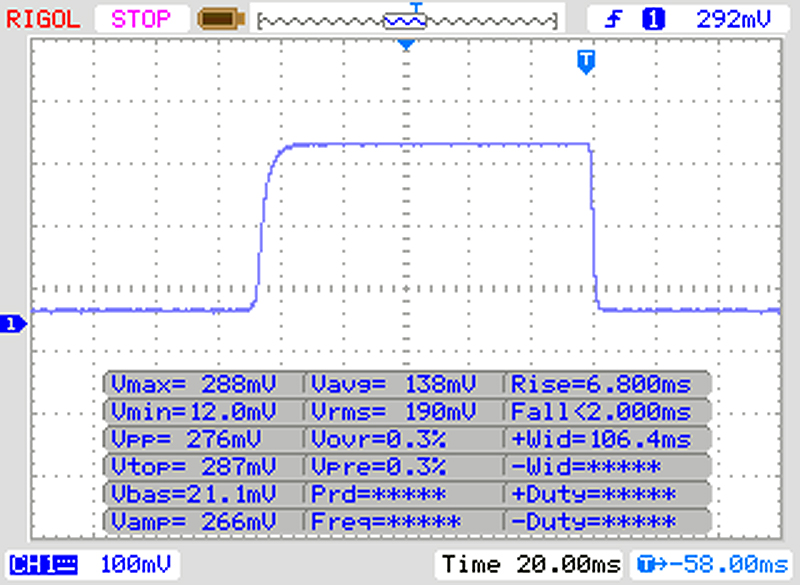 |
| ↘ 2 ms queda | ||
| A tela mostra taxas de resposta rápidas em nossos testes e deve ser adequada para jogos. Em comparação, todos os dispositivos testados variam de 0.1 (mínimo) a 240 (máximo) ms. » 22 % de todos os dispositivos são melhores. Isso significa que o tempo de resposta medido é melhor que a média de todos os dispositivos testados (19.8 ms). | ||
| ↔ Tempo de resposta 50% cinza a 80% cinza | ||
| 9 ms ... ascensão ↗ e queda ↘ combinadas | ↗ 5 ms ascensão | 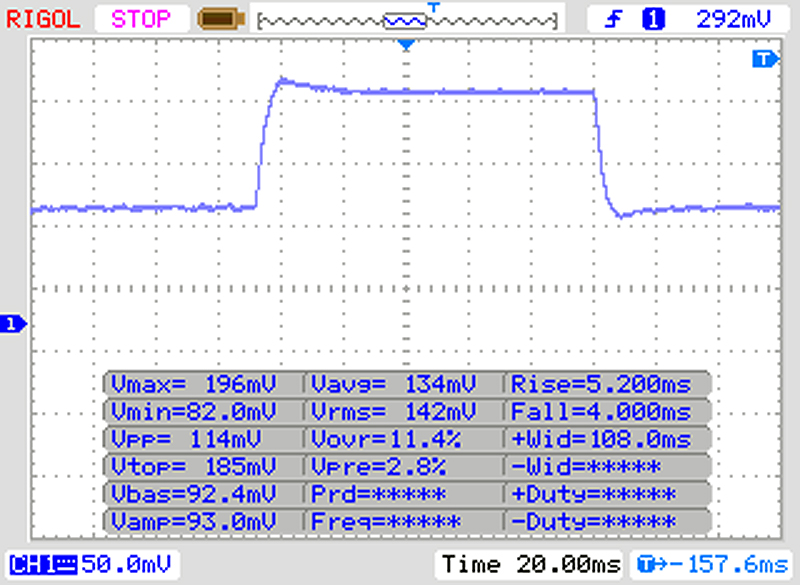 |
| ↘ 4 ms queda | ||
| A tela mostra taxas de resposta rápidas em nossos testes e deve ser adequada para jogos. Em comparação, todos os dispositivos testados variam de 0.165 (mínimo) a 636 (máximo) ms. » 22 % de todos os dispositivos são melhores. Isso significa que o tempo de resposta medido é melhor que a média de todos os dispositivos testados (31 ms). | ||
Cintilação da tela / PWM (modulação por largura de pulso)
| Tela tremeluzindo/PWM detectado | 25000 Hz | ≤ 20 % configuração de brilho | 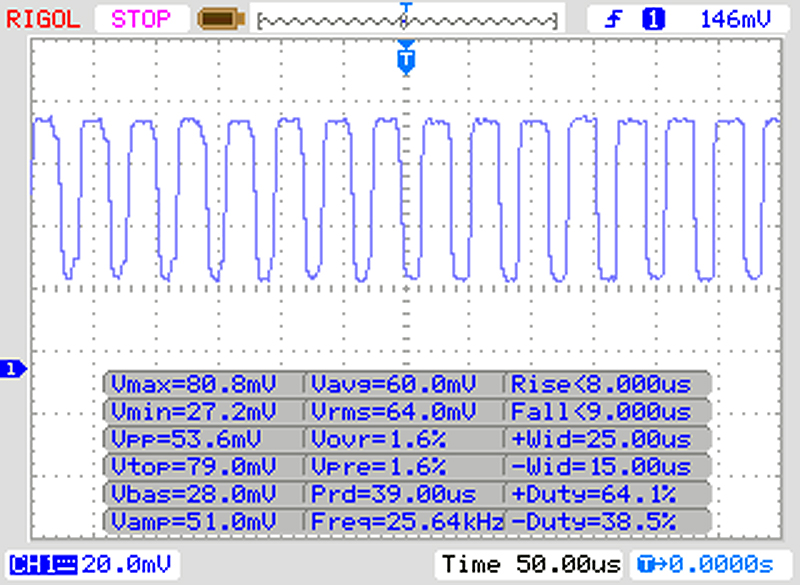 |
A luz de fundo da tela pisca em 25000 Hz (pior caso, por exemplo, utilizando PWM) Cintilação detectada em uma configuração de brilho de 20 % e abaixo. Não deve haver cintilação ou PWM acima desta configuração de brilho. A frequência de 25000 Hz é bastante alta, então a maioria dos usuários sensíveis ao PWM não deve notar nenhuma oscilação. [pwm_comparison] Em comparação: 52 % de todos os dispositivos testados não usam PWM para escurecer a tela. Se PWM foi detectado, uma média de 7763 (mínimo: 5 - máximo: 343500) Hz foi medida. | |||
| Cinebench R10 | |
| Rendering Single CPUs 64Bit | |
| Gigabyte Sabre 17-W8 | |
| Média Intel Core i7-8750H (8472 - 8665, n=5) | |
| Rendering Multiple CPUs 64Bit | |
| Gigabyte Sabre 17-W8 | |
| Média Intel Core i7-8750H (33944 - 46384, n=5) | |
| PCMark 8 Home Score Accelerated v2 | 4231 pontos | |
| PCMark 8 Work Score Accelerated v2 | 5340 pontos | |
| PCMark 10 Score | 5049 pontos | |
Ajuda | ||
| Gigabyte Sabre 17-W8 Toshiba NVMe THNSN5256GPU7 | Asus TUF FX705GM WDC PC SN520 SDAPNUW-256G | Asus Strix GL703GM-DS74 Samsung PM961 MZVLW256HEHP | Razer Blade Pro RZ09-0220 Samsung SSD PM951 MZVLV256HCHP | MSI GP72VR 7RFX Samsung SM961 MZVKW512HMJP m.2 PCI-e | Média Toshiba NVMe THNSN5256GPU7 | |
|---|---|---|---|---|---|---|
| CrystalDiskMark 5.2 / 6 | 9% | 2% | -3% | 51% | 11% | |
| Write 4K (MB/s) | 104.7 | 104.2 0% | 87.8 -16% | 155.1 48% | 186 78% | 107.5 ? 3% |
| Read 4K (MB/s) | 37.39 | 41.46 11% | 38.41 3% | 44.22 18% | 55.6 49% | 38.8 ? 4% |
| Write Seq (MB/s) | 866 | 1295 50% | 1177 36% | 311.2 -64% | 1599 85% | 625 ? -28% |
| Read Seq (MB/s) | 944 | 1325 40% | 868 -8% | 1247 32% | 999 6% | 733 ? -22% |
| Write 4K Q32T1 (MB/s) | 293.3 | 282.8 -4% | 266.5 -9% | 310.3 6% | 493.3 68% | 466 ? 59% |
| Read 4K Q32T1 (MB/s) | 374.3 | 321.3 -14% | 307.1 -18% | 551 47% | 556 49% | 636 ? 70% |
| Write Seq Q32T1 (MB/s) | 1064 | 1301 22% | 1212 14% | 311.5 -71% | 1674 57% | 1109 ? 4% |
| Read Seq Q32T1 (MB/s) | 2616 | 1704 -35% | 3006 15% | 1560 -40% | 3083 18% | 2504 ? -4% |

| 3DMark 11 Performance | 12678 pontos | |
| 3DMark Cloud Gate Standard Score | 30202 pontos | |
| 3DMark Fire Strike Score | 10404 pontos | |
Ajuda | ||
The Witcher 3 framerate graph
| The Witcher 3 | |
| 1024x768 Low Graphics & Postprocessing | |
| Asus Strix GL703GM-DS74 | |
| Média NVIDIA GeForce GTX 1060 Mobile (130.2 - 207, n=17) | |
| Média da turma Multimedia (68 - 380, n=10, últimos 2 anos) | |
| Gigabyte Sabre 17-W8 | |
| 1366x768 Medium Graphics & Postprocessing | |
| Asus Strix GL703GM-DS74 | |
| Média NVIDIA GeForce GTX 1060 Mobile (91.7 - 138.7, n=16) | |
| Gigabyte Sabre 17-W8 | |
| Média da turma Multimedia (41 - 93, n=4, últimos 2 anos) | |
| 1920x1080 High Graphics & Postprocessing (Nvidia HairWorks Off) | |
| Média da turma Multimedia (22 - 224, n=13, últimos 2 anos) | |
| Média NVIDIA GeForce GTX 1060 Mobile (52.6 - 80.6, n=49) | |
| Razer Blade Pro RZ09-0220 | |
| Asus TUF FX705GM | |
| Asus Strix GL703GM-DS74 | |
| Gigabyte Sabre 17-W8 | |
| 1920x1080 Ultra Graphics & Postprocessing (HBAO+) | |
| Média da turma Multimedia (11 - 121, n=13, últimos 2 anos) | |
| Asus Strix GL703GM-DS74 | |
| MSI GP72VR 7RFX | |
| Média NVIDIA GeForce GTX 1060 Mobile (24 - 42.3, n=60) | |
| Razer Blade Pro RZ09-0220 | |
| Asus TUF FX705GM | |
| Gigabyte Sabre 17-W8 | |
| Rise of the Tomb Raider | |
| 1024x768 Lowest Preset | |
| Asus Strix GL703GM-DS74 | |
| Média NVIDIA GeForce GTX 1060 Mobile (105.7 - 203, n=15) | |
| Gigabyte Sabre 17-W8 | |
| 1366x768 Medium Preset AF:2x | |
| Asus Strix GL703GM-DS74 | |
| Média NVIDIA GeForce GTX 1060 Mobile (82.2 - 140, n=14) | |
| Gigabyte Sabre 17-W8 | |
| 1920x1080 High Preset AA:FX AF:4x | |
| Asus Strix GL703GM-DS74 | |
| Gigabyte Sabre 17-W8 | |
| Média NVIDIA GeForce GTX 1060 Mobile (65.3 - 82, n=24) | |
| Razer Blade Pro RZ09-0220 | |
| 1920x1080 Very High Preset AA:FX AF:16x | |
| Asus Strix GL703GM-DS74 | |
| Média NVIDIA GeForce GTX 1060 Mobile (51 - 68.8, n=37) | |
| Gigabyte Sabre 17-W8 | |
| Razer Blade Pro RZ09-0220 | |
| Doom | |
| 1280x720 Low Preset | |
| Média NVIDIA GeForce GTX 1060 Mobile (121.4 - 155.3, n=3) | |
| Gigabyte Sabre 17-W8 | |
| 1366x768 Medium Preset | |
| Média NVIDIA GeForce GTX 1060 Mobile (115.5 - 146.4, n=3) | |
| Gigabyte Sabre 17-W8 | |
| 1920x1080 Medium Preset | |
| Média NVIDIA GeForce GTX 1060 Mobile (72.3 - 110, n=3) | |
| Gigabyte Sabre 17-W8 | |
| 1920x1080 High Preset AA:FX | |
| Média NVIDIA GeForce GTX 1060 Mobile (68.6 - 102.2, n=6) | |
| Gigabyte Sabre 17-W8 | |
| 1920x1080 Ultra Preset AA:SM | |
| Média NVIDIA GeForce GTX 1060 Mobile (66 - 103.3, n=17) | |
| Gigabyte Sabre 17-W8 | |
| baixo | média | alto | ultra | |
|---|---|---|---|---|
| The Witcher 3 (2015) | 131.3 | 91.7 | 53.9 | 24 |
| Rise of the Tomb Raider (2016) | 113.4 | 82.2 | 74.4 | 60.9 |
| Doom (2016) | 121.4 | 115.5 | 68.6 | 66 |
| Gigabyte Sabre 17-W8 GeForce GTX 1060 Mobile, i7-8750H, Toshiba NVMe THNSN5256GPU7 | Asus TUF FX705GM GeForce GTX 1060 Mobile, i7-8750H, WDC PC SN520 SDAPNUW-256G | Asus Strix GL703GM-DS74 GeForce GTX 1060 Mobile, i7-8750H, Samsung PM961 MZVLW256HEHP | Razer Blade Pro RZ09-0220 GeForce GTX 1060 Mobile, i7-7700HQ, Samsung SSD PM951 MZVLV256HCHP | MSI GP72VR 7RFX GeForce GTX 1060 Mobile, i7-7700HQ, Samsung SM961 MZVKW512HMJP m.2 PCI-e | |
|---|---|---|---|---|---|
| Noise | -7% | 4% | 9% | 2% | |
| desligado / ambiente * (dB) | 30.5 | 29 5% | 28.6 6% | 28.1 8% | 28.3 7% |
| Idle Minimum * (dB) | 32.1 | 32 -0% | 29.4 8% | 29.5 8% | 29.2 9% |
| Idle Average * (dB) | 32.1 | 33 -3% | 29.4 8% | 29.6 8% | 29.2 9% |
| Idle Maximum * (dB) | 32.3 | 44 -36% | 33.7 -4% | 29.6 8% | 37 -15% |
| Load Average * (dB) | 42.9 | 46 -7% | 41.2 4% | 31.6 26% | 43.7 -2% |
| Load Maximum * (dB) | 48.8 | 50 -2% | 48.3 1% | 51.8 -6% | 46.4 5% |
| Witcher 3 ultra * (dB) | 48 | 47.3 | 46 | 45.7 |
* ... menor é melhor
Barulho
| Ocioso |
| 32.1 / 32.1 / 32.3 dB |
| HDD |
| 32.4 dB |
| Carga |
| 42.9 / 48.8 dB |
 | ||
30 dB silencioso 40 dB(A) audível 50 dB(A) ruidosamente alto |
||
min: | ||
| Gigabyte Sabre 17-W8 GeForce GTX 1060 Mobile, i7-8750H, Toshiba NVMe THNSN5256GPU7 | Asus TUF FX705GM GeForce GTX 1060 Mobile, i7-8750H, WDC PC SN520 SDAPNUW-256G | Asus Strix GL703GM-DS74 GeForce GTX 1060 Mobile, i7-8750H, Samsung PM961 MZVLW256HEHP | Razer Blade Pro RZ09-0220 GeForce GTX 1060 Mobile, i7-7700HQ, Samsung SSD PM951 MZVLV256HCHP | MSI GP72VR 7RFX GeForce GTX 1060 Mobile, i7-7700HQ, Samsung SM961 MZVKW512HMJP m.2 PCI-e | |
|---|---|---|---|---|---|
| Heat | -27% | -27% | -8% | -35% | |
| Maximum Upper Side * (°C) | 35 | 54 -54% | 54.6 -56% | 48.2 -38% | 53.8 -54% |
| Maximum Bottom * (°C) | 34.3 | 53 -55% | 41.2 -20% | 43.2 -26% | 52.2 -52% |
| Idle Upper Side * (°C) | 30.1 | 30 -0% | 35 -16% | 25.4 16% | 37.2 -24% |
| Idle Bottom * (°C) | 30.5 | 30 2% | 35.2 -15% | 25.8 15% | 34 -11% |
* ... menor é melhor
(+) A temperatura máxima no lado superior é 35 °C / 95 F, em comparação com a média de 36.8 °C / 98 F , variando de 21 a 71 °C para a classe Multimedia.
(+) A parte inferior aquece até um máximo de 34.3 °C / 94 F, em comparação com a média de 39.1 °C / 102 F
(+) Em uso inativo, a temperatura média para o lado superior é 27.8 °C / 82 F, em comparação com a média do dispositivo de 31.3 °C / ### class_avg_f### F.
(+) Os apoios para as mãos e o touchpad estão atingindo a temperatura máxima da pele (34.6 °C / 94.3 F) e, portanto, não estão quentes.
(-) A temperatura média da área do apoio para as mãos de dispositivos semelhantes foi 28.7 °C / 83.7 F (-5.9 °C / -10.6 F).
Gigabyte Sabre 17-W8 análise de áudio
(-) | alto-falantes não muito altos (###valor### dB)
Graves 100 - 315Hz
(-) | quase nenhum baixo - em média 25.8% menor que a mediana
(±) | a linearidade dos graves é média (8.6% delta para a frequência anterior)
Médios 400 - 2.000 Hz
(±) | médios mais altos - em média 8.1% maior que a mediana
(±) | a linearidade dos médios é média (12.8% delta para frequência anterior)
Altos 2 - 16 kHz
(±) | máximos mais altos - em média 7.7% maior que a mediana
(-) | os máximos não são lineares (15.3% delta da frequência anterior)
Geral 100 - 16.000 Hz
(-) | o som geral não é linear (35.6% diferença em relação à mediana)
Comparado com a mesma classe
» 98% de todos os dispositivos testados nesta classe foram melhores, 0% semelhantes, 1% piores
» O melhor teve um delta de 5%, a média foi 17%, o pior foi 45%
Comparado com todos os dispositivos testados
» 94% de todos os dispositivos testados foram melhores, 1% semelhantes, 5% piores
» O melhor teve um delta de 4%, a média foi 24%, o pior foi 134%
Asus TUF FX705GM análise de áudio
(±) | o volume do alto-falante é médio, mas bom (###valor### dB)
Graves 100 - 315Hz
(-) | quase nenhum baixo - em média 16.1% menor que a mediana
(±) | a linearidade dos graves é média (11.5% delta para a frequência anterior)
Médios 400 - 2.000 Hz
(+) | médios equilibrados - apenas 4% longe da mediana
(+) | médios são lineares (5.7% delta para frequência anterior)
Altos 2 - 16 kHz
(±) | máximos mais altos - em média 5.1% maior que a mediana
(+) | os máximos são lineares (4.6% delta da frequência anterior)
Geral 100 - 16.000 Hz
(±) | a linearidade do som geral é média (21.6% diferença em relação à mediana)
Comparado com a mesma classe
» 77% de todos os dispositivos testados nesta classe foram melhores, 5% semelhantes, 18% piores
» O melhor teve um delta de 6%, a média foi 18%, o pior foi 132%
Comparado com todos os dispositivos testados
» 61% de todos os dispositivos testados foram melhores, 7% semelhantes, 32% piores
» O melhor teve um delta de 4%, a média foi 24%, o pior foi 134%
| desligado | |
| Ocioso | |
| Carga |
|
Key:
min: | |
| Gigabyte Sabre 17-W8 i7-8750H, GeForce GTX 1060 Mobile, Toshiba NVMe THNSN5256GPU7, TN, 1920x1080, 17.3" | Asus TUF FX705GM i7-8750H, GeForce GTX 1060 Mobile, WDC PC SN520 SDAPNUW-256G, IPS, 1920x1080, 17.3" | Asus Strix GL703GM-DS74 i7-8750H, GeForce GTX 1060 Mobile, Samsung PM961 MZVLW256HEHP, TN LED, 1920x1080, 17.3" | Razer Blade Pro RZ09-0220 i7-7700HQ, GeForce GTX 1060 Mobile, Samsung SSD PM951 MZVLV256HCHP, IPS, 1920x1080, 17.3" | MSI GP72VR 7RFX i7-7700HQ, GeForce GTX 1060 Mobile, Samsung SM961 MZVKW512HMJP m.2 PCI-e, TN LED, 1920x1080, 17.3" | Média NVIDIA GeForce GTX 1060 Mobile | Média da turma Multimedia | |
|---|---|---|---|---|---|---|---|
| Power Consumption | -26% | -54% | -1% | -31% | -17% | 31% | |
| Idle Minimum * (Watt) | 9.3 | 13 -40% | 18.88 -103% | 10.6 -14% | 17.3 -86% | 12.7 ? -37% | 5.64 ? 39% |
| Idle Average * (Watt) | 14.8 | 17 -15% | 24.36 -65% | 16 -8% | 22.5 -52% | 17.5 ? -18% | 10 ? 32% |
| Idle Maximum * (Watt) | 22 | 24 -9% | 32.27 -47% | 16.4 25% | 22.5 -2% | 21.8 ? 1% | 12.2 ? 45% |
| Load Average * (Watt) | 63 | 106 -68% | 107.74 -71% | 75.9 -20% | 85.1 -35% | 91.7 ? -46% | 64.8 ? -3% |
| Load Maximum * (Watt) | 187 | 179 4% | 160.28 14% | 163.8 12% | 151.3 19% | 156.4 ? 16% | 111.7 ? 40% |
| Witcher 3 ultra * (Watt) | 151 | 142 | 111.2 | 141.7 |
* ... menor é melhor
| Gigabyte Sabre 17-W8 i7-8750H, GeForce GTX 1060 Mobile, 62 Wh | Asus TUF FX705GM i7-8750H, GeForce GTX 1060 Mobile, 64 Wh | Asus Strix GL703GM-DS74 i7-8750H, GeForce GTX 1060 Mobile, 74 Wh | Razer Blade Pro RZ09-0220 i7-7700HQ, GeForce GTX 1060 Mobile, 70 Wh | MSI GP72VR 7RFX i7-7700HQ, GeForce GTX 1060 Mobile, 41 Wh | Média da turma Multimedia | |
|---|---|---|---|---|---|---|
| Battery Runtime | ||||||
| WiFi Websurfing (h) | 5.4 | 4.5 -17% | 3.6 -33% | 7 30% | 2.1 -61% | 12 ? 122% |
| Duração da bateria | -5% | -19% | 30% | 27% | 165% | |
| Reader / Idle (h) | 6.9 | 6.3 -9% | 5.3 -23% | 12 74% | 0.7 -90% | 25.2 ? 265% |
| H.264 (h) | 5.3 | 4.3 -19% | 16.4 ? 209% | |||
| Load (h) | 1.4 | 1.6 14% | 1.2 -14% | 1.2 -14% | 3.4 143% | 1.675 ? 20% |
| Média Total (Programa/Configurações) | -11% /
-8% | -26% /
-23% | 30% /
30% | -17% /
-3% | 144% /
154% |
Pro
Contra
Tudo somado, o Sabre Gigabyte 17 WV8 é um bom substituto de desktop que pode lidar com quase qualquer tarefa. Ele faz muitas coisas certas, mas se descuida em uma área crucial - o desempenho dos jogos.
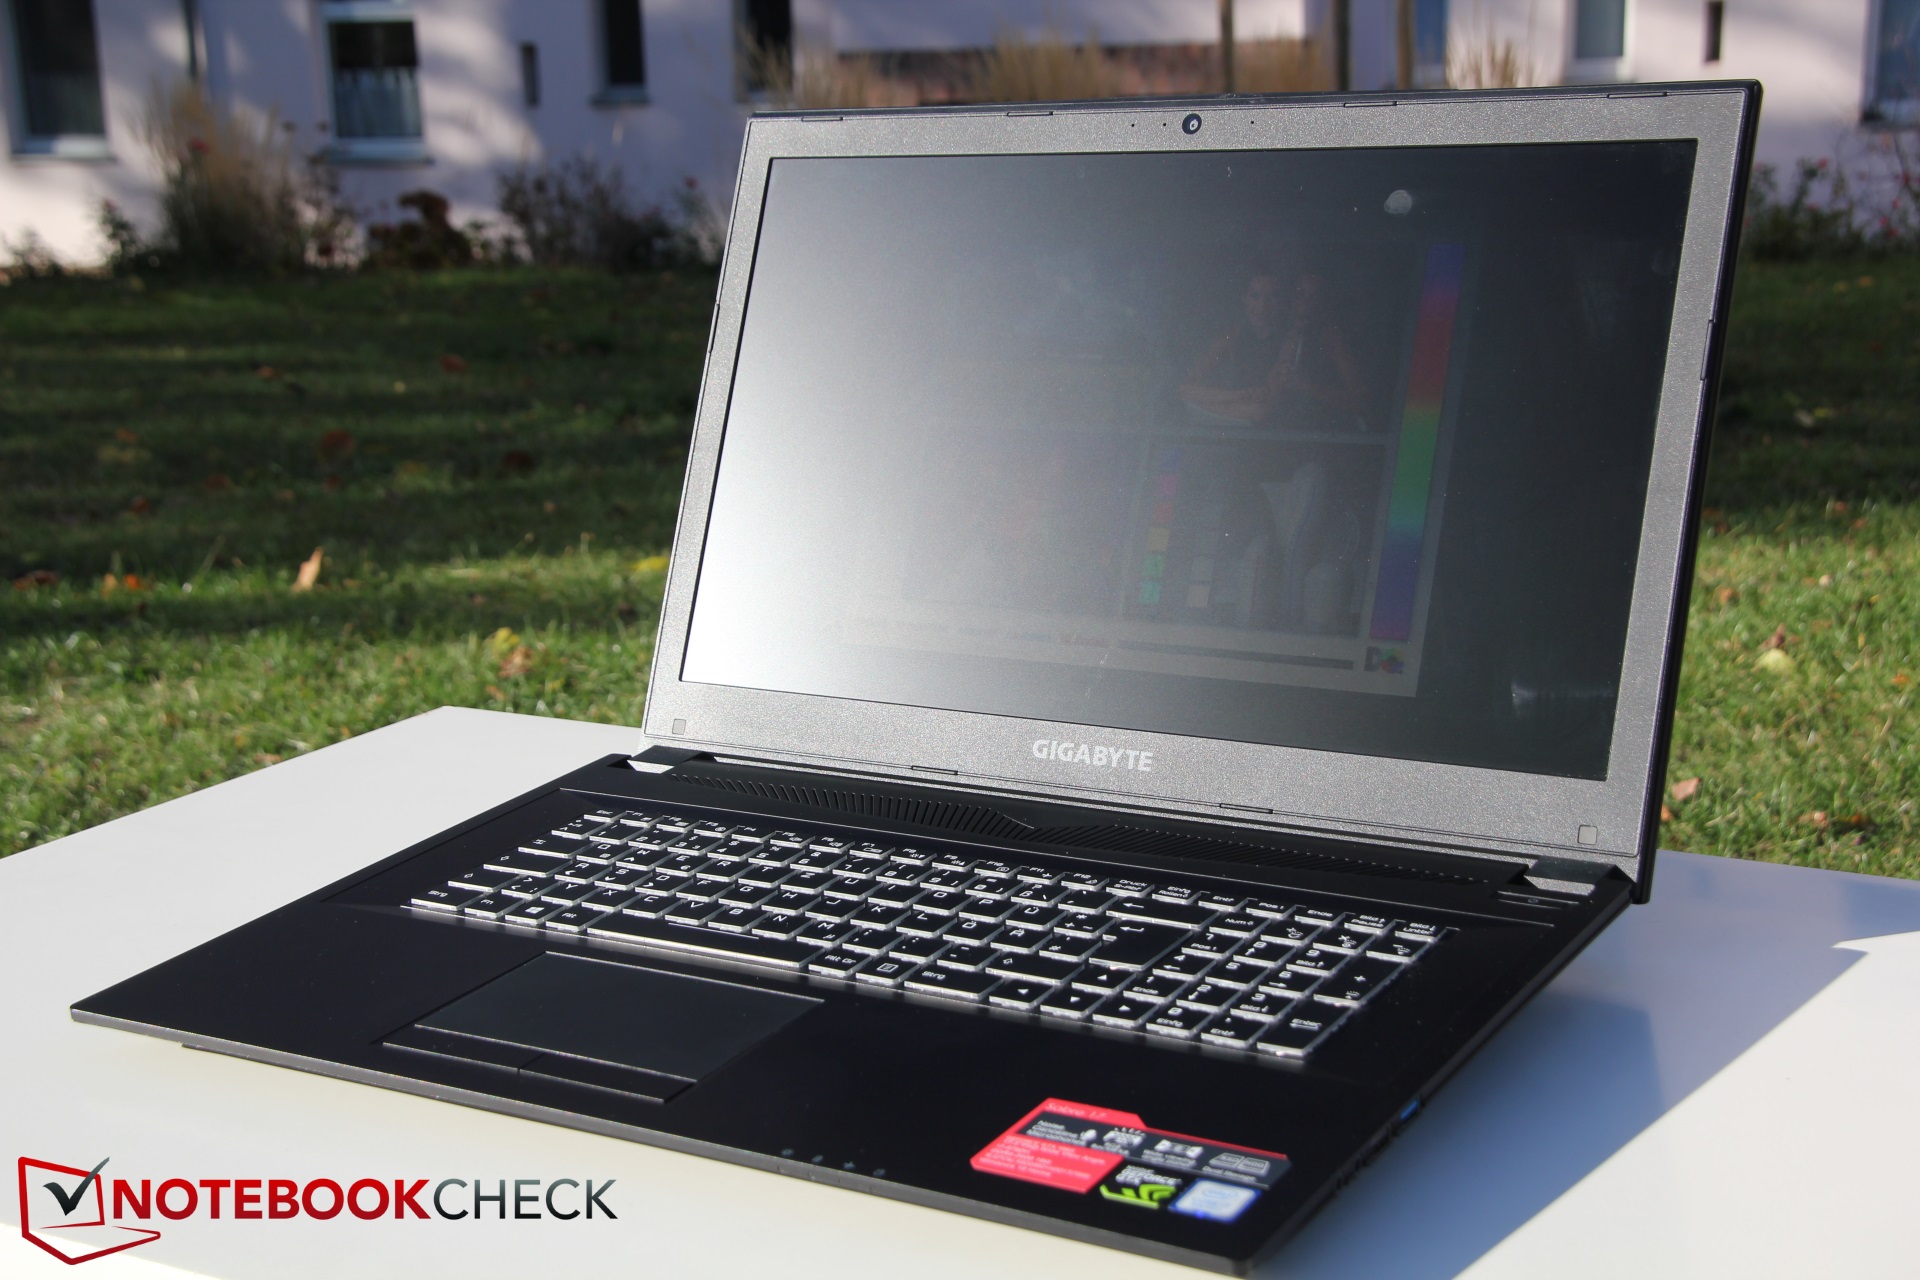
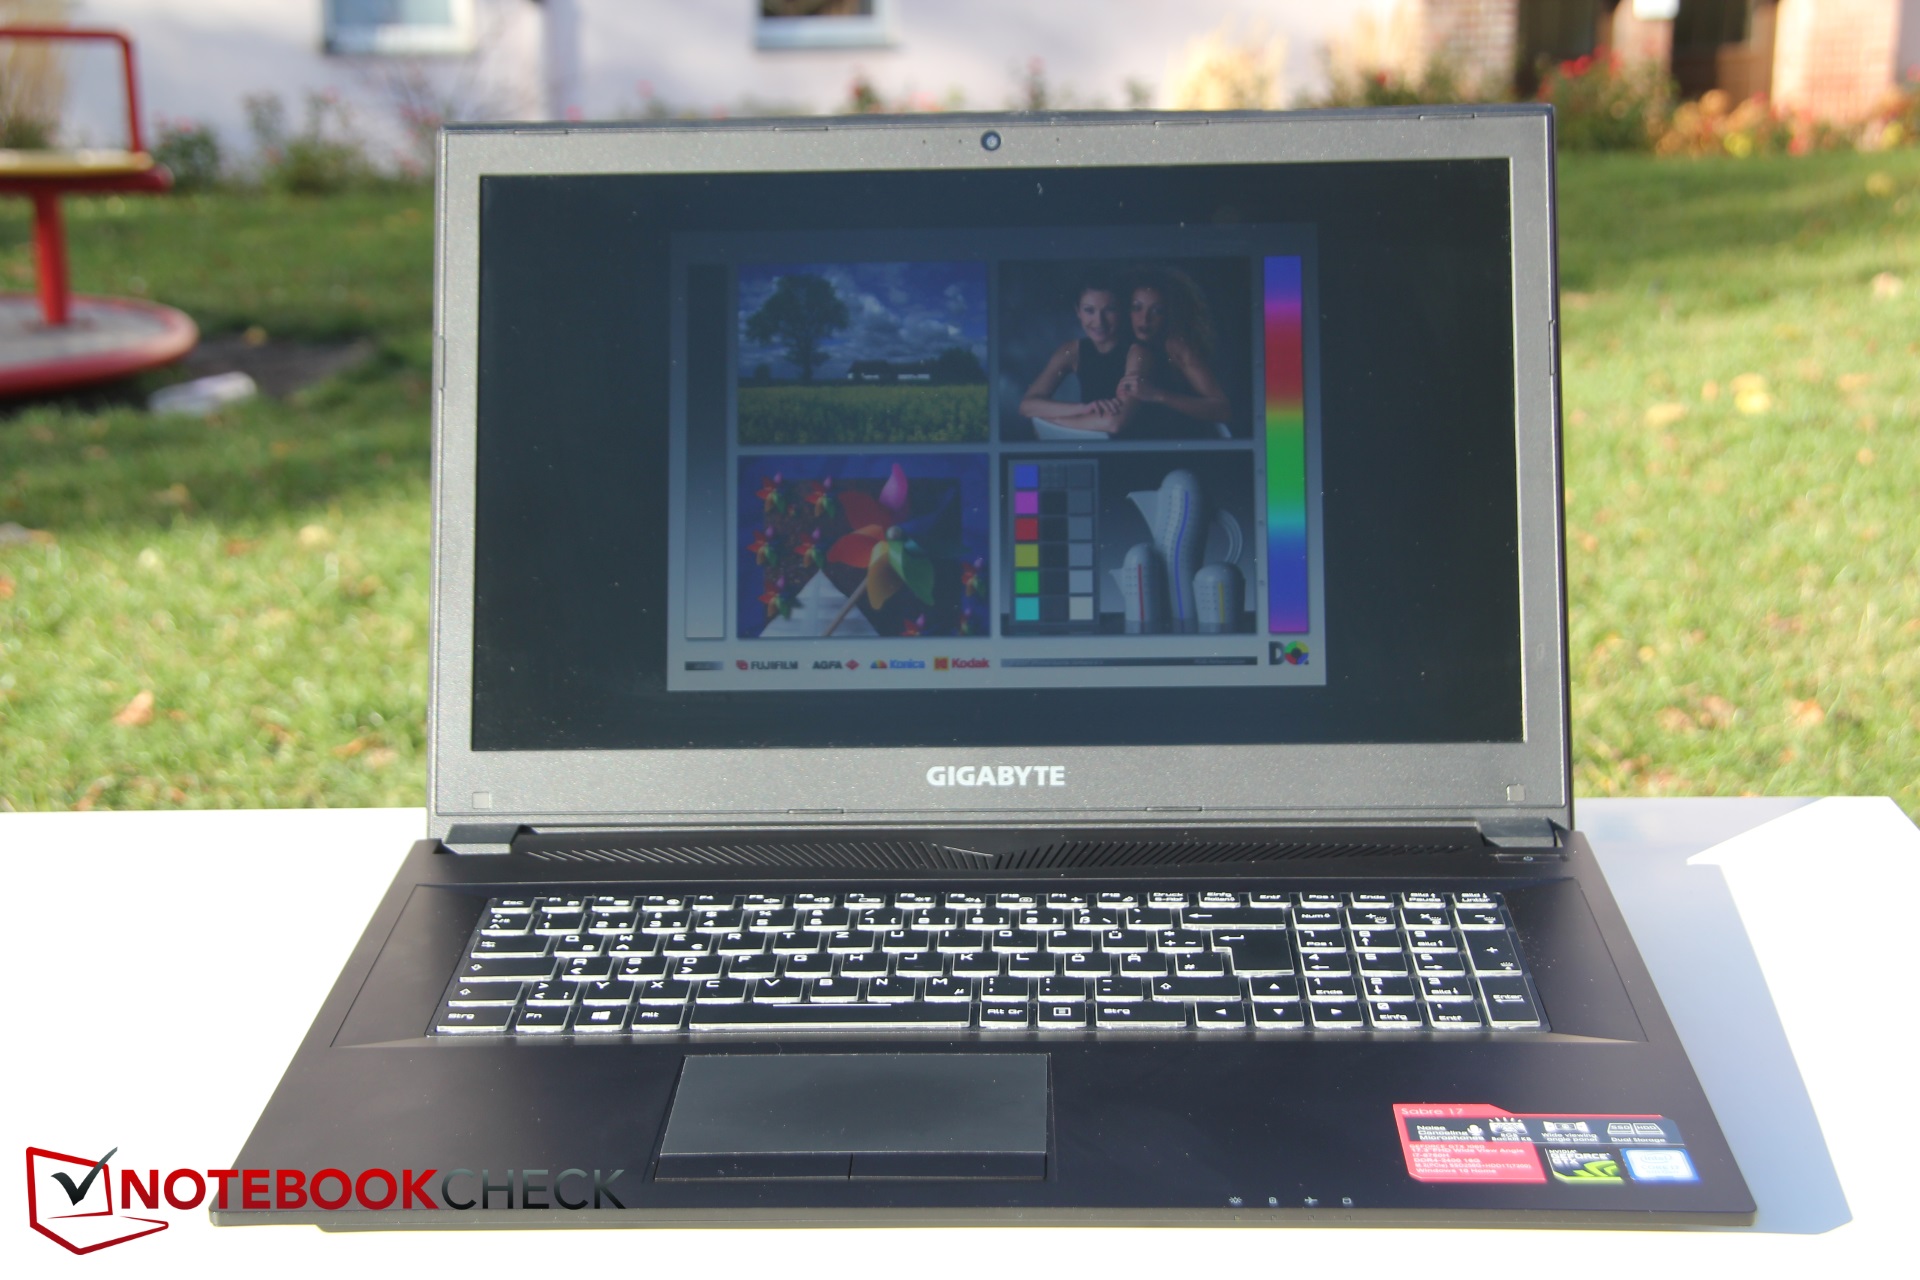
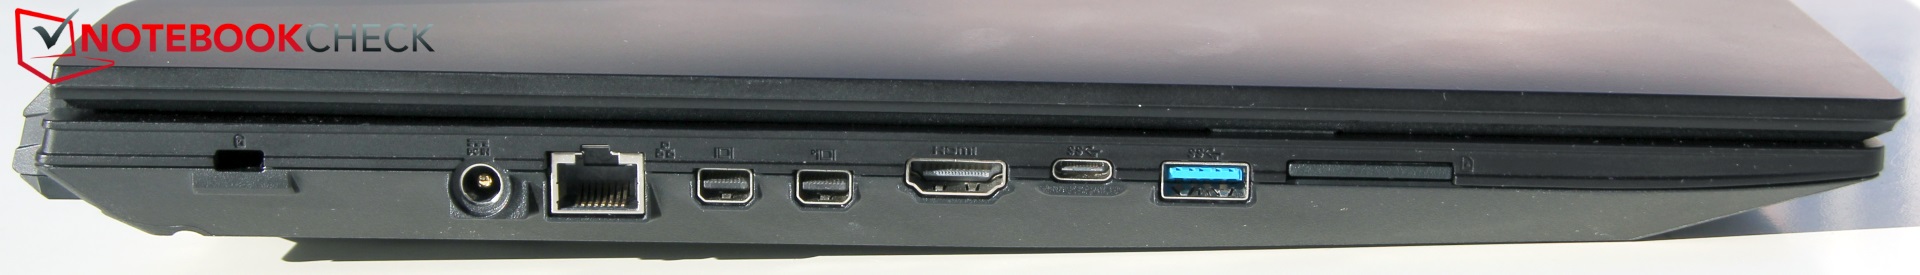
A tela é claramente projetada para jogos e oferece tempos de resposta muito bons, embora em troca os usuários tenham que ficar sem cores brilhantes. Em quase todos os aspectos, o desempenho do portátil é mais do que satisfatório - exceto em termos de jogos, onde seus rivais diretos têm um desempenho melhor. O Sabre supera a concorrência em outras aplicações, por exemplo, nos benchmarks Cinebench. Seu balanço energético também é bom. Mesmo sob carga, o Gigabyte permanece sempre frio e silencioso. Ele marca pontos adicionais em termos de consumo de energia e duração da bateria. As muitas conexões para monitores externos também são um ótimo recurso.
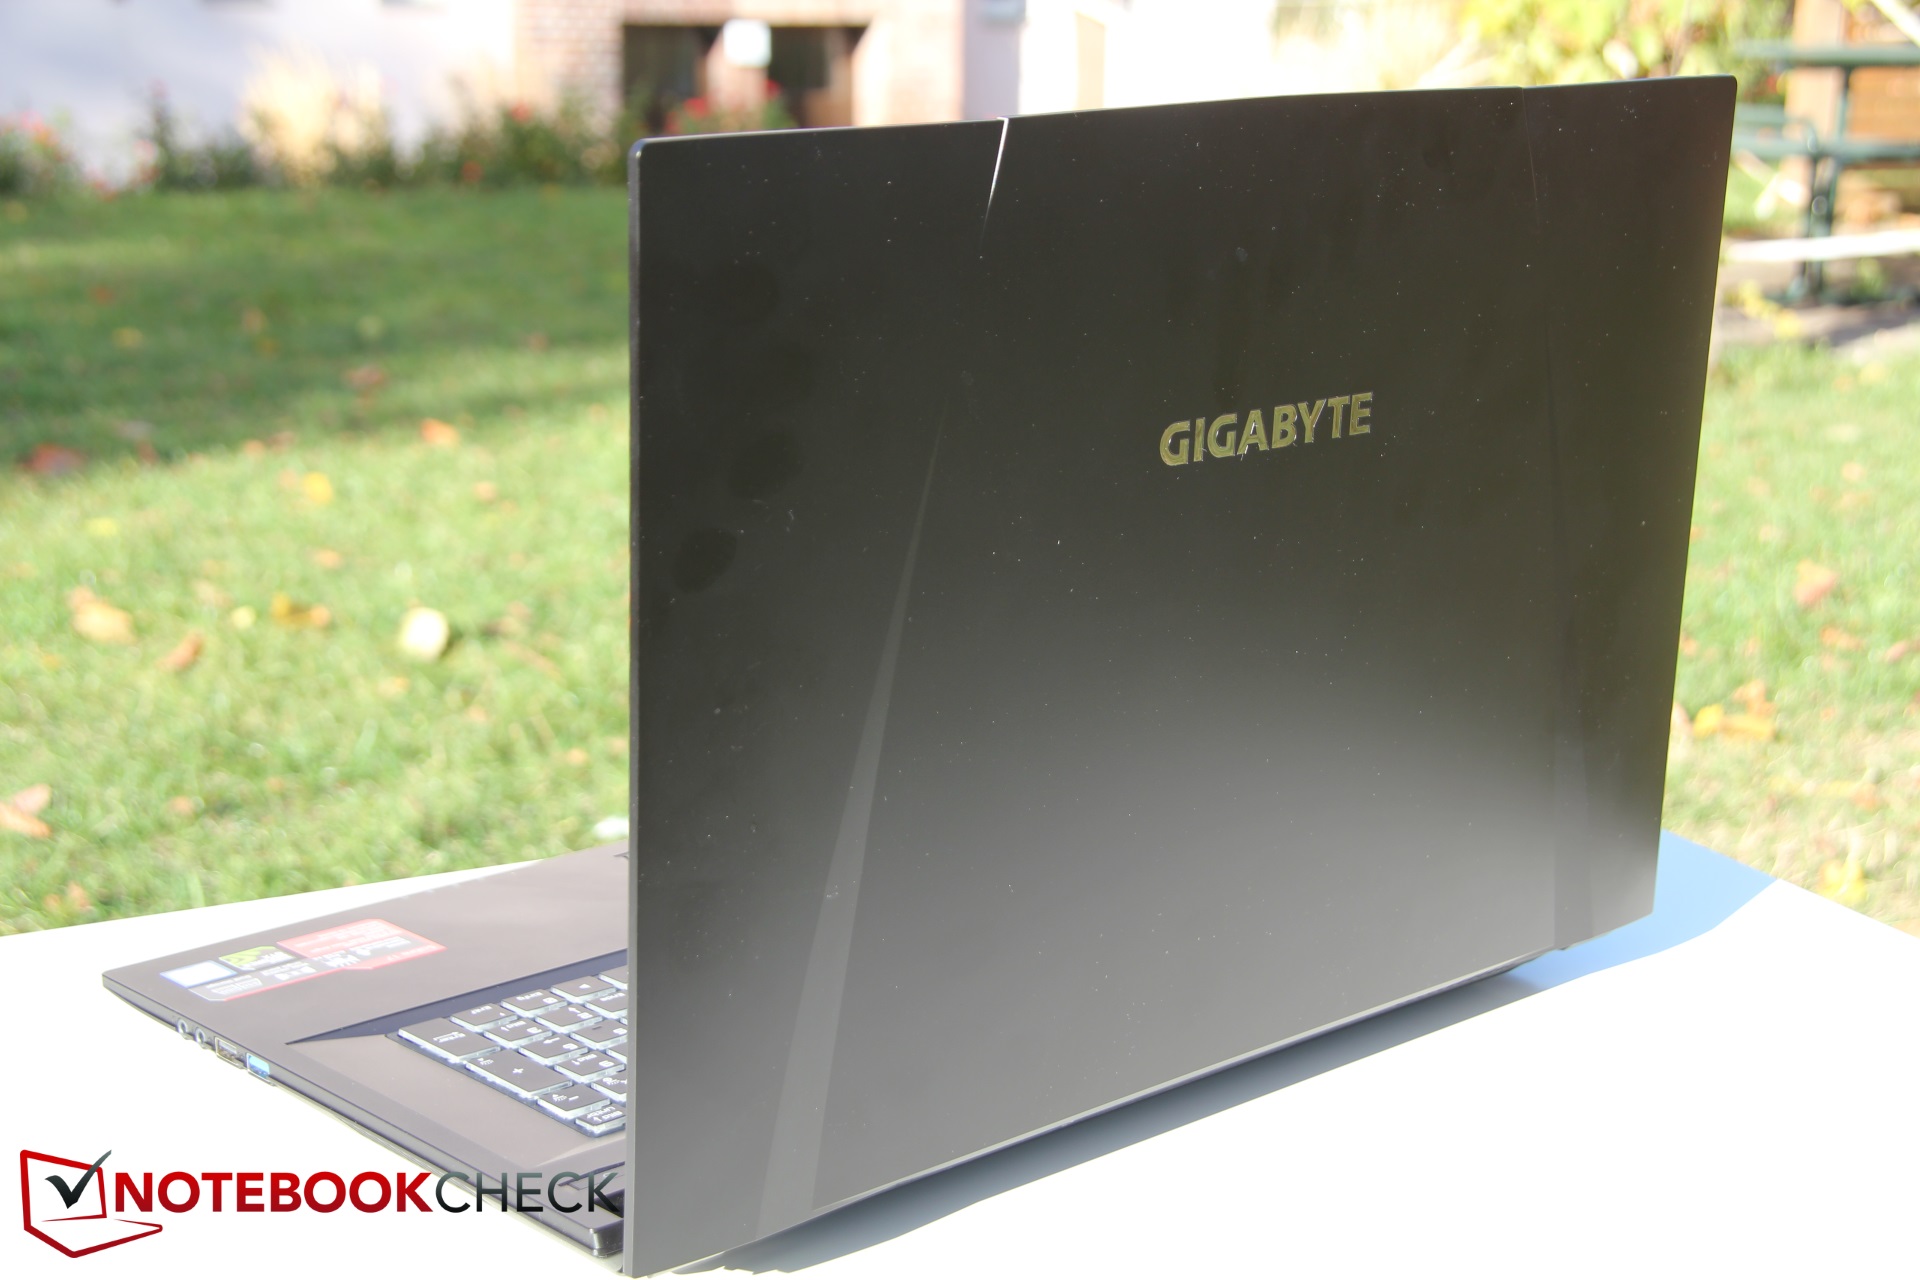
O Sabre merece críticas por seu fraco desempenho em jogos e seus alto-falantes muito pequenos e fracos. O Sabre 17 perde desnecessariamente alguns pontos nesta primeira contagem. O portátil pode ser comprado por cerca de 1500 Euros (~$1700).
Os compradores em potencial que procuram por um substituto de desktop silencioso, frio e comparativamente economizador de energia, estão no lugar certo com o Sabre 17. Mas se o desempenho dos jogos for uma prioridade, seria melhor procurar uma alternativa.
Gigabyte Sabre 17-W8
- 11/01/2018 v6 (old)
Christian Hintze