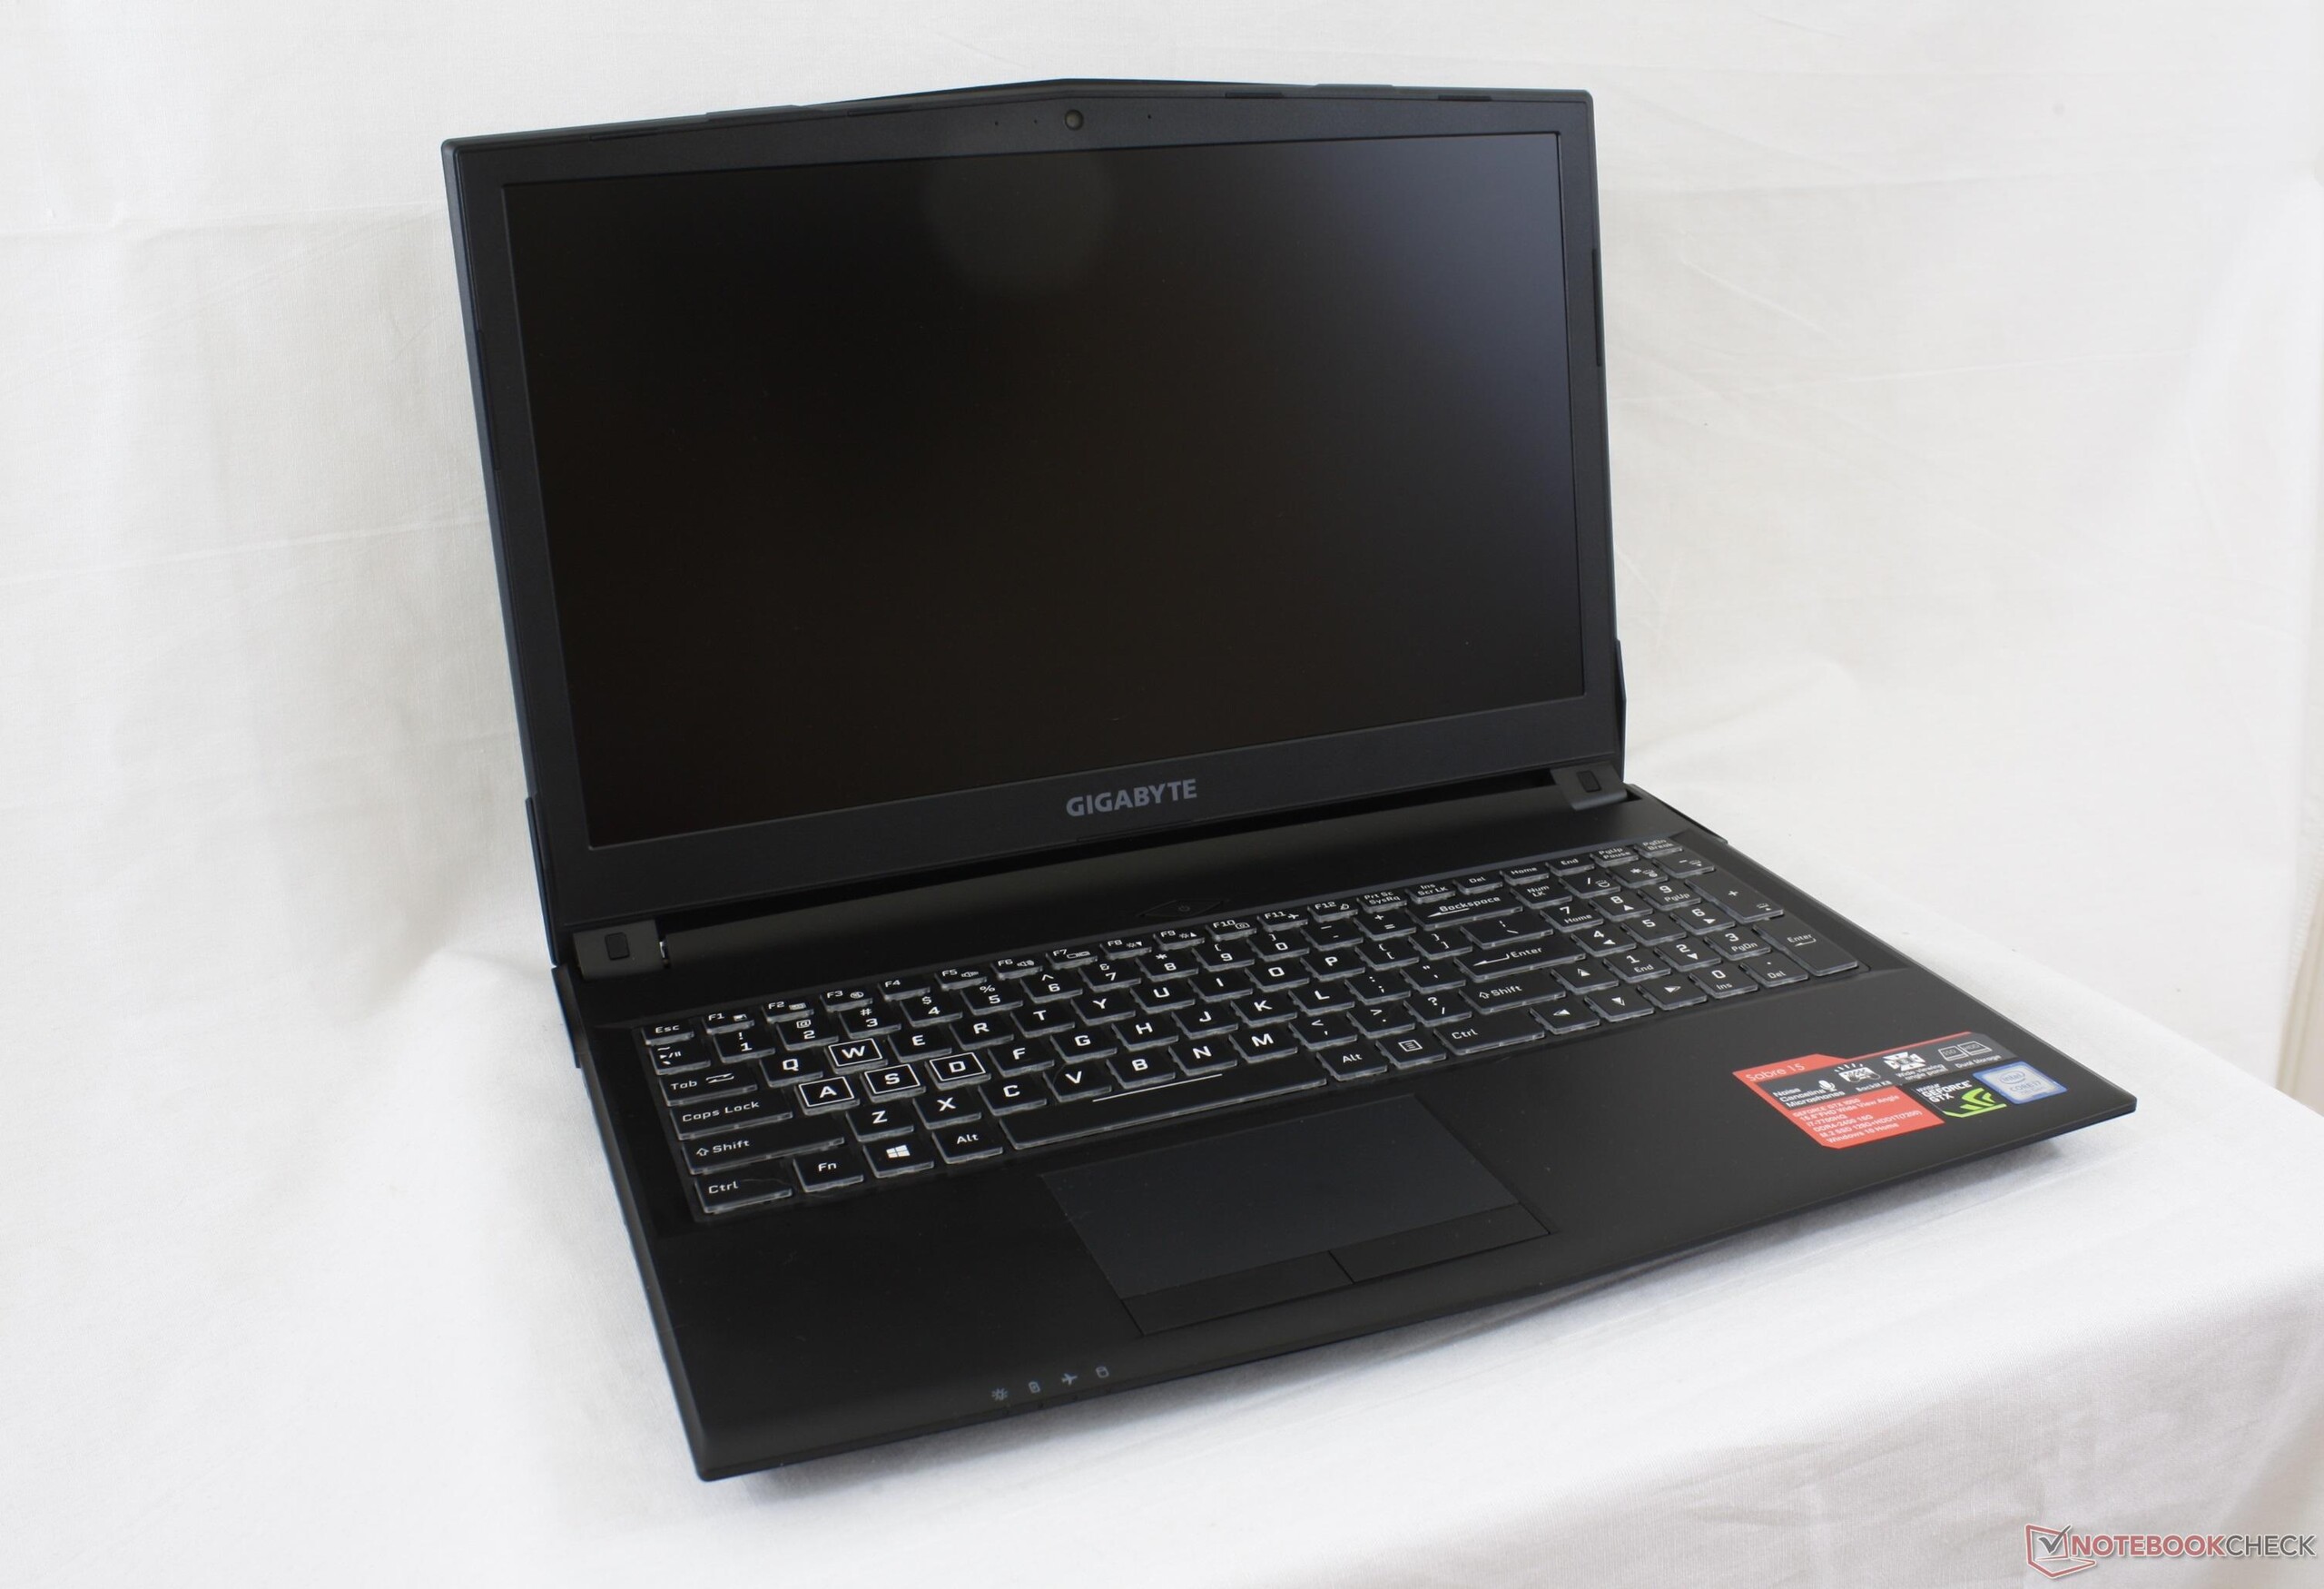
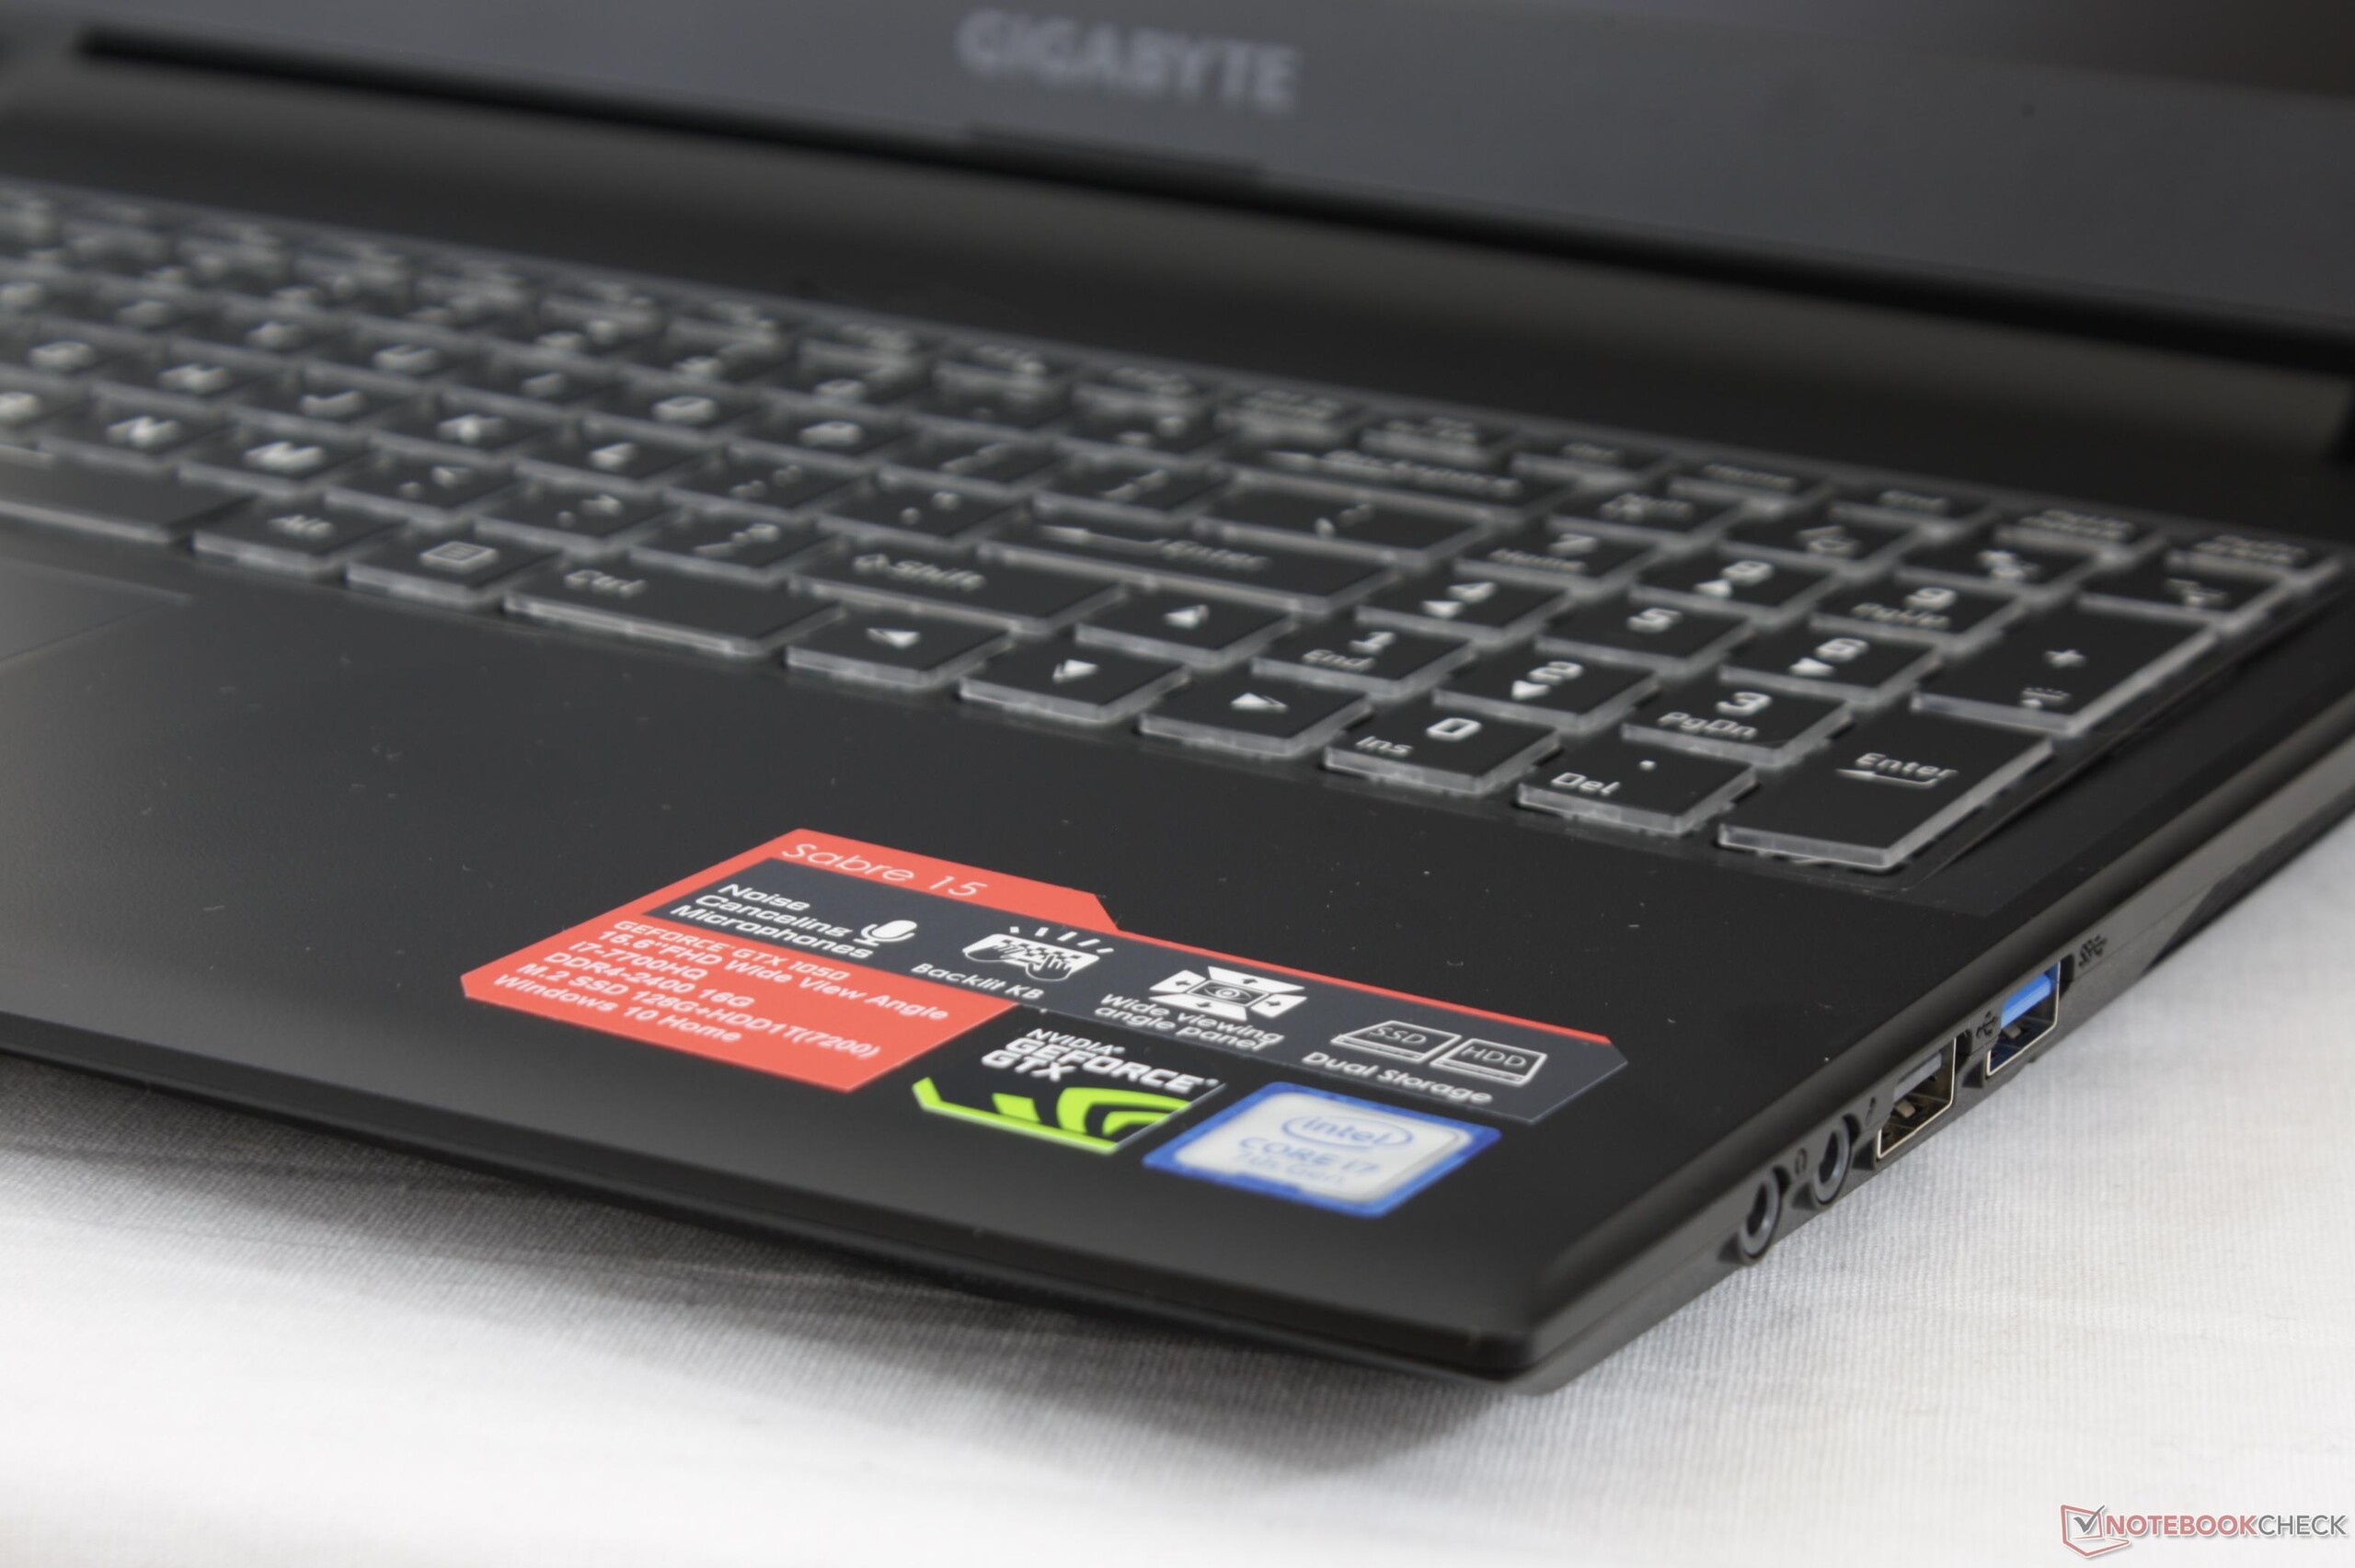
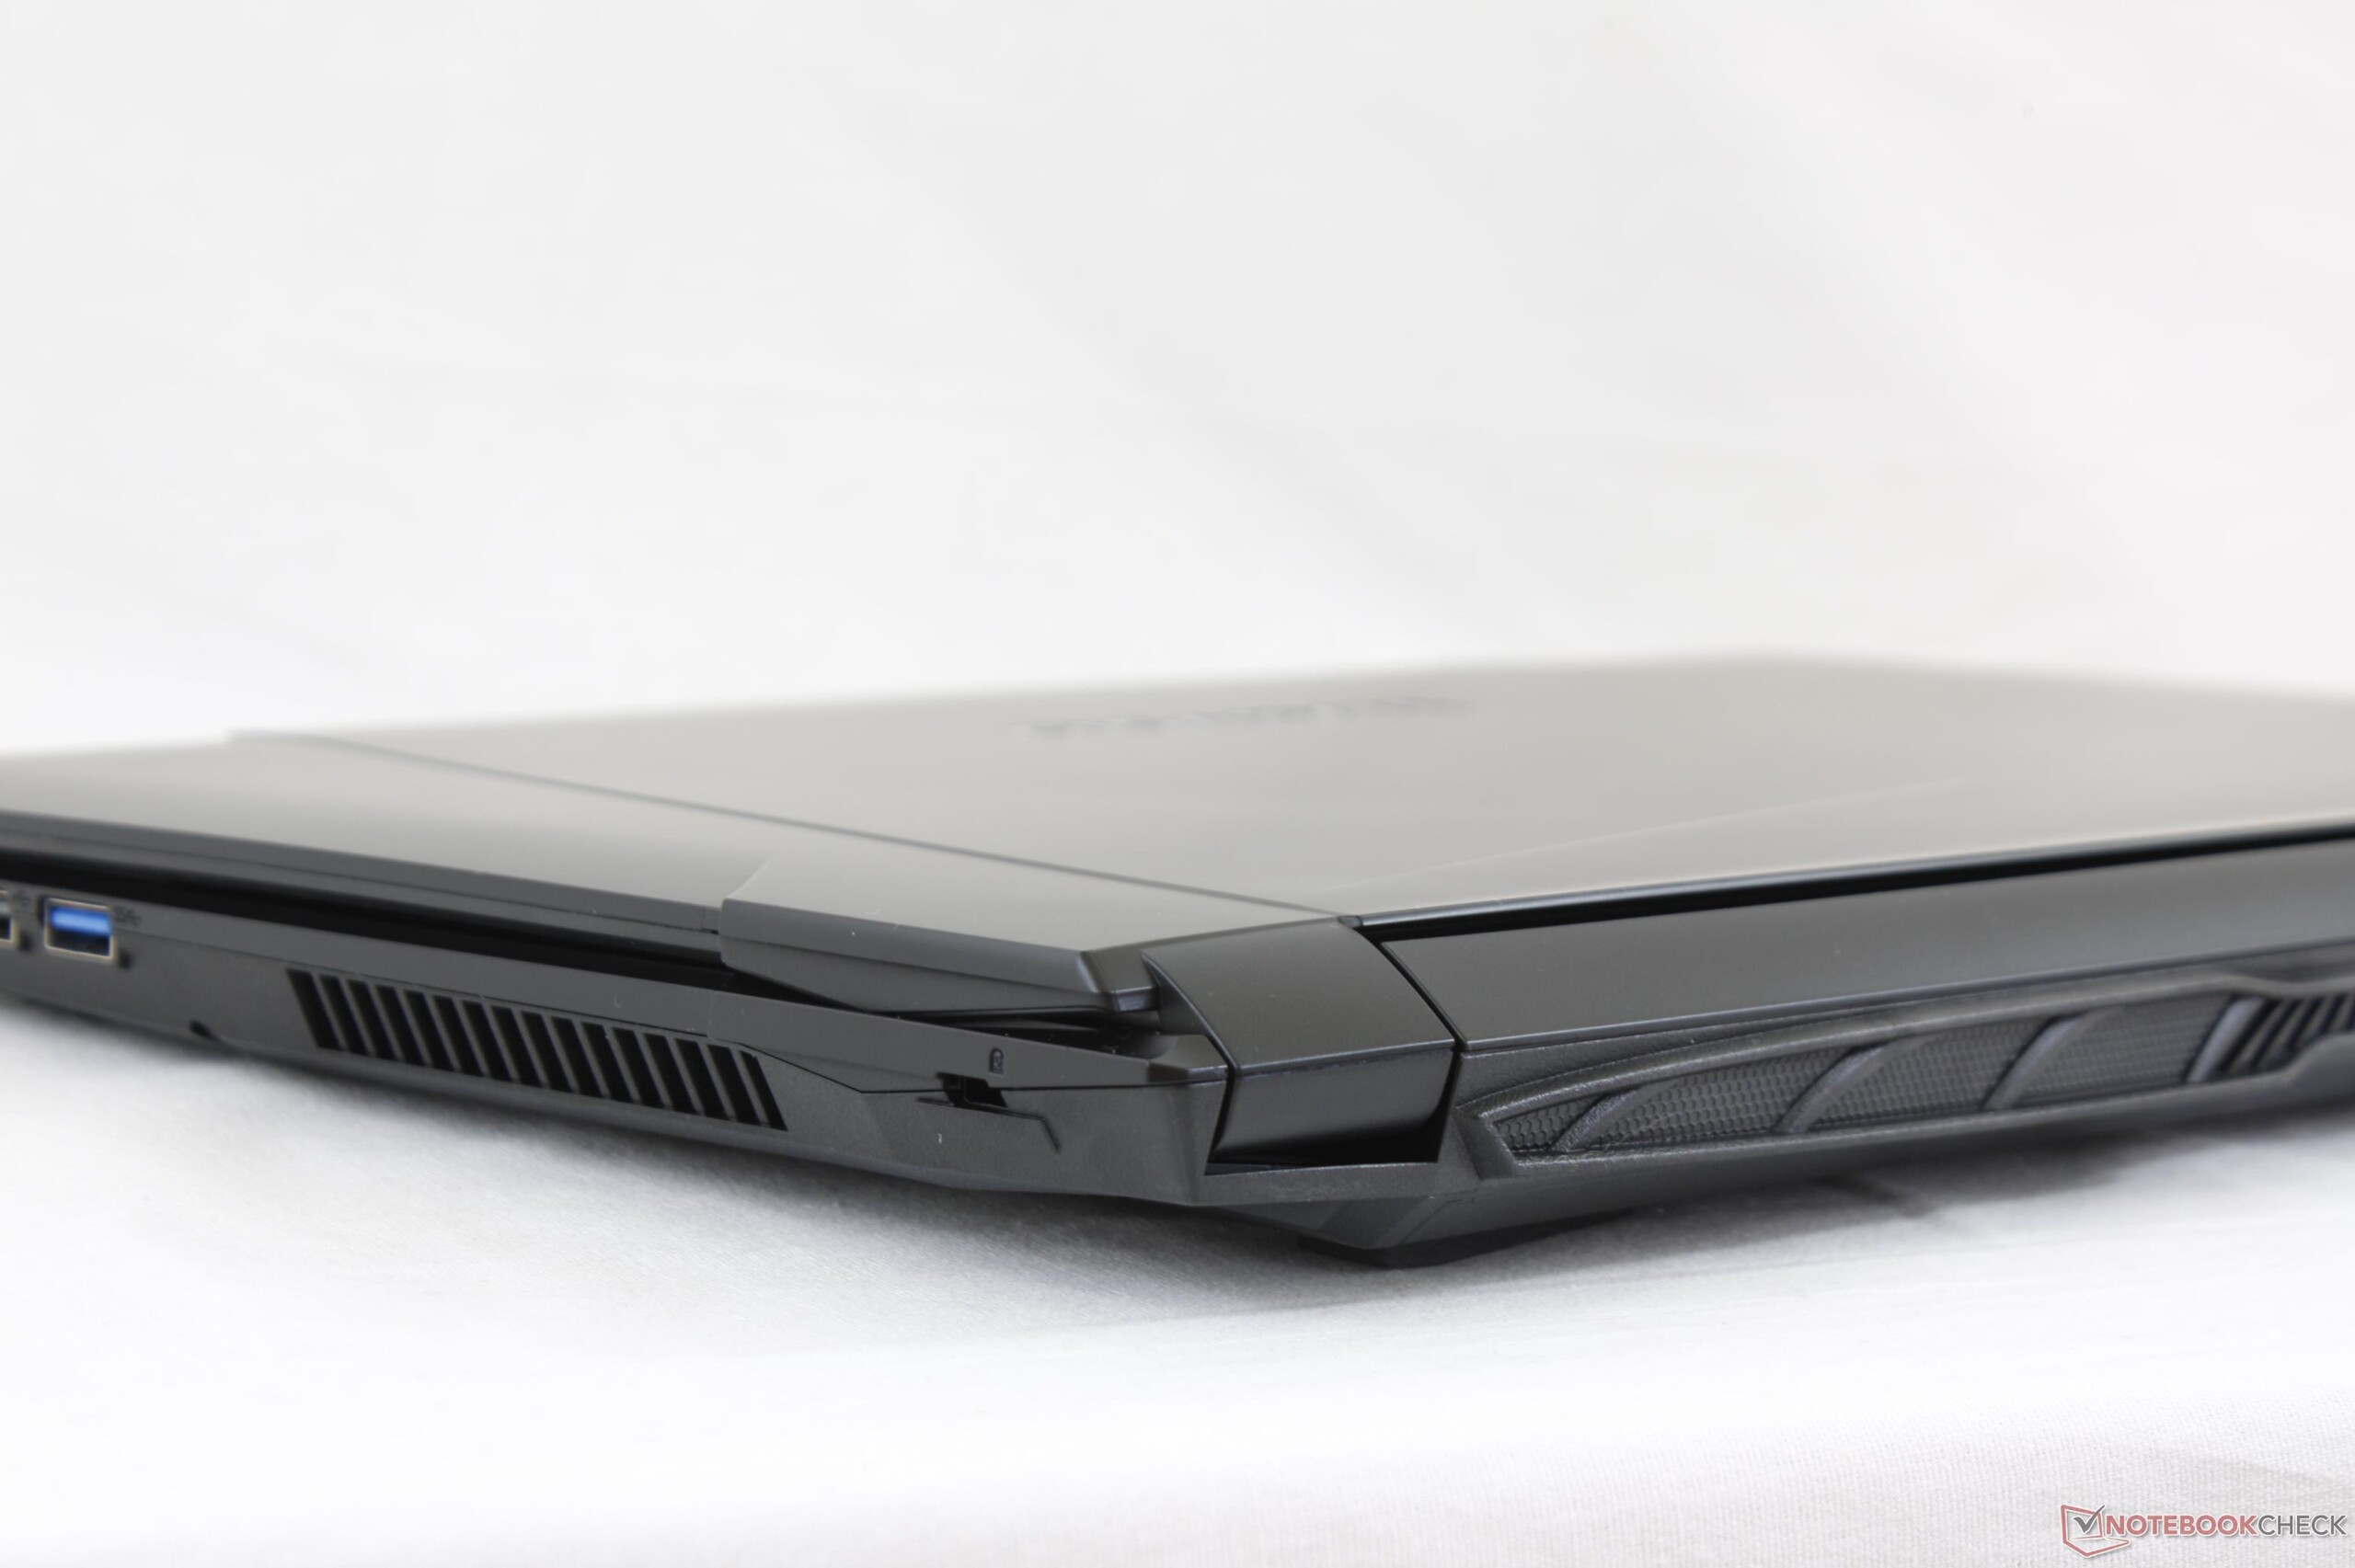
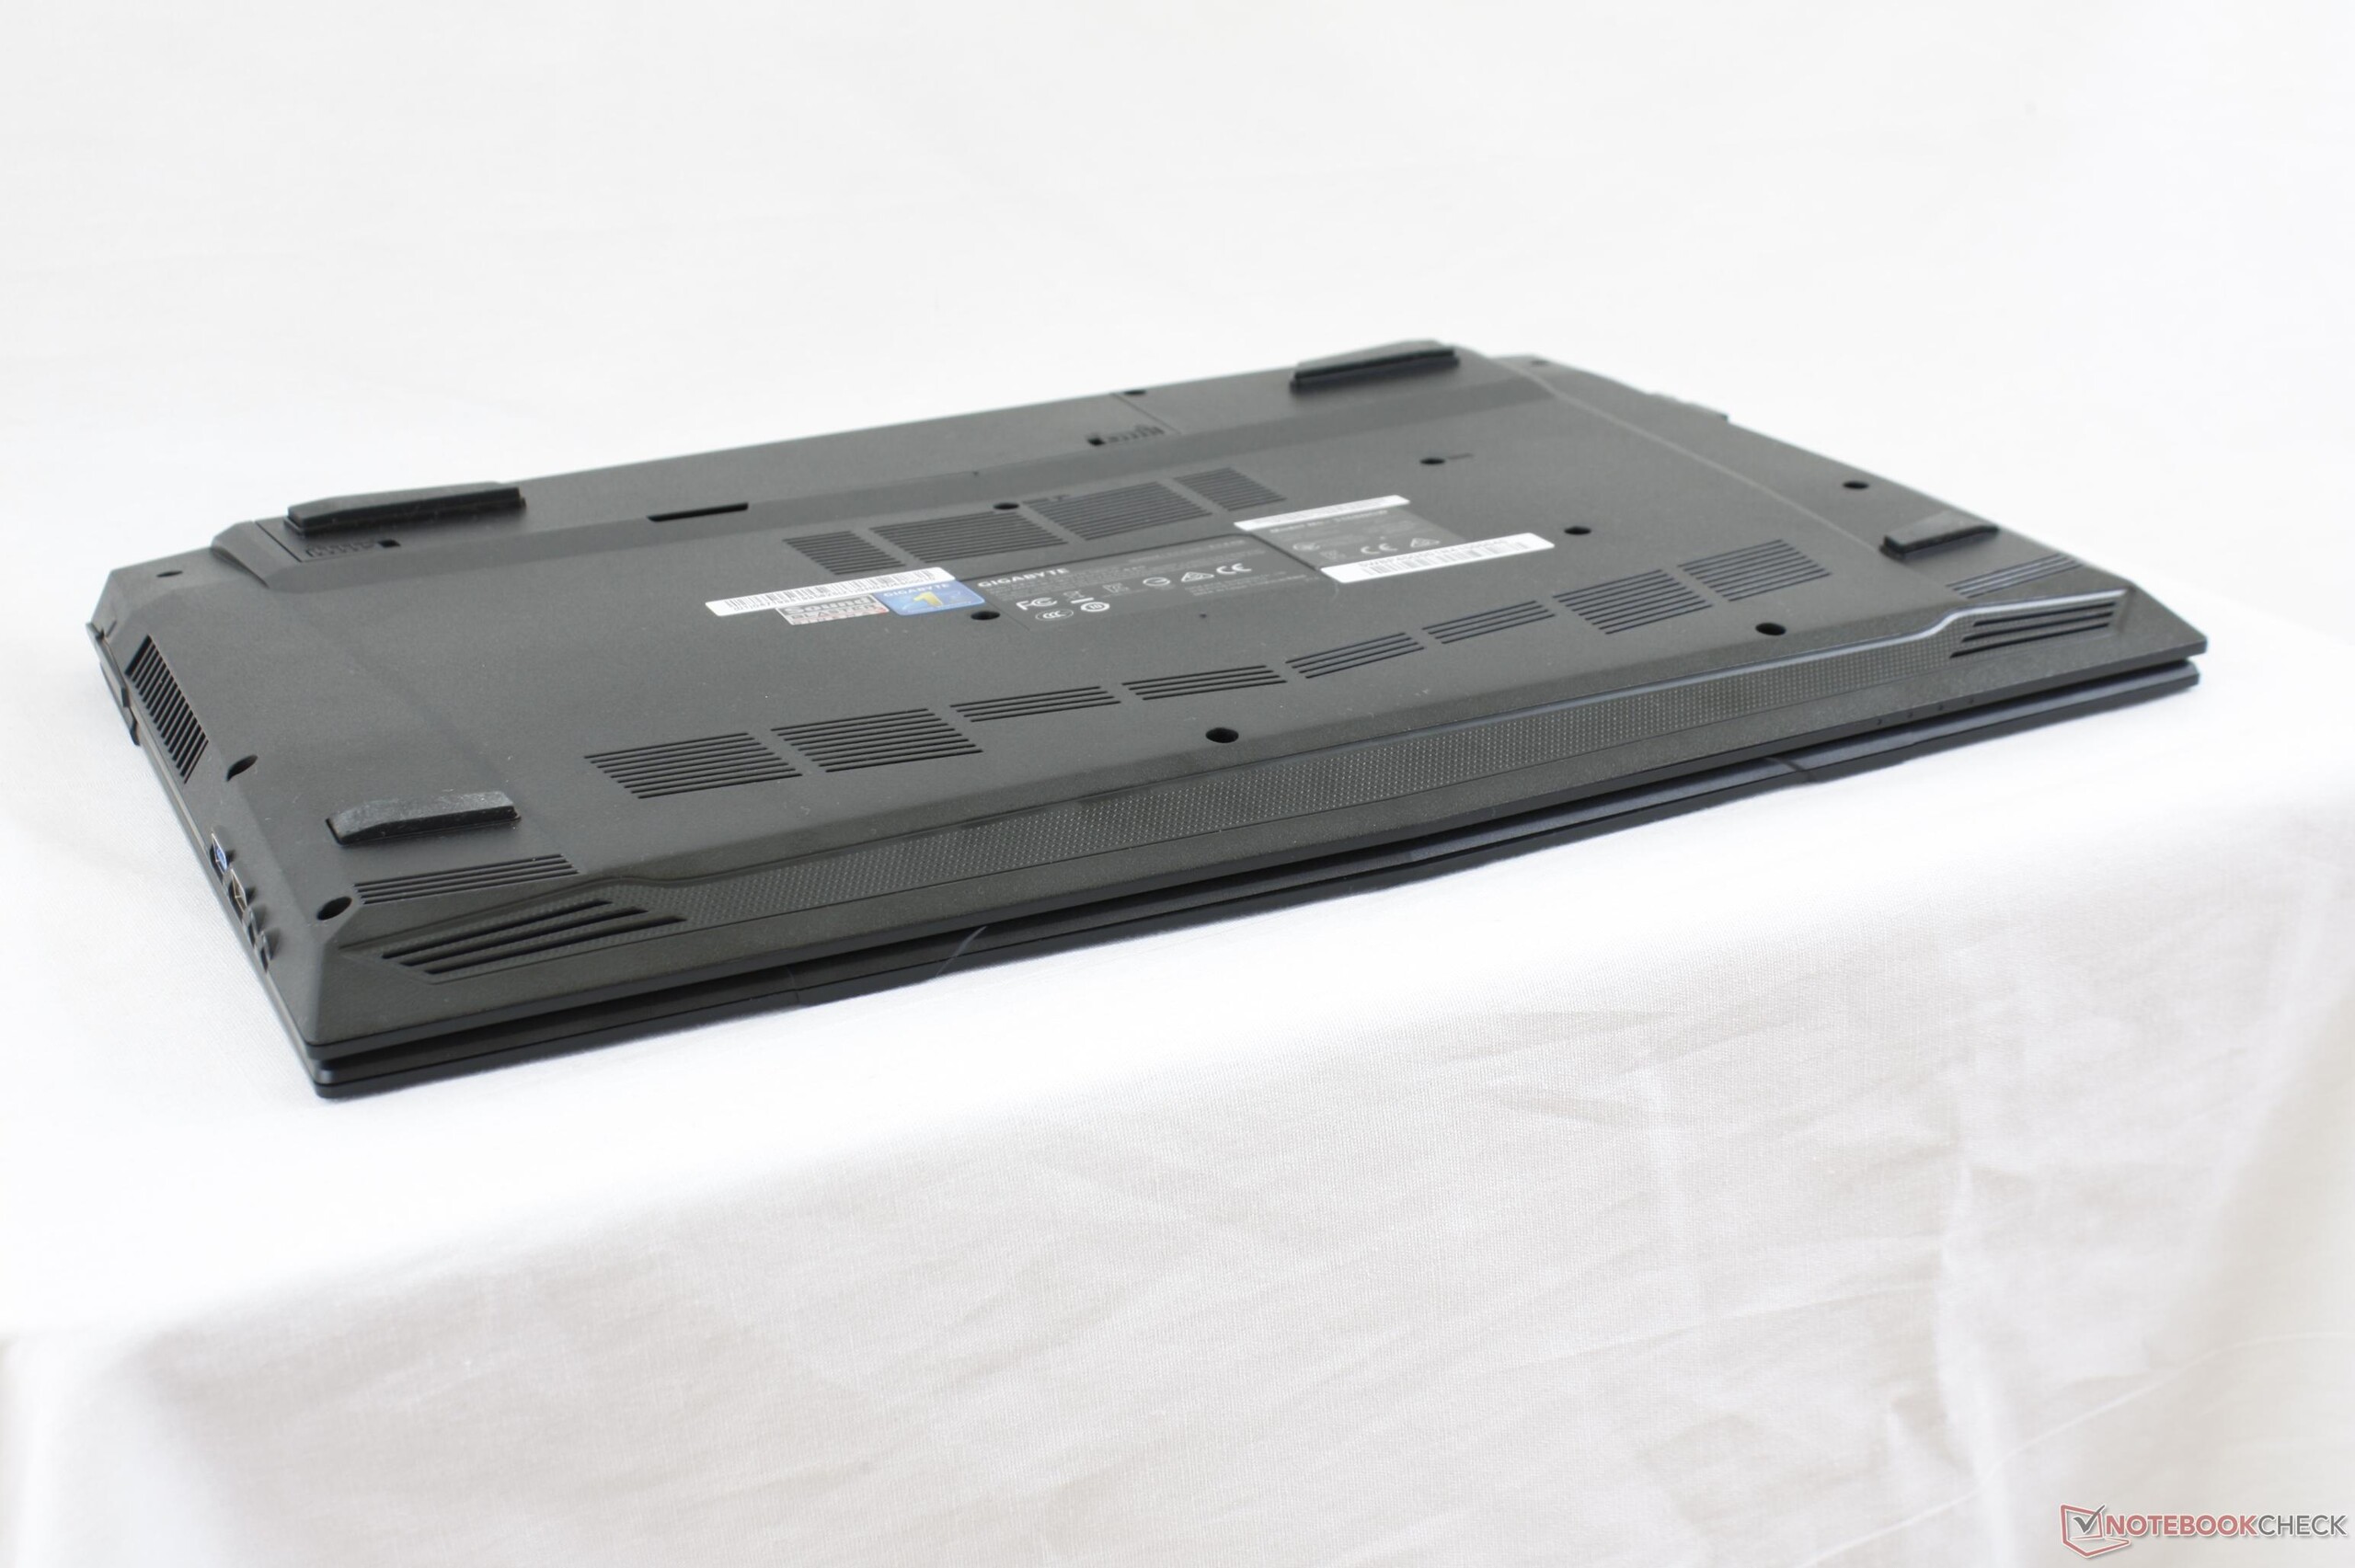
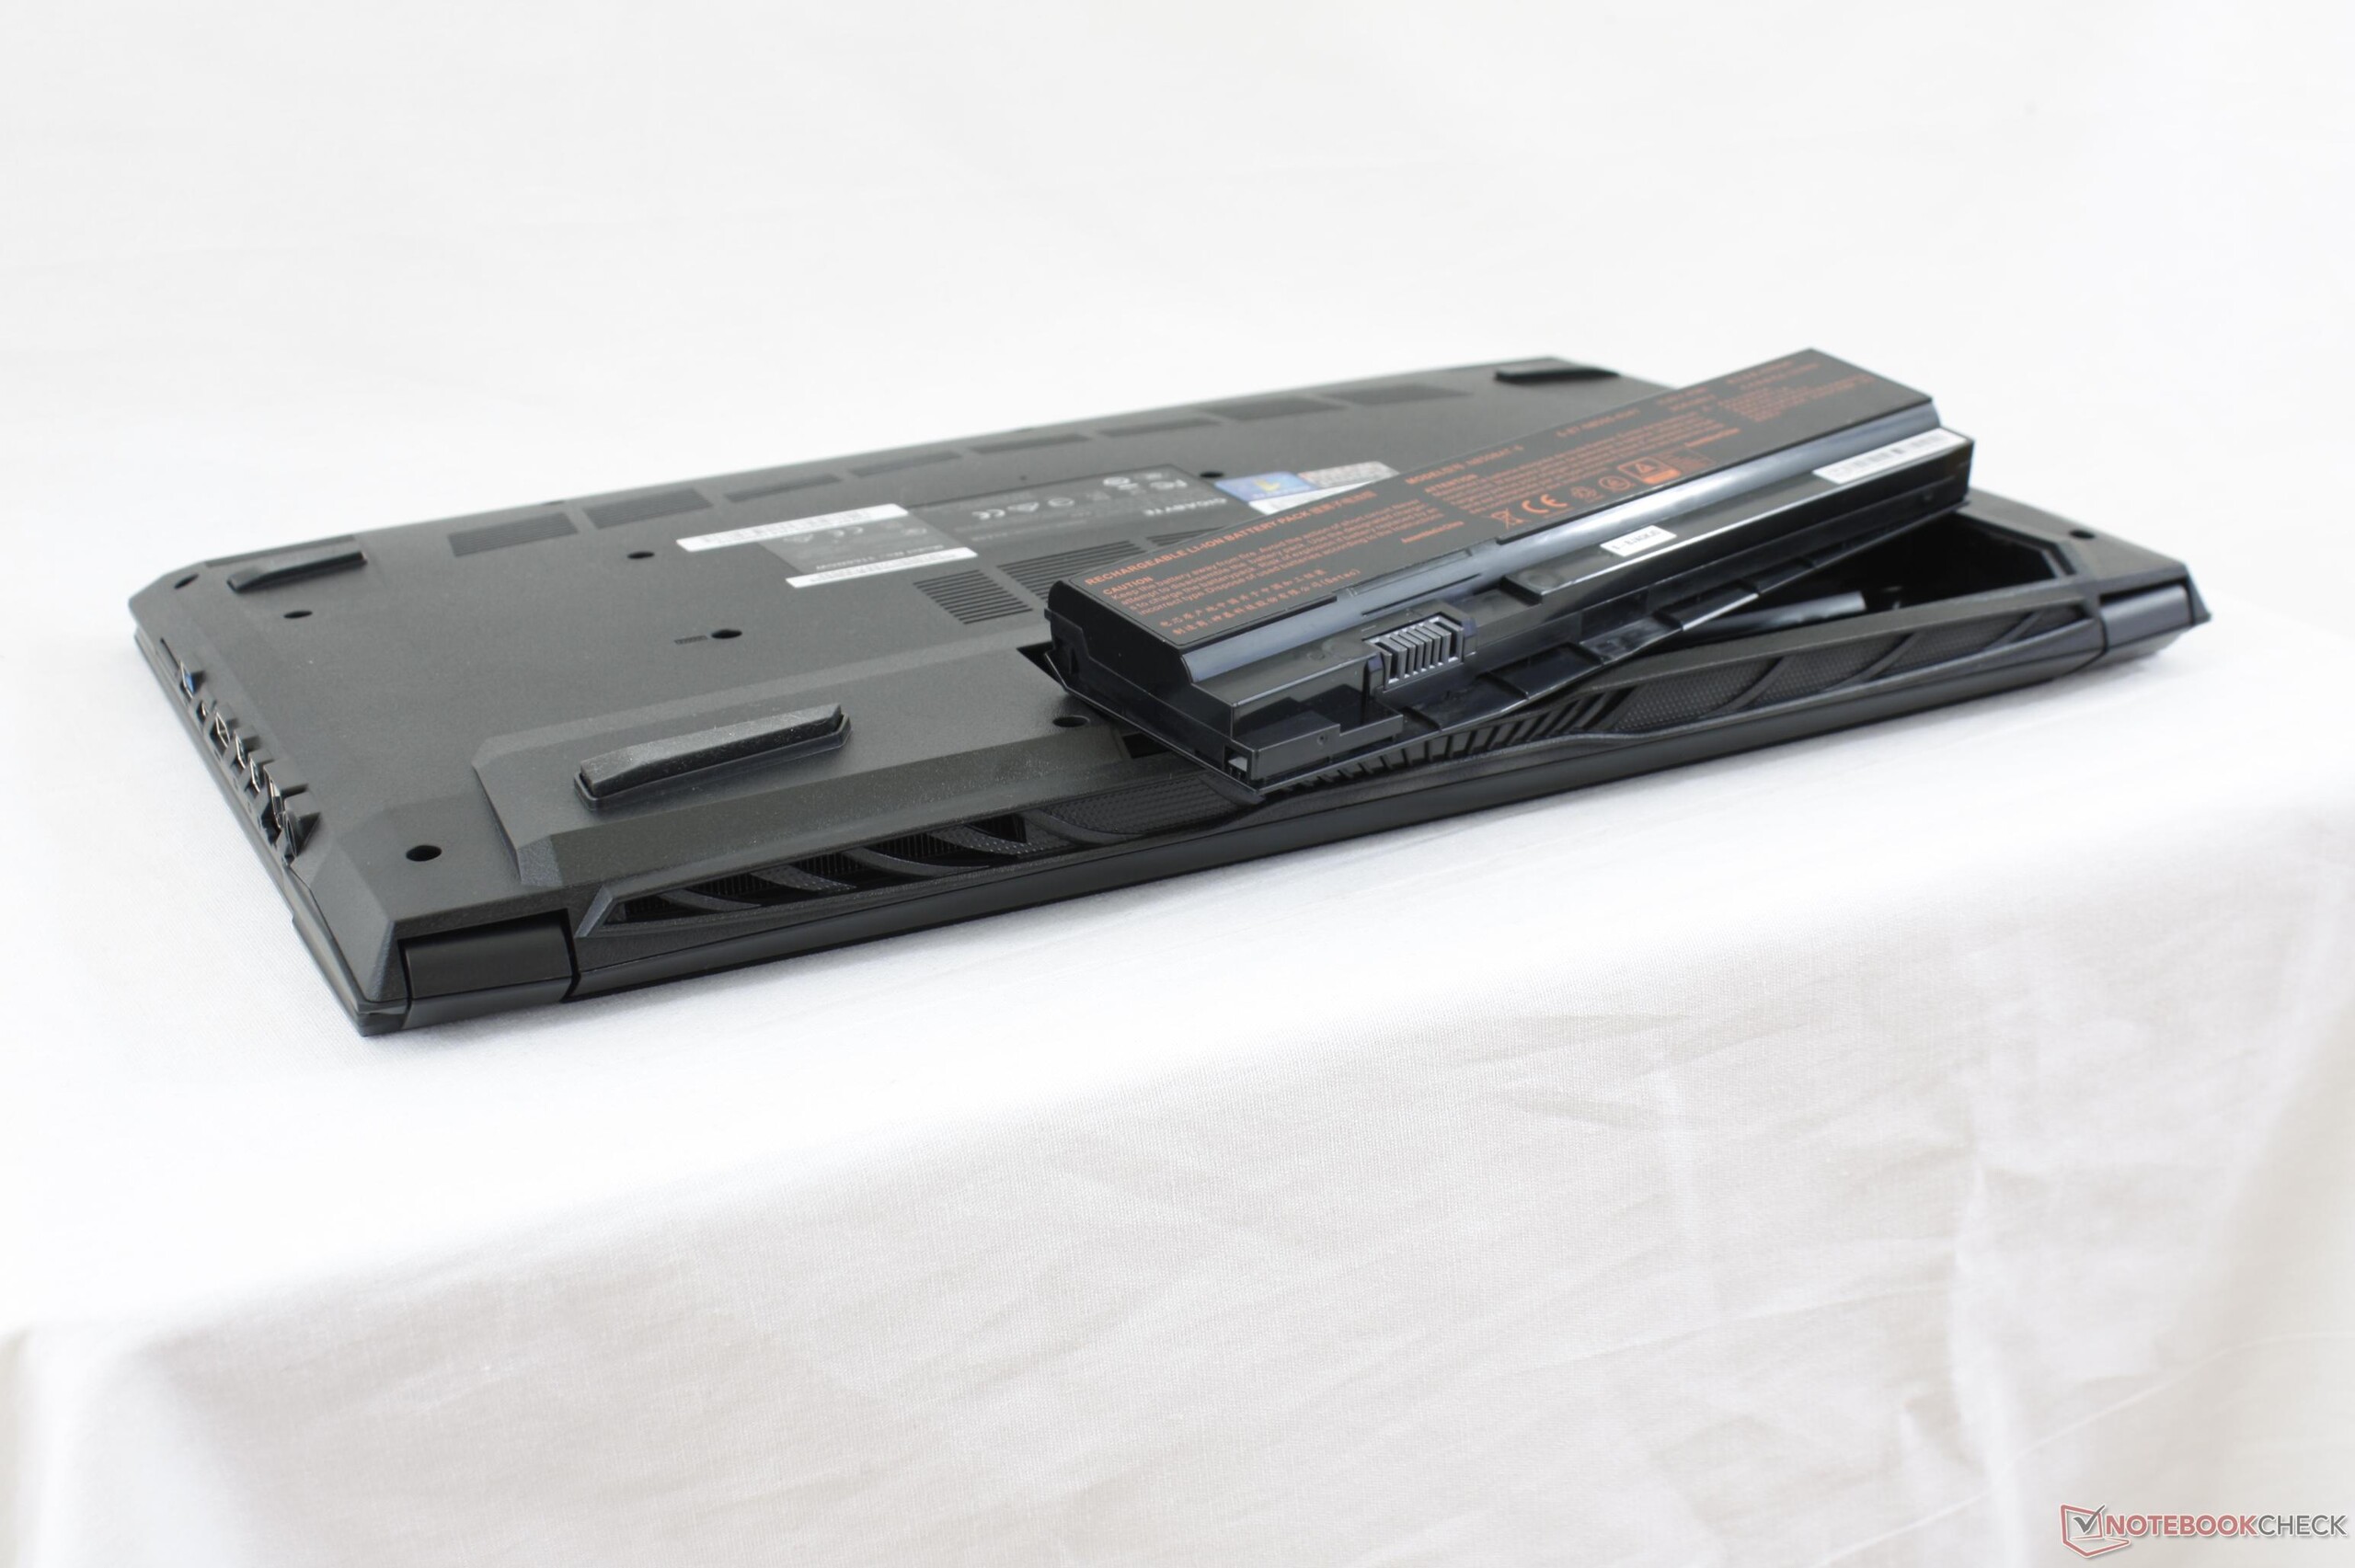
Breve Análise do Portátil Gigabyte Sabre 15 (i7-7700HQ, GTX 1050)
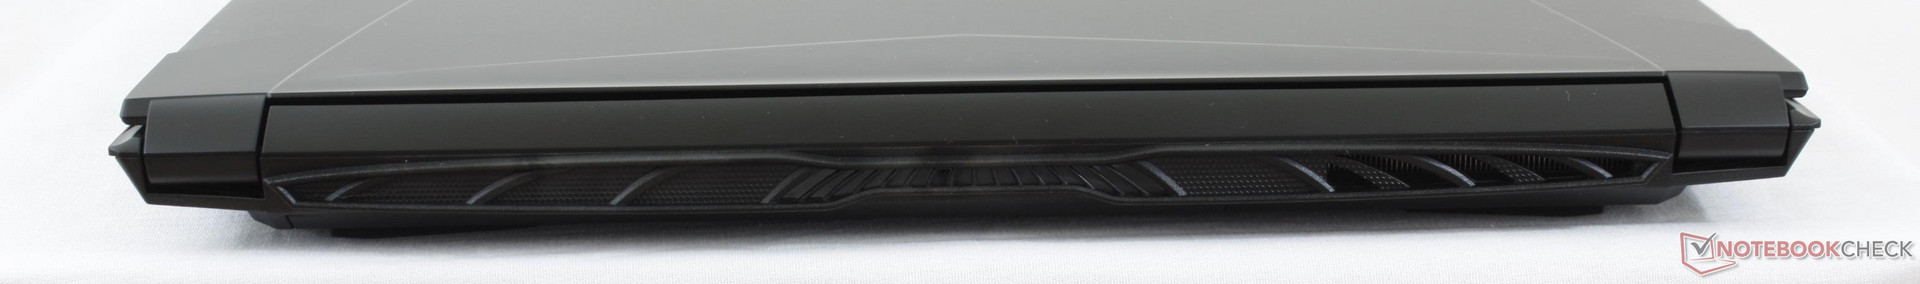
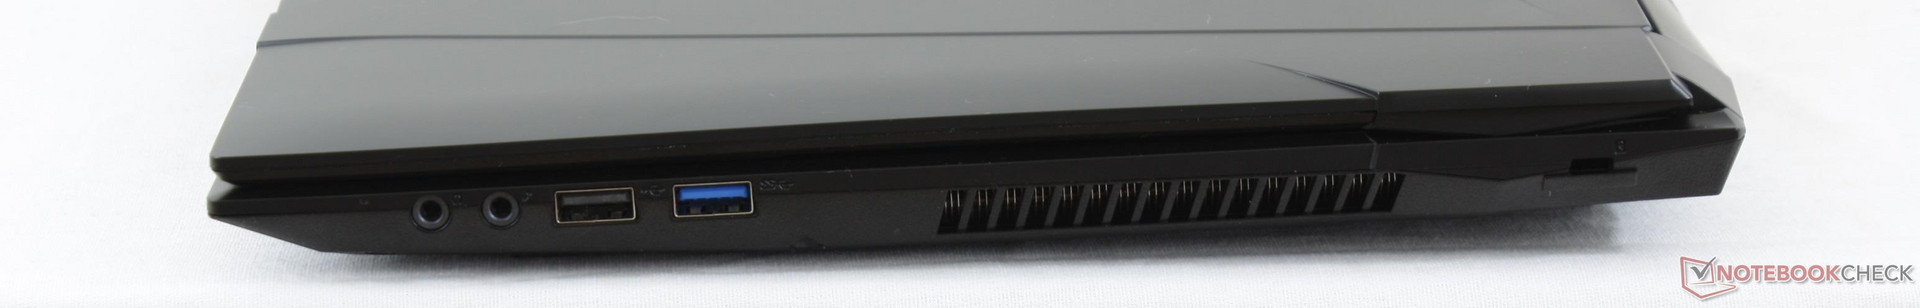
| SD Card Reader | |
| average JPG Copy Test (av. of 3 runs) | |
| Dell XPS 15 9560 (i7-7700HQ, UHD) | |
| Gigabyte Sabre 15G | |
| Gigabyte Aero 15 | |
| maximum AS SSD Seq Read Test (1GB) | |
| Dell XPS 15 9560 (i7-7700HQ, UHD) | |
| Gigabyte Aero 15 | |
| Gigabyte Sabre 15G | |
| Networking | |
| iperf3 transmit AX12 | |
| Dell XPS 15 9560 (i7-7700HQ, UHD) | |
| Samsung Odyssey NP800G5M-X01US | |
| Gigabyte Sabre 15G | |
| iperf3 receive AX12 | |
| Dell XPS 15 9560 (i7-7700HQ, UHD) | |
| Samsung Odyssey NP800G5M-X01US | |
| Gigabyte Sabre 15G | |
| |||||||||||||||||||||||||
iluminação: 84 %
iluminação com acumulador: 248.4 cd/m²
Contraste: 828:1 (Preto: 0.3 cd/m²)
ΔE ColorChecker Calman: 7.5 | ∀{0.5-29.43 Ø4.71}
ΔE Greyscale Calman: 6.5 | ∀{0.09-98 Ø4.96}
57.9% sRGB (Argyll 1.6.3 3D)
37% AdobeRGB 1998 (Argyll 1.6.3 3D)
40.3% AdobeRGB 1998 (Argyll 3D)
58.2% sRGB (Argyll 3D)
38.97% Display P3 (Argyll 3D)
Gamma: 2.19
CCT: 7852 K
| Gigabyte Sabre 15G ID: LGD0533, Name: LG Display LP156WF6-SPK3, IPS, 15.6", 1920x1080 | Dell XPS 15 9560 (i7-7700HQ, UHD) IGZO IPS, 15.6", 3840x2160 | Gigabyte Aero 15 N156HCA-EA1 (CMN15D7), IPS, 15.6", 1920x1080 | HP Omen 15-ce002ng AUO42ED, IPS, 15.6", 1920x1080 | Samsung Odyssey NP800G5M-X01US IPS, 15.6", 1920x1080 | MSI GT62VR 7RE-223 LG Philips LP156WF6 (LGD046F), IPS, 15.6", 1920x1080 | |
|---|---|---|---|---|---|---|
| Display | 117% | 64% | 63% | 21% | 53% | |
| Display P3 Coverage (%) | 38.97 | 89.7 130% | 65.2 67% | 65.8 69% | 47.11 21% | 63.9 64% |
| sRGB Coverage (%) | 58.2 | 100 72% | 92.5 59% | 90.9 56% | 70.4 21% | 83.1 43% |
| AdobeRGB 1998 Coverage (%) | 40.3 | 100 148% | 66.5 65% | 66.5 65% | 48.71 21% | 60.8 51% |
| Response Times | -66% | -30% | -29% | -26% | -7% | |
| Response Time Grey 50% / Grey 80% * (ms) | 32 ? | 57.2 ? -79% | 42.8 ? -34% | 43.2 ? -35% | 38.8 ? -21% | 37 ? -16% |
| Response Time Black / White * (ms) | 25.6 ? | 39.2 ? -53% | 32 ? -25% | 31.2 ? -22% | 33.6 ? -31% | 25 ? 2% |
| PWM Frequency (Hz) | 20000 ? | 962 | 26000 ? | 19230 ? | ||
| Screen | 43% | 28% | 40% | 2% | 30% | |
| Brightness middle (cd/m²) | 248.4 | 370.1 49% | 320 29% | 304 22% | 255.9 3% | 310 25% |
| Brightness (cd/m²) | 241 | 356 48% | 316 31% | 289 20% | 249 3% | 311 29% |
| Brightness Distribution (%) | 84 | 87 4% | 90 7% | 86 2% | 90 7% | 85 1% |
| Black Level * (cd/m²) | 0.3 | 0.37 -23% | 0.36 -20% | 0.26 13% | 0.48 -60% | 0.3 -0% |
| Contrast (:1) | 828 | 1000 21% | 889 7% | 1169 41% | 533 -36% | 1033 25% |
| Colorchecker dE 2000 * | 7.5 | 5.3 29% | 4.62 38% | 3.46 54% | 5.9 21% | 4.82 36% |
| Colorchecker dE 2000 max. * | 25.2 | 9.9 61% | 9.75 61% | 7.72 69% | 18.9 25% | 10.14 60% |
| Greyscale dE 2000 * | 6.5 | 4.6 29% | 6 8% | 2.46 62% | 5.6 14% | 3.94 39% |
| Gamma | 2.19 100% | 2.31 95% | 2.46 89% | 2.38 92% | 2.21 100% | 2.45 90% |
| CCT | 7852 83% | 6284 103% | 6761 96% | 6915 94% | 7250 90% | 6877 95% |
| Color Space (Percent of AdobeRGB 1998) (%) | 37 | 88.3 139% | 60 62% | 59 59% | 44.8 21% | 54 46% |
| Color Space (Percent of sRGB) (%) | 57.9 | 100 73% | 92 59% | 91 57% | 70.1 21% | 83 43% |
| Média Total (Programa/Configurações) | 31% /
43% | 21% /
28% | 25% /
35% | -1% /
2% | 25% /
30% |
* ... menor é melhor
Exibir tempos de resposta
| ↔ Tempo de resposta preto para branco | ||
|---|---|---|
| 25.6 ms ... ascensão ↗ e queda ↘ combinadas | ↗ 15.6 ms ascensão | 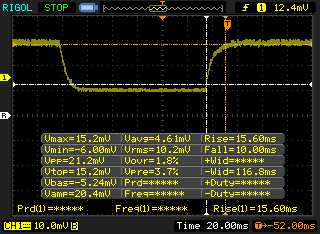 |
| ↘ 10 ms queda | ||
| A tela mostra taxas de resposta relativamente lentas em nossos testes e pode ser muito lenta para os jogadores. Em comparação, todos os dispositivos testados variam de 0.1 (mínimo) a 240 (máximo) ms. » 61 % de todos os dispositivos são melhores. Isso significa que o tempo de resposta medido é pior que a média de todos os dispositivos testados (19.8 ms). | ||
| ↔ Tempo de resposta 50% cinza a 80% cinza | ||
| 32 ms ... ascensão ↗ e queda ↘ combinadas | ↗ 16.4 ms ascensão | 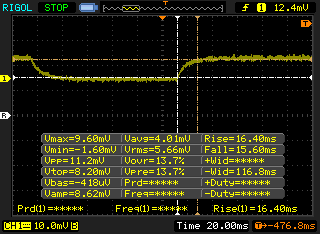 |
| ↘ 15.6 ms queda | ||
| A tela mostra taxas de resposta lentas em nossos testes e será insatisfatória para os jogadores. Em comparação, todos os dispositivos testados variam de 0.165 (mínimo) a 636 (máximo) ms. » 43 % de todos os dispositivos são melhores. Isso significa que o tempo de resposta medido é semelhante à média de todos os dispositivos testados (31 ms). | ||
Cintilação da tela / PWM (modulação por largura de pulso)
| Tela tremeluzindo/PWM detectado | 20000 Hz | ≤ 99 % configuração de brilho | 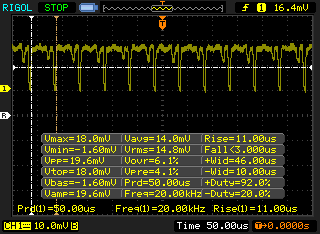 |
A luz de fundo da tela pisca em 20000 Hz (pior caso, por exemplo, utilizando PWM) Cintilação detectada em uma configuração de brilho de 99 % e abaixo. Não deve haver cintilação ou PWM acima desta configuração de brilho. A frequência de 20000 Hz é bastante alta, então a maioria dos usuários sensíveis ao PWM não deve notar nenhuma oscilação. [pwm_comparison] Em comparação: 52 % de todos os dispositivos testados não usam PWM para escurecer a tela. Se PWM foi detectado, uma média de 7754 (mínimo: 5 - máximo: 343500) Hz foi medida. | |||
| wPrime 2.10 - 1024m | |
| Lenovo IdeaPad Y50 | |
| Gigabyte Sabre 15G | |
| Eurocom Sky MX5 R3 | |
| Gigabyte P55 V4 | |
| Eurocom Tornado F5 | |
* ... menor é melhor
| PCMark 8 | |
| Home Score Accelerated v2 | |
| Eurocom Sky MX5 R3 | |
| Gigabyte Aero 15 | |
| Samsung Odyssey NP800G5M-X01US | |
| Dell XPS 15 9560 (i7-7700HQ, UHD) | |
| Gigabyte Sabre 15G | |
| Work Score Accelerated v2 | |
| Samsung Odyssey NP800G5M-X01US | |
| Gigabyte Aero 15 | |
| Eurocom Sky MX5 R3 | |
| Gigabyte Sabre 15G | |
| Dell XPS 15 9560 (i7-7700HQ, UHD) | |
| Creative Score Accelerated v2 | |
| Eurocom Sky MX5 R3 | |
| Samsung Odyssey NP800G5M-X01US | |
| Dell XPS 15 9560 (i7-7700HQ, UHD) | |
| Gigabyte Sabre 15G | |
| PCMark 8 Home Score Accelerated v2 | 3431 pontos | |
| PCMark 8 Creative Score Accelerated v2 | 4274 pontos | |
| PCMark 8 Work Score Accelerated v2 | 5063 pontos | |
| PCMark 10 Score | 4364 pontos | |
Ajuda | ||
| Gigabyte Sabre 15G Liteonit CV3-8D128 | Dell XPS 15 9560 (i7-7700HQ, UHD) Lite-On CX2-8B512-Q11 | Samsung Odyssey NP800G5M-X01US Samsung PM961 NVMe MZVLW128HEGR | MSI GT62VR 7RE-223 Samsung SSD PM871a MZNLN256HMHQ | Aorus X5 v6 Samsung SM951 MZVPV256 m.2 | |
|---|---|---|---|---|---|
| AS SSD | 195% | 106% | 25% | 98% | |
| Copy Game MB/s (MB/s) | 323.5 | 540 67% | 240.5 -26% | 377.8 17% | 1073 232% |
| Copy Program MB/s (MB/s) | 195.3 | 411.5 111% | 299.5 53% | 199 2% | 351.5 80% |
| Copy ISO MB/s (MB/s) | 446.8 | 1272 185% | 1560 249% | 354.7 -21% | 351.1 -21% |
| Score Total (Points) | 752 | 2810 274% | 1592 112% | 1019 36% | 1630 117% |
| Score Write (Points) | 234 | 1022 337% | 376 61% | 304 30% | 514 120% |
| Score Read (Points) | 337 | 1206 258% | 852 153% | 472 40% | 756 124% |
| Access Time Write * (ms) | 0.073 | 0.034 53% | 0.031 58% | 0.037 49% | 0.025 66% |
| Access Time Read * (ms) | 0.141 | 0.034 76% | 0.066 53% | 0.1 29% | 0.367 -160% |
| 4K-64 Write (MB/s) | 132.2 | 789 497% | 176.4 33% | 171.6 30% | 272.5 106% |
| 4K-64 Read (MB/s) | 257 | 962 274% | 564 119% | 383.4 49% | 521 103% |
| 4K Write (MB/s) | 53.8 | 112.2 109% | 124.1 131% | 104 93% | 131.3 144% |
| 4K Read (MB/s) | 28.3 | 41.34 46% | 44.75 58% | 37.2 31% | 44.6 58% |
| Seq Write (MB/s) | 479.8 | 1207 152% | 752 57% | 288.2 -40% | 1099 129% |
| Seq Read (MB/s) | 516 | 2026 293% | 2433 372% | 510 -1% | 1904 269% |
* ... menor é melhor

| 3DMark 11 Performance | 7609 pontos | |
| 3DMark Ice Storm Standard Score | 73178 pontos | |
| 3DMark Cloud Gate Standard Score | 20270 pontos | |
| 3DMark Fire Strike Score | 5582 pontos | |
| 3DMark Fire Strike Extreme Score | 2702 pontos | |
Ajuda | ||
| Batman: Arkham Knight | |
| 1920x1080 High / On (Interactive Smoke & Paper Debris Off) AA:SM AF:8x | |
| EVGA SC15 | |
| DogHouse Systems Mobius SS | |
| Lenovo Legion Y520-15IKBN-80WK001KUS | |
| Gigabyte P55W v5 | |
| Dell XPS 15 9560 (i7-7700HQ, UHD) | |
| Gigabyte Sabre 15G | |
| HP Pavilion 17 FHD V3A33AV | |
| 1920x1080 High / On AA:SM AF:16x | |
| EVGA SC15 | |
| DogHouse Systems Mobius SS | |
| Lenovo Legion Y520-15IKBN-80WK001KUS | |
| Gigabyte P55W v5 | |
| Dell XPS 15 9560 (i7-7700HQ, UHD) | |
| Gigabyte Sabre 15G | |
| HP Pavilion 17 FHD V3A33AV | |
| Rise of the Tomb Raider | |
| 1920x1080 High Preset AA:FX AF:4x | |
| DogHouse Systems Mobius SS | |
| Lenovo Legion Y520-15IKBN-80WK001KUS | |
| Gigabyte P55W v5 | |
| Dell XPS 15 9560 (i7-7700HQ, UHD) | |
| Gigabyte Sabre 15G | |
| HP Pavilion 17 FHD V3A33AV | |
| 1920x1080 Very High Preset AA:FX AF:16x | |
| EVGA SC15 | |
| DogHouse Systems Mobius SS | |
| Lenovo Legion Y520-15IKBN-80WK001KUS | |
| Gigabyte P55W v5 | |
| Gigabyte Sabre 15G | |
| Dell XPS 15 9560 (i7-7700HQ, UHD) | |
| HP Pavilion 17 FHD V3A33AV | |
| BioShock Infinite - 1920x1080 Ultra Preset, DX11 (DDOF) | |
| EVGA SC15 | |
| DogHouse Systems Mobius SS | |
| Lenovo Legion Y520-15IKBN-80WK001KUS | |
| Gigabyte P55W v5 | |
| Dell XPS 15 9560 (i7-7700HQ, UHD) | |
| Gigabyte Sabre 15G | |
| HP Pavilion 17 FHD V3A33AV | |
| baixo | média | alto | ultra | |
|---|---|---|---|---|
| BioShock Infinite (2013) | 130 | 61 | ||
| Metro: Last Light (2013) | 79 | 44 | ||
| Thief (2014) | 69.2 | 42.8 | ||
| The Witcher 3 (2015) | 41 | 22 | ||
| Batman: Arkham Knight (2015) | 78 | 46 | 25 | |
| Metal Gear Solid V (2015) | 60 | 53.2 | ||
| Fallout 4 (2015) | 42.8 | 35.5 | ||
| Rise of the Tomb Raider (2016) | 38.6 | 34.2 | ||
| Ashes of the Singularity (2016) | 34.1 | 29.4 | ||
| Doom (2016) | 48 | 42 | ||
| Overwatch (2016) | 59 | |||
| Mafia 3 (2016) | 38.3 | |||
| Prey (2017) | 62.2 | 54.4 |
Barulho
| Ocioso |
| 33 / 33.3 / 34.7 dB |
| Carga |
| 44.5 / 52.8 dB |
 | ||
30 dB silencioso 40 dB(A) audível 50 dB(A) ruidosamente alto |
||
min: | ||
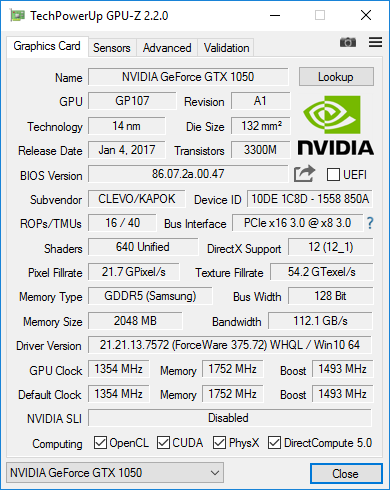
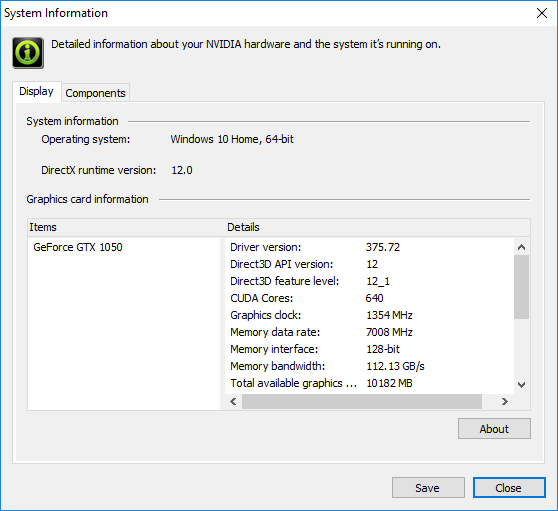
| Gigabyte Sabre 15G GeForce GTX 1050 Mobile, i7-7700HQ, Liteonit CV3-8D128 | Dell XPS 15 9560 (i7-7700HQ, UHD) GeForce GTX 1050 Mobile, i7-7700HQ, Lite-On CX2-8B512-Q11 | Gigabyte Aero 15 GeForce GTX 1060 Mobile, i7-7700HQ, Lite-On CX2-8B512-Q11 | HP Omen 15-ce002ng GeForce GTX 1060 Max-Q, i7-7700HQ, Samsung PM961 MZVLW256HEHP | Samsung Odyssey NP800G5M-X01US GeForce GTX 1050 Mobile, i7-7700HQ, Samsung PM961 NVMe MZVLW128HEGR | MSI GT62VR 7RE-223 GeForce GTX 1070 Mobile, i7-7700HQ, Samsung SSD PM871a MZNLN256HMHQ | |
|---|---|---|---|---|---|---|
| Noise | 4% | 4% | 4% | 7% | 1% | |
| desligado / ambiente * (dB) | 28.2 | 28.4 -1% | 31 -10% | 30 -6% | 28.1 -0% | 30 -6% |
| Idle Minimum * (dB) | 33 | 29 12% | 32 3% | 30 9% | 28.1 15% | 34 -3% |
| Idle Average * (dB) | 33.3 | 29 13% | 33 1% | 33 1% | 29.1 13% | 35 -5% |
| Idle Maximum * (dB) | 34.7 | 32.2 7% | 34 2% | 37 -7% | 29.1 16% | 36 -4% |
| Load Average * (dB) | 44.5 | 47.1 -6% | 39 12% | 41 8% | 49.2 -11% | 40 10% |
| Witcher 3 ultra * (dB) | 49.2 | 52 -6% | 43 13% | 42 15% | ||
| Load Maximum * (dB) | 52.8 | 47.1 11% | 50 5% | 50 5% | 49.2 7% | 46 13% |
* ... menor é melhor
(±) A temperatura máxima no lado superior é 43.6 °C / 110 F, em comparação com a média de 40.4 °C / 105 F , variando de 21.2 a 68.8 °C para a classe Gaming.
(±) A parte inferior aquece até um máximo de 40.2 °C / 104 F, em comparação com a média de 43.2 °C / 110 F
(+) Em uso inativo, a temperatura média para o lado superior é 26.4 °C / 80 F, em comparação com a média do dispositivo de 33.9 °C / ### class_avg_f### F.
(+) Jogando The Witcher 3, a temperatura média para o lado superior é 27.8 °C / 82 F, em comparação com a média do dispositivo de 33.9 °C / ## #class_avg_f### F.
(+) Os apoios para as mãos e o touchpad são mais frios que a temperatura da pele, com um máximo de 30.4 °C / 86.7 F e, portanto, são frios ao toque.
(±) A temperatura média da área do apoio para as mãos de dispositivos semelhantes foi 28.8 °C / 83.8 F (-1.6 °C / -2.9 F).
Gigabyte Sabre 15G análise de áudio
(±) | o volume do alto-falante é médio, mas bom (###valor### dB)
Graves 100 - 315Hz
(-) | quase nenhum baixo - em média 26.3% menor que a mediana
(+) | o baixo é linear (6.3% delta para a frequência anterior)
Médios 400 - 2.000 Hz
(±) | médios reduzidos - em média 8.2% menor que a mediana
(±) | a linearidade dos médios é média (14.6% delta para frequência anterior)
Altos 2 - 16 kHz
(±) | máximos mais altos - em média 5.1% maior que a mediana
(±) | a linearidade dos máximos é média (11.2% delta para frequência anterior)
Geral 100 - 16.000 Hz
(-) | o som geral não é linear (36.7% diferença em relação à mediana)
Comparado com a mesma classe
» 99% de todos os dispositivos testados nesta classe foram melhores, 0% semelhantes, 1% piores
» O melhor teve um delta de 6%, a média foi 18%, o pior foi 132%
Comparado com todos os dispositivos testados
» 94% de todos os dispositivos testados foram melhores, 1% semelhantes, 5% piores
» O melhor teve um delta de 4%, a média foi 23%, o pior foi 134%
Apple MacBook 12 (Early 2016) 1.1 GHz análise de áudio
(+) | os alto-falantes podem tocar relativamente alto (###valor### dB)
Graves 100 - 315Hz
(±) | graves reduzidos - em média 11.3% menor que a mediana
(±) | a linearidade dos graves é média (14.2% delta para a frequência anterior)
Médios 400 - 2.000 Hz
(+) | médios equilibrados - apenas 2.4% longe da mediana
(+) | médios são lineares (5.5% delta para frequência anterior)
Altos 2 - 16 kHz
(+) | agudos equilibrados - apenas 2% longe da mediana
(+) | os máximos são lineares (4.5% delta da frequência anterior)
Geral 100 - 16.000 Hz
(+) | o som geral é linear (10.2% diferença em relação à mediana)
Comparado com a mesma classe
» 7% de todos os dispositivos testados nesta classe foram melhores, 2% semelhantes, 90% piores
» O melhor teve um delta de 5%, a média foi 18%, o pior foi 53%
Comparado com todos os dispositivos testados
» 5% de todos os dispositivos testados foram melhores, 1% semelhantes, 94% piores
» O melhor teve um delta de 4%, a média foi 23%, o pior foi 134%
| desligado | |
| Ocioso | |
| Carga |
|
Key:
min: | |
| Gigabyte Sabre 15G i7-7700HQ, GeForce GTX 1050 Mobile, Liteonit CV3-8D128, IPS, 1920x1080, 15.6" | Dell XPS 15 9560 (i7-7700HQ, UHD) i7-7700HQ, GeForce GTX 1050 Mobile, Lite-On CX2-8B512-Q11, IGZO IPS, 3840x2160, 15.6" | Gigabyte Aero 15 i7-7700HQ, GeForce GTX 1060 Mobile, Lite-On CX2-8B512-Q11, IPS, 1920x1080, 15.6" | HP Omen 15-ce002ng i7-7700HQ, GeForce GTX 1060 Max-Q, Samsung PM961 MZVLW256HEHP, IPS, 1920x1080, 15.6" | Samsung Odyssey NP800G5M-X01US i7-7700HQ, GeForce GTX 1050 Mobile, Samsung PM961 NVMe MZVLW128HEGR, IPS, 1920x1080, 15.6" | MSI GT62VR 7RE-223 i7-7700HQ, GeForce GTX 1070 Mobile, Samsung SSD PM871a MZNLN256HMHQ, IPS, 1920x1080, 15.6" | |
|---|---|---|---|---|---|---|
| Power Consumption | -35% | -41% | -78% | 3% | -104% | |
| Idle Minimum * (Watt) | 8 | 11.9 -49% | 12 -50% | 18 -125% | 6.7 16% | 20 -150% |
| Idle Average * (Watt) | 10.9 | 17.1 -57% | 15 -38% | 23 -111% | 8.9 18% | 24 -120% |
| Idle Maximum * (Watt) | 11 | 17.3 -57% | 20 -82% | 30 -173% | 10.8 2% | 29 -164% |
| Load Average * (Watt) | 76.7 | 94.7 -23% | 82 -7% | 85 -11% | 81.8 -7% | 82 -7% |
| Witcher 3 ultra * (Watt) | 94.9 | 104.8 -10% | 111 -17% | 96 -1% | 92.2 3% | |
| Load Maximum * (Watt) | 106.4 | 122 -15% | 161 -51% | 158 -48% | 122.7 -15% | 193 -81% |
* ... menor é melhor
| Gigabyte Sabre 15G i7-7700HQ, GeForce GTX 1050 Mobile, 47 Wh | Dell XPS 15 9560 (i7-7700HQ, UHD) i7-7700HQ, GeForce GTX 1050 Mobile, 97 Wh | Gigabyte Aero 15 i7-7700HQ, GeForce GTX 1060 Mobile, 94.24 Wh | HP Omen 15-ce002ng i7-7700HQ, GeForce GTX 1060 Max-Q, 70 Wh | Samsung Odyssey NP800G5M-X01US i7-7700HQ, GeForce GTX 1050 Mobile, 43 Wh | MSI GT62VR 7RE-223 i7-7700HQ, GeForce GTX 1070 Mobile, 75 Wh | |
|---|---|---|---|---|---|---|
| Duração da bateria | 55% | 45% | -24% | 8% | -2% | |
| Reader / Idle (h) | 8.2 | 13.9 70% | 10.6 29% | 4.3 -48% | 10.2 24% | 6.3 -23% |
| WiFi v1.3 (h) | 4.4 | 7.2 64% | 7 59% | 3.3 -25% | 4.4 0% | 4.1 -7% |
| Load (h) | 1.3 | 1.7 31% | 1.9 46% | 1.3 0% | 1.3 0% | 1.6 23% |
Pro
Contra
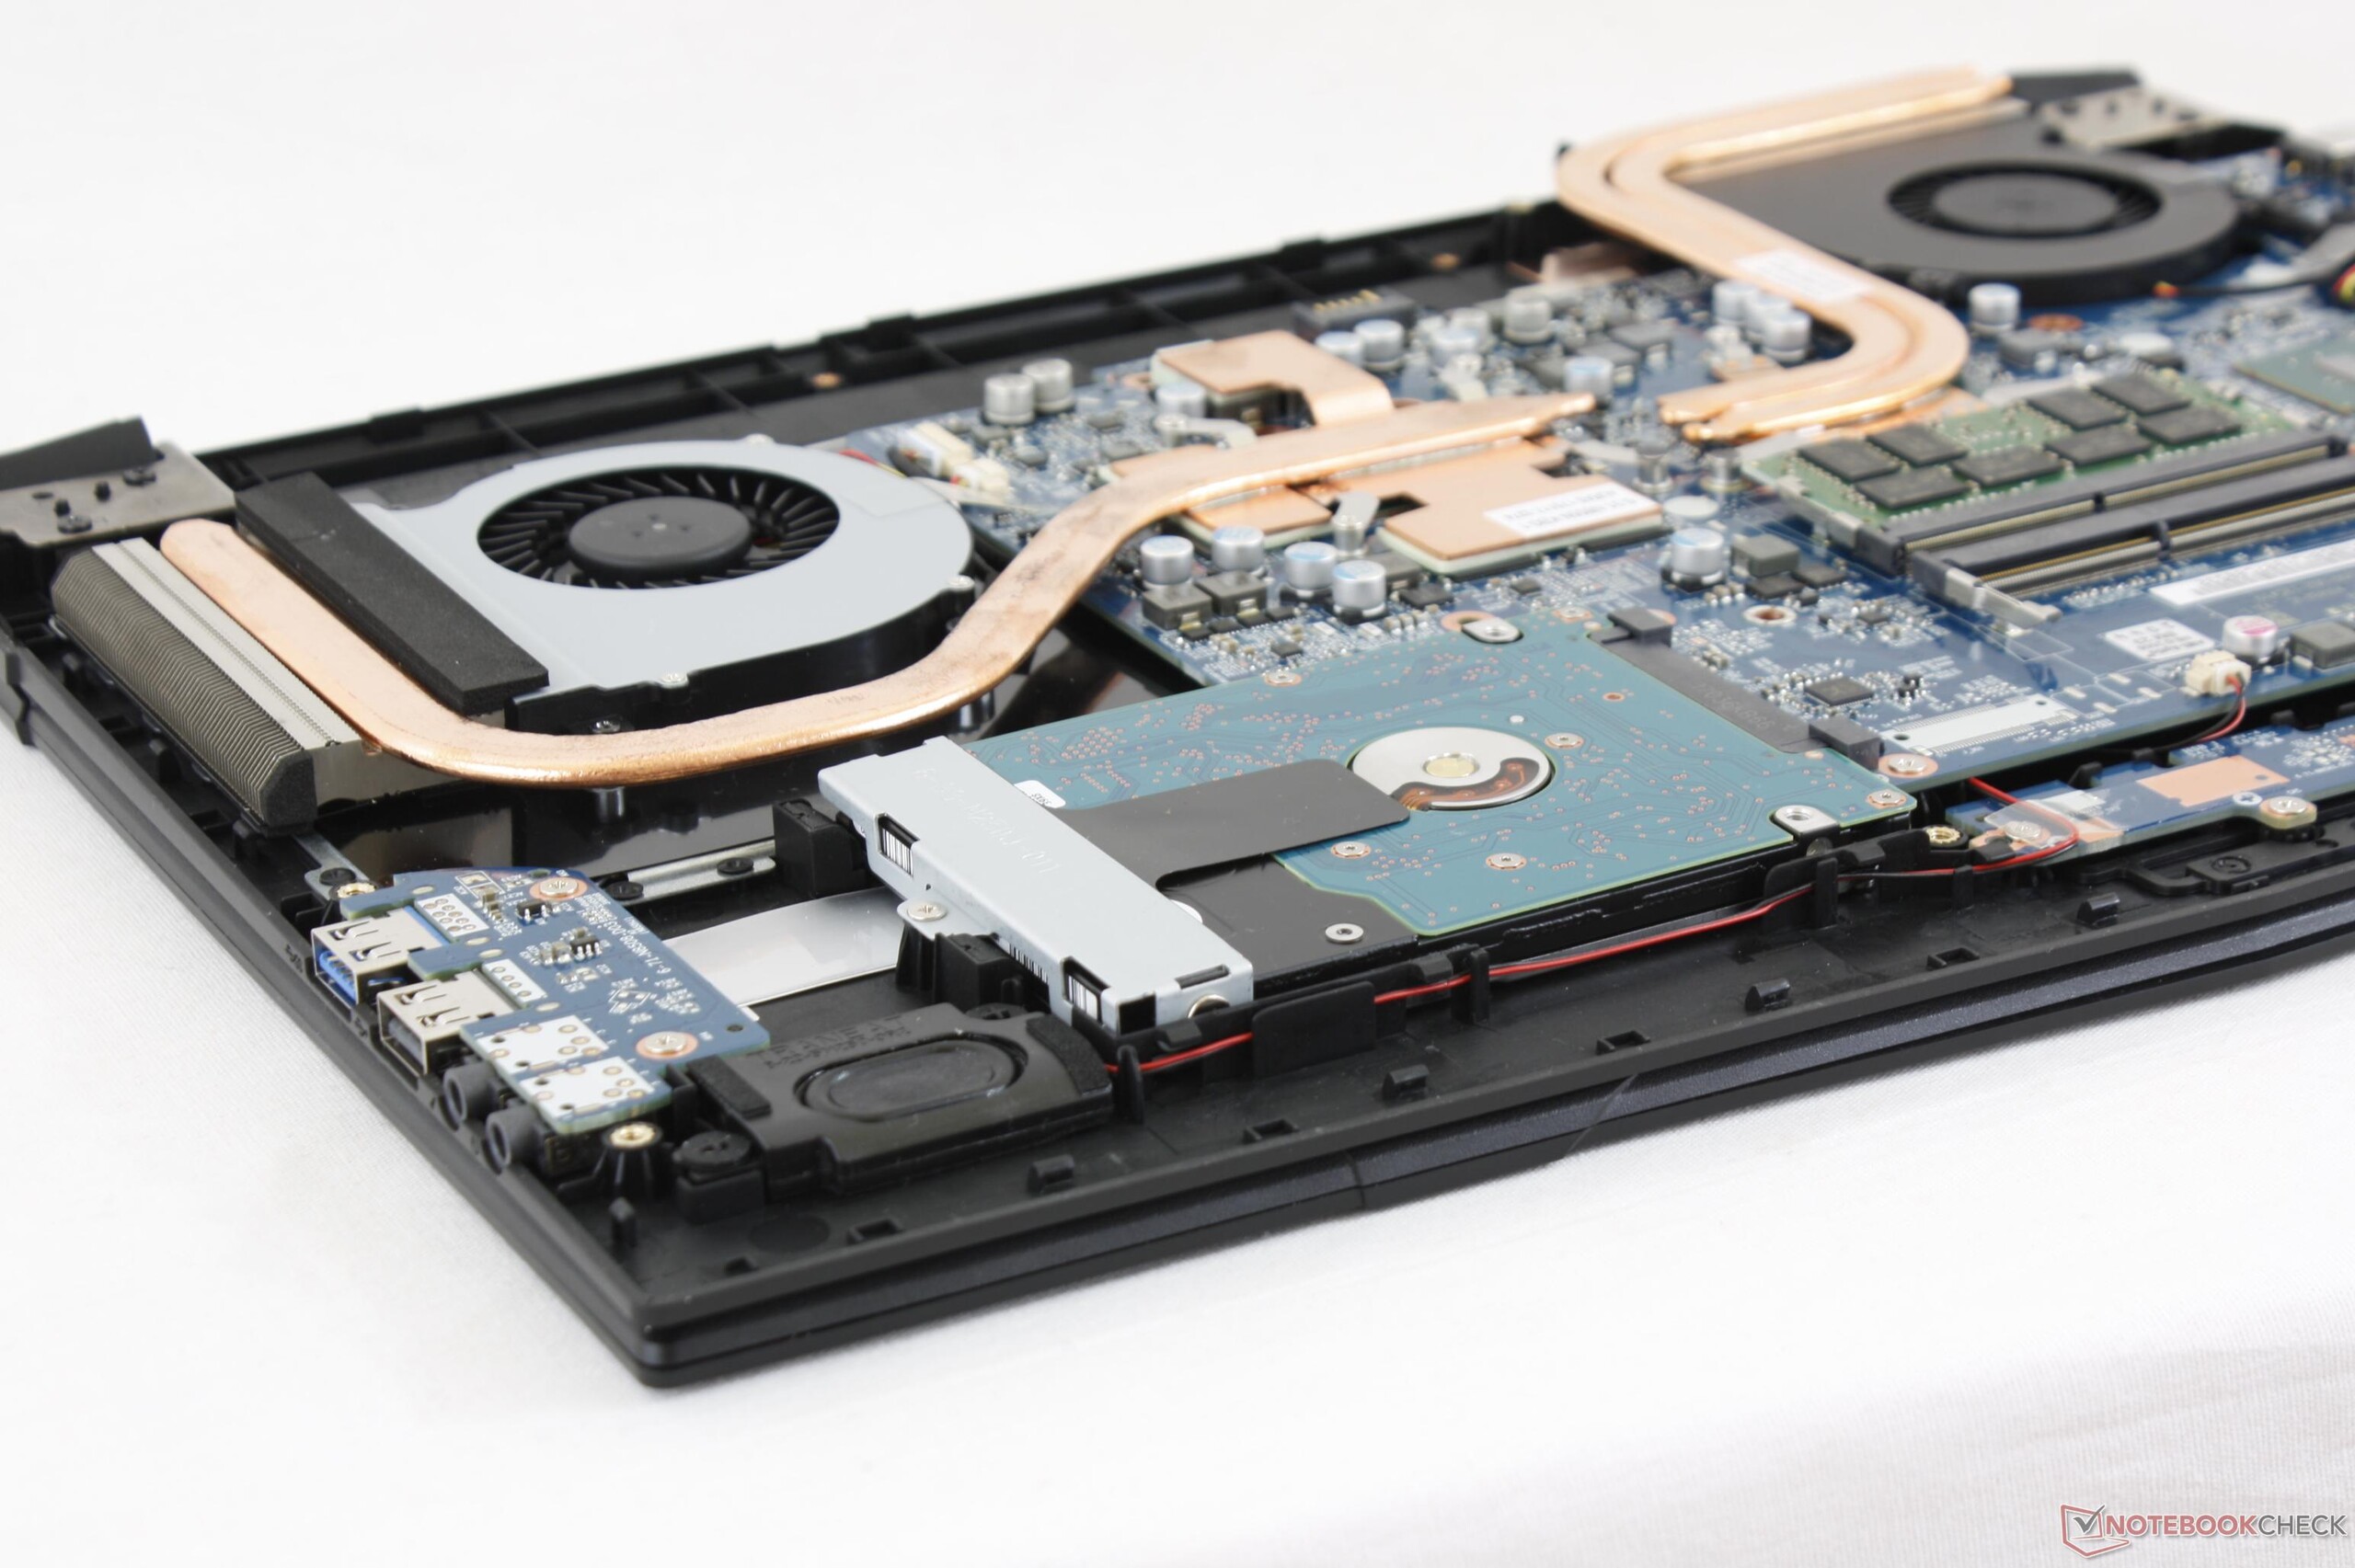
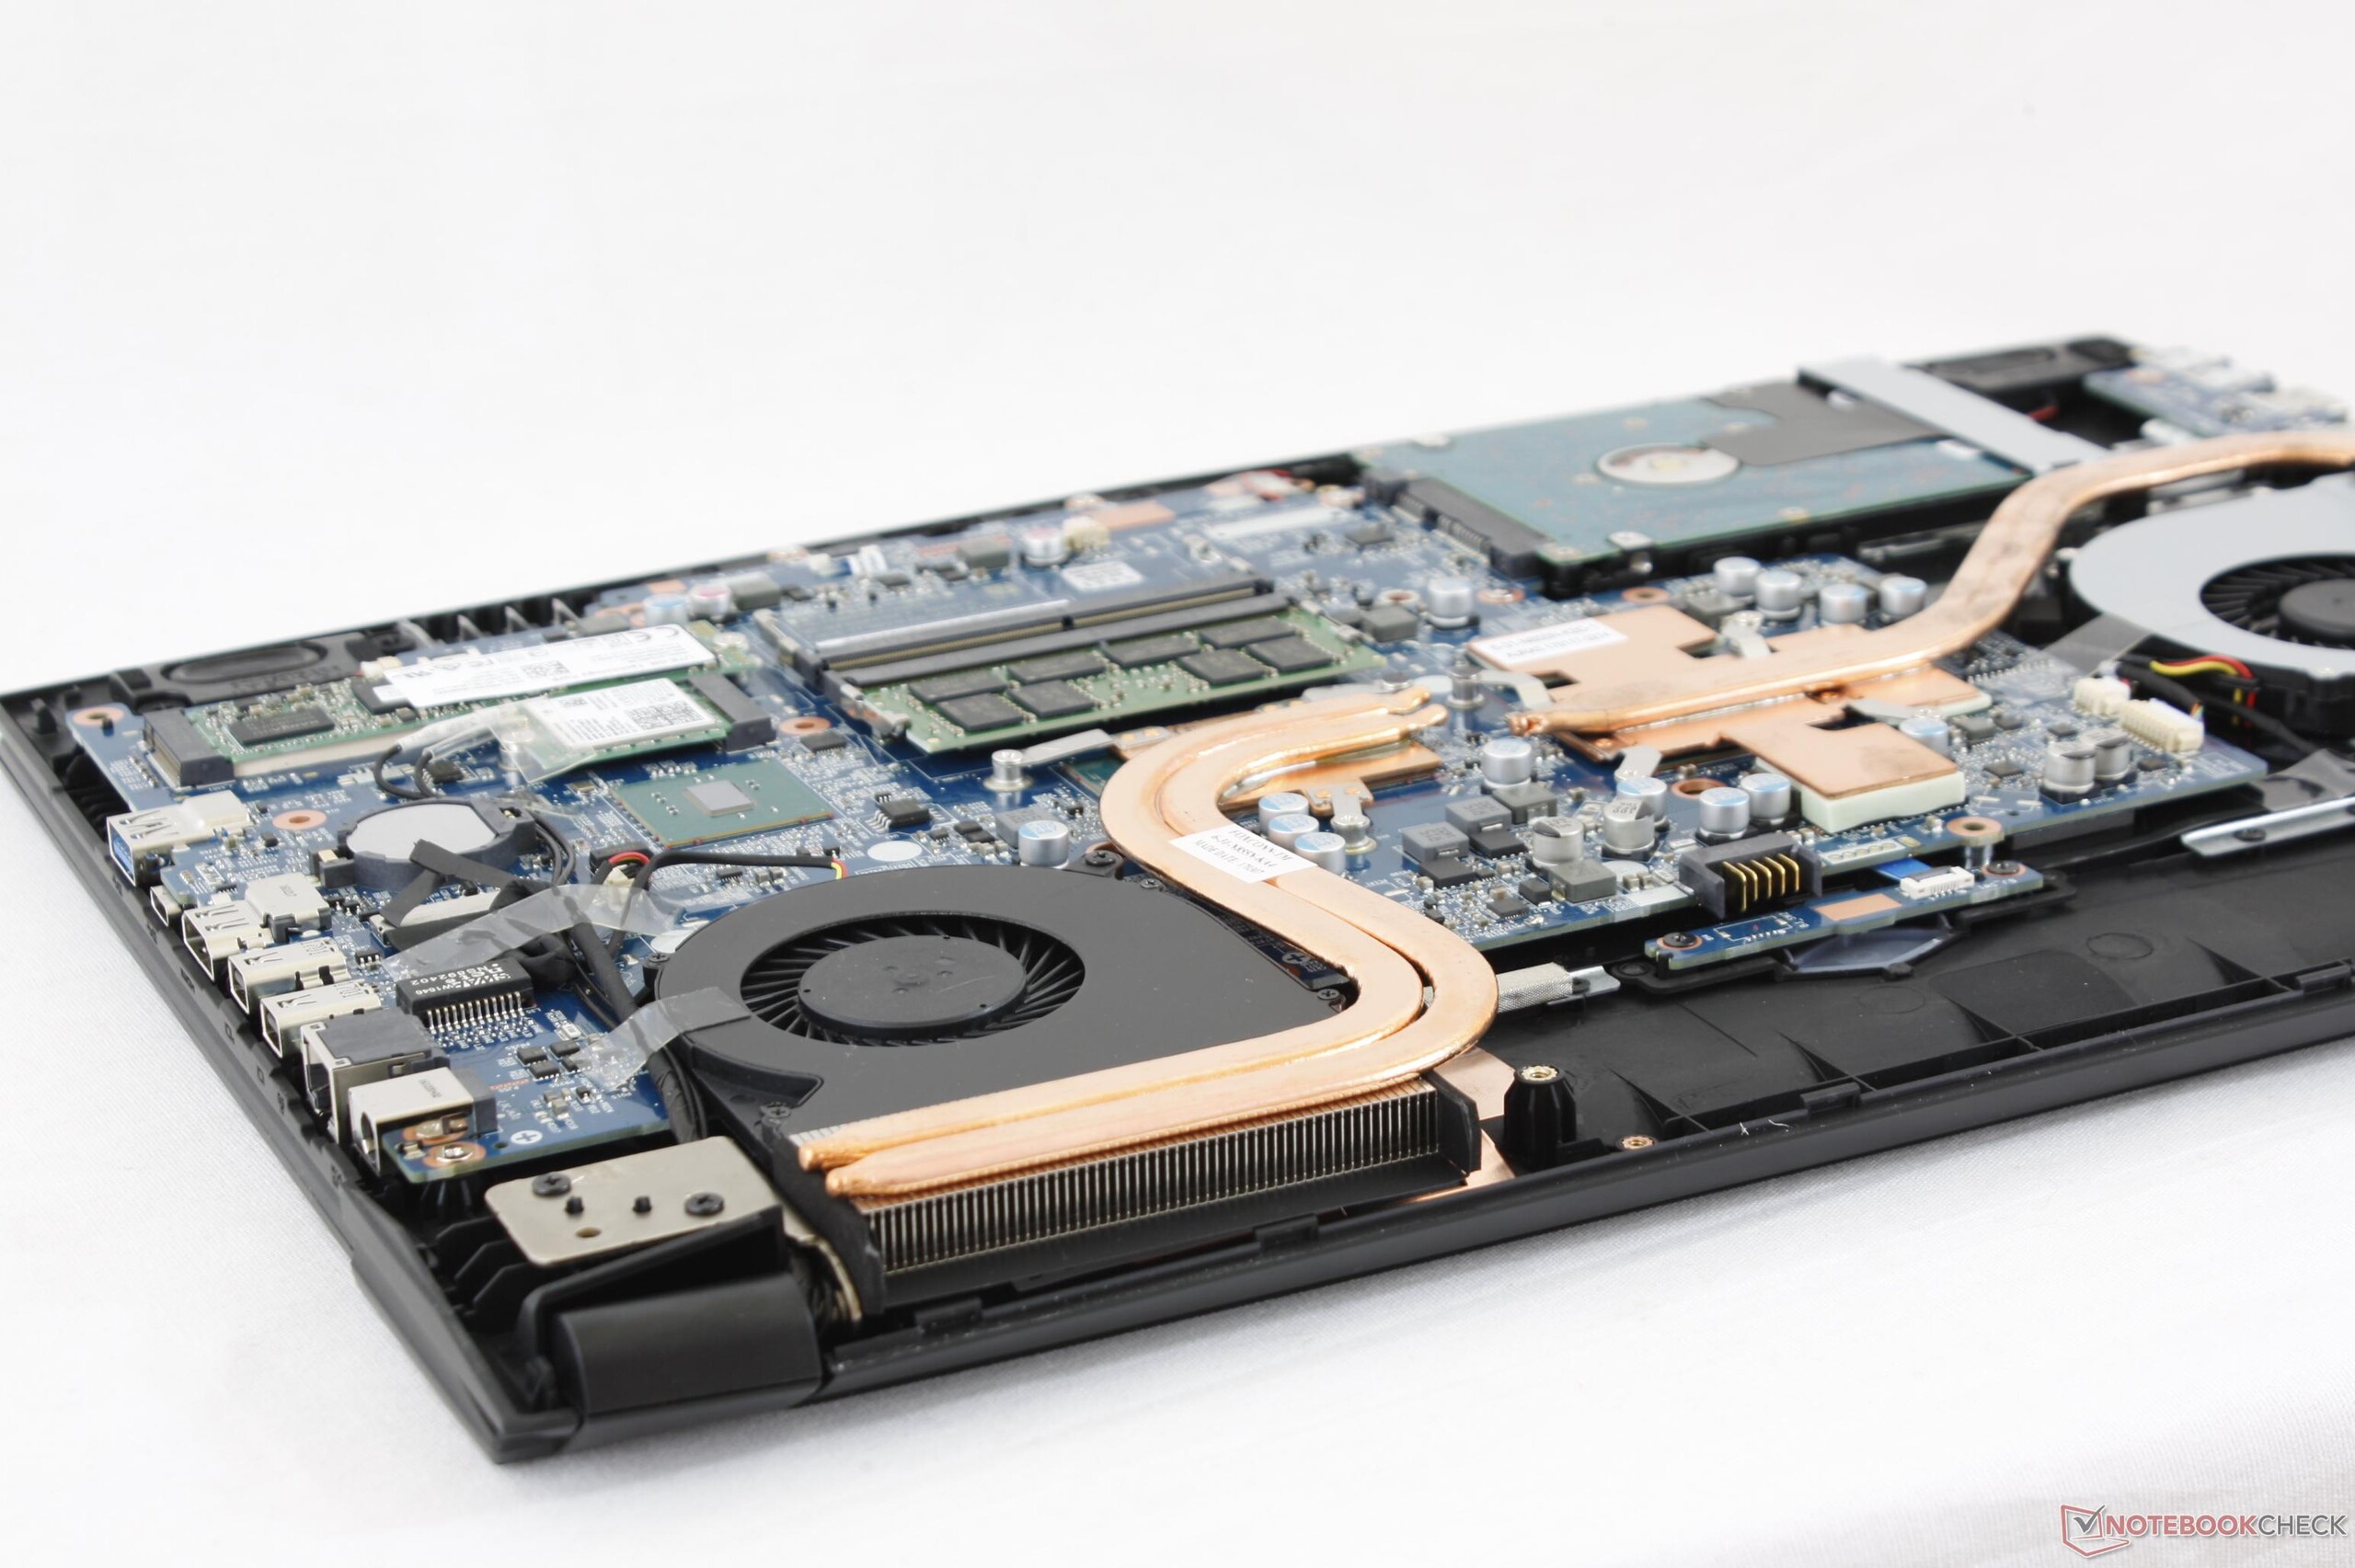
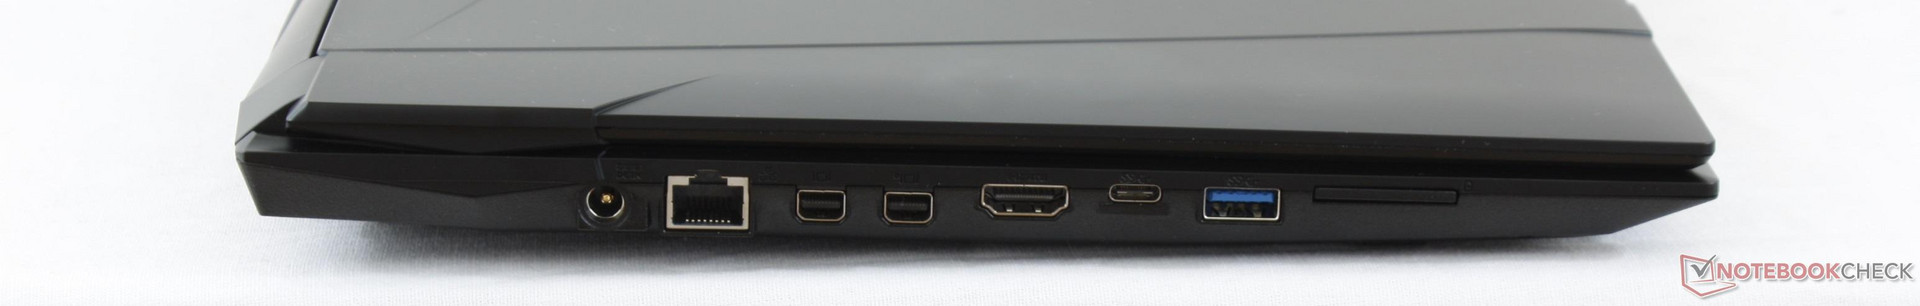
O novo Sabre 15 da Gigabyte traz muitos recursos para um portátil de jogos de nível de entrada. O profundo deslocamento das teclas de 2 mm, a iluminação de fundo RGB de três zonas, três portas de saída de vídeo, duas baias de armazenamento, e design energético, todos são motivos atraentes para adquirir o Sabre em vez dos portáteis de jogos econômicos, como o Pavilion 15 Power, Samsung Odyssey, ou Asus FX553 na mesma faixa de preços. É uma primeira impressão forte que acreditamos que é chave ao apresentar um novo modelo e série.
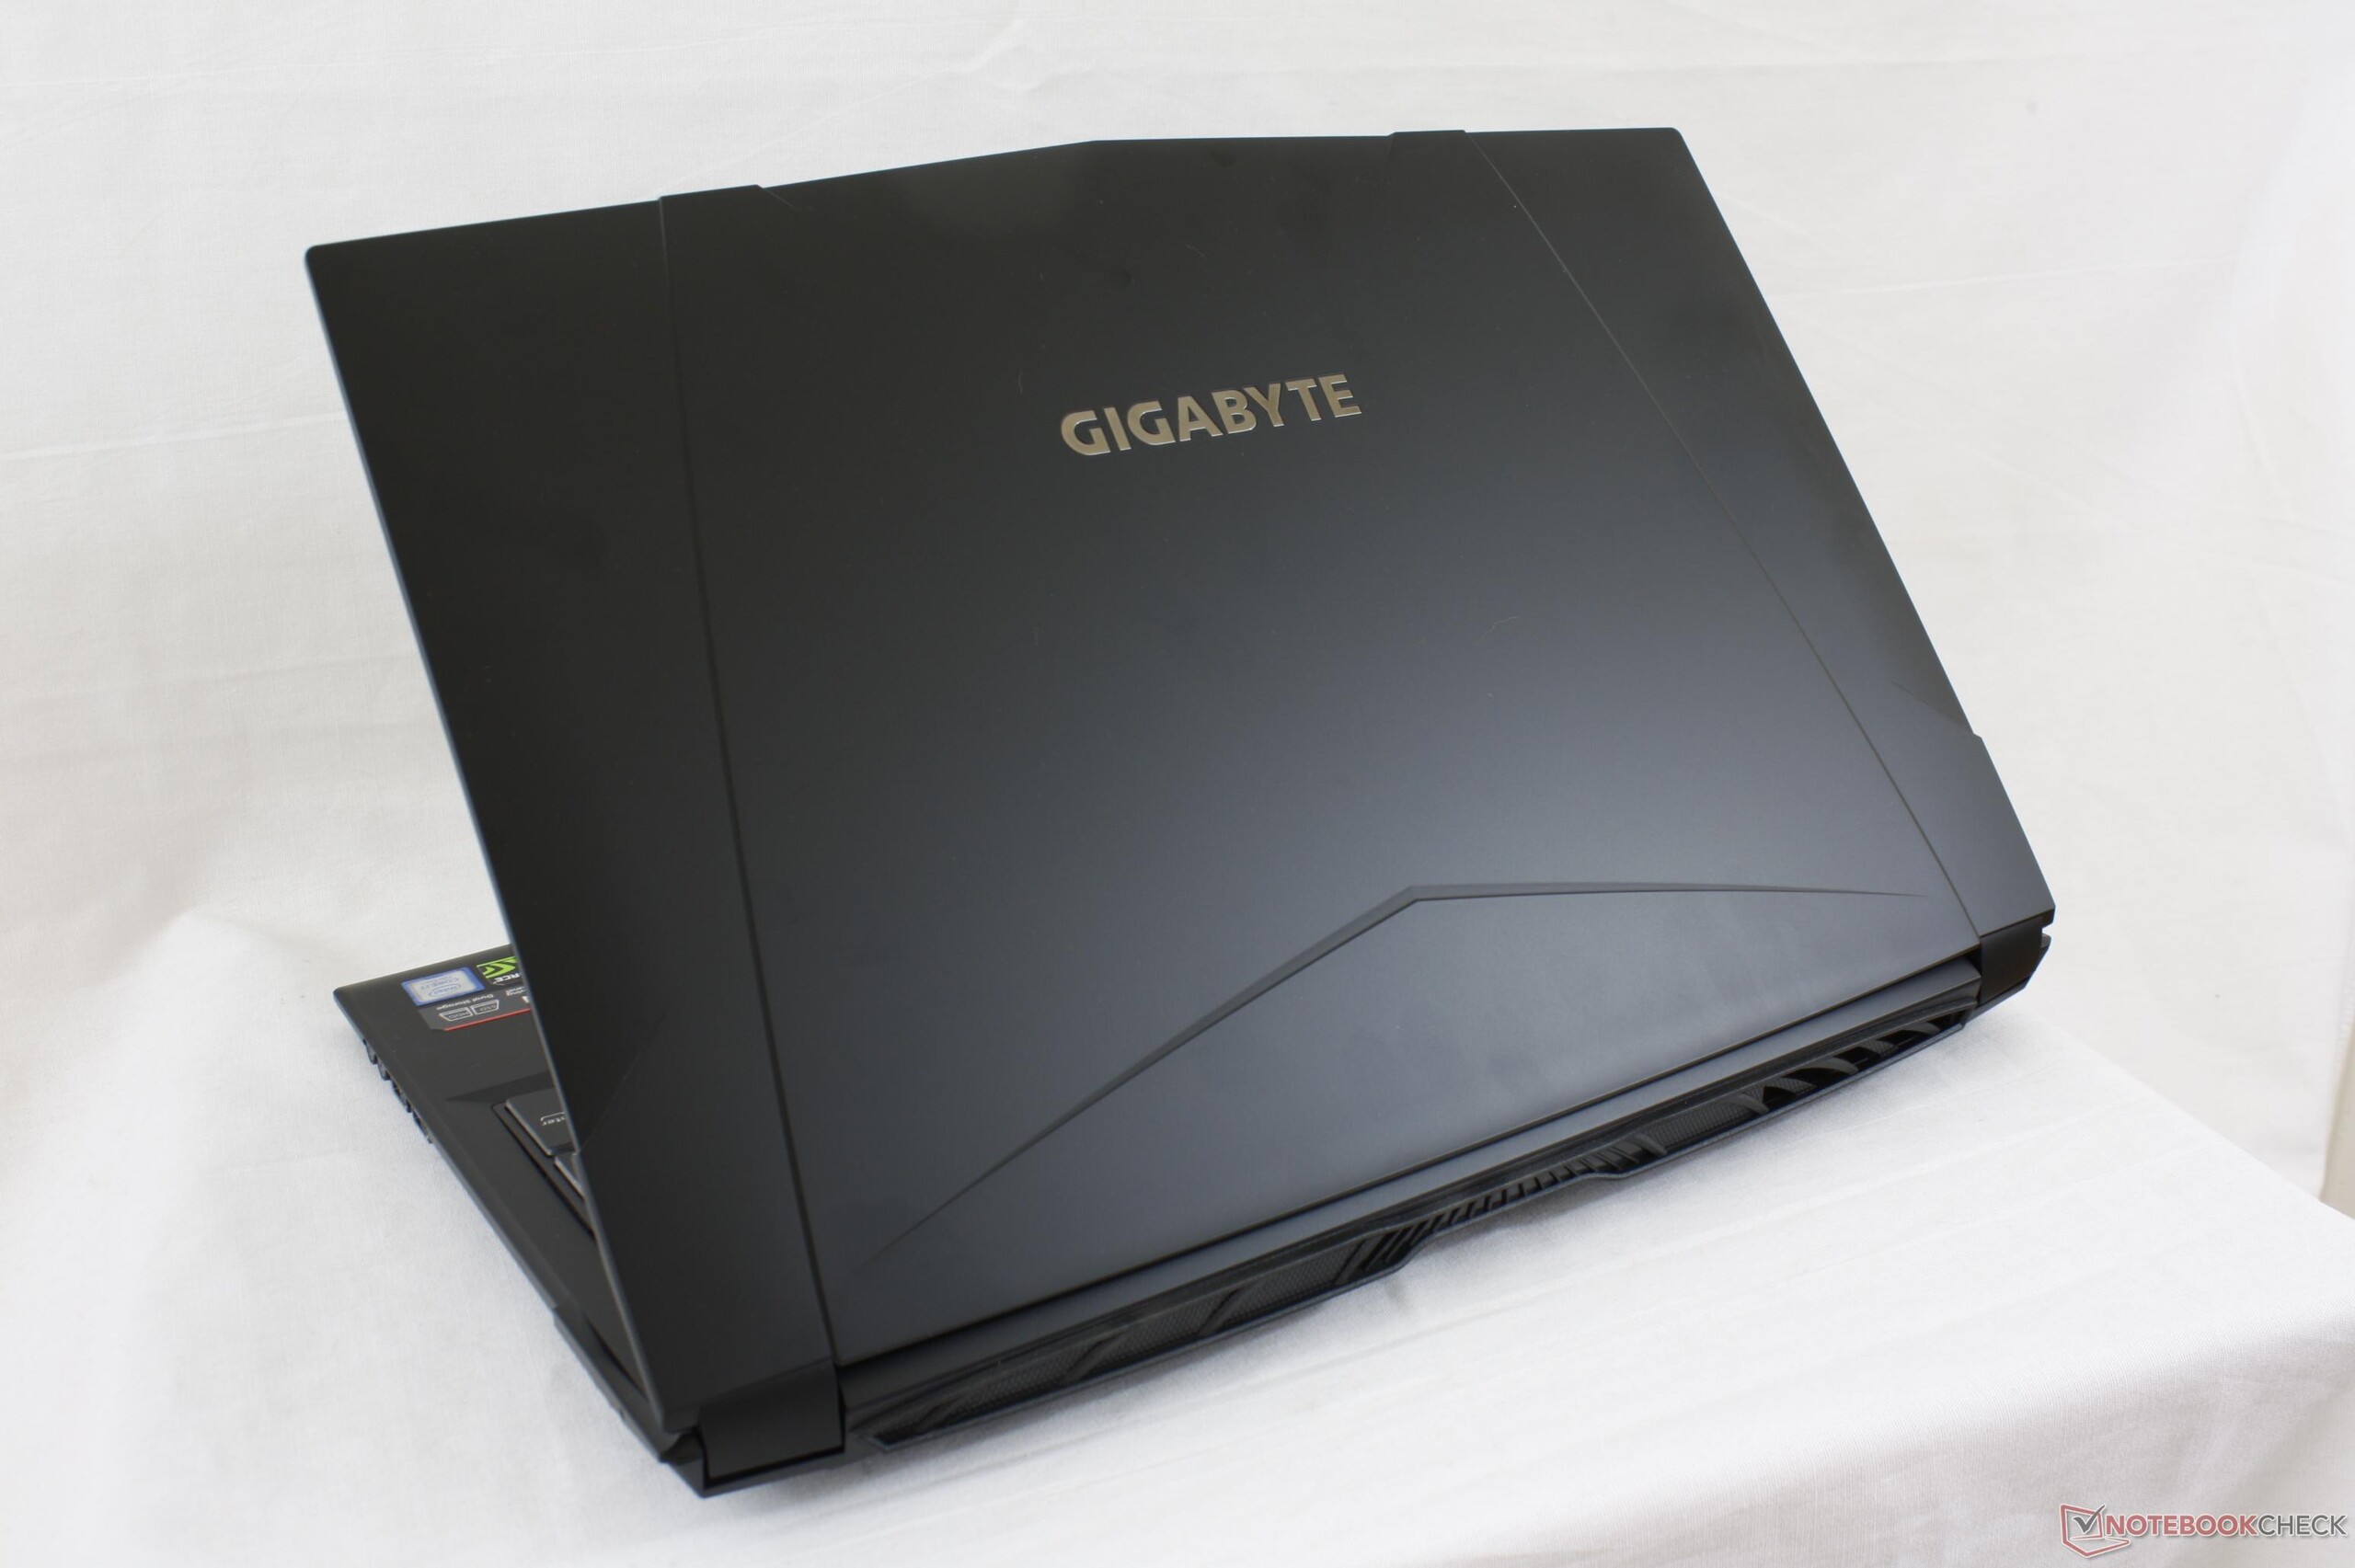
Ainda há muito espaço para melhorias, especialmente em termos de de ruído da ventoinha e áudio. O GTX 1050 é menos poderoso que o GTX 1050 Ti e GTX 1060, porém, o Sabre 15 funciona de forma mais barulhenta que portáteis com GPUs mais poderosos. Combine o forte ruído da ventoinha com a pobre reprodução de baixos e você tem uma experiência inferior se não utilizar um bom par de fones. A base é sólida e mais firme que no Asus FX553 e no Odyssey, mas a tampa definitivamente poderia ser melhor reduzindo o bleeding da iluminação de fundo desregular e resolvendo o problema dos marcos internos sobressalientes. Esperamos que no futuro sejam adicionadas mais opções de hardware como 120 Hz, tempo de atualização de 5 ms, G-Sync, e Thunderbolt 3.
Se o formato pequeno é indispensável, então o Sabre 15 é um dos melhores portáteis de jogos disponível, com o seu respeitável conjunto de recursos. Portáteis de jogos de 15 polegadas mais finos como o GT62VR ainda são recomendados para um ruído de ventoinha mais baixo e melhores alto-falantes.
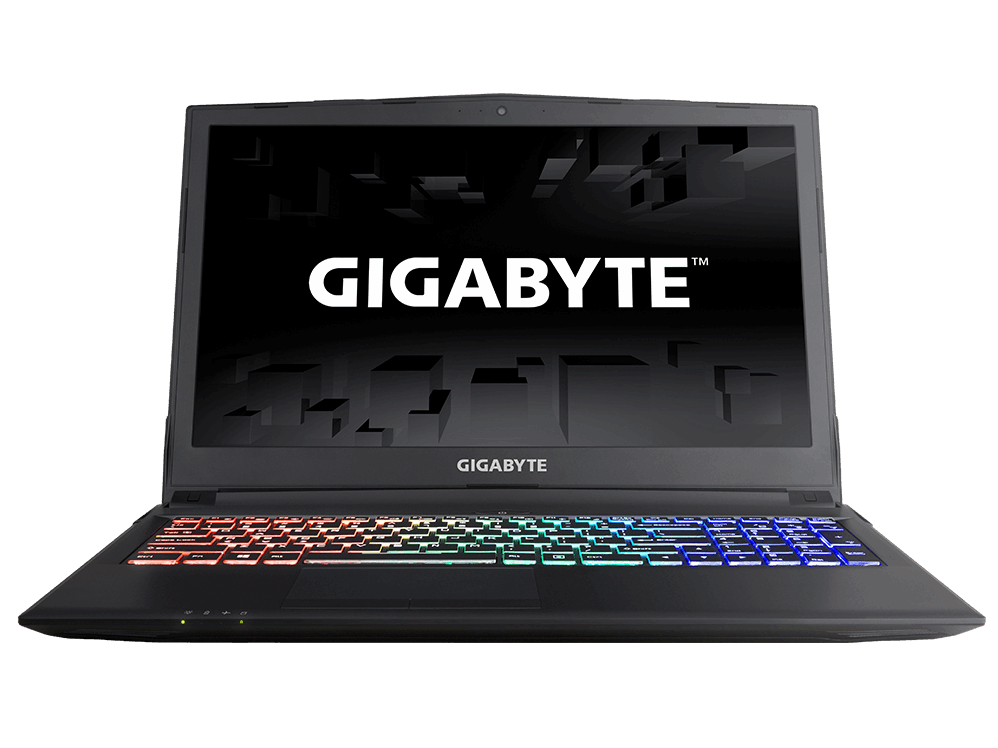
Gigabyte Sabre 15G
- 07/24/2017 v6 (old)
Allen Ngo
Price comparison
