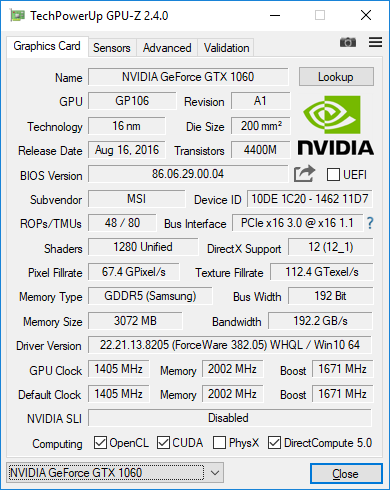
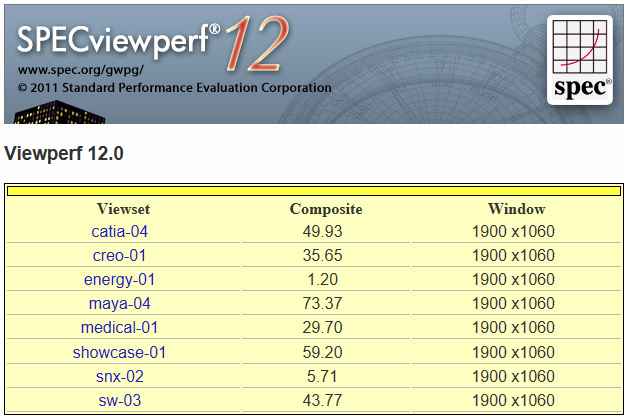
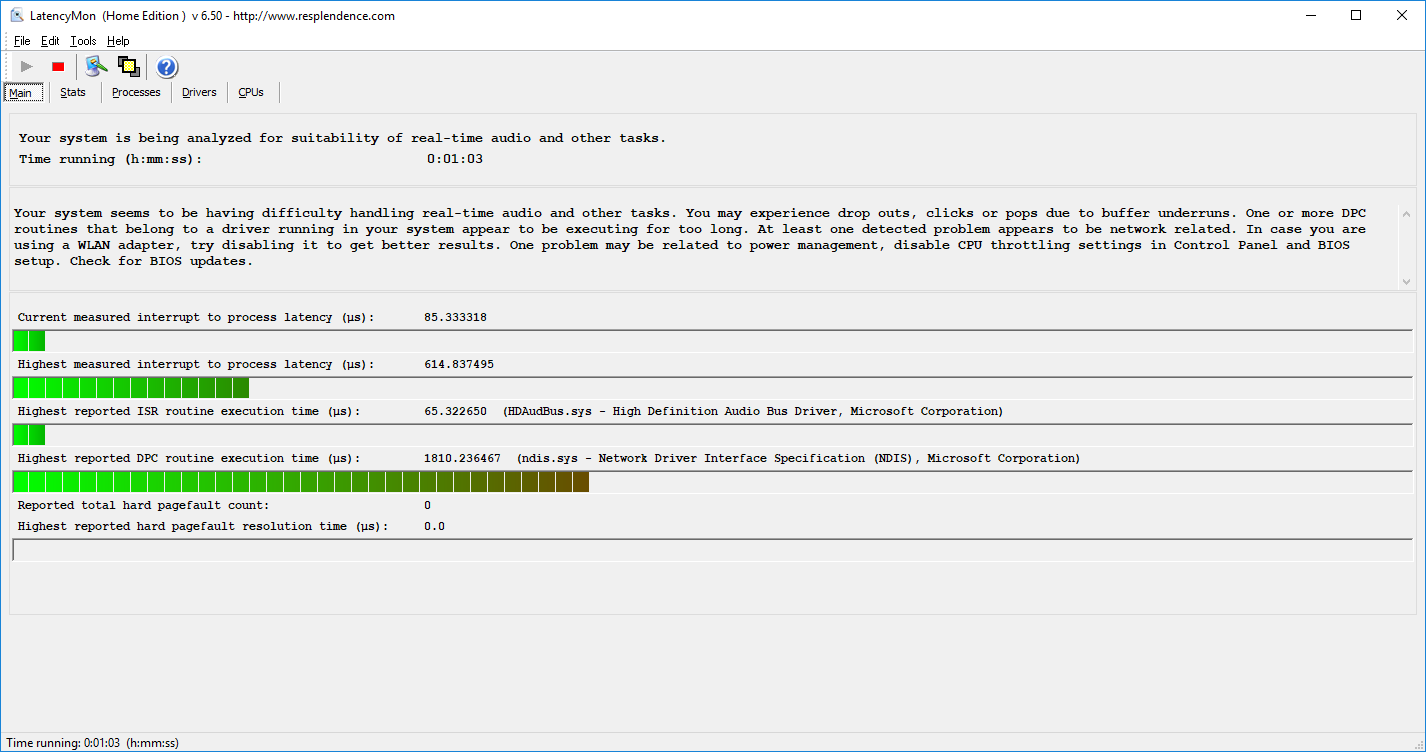
Breve Análise do Portátil MSI GP72VR 7RFX (i7-7700HQ, GTX 1060)
| SD Card Reader | |
| average JPG Copy Test (av. of 3 runs) | |
| Acer Predator Helios 300 | |
| Asus GL702ZC-GC104T | |
| Lenovo Legion Y920-17IKB | |
| MSI GP72VR 7RFX | |
| MSI GP62 7REX-1045US | |
| maximum AS SSD Seq Read Test (1GB) | |
| Asus GL702ZC-GC104T | |
| Lenovo Legion Y920-17IKB | |
| Acer Predator Helios 300 | |
| MSI GP72VR 7RFX | |
| MSI GP62 7REX-1045US | |
| |||||||||||||||||||||||||
iluminação: 88 %
iluminação com acumulador: 309 cd/m²
Contraste: 1405:1 (Preto: 0.22 cd/m²)
ΔE ColorChecker Calman: 7.2 | ∀{0.5-29.43 Ø4.71}
ΔE Greyscale Calman: 98 | ∀{0.09-98 Ø4.96}
100% sRGB (Argyll 1.6.3 3D)
77% AdobeRGB 1998 (Argyll 1.6.3 3D)
86.5% AdobeRGB 1998 (Argyll 3D)
99.7% sRGB (Argyll 3D)
89.9% Display P3 (Argyll 3D)
Gamma: 1.96
CCT: 10963 K
| MSI GP72VR 7RFX CMN1747, TN LED, 17.3", 1920x1080 | MSI GP62 7REX-1045US CMN N156HGE-EAL, TN LED, 15.6", 1920x1080 | Acer Predator Helios 300 LG LP173WF4-SPF5 (LGD056D), AH-IPS, WLED, 17.3", 1920x1080 | Lenovo Legion Y920-17IKB LP173WF4-SPF5, IPS, 17.3", 1920x1080 | Asus GL702ZC-GC104T LG Philips LP173WF4-SPF5 (LGD04E8), IPS, 17.3", 1920x1080 | Alienware 17 R4 TN LED, 17.3", 2560x1440 | |
|---|---|---|---|---|---|---|
| Display | -3% | -22% | -24% | -22% | -26% | |
| Display P3 Coverage (%) | 89.9 | 85.8 -5% | 66.8 -26% | 66.4 -26% | 67.1 -25% | 61.2 -32% |
| sRGB Coverage (%) | 99.7 | 100 0% | 85.8 -14% | 84 -16% | 85.4 -14% | 82.9 -17% |
| AdobeRGB 1998 Coverage (%) | 86.5 | 84.2 -3% | 62.8 -27% | 61.4 -29% | 62.5 -28% | 60.5 -30% |
| Response Times | -118% | -90% | -90% | -112% | -38% | |
| Response Time Grey 50% / Grey 80% * (ms) | 21.6 ? | 34.4 ? -59% | 36 ? -67% | 28.8 ? -33% | 39.2 ? -81% | 30 ? -39% |
| Response Time Black / White * (ms) | 9.4 ? | 26 ? -177% | 20 ? -113% | 23.2 ? -147% | 22.8 ? -143% | 12.8 ? -36% |
| PWM Frequency (Hz) | 25000 ? | 200 ? | 119000 ? | 20000 | 122000 ? | |
| Screen | -28% | 10% | 2% | 12% | -9% | |
| Brightness middle (cd/m²) | 309 | 265.7 -14% | 384 24% | 422.3 37% | 379 23% | 402.3 30% |
| Brightness (cd/m²) | 290 | 243 -16% | 373 29% | 378 30% | 354 22% | 372 28% |
| Brightness Distribution (%) | 88 | 87 -1% | 93 6% | 81 -8% | 89 1% | 86 -2% |
| Black Level * (cd/m²) | 0.22 | 0.63 -186% | 0.35 -59% | 0.48 -118% | 0.31 -41% | 0.62 -182% |
| Contrast (:1) | 1405 | 422 -70% | 1097 -22% | 880 -37% | 1223 -13% | 649 -54% |
| Colorchecker dE 2000 * | 7.2 | 9.6 -33% | 4.81 33% | 4.4 39% | 4.32 40% | 5.6 22% |
| Colorchecker dE 2000 max. * | 12.8 | 18.5 -45% | 8.69 32% | 9.2 28% | 8.56 33% | 9.8 23% |
| Greyscale dE 2000 * | 98 | 12.7 87% | 5.33 95% | 2.8 97% | 4 96% | 4.7 95% |
| Gamma | 1.96 112% | 2.01 109% | 2.45 90% | 2.22 99% | 2.47 89% | 2.14 103% |
| CCT | 10963 59% | 13654 48% | 7137 91% | 6403 102% | 6984 93% | 7519 86% |
| Color Space (Percent of AdobeRGB 1998) (%) | 77 | 76 -1% | 56 -27% | 55 -29% | 56 -27% | 53.7 -30% |
| Color Space (Percent of sRGB) (%) | 100 | 100 0% | 86 -14% | 84 -16% | 85 -15% | 82.2 -18% |
| Média Total (Programa/Configurações) | -50% /
-35% | -34% /
-10% | -37% /
-15% | -41% /
-11% | -24% /
-16% |
* ... menor é melhor
Exibir tempos de resposta
| ↔ Tempo de resposta preto para branco | ||
|---|---|---|
| 9.4 ms ... ascensão ↗ e queda ↘ combinadas | ↗ 7.6 ms ascensão | 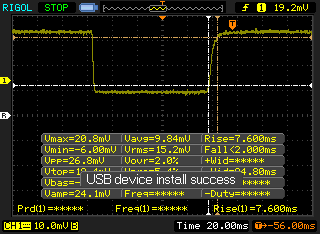 |
| ↘ 1.8 ms queda | ||
| A tela mostra taxas de resposta rápidas em nossos testes e deve ser adequada para jogos. Em comparação, todos os dispositivos testados variam de 0.1 (mínimo) a 240 (máximo) ms. » 26 % de todos os dispositivos são melhores. Isso significa que o tempo de resposta medido é melhor que a média de todos os dispositivos testados (19.8 ms). | ||
| ↔ Tempo de resposta 50% cinza a 80% cinza | ||
| 21.6 ms ... ascensão ↗ e queda ↘ combinadas | ↗ 12 ms ascensão | 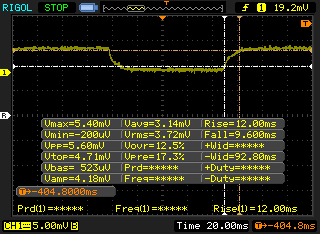 |
| ↘ 9.6 ms queda | ||
| A tela mostra boas taxas de resposta em nossos testes, mas pode ser muito lenta para jogadores competitivos. Em comparação, todos os dispositivos testados variam de 0.165 (mínimo) a 636 (máximo) ms. » 33 % de todos os dispositivos são melhores. Isso significa que o tempo de resposta medido é melhor que a média de todos os dispositivos testados (30.9 ms). | ||
Cintilação da tela / PWM (modulação por largura de pulso)
| Tela tremeluzindo/PWM detectado | 25000 Hz | ≤ 20 % configuração de brilho | 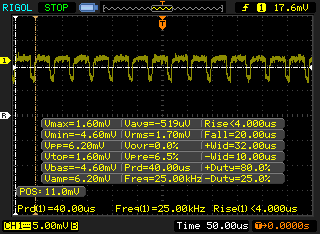 |
A luz de fundo da tela pisca em 25000 Hz (pior caso, por exemplo, utilizando PWM) Cintilação detectada em uma configuração de brilho de 20 % e abaixo. Não deve haver cintilação ou PWM acima desta configuração de brilho. A frequência de 25000 Hz é bastante alta, então a maioria dos usuários sensíveis ao PWM não deve notar nenhuma oscilação. [pwm_comparison] Em comparação: 52 % de todos os dispositivos testados não usam PWM para escurecer a tela. Se PWM foi detectado, uma média de 7748 (mínimo: 5 - máximo: 343500) Hz foi medida. | |||
| wPrime 2.10 - 1024m | |
| MSI GP72VR 7RFX | |
| Lenovo Legion Y920-17IKB | |
| MSI GP62 7REX-1045US | |
| Alienware 17 R4 | |
* ... menor é melhor
| PCMark 8 | |
| Home Score Accelerated v2 | |
| Lenovo Legion Y920-17IKB | |
| Alienware 17 R4 | |
| Acer Predator Helios 300 | |
| Asus GL702ZC-GC104T | |
| MSI GP72VR 7RFX | |
| MSI GP62 7REX-1045US | |
| Work Score Accelerated v2 | |
| Lenovo Legion Y920-17IKB | |
| MSI GP72VR 7RFX | |
| MSI GP62 7REX-1045US | |
| Acer Predator Helios 300 | |
| Asus GL702ZC-GC104T | |
| Alienware 17 R4 | |
| Creative Score Accelerated v2 | |
| Alienware 17 R4 | |
| Lenovo Legion Y920-17IKB | |
| Acer Predator Helios 300 | |
| MSI GP72VR 7RFX | |
| MSI GP62 7REX-1045US | |
| PCMark 8 Home Score Accelerated v2 | 4075 pontos | |
| PCMark 8 Creative Score Accelerated v2 | 5215 pontos | |
| PCMark 8 Work Score Accelerated v2 | 5160 pontos | |
| PCMark 10 Score | 4633 pontos | |
Ajuda | ||
| MSI GP72VR 7RFX Samsung SM961 MZVKW512HMJP m.2 PCI-e | MSI GP62 7REX-1045US Toshiba NVMe THNSN5128GP | Acer Predator Helios 300 Intel SSD 600p SSDPEKKW512G7 | Lenovo Legion Y920-17IKB Samsung SM961 MZVKW512HMJP m.2 PCI-e | Alienware 17 R4 SK Hynix PC300 NVMe 512 GB | |
|---|---|---|---|---|---|
| AS SSD | -37% | -43% | 3% | -45% | |
| Copy Game MB/s (MB/s) | 894 | 442.8 -50% | 353.9 -60% | 1117 25% | 574 -36% |
| Copy Program MB/s (MB/s) | 259.8 | 326.3 26% | 263.9 2% | 407.8 57% | 446.1 72% |
| Copy ISO MB/s (MB/s) | 1653 | 1128 -32% | 924 -44% | 1975 19% | 1227 -26% |
| Score Total (Points) | 3783 | 1829 -52% | 1588 -58% | 3080 -19% | 2072 -45% |
| Score Write (Points) | 1507 | 600 -60% | 588 -61% | 1506 0% | 858 -43% |
| Score Read (Points) | 1530 | 849 -45% | 690 -55% | 1072 -30% | 831 -46% |
| Access Time Write * (ms) | 0.03 | 0.034 -13% | 0.032 -7% | 0.029 3% | 0.123 -310% |
| Access Time Read * (ms) | 0.051 | 0.079 -55% | 0.072 -41% | 0.044 14% | 0.042 18% |
| 4K-64 Write (MB/s) | 1219 | 428.2 -65% | 421.8 -65% | 1220 0% | 671 -45% |
| 4K-64 Read (MB/s) | 1231 | 628 -49% | 506 -59% | 747 -39% | 620 -50% |
| 4K Write (MB/s) | 122.7 | 112 -9% | 111.3 -9% | 127.1 4% | 113.4 -8% |
| 4K Read (MB/s) | 47.63 | 35.84 -25% | 29.02 -39% | 48.23 1% | 35.61 -25% |
| Seq Write (MB/s) | 1653 | 601 -64% | 552 -67% | 1589 -4% | 735 -56% |
| Seq Read (MB/s) | 2507 | 1848 -26% | 1558 -38% | 2768 10% | 1752 -30% |
* ... menor é melhor

| 3DMark 06 Standard Score | 26607 pontos | |
| 3DMark 11 Performance | 12008 pontos | |
| 3DMark Ice Storm Standard Score | 114371 pontos | |
| 3DMark Cloud Gate Standard Score | 25432 pontos | |
| 3DMark Fire Strike Score | 10001 pontos | |
| 3DMark Fire Strike Extreme Score | 5270 pontos | |
| 3DMark Time Spy Score | 3697 pontos | |
Ajuda | ||
| Metro: Last Light - 1920x1080 Very High (DX11) AF:16x (classificar por valor) | |
| MSI GP72VR 7RFX | |
| MSI GP62 7REX-1045US | |
| Lenovo Legion Y920-17IKB | |
| Alienware 17 R4 | |
| Batman: Arkham Knight - 1920x1080 High / On AA:SM AF:16x (classificar por valor) | |
| MSI GP72VR 7RFX | |
| MSI GP62 7REX-1045US | |
| Lenovo Legion Y920-17IKB | |
| Alienware 17 R4 | |
| baixo | média | alto | ultra | |
|---|---|---|---|---|
| BioShock Infinite (2013) | 105 | |||
| Metro: Last Light (2013) | 74 | |||
| The Witcher 3 (2015) | 40 | |||
| Batman: Arkham Knight (2015) | 81 |
Barulho
| Ocioso |
| 29.2 / 29.2 / 37 dB |
| Carga |
| 43.7 / 46.4 dB |
 | ||
30 dB silencioso 40 dB(A) audível 50 dB(A) ruidosamente alto |
||
min: | ||
| MSI GP72VR 7RFX GeForce GTX 1060 Mobile, i7-7700HQ, Samsung SM961 MZVKW512HMJP m.2 PCI-e | MSI GP62 7REX-1045US GeForce GTX 1050 Ti Mobile, i7-7700HQ, Toshiba NVMe THNSN5128GP | Acer Predator Helios 300 GeForce GTX 1060 Mobile, i7-7700HQ, Intel SSD 600p SSDPEKKW512G7 | Lenovo Legion Y920-17IKB GeForce GTX 1070 Mobile, i7-7820HK, Samsung SM961 MZVKW512HMJP m.2 PCI-e | Alienware 17 R4 GeForce GTX 1080 Mobile, i7-7820HK, SK Hynix PC300 NVMe 512 GB | |
|---|---|---|---|---|---|
| Noise | -1% | -4% | 4% | -10% | |
| desligado / ambiente * (dB) | 28.3 | 28 1% | 31 -10% | 28.1 1% | 28.2 -0% |
| Idle Minimum * (dB) | 29.2 | 32.2 -10% | 31 -6% | 29.9 -2% | 35.6 -22% |
| Idle Average * (dB) | 29.2 | 32.2 -10% | 32 -10% | 31.5 -8% | 35.6 -22% |
| Idle Maximum * (dB) | 37 | 32.2 13% | 33 11% | 31.5 15% | 35.7 4% |
| Load Average * (dB) | 43.7 | 40.9 6% | 44 -1% | 33.2 24% | 50.2 -15% |
| Witcher 3 ultra * (dB) | 45.7 | 45.4 1% | 46 -1% | 46.5 -2% | 50.2 -10% |
| Load Maximum * (dB) | 46.4 | 48.6 -5% | 50 -8% | 46.5 -0% | 50.2 -8% |
* ... menor é melhor
(-) A temperatura máxima no lado superior é 53.8 °C / 129 F, em comparação com a média de 40.4 °C / 105 F , variando de 21.2 a 68.8 °C para a classe Gaming.
(-) A parte inferior aquece até um máximo de 52.2 °C / 126 F, em comparação com a média de 43.2 °C / 110 F
(+) Em uso inativo, a temperatura média para o lado superior é 30.6 °C / 87 F, em comparação com a média do dispositivo de 33.9 °C / ### class_avg_f### F.
(±) Jogando The Witcher 3, a temperatura média para o lado superior é 38 °C / 100 F, em comparação com a média do dispositivo de 33.9 °C / ## #class_avg_f### F.
(-) Os apoios para as mãos e o touchpad podem ficar muito quentes ao toque, com um máximo de 42.8 °C / 109 F.
(-) A temperatura média da área do apoio para as mãos de dispositivos semelhantes foi 28.8 °C / 83.8 F (-14 °C / -25.2 F).
MSI GP72VR 7RFX análise de áudio
(+) | os alto-falantes podem tocar relativamente alto (###valor### dB)
Graves 100 - 315Hz
(-) | quase nenhum baixo - em média 17.4% menor que a mediana
(±) | a linearidade dos graves é média (10% delta para a frequência anterior)
Médios 400 - 2.000 Hz
(+) | médios equilibrados - apenas 4.9% longe da mediana
(±) | a linearidade dos médios é média (7.4% delta para frequência anterior)
Altos 2 - 16 kHz
(+) | agudos equilibrados - apenas 3.7% longe da mediana
(±) | a linearidade dos máximos é média (7.3% delta para frequência anterior)
Geral 100 - 16.000 Hz
(±) | a linearidade do som geral é média (17.3% diferença em relação à mediana)
Comparado com a mesma classe
» 47% de todos os dispositivos testados nesta classe foram melhores, 12% semelhantes, 41% piores
» O melhor teve um delta de 6%, a média foi 18%, o pior foi 132%
Comparado com todos os dispositivos testados
» 33% de todos os dispositivos testados foram melhores, 8% semelhantes, 59% piores
» O melhor teve um delta de 4%, a média foi 23%, o pior foi 134%
Apple MacBook 12 (Early 2016) 1.1 GHz análise de áudio
(+) | os alto-falantes podem tocar relativamente alto (###valor### dB)
Graves 100 - 315Hz
(±) | graves reduzidos - em média 11.3% menor que a mediana
(±) | a linearidade dos graves é média (14.2% delta para a frequência anterior)
Médios 400 - 2.000 Hz
(+) | médios equilibrados - apenas 2.4% longe da mediana
(+) | médios são lineares (5.5% delta para frequência anterior)
Altos 2 - 16 kHz
(+) | agudos equilibrados - apenas 2% longe da mediana
(+) | os máximos são lineares (4.5% delta da frequência anterior)
Geral 100 - 16.000 Hz
(+) | o som geral é linear (10.2% diferença em relação à mediana)
Comparado com a mesma classe
» 7% de todos os dispositivos testados nesta classe foram melhores, 2% semelhantes, 90% piores
» O melhor teve um delta de 5%, a média foi 18%, o pior foi 53%
Comparado com todos os dispositivos testados
» 5% de todos os dispositivos testados foram melhores, 1% semelhantes, 94% piores
» O melhor teve um delta de 4%, a média foi 23%, o pior foi 134%
| desligado | |
| Ocioso | |
| Carga |
|
Key:
min: | |
| MSI GP72VR 7RFX i7-7700HQ, GeForce GTX 1060 Mobile, Samsung SM961 MZVKW512HMJP m.2 PCI-e, TN LED, 1920x1080, 17.3" | MSI GP62 7REX-1045US i7-7700HQ, GeForce GTX 1050 Ti Mobile, Toshiba NVMe THNSN5128GP, TN LED, 1920x1080, 15.6" | Acer Predator Helios 300 i7-7700HQ, GeForce GTX 1060 Mobile, Intel SSD 600p SSDPEKKW512G7, AH-IPS, WLED, 1920x1080, 17.3" | Lenovo Legion Y920-17IKB i7-7820HK, GeForce GTX 1070 Mobile, Samsung SM961 MZVKW512HMJP m.2 PCI-e, IPS, 1920x1080, 17.3" | Alienware 17 R4 i7-7820HK, GeForce GTX 1080 Mobile, SK Hynix PC300 NVMe 512 GB, TN LED, 2560x1440, 17.3" | |
|---|---|---|---|---|---|
| Power Consumption | 17% | 20% | -36% | -68% | |
| Idle Minimum * (Watt) | 17.3 | 14.6 16% | 7 60% | 29.4 -70% | 37.5 -117% |
| Idle Average * (Watt) | 22.5 | 17.2 24% | 13 42% | 30.9 -37% | 37.6 -67% |
| Idle Maximum * (Watt) | 22.5 | 17.3 23% | 20 11% | 31.9 -42% | 37.6 -67% |
| Load Average * (Watt) | 85.1 | 82.7 3% | 81 5% | 87.4 -3% | 122.4 -44% |
| Witcher 3 ultra * (Watt) | 141.7 | 107 24% | 127 10% | 182 -28% | 180.3 -27% |
| Load Maximum * (Watt) | 151.3 | 136.7 10% | 162 -7% | 201.5 -33% | 277.4 -83% |
* ... menor é melhor
| MSI GP72VR 7RFX i7-7700HQ, GeForce GTX 1060 Mobile, 41 Wh | MSI GP62 7REX-1045US i7-7700HQ, GeForce GTX 1050 Ti Mobile, 41 Wh | Acer Predator Helios 300 i7-7700HQ, GeForce GTX 1060 Mobile, 48 Wh | Lenovo Legion Y920-17IKB i7-7820HK, GeForce GTX 1070 Mobile, 90 Wh | Asus GL702ZC-GC104T R7 1700, Radeon RX 580 (Laptop), 76 Wh | Alienware 17 R4 i7-7820HK, GeForce GTX 1080 Mobile, 99 Wh | |
|---|---|---|---|---|---|---|
| Duração da bateria | 158% | 469% | 275% | 13% | 178% | |
| Reader / Idle (h) | 0.7 | 4.3 514% | 10.2 1357% | 5.9 743% | 1.7 143% | 4.6 557% |
| WiFi v1.3 (h) | 2.1 | 2.9 38% | 4.7 124% | 4.7 124% | 1.5 -29% | 3 43% |
| Load (h) | 3.4 | 0.7 -79% | 0.9 -74% | 2 -41% | 0.9 -74% | 1.2 -65% |
Pro
Contra
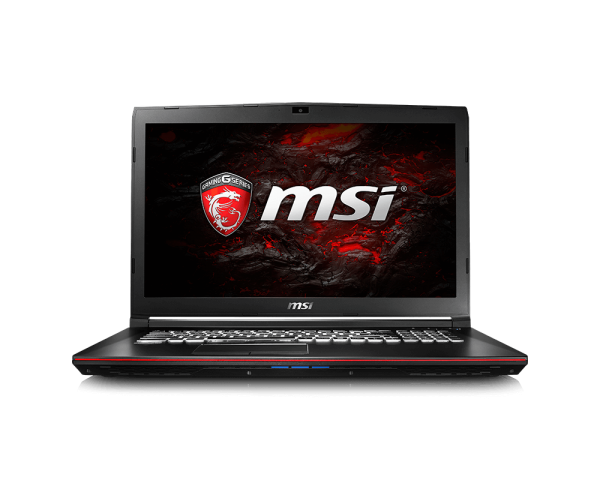
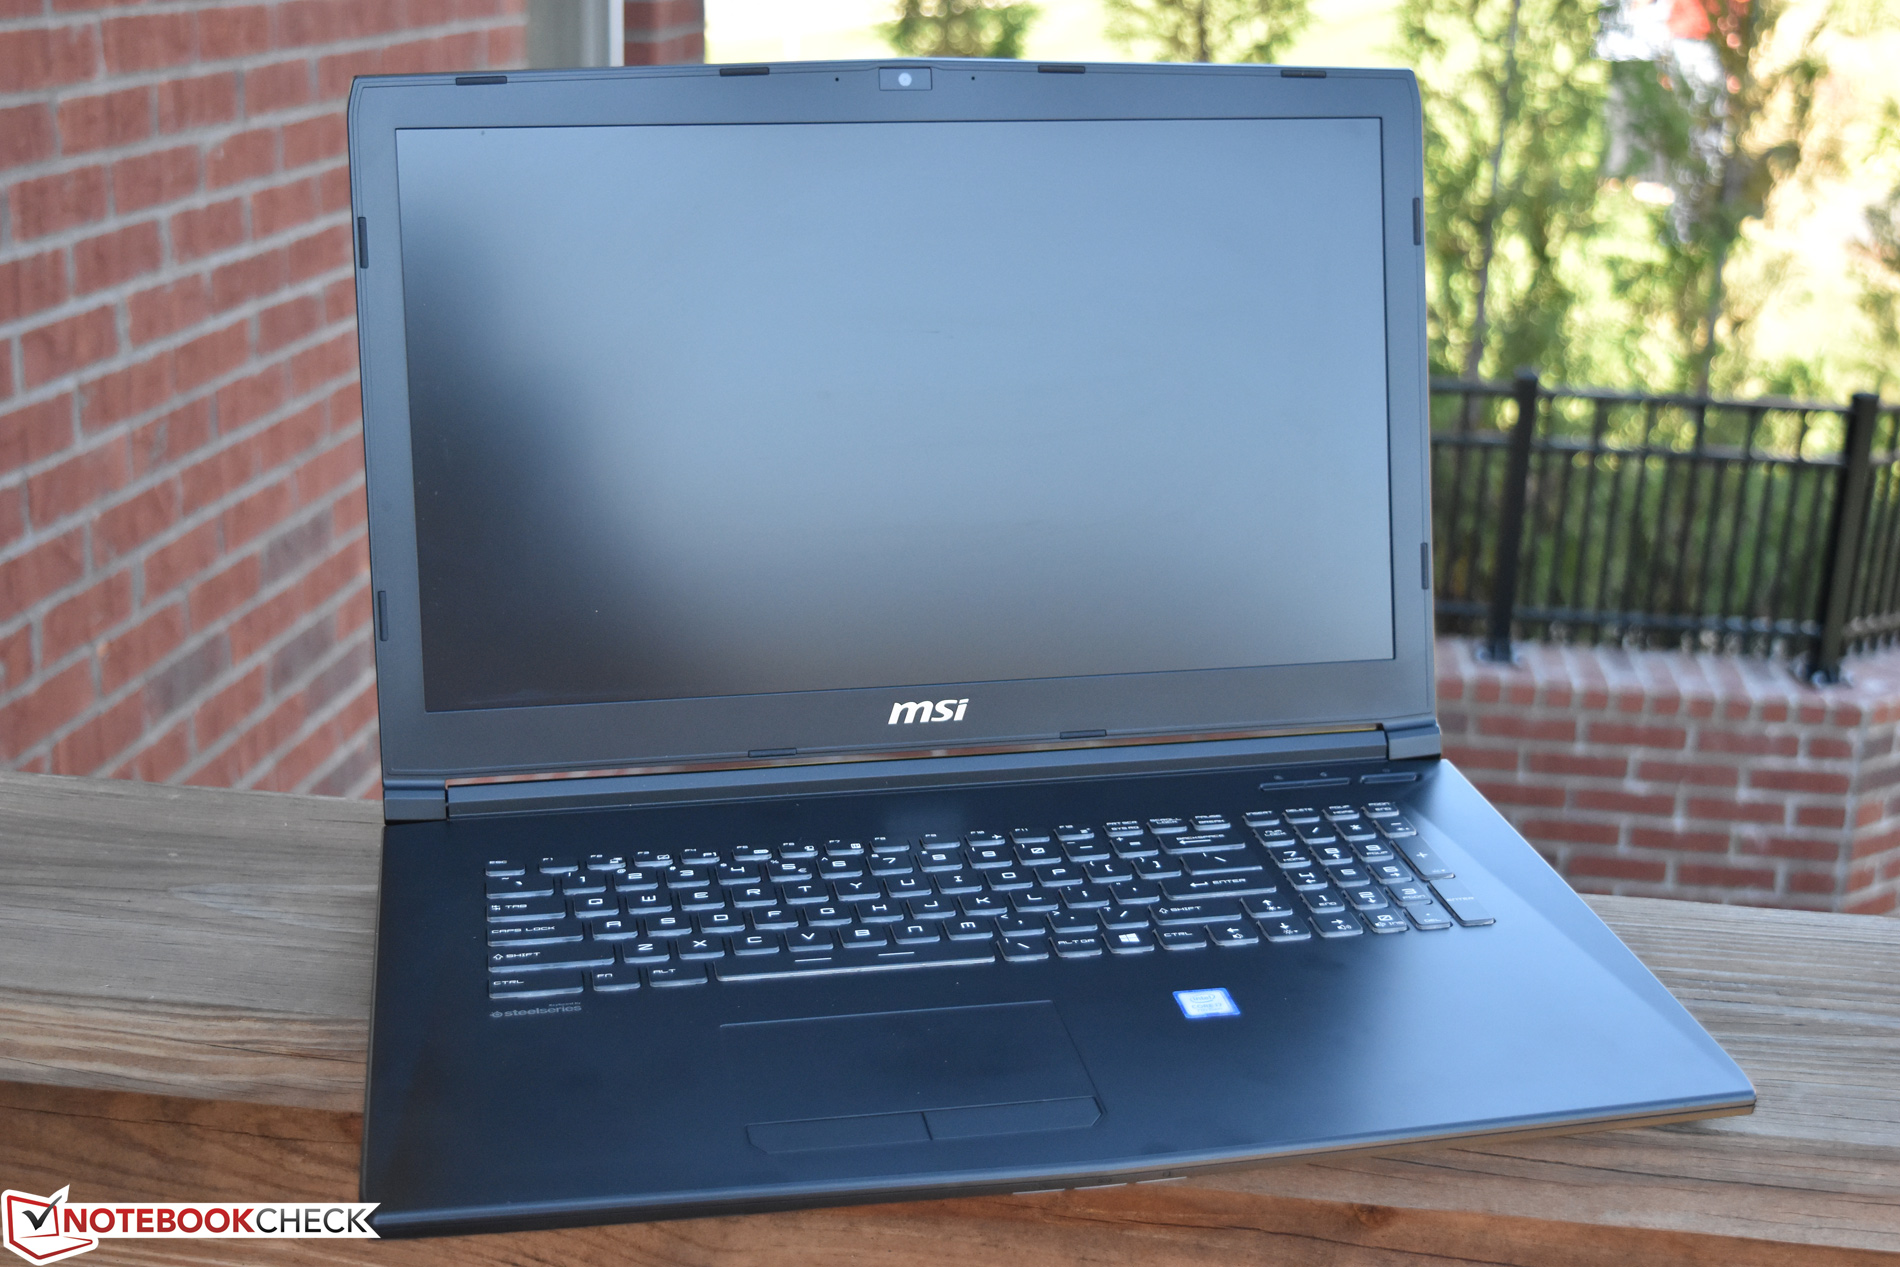
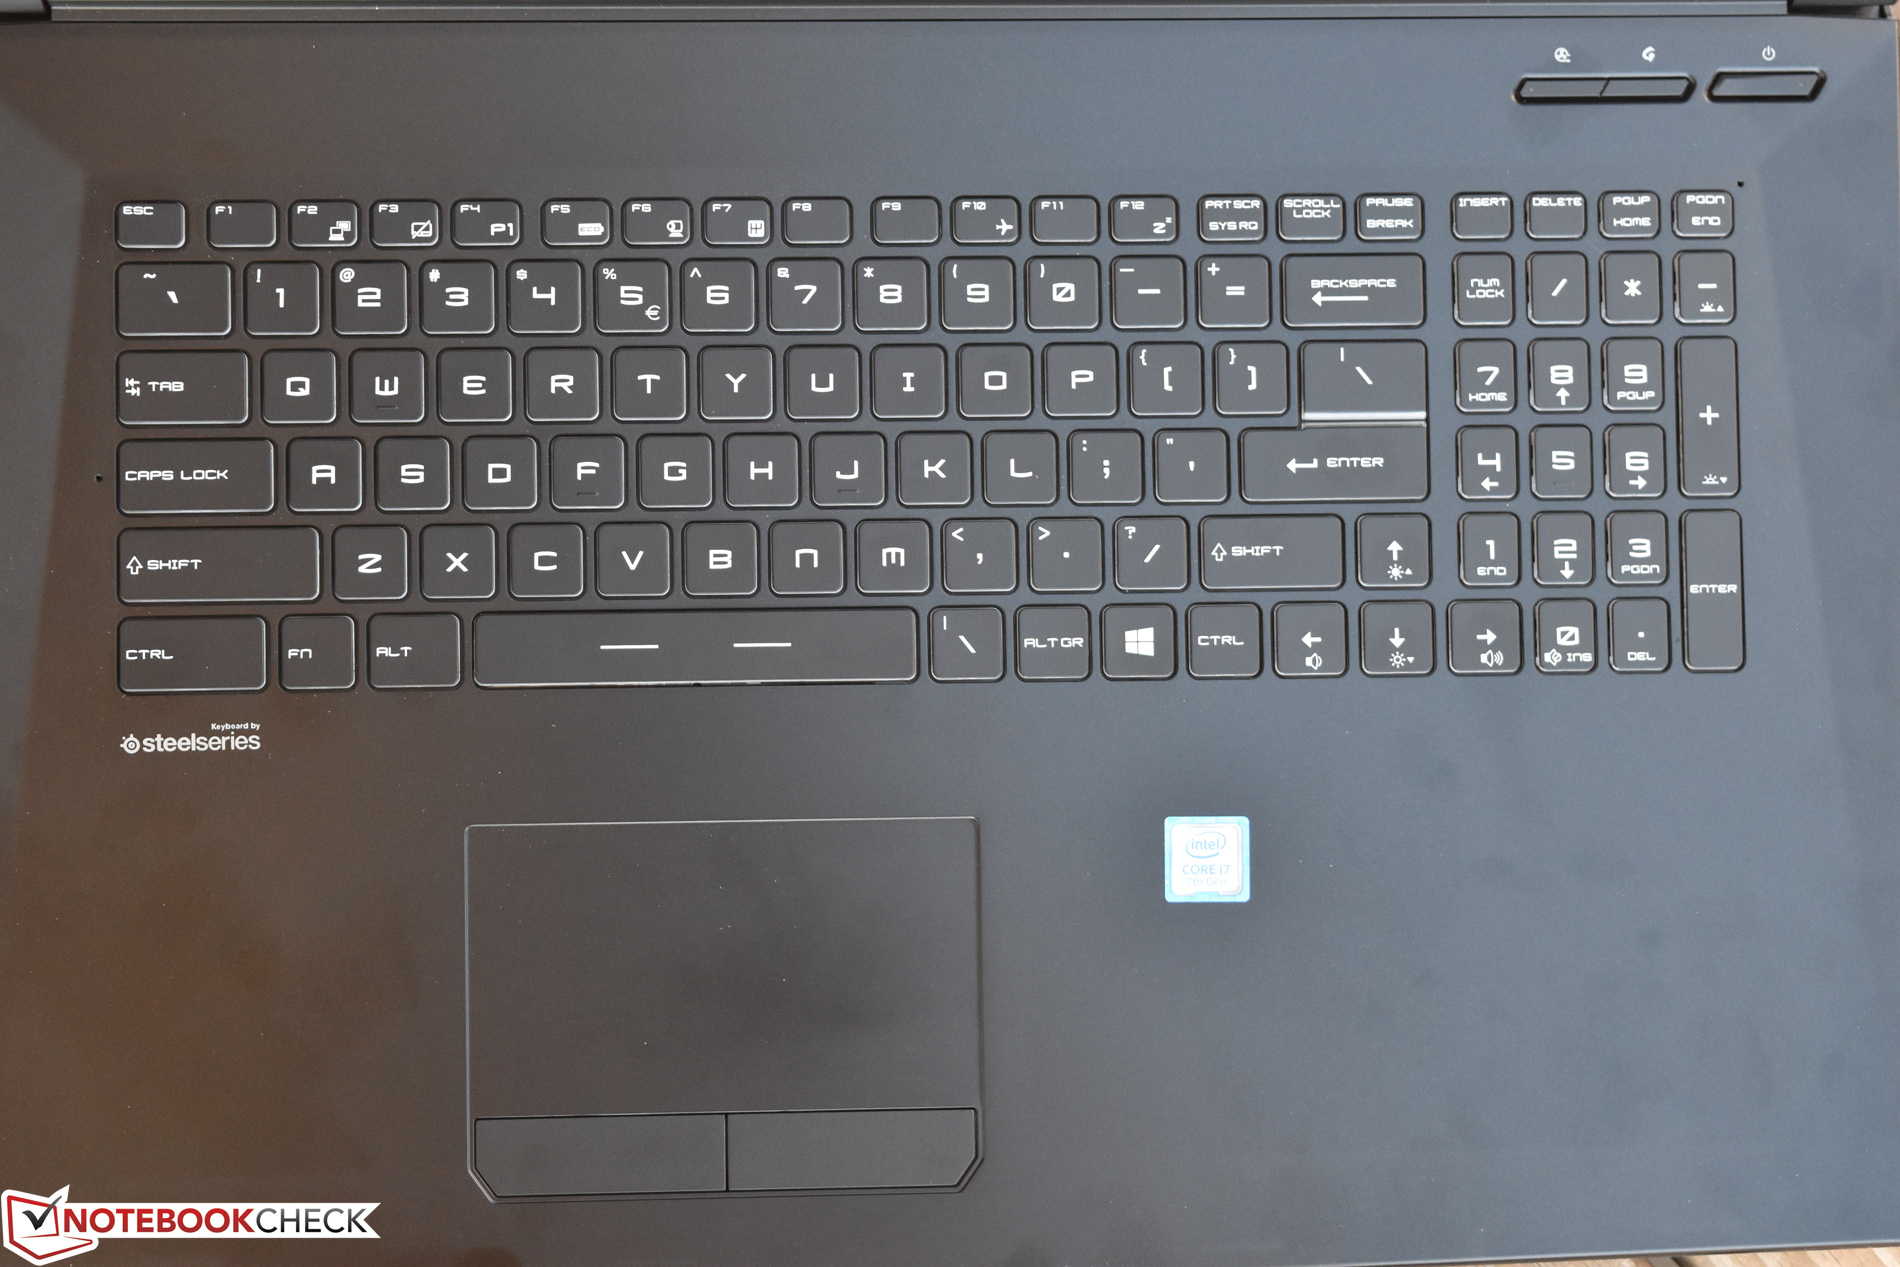
Com o GP72VR Leopard Pro, obtemos outro portátil de jogos com tela grande da MSI, com todos os fundamentos típicos que esperamos: um (ótimo) teclado SteelSeries com iluminação RGB, software de gerenciamento de sistema conveniente e versátil, plástico preto resistente o suficiente e, o mais importante, bom desempenho de jogos pelo preço de admissão. Também oferece velocidades de armazenamento NVMe super rápidas, uma excelente tela de 120 Hz e um áudio de quatro alto-falantes razoavelmente bom.
O MSI GP72VR Leopard Pro de quase $1.600, faz o trabalho, igualando seus concorrentes em termos de desempenho e cobrindo a maior parte das bases críticas que os jogadores procuram em um aparelho sólido.
Mas, além disso, o GP72VR tem mais uma surpresa na manga: é surpreendentemente leve para sua classe. om apenas 2,836 kg, é ainda mais leve que o Acer Predator Helios 300. No que diz respeito às máquinas de 17,3 polegadas, esta é tão tolerável em termos de peso e tamanho como seria de esperar.
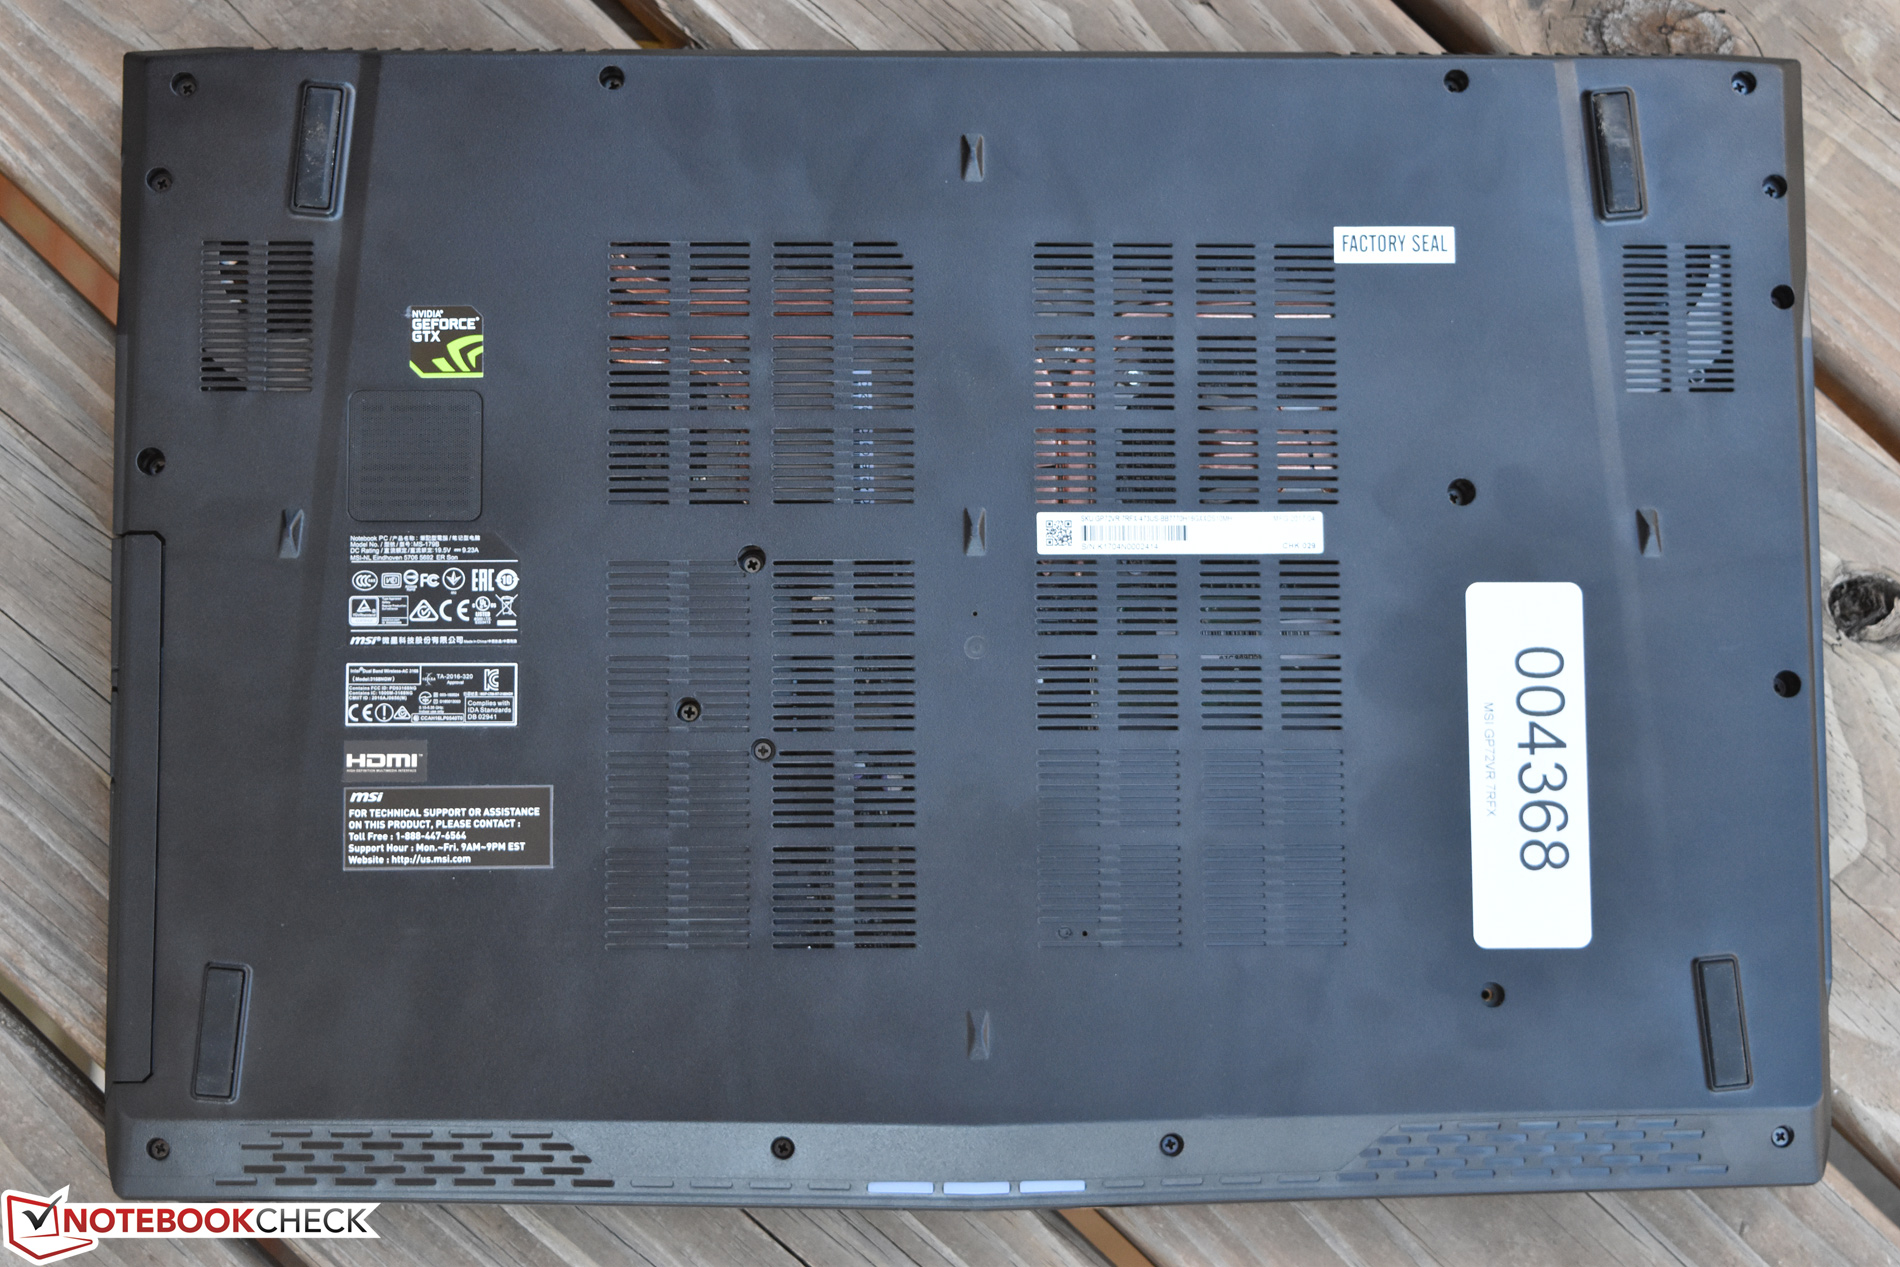
Porém, este peso reduzido vem com um sacrifício: as durações da bateria interna de 41 Wh são alguns dos mais curtos para qualquer portátil de jogos moderno. Felizmente, isso é de importância limitada para a maioria dos jogadores, e eles podem muito bem valorizar o peso e o tamanho reduzidos sobre a perda de um pouco de sua duração de bateria enquanto estiverem desconectados. Além disso, no entanto, também enfrentamos alguns problemas infelizes durante nossas tentativas de desmontar a máquina (questões além das preocupações habituais da etiqueta de garantia) - assim, aqueles que procuram comprar e atualizar mais tarde podem querer prestar atenção ao aviso: ou perdemos a loteria da construção com nossa unidade de teste, ou qualquer pessoa que remova o painel inferior enfrentará um esforço bastante estressante. Finalmente, a distribuição de calor sob carga também não é a ideal por dizer o mínimo, com bastante permeabilidade na parte superior e saindo pelo centro do teclado e touchpad.
Provavelmente, a melhor alternativa para esta máquina seria o Acer Predator Helios 300, que é mais fácil de desmontar e atualizar, mas que oferece menos portas e apenas uma tela padrão de 60 Hz. No entanto, apesar das críticas, o MSI GP72VR Leopard Pro de quase $1.600, faz o trabalho, igualando seus concorrentes em termos de desempenho e cobrindo a maior parte das bases críticas que os jogadores procuram em um aparelho sólido.
MSI GP72VR 7RFX
- 10/11/2017 v6 (old)
Steve Schardein
Price comparison
