Breve Análise do Portátil Guru Fire KS (Clevo P950HP6)
| SD Card Reader | |
| average JPG Copy Test (av. of 3 runs) | |
| Eurocom Q5 | |
| Guru Fire KS (Toshiba Exceria Pro SDXC 64 GB UHS-II) | |
| HP Omen 15-ce002ng (Toshiba Exceria Pro SDXC 64 GB UHS-II) | |
| MSI GS63VR 7RF-228US (Toshiba Exceria Pro SDXC 64 GB UHS-II) | |
| maximum AS SSD Seq Read Test (1GB) | |
| Eurocom Q5 | |
| Guru Fire KS (Toshiba Exceria Pro SDXC 64 GB UHS-II) | |
| HP Omen 15-ce002ng (Toshiba Exceria Pro SDXC 64 GB UHS-II) | |
| MSI GS63VR 7RF-228US (Toshiba Exceria Pro SDXC 64 GB UHS-II) | |
| Networking | |
| iperf3 transmit AX12 | |
| Acer Nitro 5 AN515-51-788E | |
| MSI GS63VR 7RF-228US | |
| Eurocom Q5 | |
| HP Omen 15-ce002ng | |
| Guru Fire KS | |
| iperf3 receive AX12 | |
| HP Omen 15-ce002ng | |
| Eurocom Q5 | |
| MSI GS63VR 7RF-228US | |
| Acer Nitro 5 AN515-51-788E | |
| Guru Fire KS | |
| |||||||||||||||||||||||||
iluminação: 93 %
iluminação com acumulador: 312 cd/m²
Contraste: 843:1 (Preto: 0.37 cd/m²)
ΔE ColorChecker Calman: 4.16 | ∀{0.5-29.43 Ø4.73}
ΔE Greyscale Calman: 2.53 | ∀{0.09-98 Ø4.97}
83% sRGB (Argyll 1.6.3 3D)
54% AdobeRGB 1998 (Argyll 1.6.3 3D)
60.5% AdobeRGB 1998 (Argyll 3D)
82.8% sRGB (Argyll 3D)
63.4% Display P3 (Argyll 3D)
Gamma: 2.48
CCT: 6667 K
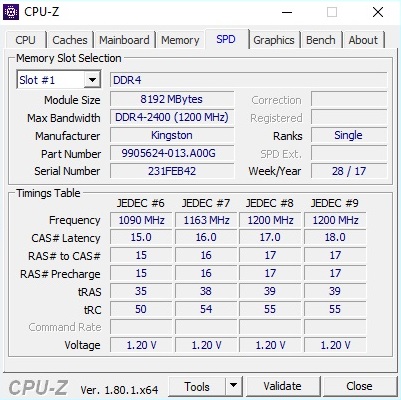
| Guru Fire KS LG Philips LP156WF6 (LGD046F), 1920x1080, 15.6" | Eurocom Q5 ID: LGD04D4, Name: LG Philips LP156UD1-SPB1, 3840x2160, 15.6" | MSI GS63VR 7RF-228US 3840x2160, 15.6" | HP Omen 15-ce002ng AUO42ED, 1920x1080, 15.6" | Acer Nitro 5 AN515-51-788E LG Philips LP156WF6-SPK6, 1920x1080, 15.6" | |
|---|---|---|---|---|---|
| Display | 6% | -18% | 8% | -29% | |
| Display P3 Coverage (%) | 63.4 | 63 -1% | 48.21 -24% | 65.8 4% | 41.7 -34% |
| sRGB Coverage (%) | 82.8 | 92.7 12% | 72.6 -12% | 90.9 10% | 62.2 -25% |
| AdobeRGB 1998 Coverage (%) | 60.5 | 64.4 6% | 49.81 -18% | 66.5 10% | 43.17 -29% |
| Response Times | 11% | 25% | -7% | 20% | |
| Response Time Grey 50% / Grey 80% * (ms) | 40.8 ? | 32.4 ? 21% | 28 ? 31% | 43.2 ? -6% | 35 ? 14% |
| Response Time Black / White * (ms) | 29.2 ? | 28.8 ? 1% | 23.6 ? 19% | 31.2 ? -7% | 22 ? 25% |
| PWM Frequency (Hz) | 21370 ? | 1351 ? | |||
| Screen | -21% | -50% | 12% | -19% | |
| Brightness middle (cd/m²) | 312 | 287.5 -8% | 274.2 -12% | 304 -3% | 276 -12% |
| Brightness (cd/m²) | 304 | 279 -8% | 263 -13% | 289 -5% | 265 -13% |
| Brightness Distribution (%) | 93 | 87 -6% | 92 -1% | 86 -8% | 91 -2% |
| Black Level * (cd/m²) | 0.37 | 0.65 -76% | 0.44 -19% | 0.26 30% | 0.25 32% |
| Contrast (:1) | 843 | 442 -48% | 623 -26% | 1169 39% | 1104 31% |
| Colorchecker dE 2000 * | 4.16 | 4.5 -8% | 8 -92% | 3.46 17% | 5.06 -22% |
| Colorchecker dE 2000 max. * | 10 | 8.9 11% | 14.6 -46% | 7.72 23% | 10.13 -1% |
| Greyscale dE 2000 * | 2.53 | 4.6 -82% | 9.1 -260% | 2.46 3% | 6.25 -147% |
| Gamma | 2.48 89% | 2.39 92% | 2.24 98% | 2.38 92% | 1.76 125% |
| CCT | 6667 97% | 7393 88% | 5020 129% | 6915 94% | 6873 95% |
| Color Space (Percent of AdobeRGB 1998) (%) | 54 | 59 9% | 45.7 -15% | 59 9% | 40 -26% |
| Color Space (Percent of sRGB) (%) | 83 | 92.3 11% | 72.1 -13% | 91 10% | 62 -25% |
| Média Total (Programa/Configurações) | -1% /
-11% | -14% /
-33% | 4% /
8% | -9% /
-16% |
* ... menor é melhor
Exibir tempos de resposta
| ↔ Tempo de resposta preto para branco | ||
|---|---|---|
| 29.2 ms ... ascensão ↗ e queda ↘ combinadas | ↗ 16.8 ms ascensão | 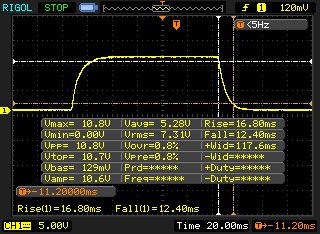 |
| ↘ 12.4 ms queda | ||
| A tela mostra taxas de resposta relativamente lentas em nossos testes e pode ser muito lenta para os jogadores. Em comparação, todos os dispositivos testados variam de 0.1 (mínimo) a 240 (máximo) ms. » 78 % de todos os dispositivos são melhores. Isso significa que o tempo de resposta medido é pior que a média de todos os dispositivos testados (19.9 ms). | ||
| ↔ Tempo de resposta 50% cinza a 80% cinza | ||
| 40.8 ms ... ascensão ↗ e queda ↘ combinadas | ↗ 21.2 ms ascensão | 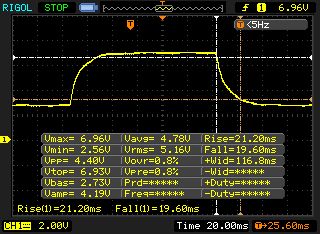 |
| ↘ 19.6 ms queda | ||
| A tela mostra taxas de resposta lentas em nossos testes e será insatisfatória para os jogadores. Em comparação, todos os dispositivos testados variam de 0.165 (mínimo) a 636 (máximo) ms. » 64 % de todos os dispositivos são melhores. Isso significa que o tempo de resposta medido é pior que a média de todos os dispositivos testados (31.1 ms). | ||
Cintilação da tela / PWM (modulação por largura de pulso)
| Tela tremeluzindo/PWM detectado | 21370 Hz | ≤ 95 % configuração de brilho | 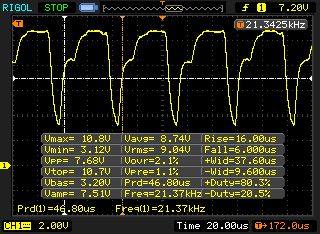 |
A luz de fundo da tela pisca em 21370 Hz (pior caso, por exemplo, utilizando PWM) Cintilação detectada em uma configuração de brilho de 95 % e abaixo. Não deve haver cintilação ou PWM acima desta configuração de brilho. A frequência de 21370 Hz é bastante alta, então a maioria dos usuários sensíveis ao PWM não deve notar nenhuma oscilação. [pwm_comparison] Em comparação: 52 % de todos os dispositivos testados não usam PWM para escurecer a tela. Se PWM foi detectado, uma média de 7801 (mínimo: 5 - máximo: 343500) Hz foi medida. | |||
| Cinebench R11.5 | |
| CPU Single 64Bit | |
| HP Omen 15-ce002ng | |
| Guru Fire KS | |
| MSI GS63VR 7RF-228US | |
| Eurocom Q5 | |
| Acer Nitro 5 AN515-51-788E | |
| CPU Multi 64Bit | |
| MSI GS63VR 7RF-228US | |
| HP Omen 15-ce002ng | |
| Eurocom Q5 | |
| Guru Fire KS | |
| Acer Nitro 5 AN515-51-788E | |
| PCMark 8 | |
| Home Score Accelerated v2 | |
| HP Omen 15-ce002ng | |
| Acer Nitro 5 AN515-51-788E | |
| MSI GS63VR 7RF-228US | |
| Eurocom Q5 | |
| Guru Fire KS | |
| Work Score Accelerated v2 | |
| HP Omen 15-ce002ng | |
| MSI GS63VR 7RF-228US | |
| Guru Fire KS | |
| Acer Nitro 5 AN515-51-788E | |
| Eurocom Q5 | |
| PCMark 10 - Score | |
| Eurocom Q5 | |
| HP Omen 15-ce002ng | |
| Guru Fire KS | |
| Acer Nitro 5 AN515-51-788E | |
| PCMark 8 Home Score Accelerated v2 | 3812 pontos | |
| PCMark 8 Work Score Accelerated v2 | 5100 pontos | |
| PCMark 10 Score | 4646 pontos | |
Ajuda | ||
| Guru Fire KS Samsung SSD 960 Evo 250GB m.2 NVMe | Eurocom Q5 Samsung SSD 960 Pro 512 GB m.2 | MSI GS63VR 7RF-228US Samsung SM961 MZVKW512HMJP m.2 PCI-e | HP Omen 15-ce002ng Samsung PM961 MZVLW256HEHP | Acer Nitro 5 AN515-51-788E Intel SSD 600p SSDPEKKW256G7 | |
|---|---|---|---|---|---|
| CrystalDiskMark 5.2 / 6 | 33% | -1% | |||
| Read Seq Q32T1 (MB/s) | 3071 | 3381 10% | 3431 12% | ||
| Write Seq Q32T1 (MB/s) | 1463 | 2075 42% | 1246 -15% | ||
| Read 4K Q32T1 (MB/s) | 594 | 575 -3% | 586 -1% | ||
| Write 4K Q32T1 (MB/s) | 493.3 | 498.7 1% | 486 -1% | ||
| Read Seq (MB/s) | 1250 | 2763 121% | 1419 14% | ||
| Write Seq (MB/s) | 1404 | 2073 48% | 1266 -10% | ||
| Read 4K (MB/s) | 45.66 | 57.2 25% | 47.14 3% | ||
| Write 4K (MB/s) | 172.5 | 202.6 17% | 156 -10% |

| 3DMark - 1920x1080 Fire Strike Graphics | |
| Eurocom Q5 | |
| Guru Fire KS | |
| MSI GS63VR 7RF-228US | |
| HP Omen 15-ce002ng | |
| Acer Nitro 5 AN515-51-788E | |
| Acer Nitro 5 AN515-51-788E | |
| 3DMark 11 - 1280x720 Performance GPU | |
| Eurocom Q5 | |
| MSI GS63VR 7RF-228US | |
| Guru Fire KS | |
| HP Omen 15-ce002ng | |
| Acer Nitro 5 AN515-51-788E | |
| Acer Nitro 5 AN515-51-788E | |
| 3DMark 11 Performance | 11559 pontos | |
| 3DMark Ice Storm Standard Score | 117404 pontos | |
| 3DMark Cloud Gate Standard Score | 24328 pontos | |
| 3DMark Fire Strike Score | 9663 pontos | |
Ajuda | ||
| The Witcher 3 | |
| 1920x1080 Ultra Graphics & Postprocessing (HBAO+) | |
| Eurocom Q5 | |
| MSI GS63VR 7RF-228US | |
| Guru Fire KS | |
| HP Omen 15-ce002ng | |
| Acer Nitro 5 AN515-51-788E | |
| 1920x1080 High Graphics & Postprocessing (Nvidia HairWorks Off) | |
| MSI GS63VR 7RF-228US | |
| Guru Fire KS | |
| HP Omen 15-ce002ng | |
| Acer Nitro 5 AN515-51-788E | |
| baixo | média | alto | ultra | |
|---|---|---|---|---|
| The Witcher 3 (2015) | 69.8 | 38.4 | ||
| Rocket League (2017) | 136 | |||
| Dirt 4 (2017) | 96.3 | 54.2 | ||
| Playerunknown's Battlegrounds (PUBG) (2017) | 64.1 | 47.7 | ||
| F1 2017 (2017) | 81 | 60 | ||
| Ark Survival Evolved (2017) | 35.4 | 24 | ||
| FIFA 18 (2017) | 167 | 164 |
Barulho
| Ocioso |
| 31 / 36 / 44 dB |
| HDD |
| 31 dB |
| Carga |
| 48 / 54 dB |
 | ||
30 dB silencioso 40 dB(A) audível 50 dB(A) ruidosamente alto |
||
min: | ||
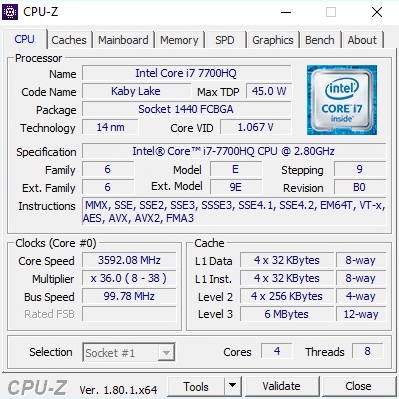
| Guru Fire KS GeForce GTX 1060 Mobile, i7-7700HQ | Eurocom Q5 GeForce GTX 1070 Max-Q, i7-7700HQ | MSI GS63VR 7RF-228US GeForce GTX 1060 Mobile, i7-7700HQ | HP Omen 15-ce002ng GeForce GTX 1060 Max-Q, i7-7700HQ | Acer Nitro 5 AN515-51-788E GeForce GTX 1050 Ti Mobile, i7-7700HQ | |
|---|---|---|---|---|---|
| Noise | 8% | 9% | 8% | 12% | |
| desligado / ambiente * (dB) | 29 | 29 -0% | 28.8 1% | 30 -3% | 30.6 -6% |
| Idle Minimum * (dB) | 31 | 31.5 -2% | 33.1 -7% | 30 3% | 30.6 1% |
| Idle Average * (dB) | 36 | 33.8 6% | 33.1 8% | 33 8% | 30.7 15% |
| Idle Maximum * (dB) | 44 | 33.8 23% | 34 23% | 37 16% | 30.7 30% |
| Load Average * (dB) | 48 | 41.7 13% | 37.2 22% | 41 15% | 43 10% |
| Witcher 3 ultra * (dB) | 48 | 41.7 13% | 46.1 4% | 42 12% | 39.7 17% |
| Load Maximum * (dB) | 54 | 54.2 -0% | 47.1 13% | 50 7% | 45.8 15% |
* ... menor é melhor
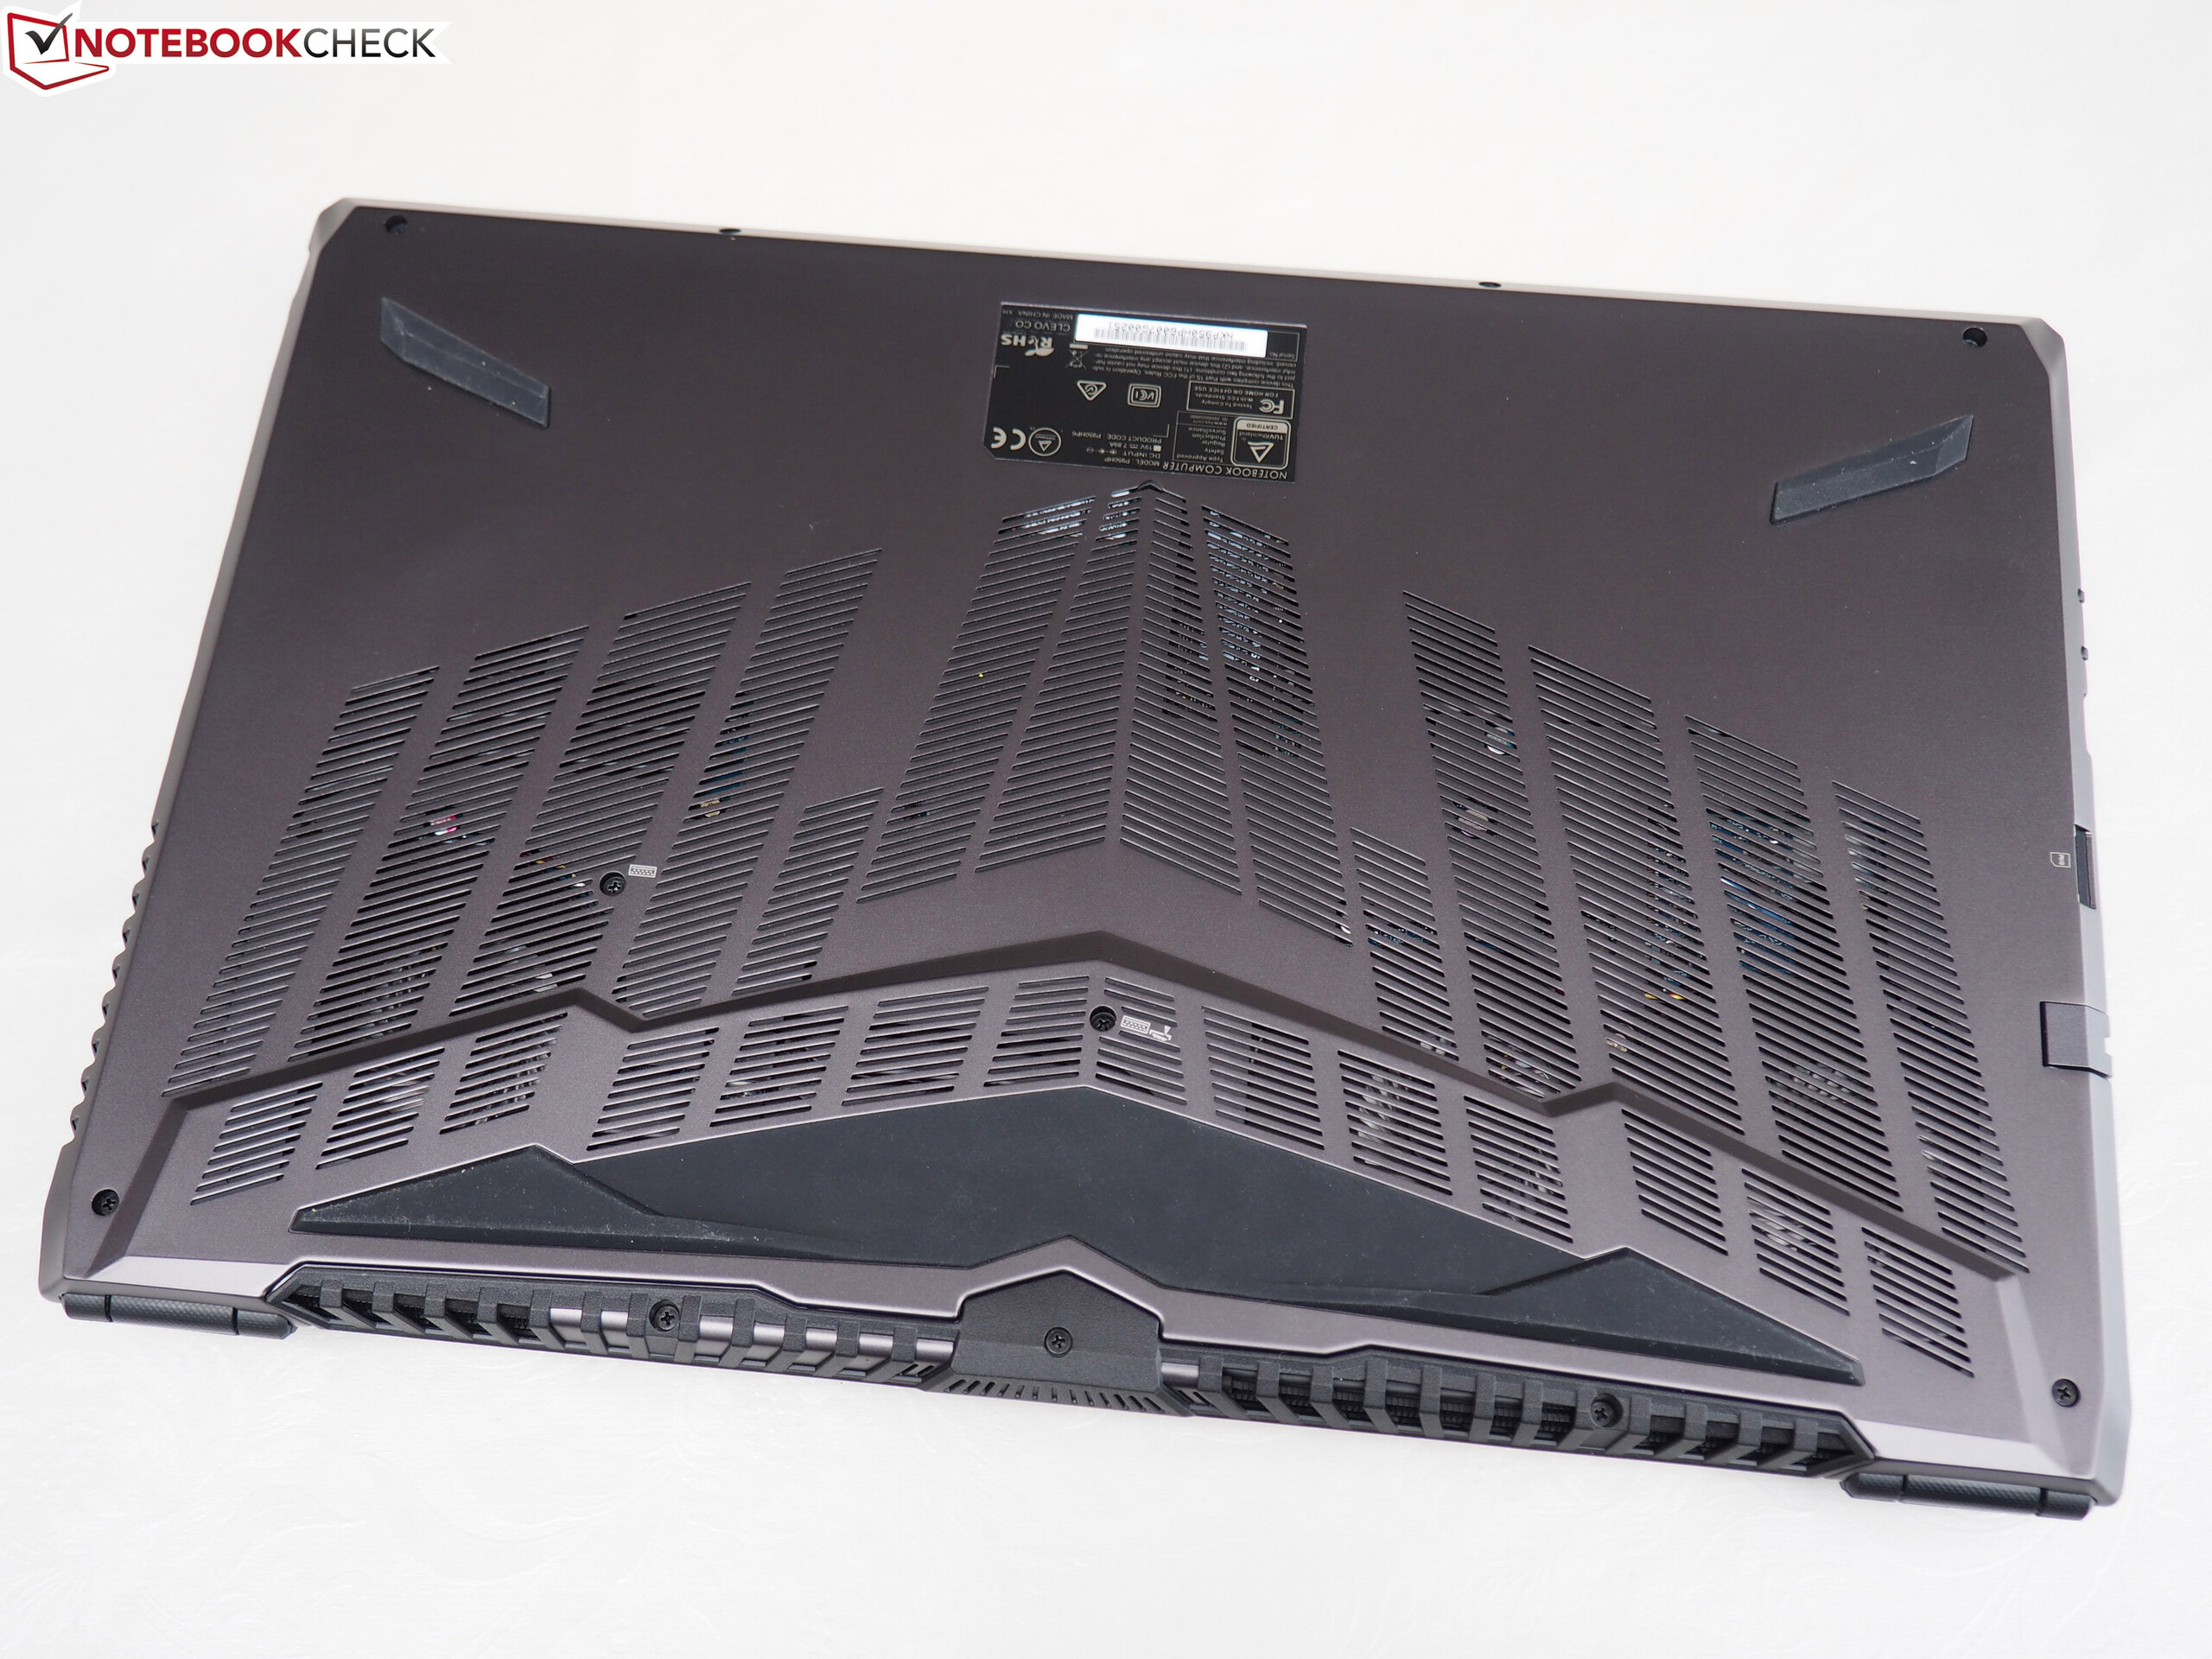
(-) A temperatura máxima no lado superior é 52 °C / 126 F, em comparação com a média de 40.4 °C / 105 F , variando de 21.2 a 68.8 °C para a classe Gaming.
(-) A parte inferior aquece até um máximo de 54 °C / 129 F, em comparação com a média de 43.2 °C / 110 F
(+) Em uso inativo, a temperatura média para o lado superior é 26.1 °C / 79 F, em comparação com a média do dispositivo de 33.9 °C / ### class_avg_f### F.
(-) Jogando The Witcher 3, a temperatura média para o lado superior é 40.4 °C / 105 F, em comparação com a média do dispositivo de 33.9 °C / ## #class_avg_f### F.
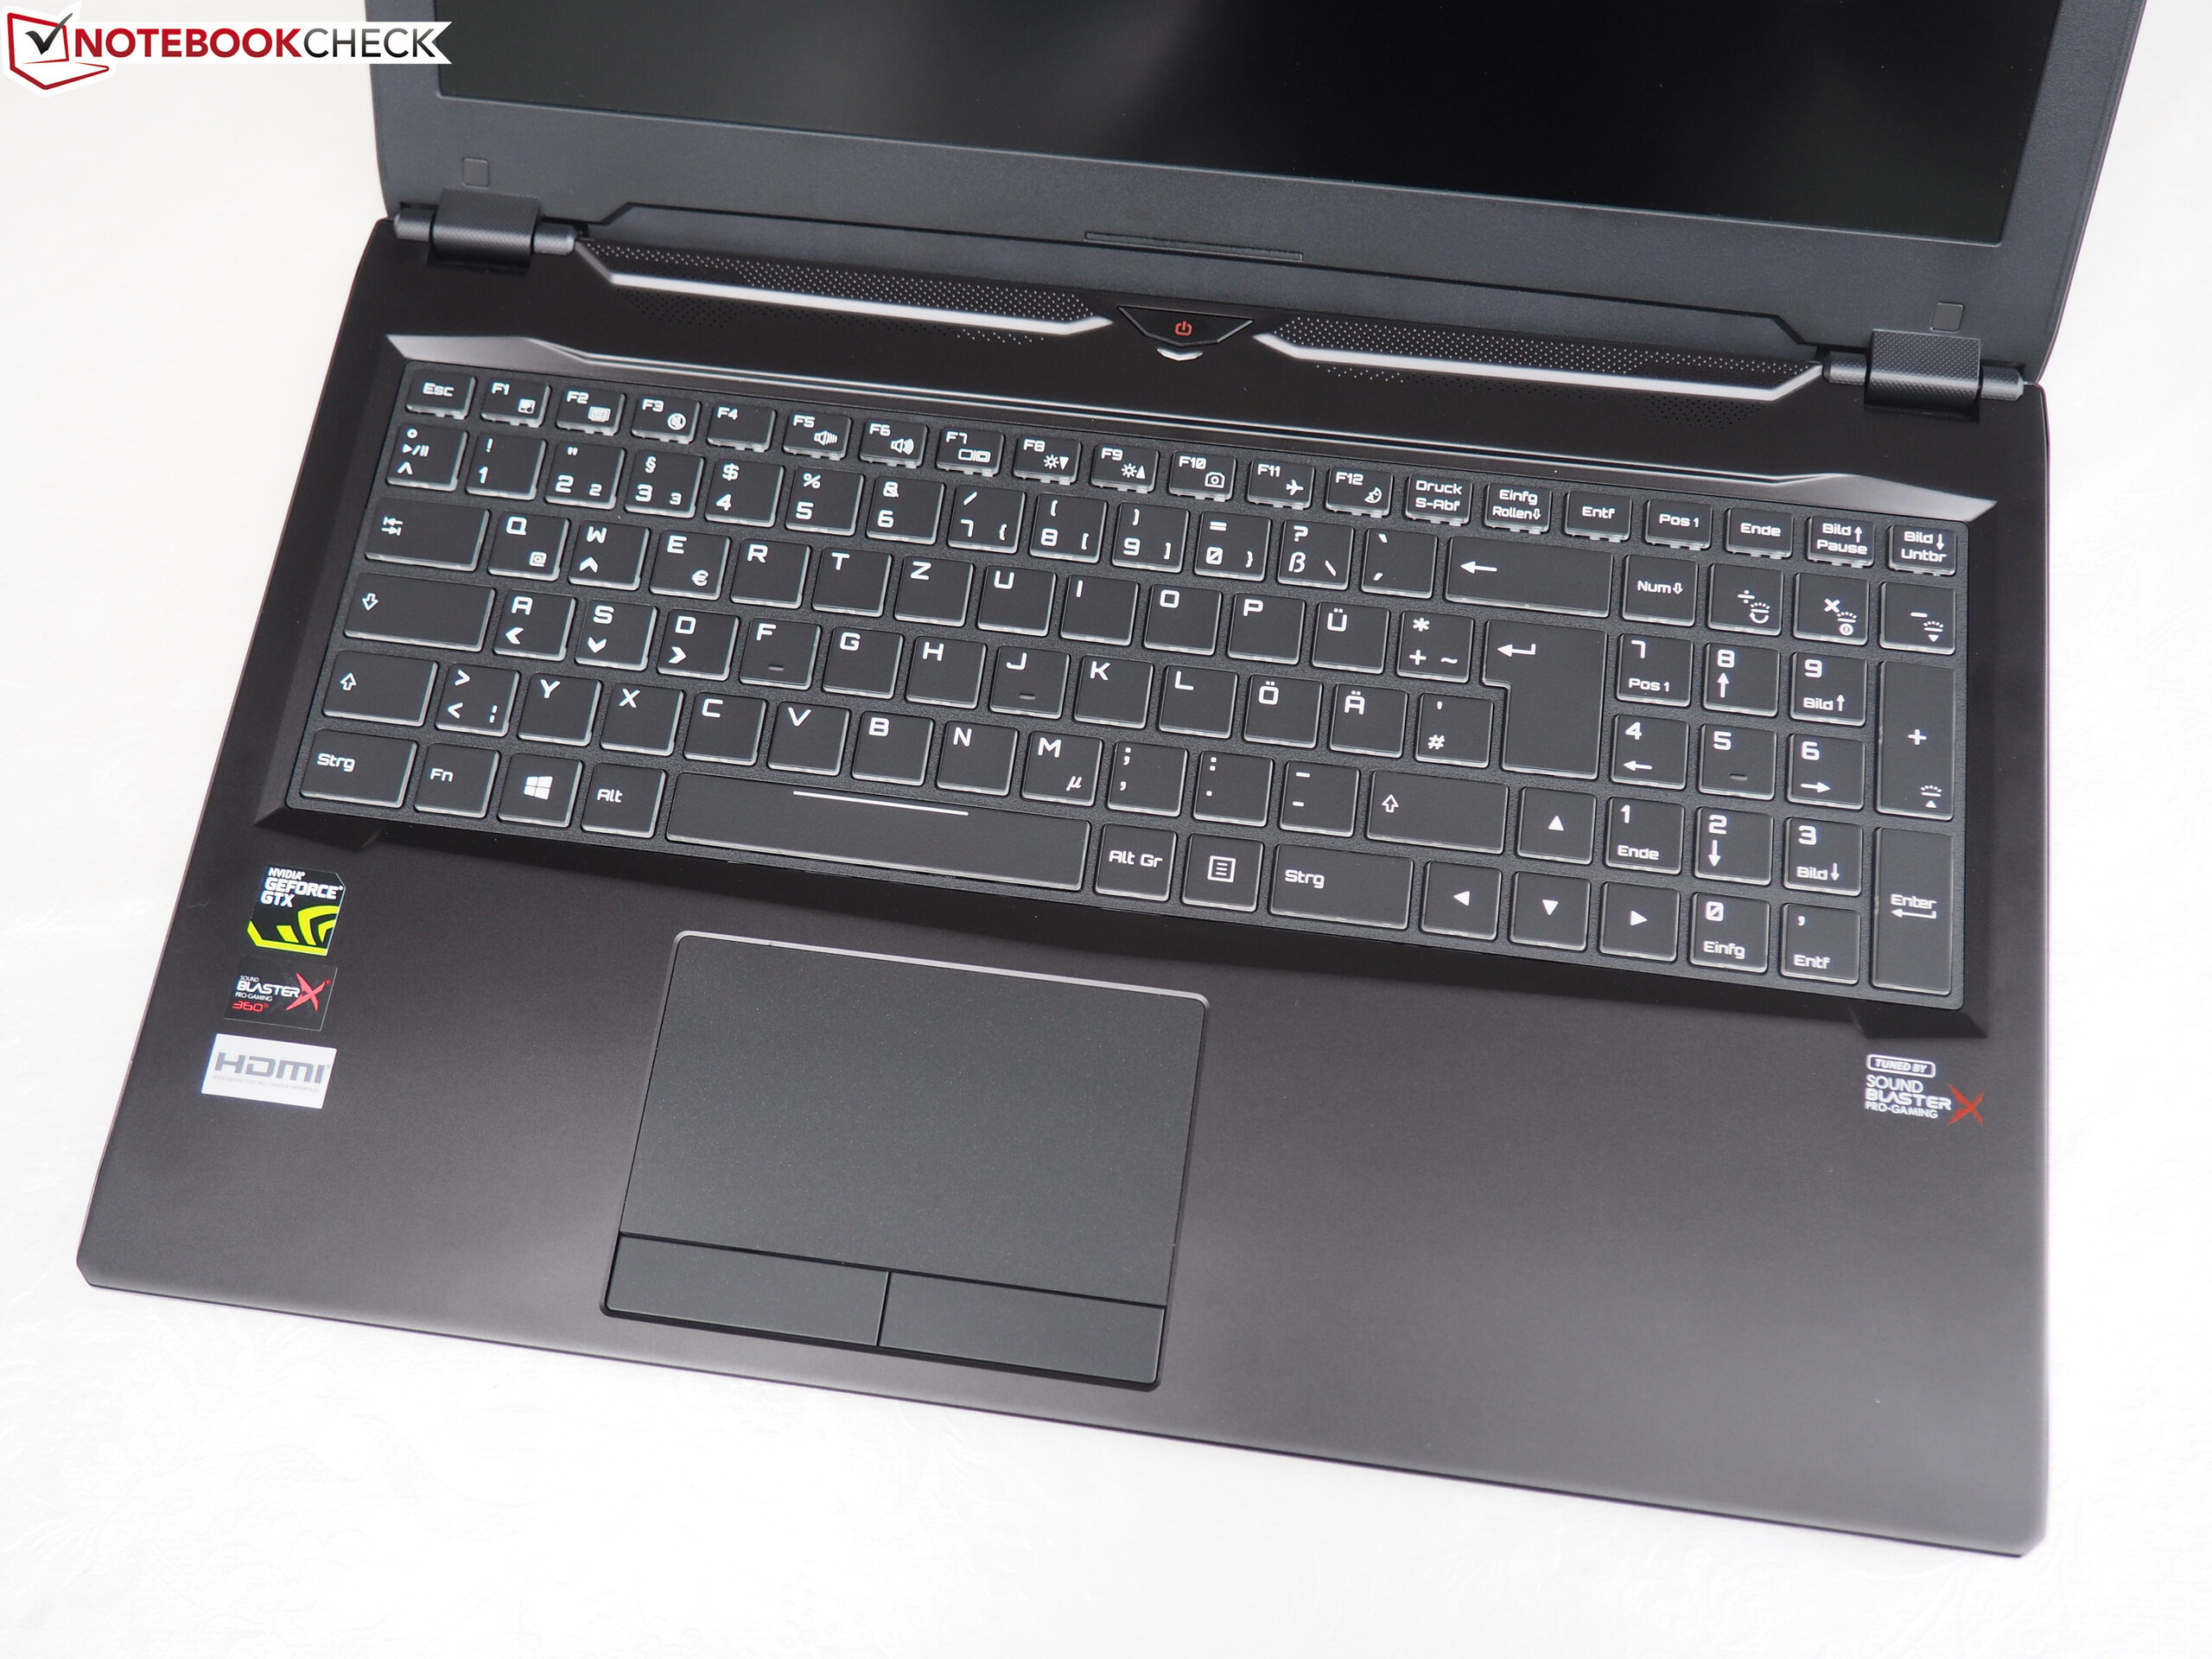
(±) Os apoios para as mãos e o touchpad podem ficar muito quentes ao toque, com um máximo de 39 °C / 102.2 F.
(-) A temperatura média da área do apoio para as mãos de dispositivos semelhantes foi 28.8 °C / 83.8 F (-10.2 °C / -18.4 F).
| Guru Fire KS GeForce GTX 1060 Mobile, i7-7700HQ | Eurocom Q5 GeForce GTX 1070 Max-Q, i7-7700HQ | MSI GS63VR 7RF-228US GeForce GTX 1060 Mobile, i7-7700HQ | HP Omen 15-ce002ng GeForce GTX 1060 Max-Q, i7-7700HQ | Acer Nitro 5 AN515-51-788E GeForce GTX 1050 Ti Mobile, i7-7700HQ | |
|---|---|---|---|---|---|
| Heat | -3% | 5% | -10% | 16% | |
| Maximum Upper Side * (°C) | 52 | 56.2 -8% | 47 10% | 41.1 21% | |
| Maximum Bottom * (°C) | 54 | 61.2 -13% | 54 -0% | 38.8 28% | |
| Idle Upper Side * (°C) | 28 | 27.8 1% | 28.4 -1% | 36 -29% | 28.7 -2% |
| Idle Bottom * (°C) | 33 | 29.6 10% | 29.6 10% | 40 -21% | 26.9 18% |
* ... menor é melhor
Guru Fire KS análise de áudio
(+) | os alto-falantes podem tocar relativamente alto (###valor### dB)
Graves 100 - 315Hz
(-) | quase nenhum baixo - em média 24.4% menor que a mediana
(±) | a linearidade dos graves é média (14.4% delta para a frequência anterior)
Médios 400 - 2.000 Hz
(+) | médios equilibrados - apenas 3.5% longe da mediana
(+) | médios são lineares (4.6% delta para frequência anterior)
Altos 2 - 16 kHz
(+) | agudos equilibrados - apenas 1.2% longe da mediana
(+) | os máximos são lineares (3.8% delta da frequência anterior)
Geral 100 - 16.000 Hz
(±) | a linearidade do som geral é média (17.2% diferença em relação à mediana)
Comparado com a mesma classe
» 46% de todos os dispositivos testados nesta classe foram melhores, 11% semelhantes, 42% piores
» O melhor teve um delta de 6%, a média foi 18%, o pior foi 132%
Comparado com todos os dispositivos testados
» 32% de todos os dispositivos testados foram melhores, 8% semelhantes, 60% piores
» O melhor teve um delta de 4%, a média foi 24%, o pior foi 134%
MSI GS63VR 7RF-228US análise de áudio
(±) | o volume do alto-falante é médio, mas bom (###valor### dB)
Graves 100 - 315Hz
(-) | quase nenhum baixo - em média 25.3% menor que a mediana
(±) | a linearidade dos graves é média (12.4% delta para a frequência anterior)
Médios 400 - 2.000 Hz
(+) | médios equilibrados - apenas 3.3% longe da mediana
(±) | a linearidade dos médios é média (7% delta para frequência anterior)
Altos 2 - 16 kHz
(±) | máximos mais altos - em média 8.1% maior que a mediana
(±) | a linearidade dos máximos é média (8.6% delta para frequência anterior)
Geral 100 - 16.000 Hz
(±) | a linearidade do som geral é média (28.4% diferença em relação à mediana)
Comparado com a mesma classe
» 94% de todos os dispositivos testados nesta classe foram melhores, 1% semelhantes, 5% piores
» O melhor teve um delta de 6%, a média foi 18%, o pior foi 132%
Comparado com todos os dispositivos testados
» 86% de todos os dispositivos testados foram melhores, 3% semelhantes, 12% piores
» O melhor teve um delta de 4%, a média foi 24%, o pior foi 134%
| desligado | |
| Ocioso | |
| Carga |
|
Key:
min: | |
| Guru Fire KS GeForce GTX 1060 Mobile, i7-7700HQ | Eurocom Q5 GeForce GTX 1070 Max-Q, i7-7700HQ | MSI GS63VR 7RF-228US GeForce GTX 1060 Mobile, i7-7700HQ | HP Omen 15-ce002ng GeForce GTX 1060 Max-Q, i7-7700HQ | Acer Nitro 5 AN515-51-788E GeForce GTX 1050 Ti Mobile, i7-7700HQ | |
|---|---|---|---|---|---|
| Power Consumption | -13% | -45% | -60% | 22% | |
| Idle Minimum * (Watt) | 6 | 9 -50% | 14.5 -142% | 18 -200% | 4.1 32% |
| Idle Average * (Watt) | 11 | 13.5 -23% | 17.3 -57% | 23 -109% | 6.9 37% |
| Idle Maximum * (Watt) | 20 | 13.7 31% | 17.4 13% | 30 -50% | 9.5 52% |
| Load Average * (Watt) | 79 | 87.8 -11% | 93 -18% | 85 -8% | 83 -5% |
| Witcher 3 ultra * (Watt) | 107 | 129 -21% | 128.8 -20% | 96 10% | 108 -1% |
| Load Maximum * (Watt) | 153 | 158.6 -4% | 158 -3% | 126 18% |
* ... menor é melhor
| Guru Fire KS GeForce GTX 1060 Mobile, i7-7700HQ, 55 Wh | Eurocom Q5 GeForce GTX 1070 Max-Q, i7-7700HQ, 55 Wh | MSI GS63VR 7RF-228US GeForce GTX 1060 Mobile, i7-7700HQ, 65 Wh | HP Omen 15-ce002ng GeForce GTX 1060 Max-Q, i7-7700HQ, 70 Wh | Acer Nitro 5 AN515-51-788E GeForce GTX 1050 Ti Mobile, i7-7700HQ, 48 Wh | |
|---|---|---|---|---|---|
| Duração da bateria | -36% | -34% | -41% | 5% | |
| Reader / Idle (h) | 10 | 7.8 -22% | 6.4 -36% | 4.3 -57% | 14.9 49% |
| H.264 (h) | 5.4 | 3.7 -31% | 5.2 -4% | ||
| WiFi v1.3 (h) | 5.7 | 4.3 -25% | 3.9 -32% | 3.3 -42% | 6.7 18% |
| Load (h) | 2 | 0.8 -60% | 1.3 -35% | 1.3 -35% | 1.1 -45% |
Pro
Contra
O Guru Fire KS é um portátil de jogos bem feito que tem um pouco de dificuldade lidando com o mal controle da ventoinha.
Ser bastante barulhento durante o uso 3Dé uma coisa. As RPM que mudam continuamente durante o modo inativo e o alto nível de ruído regular são outra, e se tornam bastante irritantes depois de um tempo.
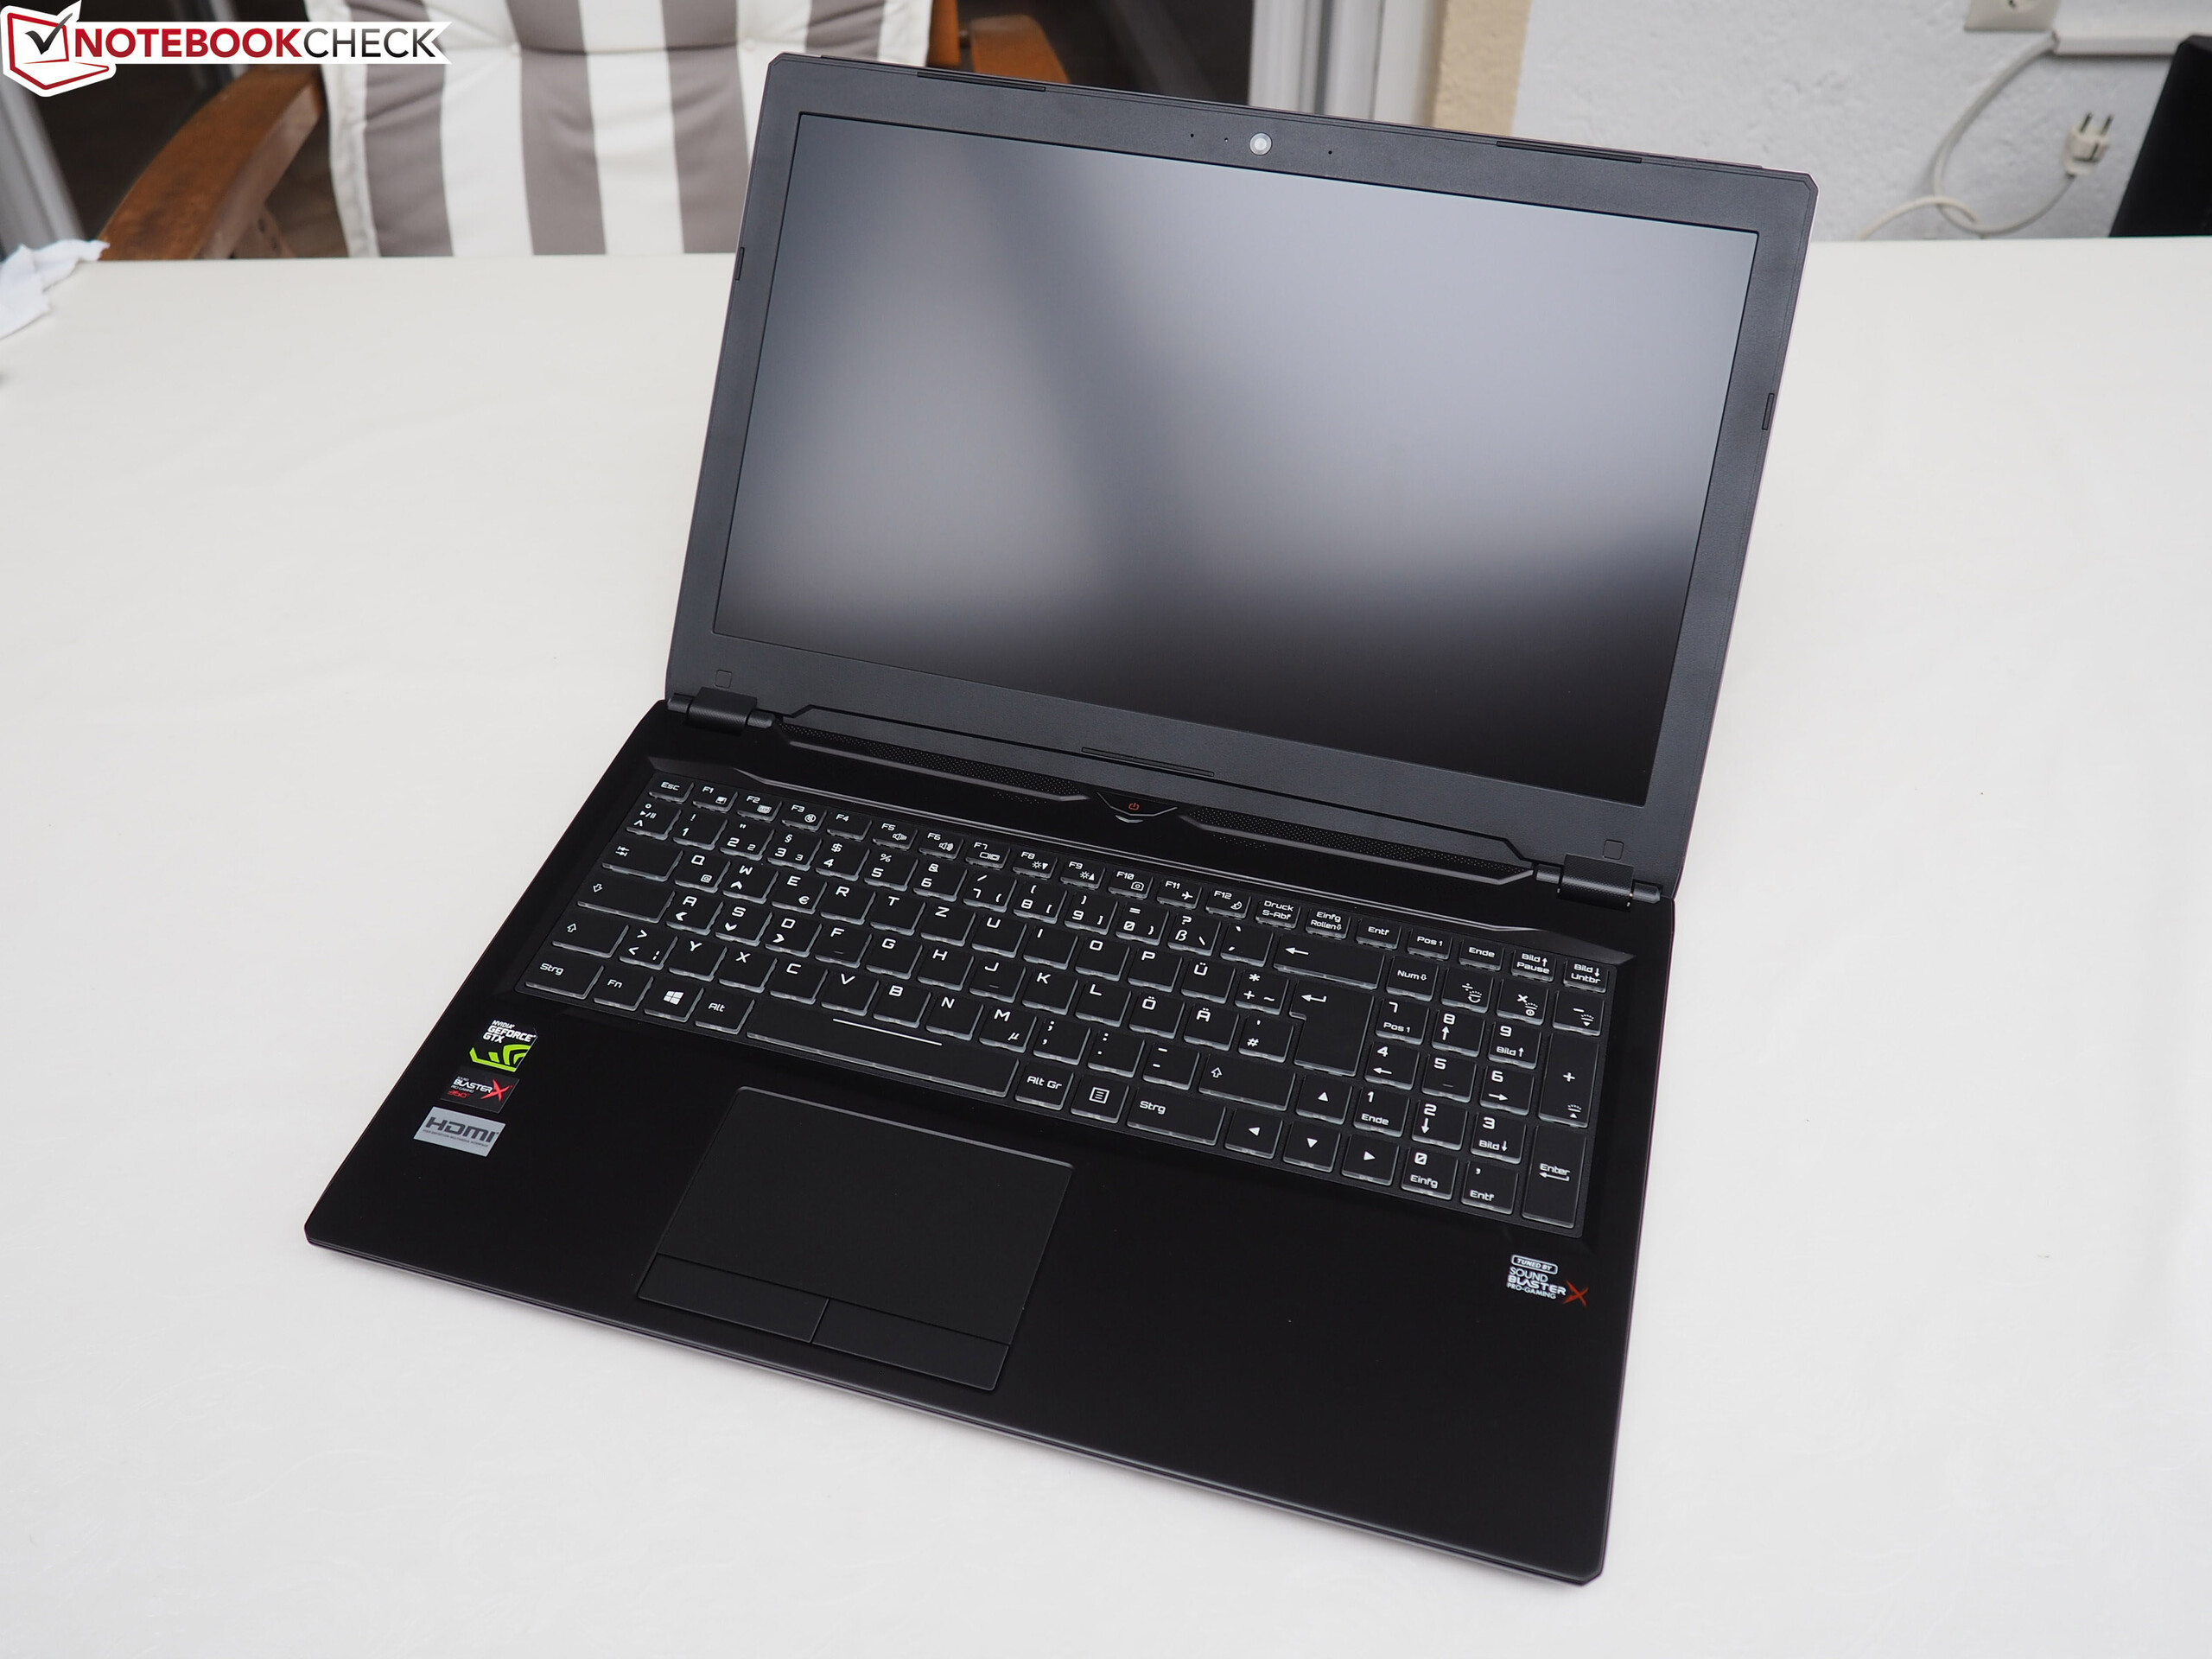
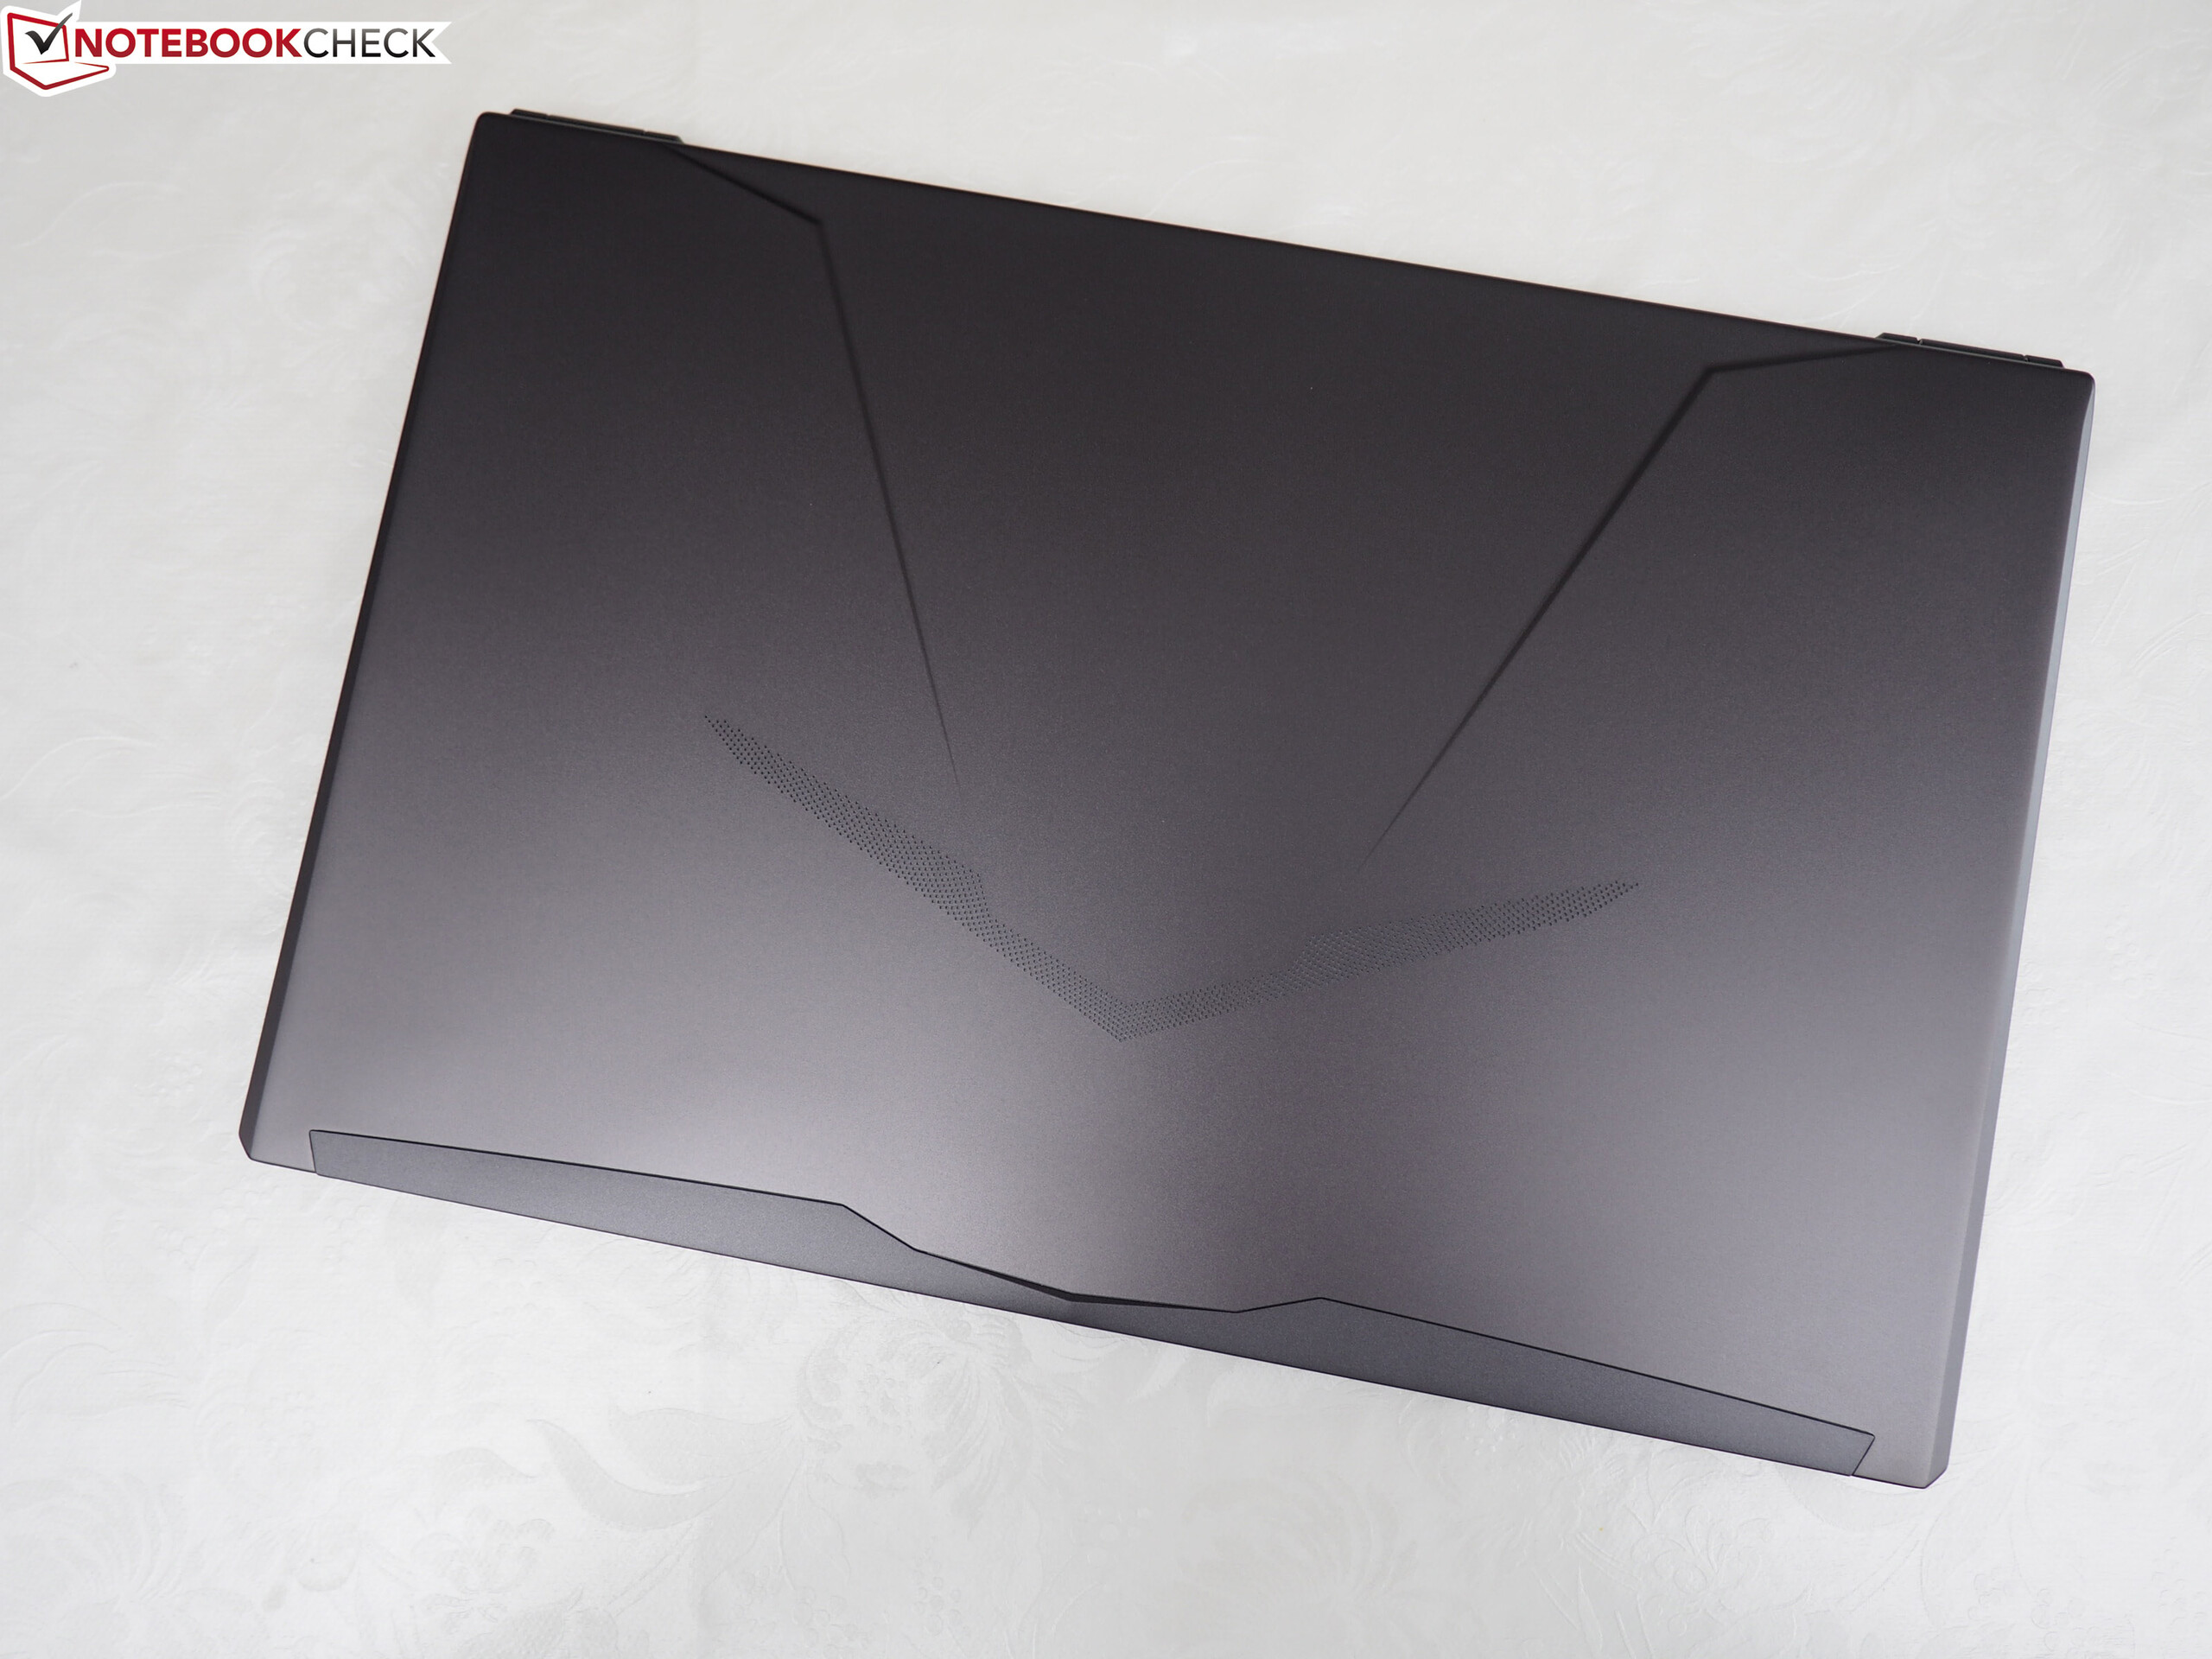
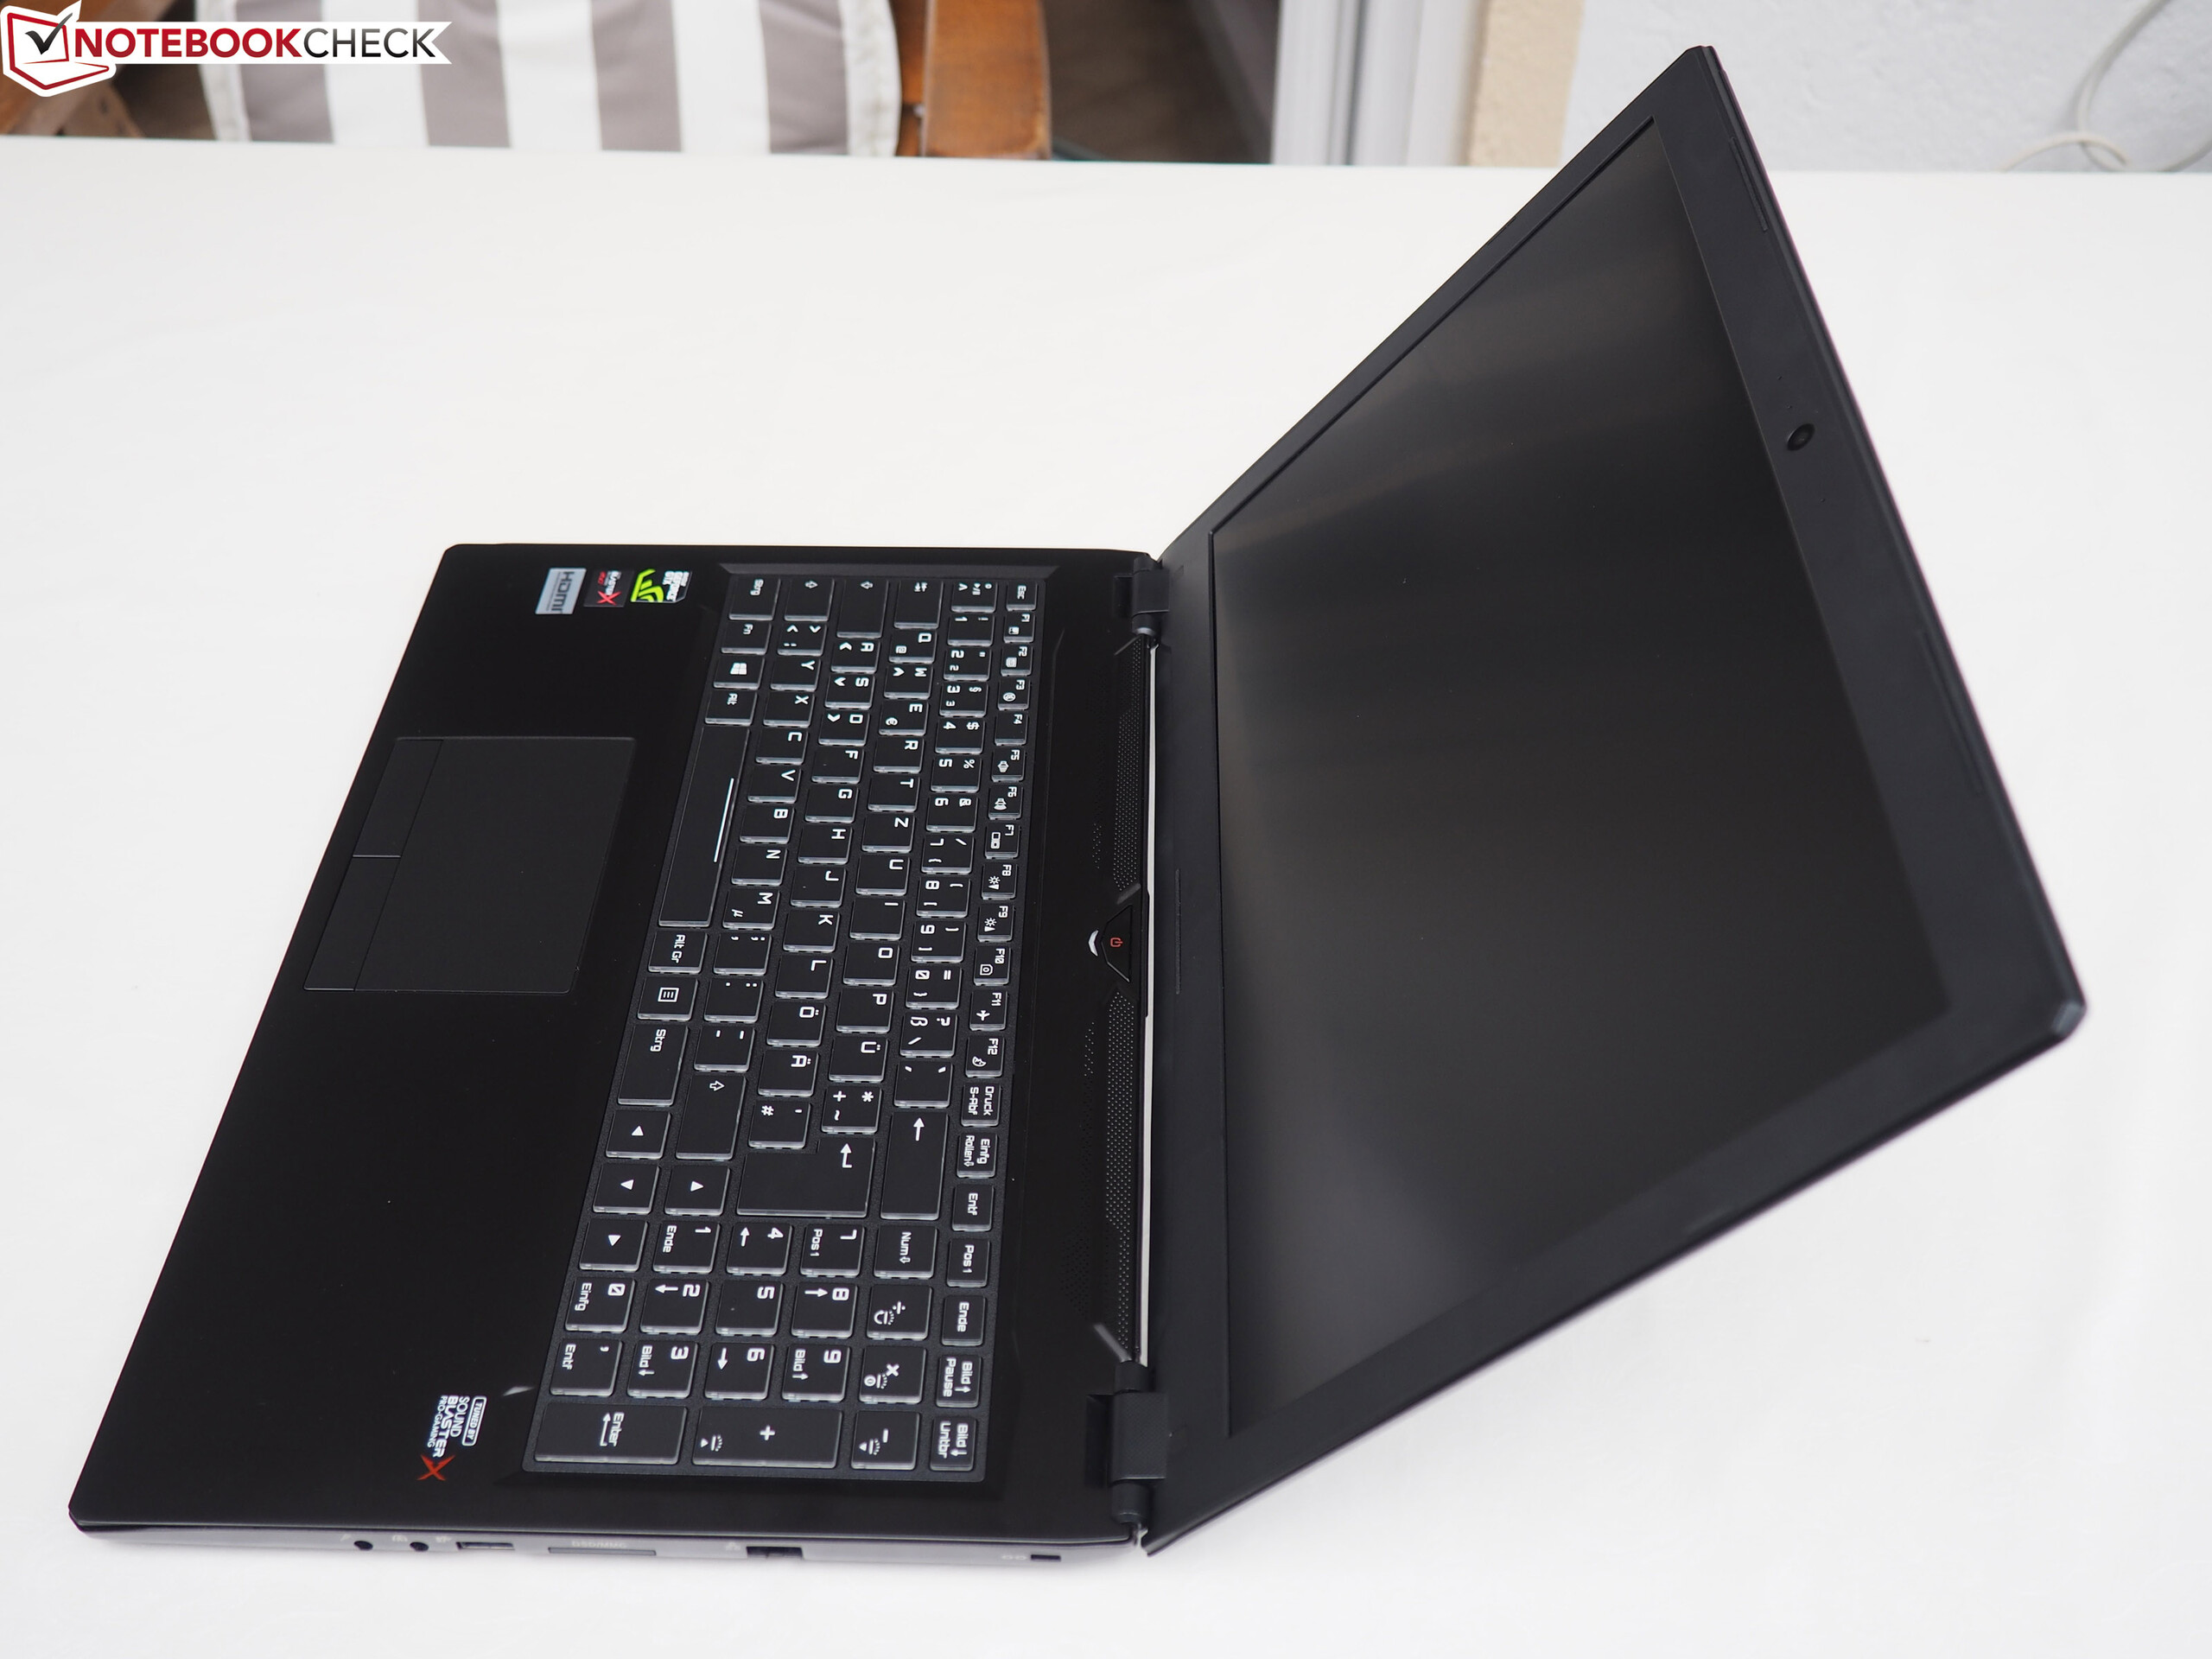
Sem esta desvantagem, definitivamente valeria a pena considerar o aparelho de 15 polegadas. Não apenas a carcaça de metal, mas também os dispositivos de entrada e a tela Full HD são muito bons, exceto por alguns detalhes. Os maiores argumentos para comprar este aparelho são as longas durações da bateria e sua construção compacta. Quase não há portáteis de gama alta que sejam confortáveis para carregar, portanto, você pode querer aceitar alta temperaturas da CPU, em troca por esta vantagem. Mas não esqueçamos que o Core i7-7700HQ tendeu a se afogar durante nossos testes de pois de um período de aplicativos 3D exigentes.
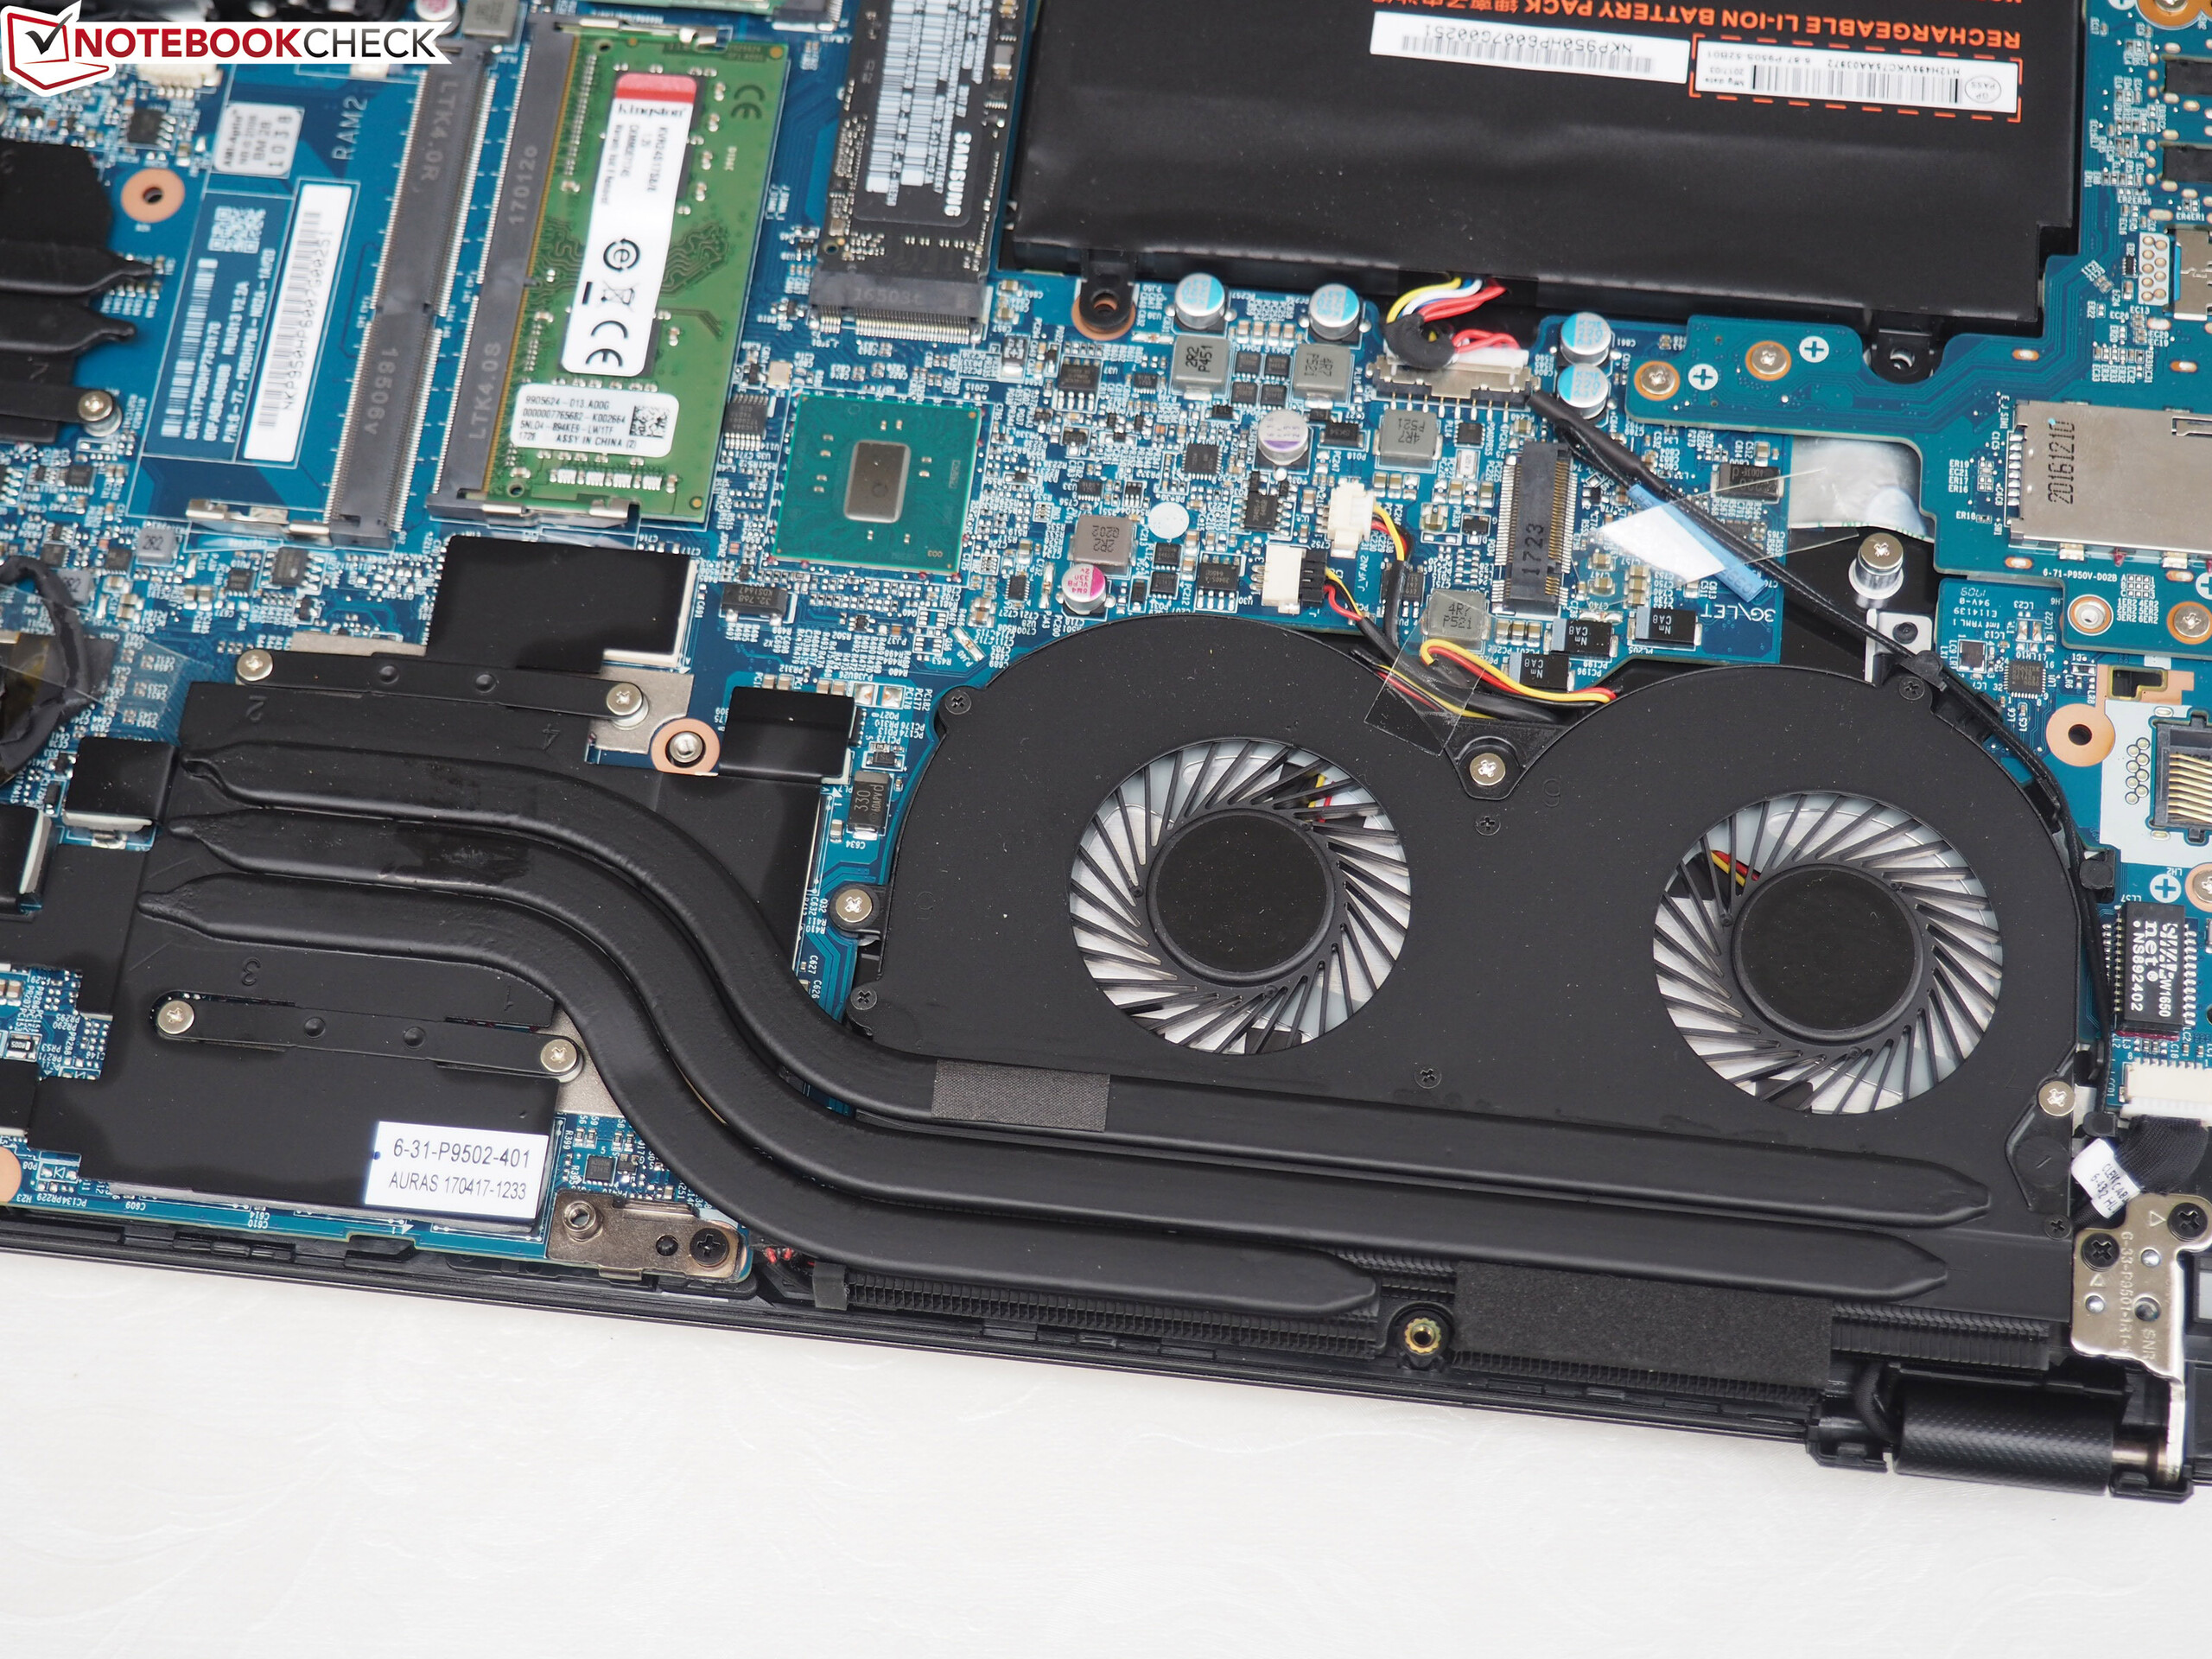
No geral, o sistema de resfriamento parece ser um pouco desafiado pelo equipamento de hardware do aparelho. Se o fabricante de barebone Clevo tem dificuldades criando um sistema de resfriamento adequado para um portátil de jogos ultrafino com GeForce GTX 1060, poderia ser melhor dar ao aparelho um milímetro ou dois para se limitar a si mesmos ao Core i5-7300HQ e GeForce GTX 1050 Ti ou GTX 1060 Max-Q.
Guru Fire KS
- 10/12/2017 v6 (old)
Florian Glaser
Price comparison