Breve Análise do Portátil HP Omen 15 (7700HQ, GTX 1060 Max-Q, Full-HD)
| SD Card Reader | |
| average JPG Copy Test (av. of 3 runs) | |
| Schenker XMG P507 PRO (Toshiba Exceria Pro SDXC 64 GB UHS-II) | |
| Gigabyte Aero 15 (Toshiba Exceria Pro SDXC 64 GB UHS-II) | |
| HP Omen 15-ce002ng (Toshiba Exceria Pro SDXC 64 GB UHS-II) | |
| MSI GS63VR 7RF-228US (Toshiba Exceria Pro SDXC 64 GB UHS-II) | |
| Acer Aspire VX5-591G-75C4 VX15 | |
| maximum AS SSD Seq Read Test (1GB) | |
| Gigabyte Aero 15 (Toshiba Exceria Pro SDXC 64 GB UHS-II) | |
| Schenker XMG P507 PRO (Toshiba Exceria Pro SDXC 64 GB UHS-II) | |
| HP Omen 15-ce002ng (Toshiba Exceria Pro SDXC 64 GB UHS-II) | |
| Acer Aspire VX5-591G-75C4 VX15 | |
| MSI GS63VR 7RF-228US (Toshiba Exceria Pro SDXC 64 GB UHS-II) | |
| |||||||||||||||||||||||||
iluminação: 86 %
iluminação com acumulador: 304 cd/m²
Contraste: 1169:1 (Preto: 0.26 cd/m²)
ΔE ColorChecker Calman: 3.46 | ∀{0.5-29.43 Ø4.72}
ΔE Greyscale Calman: 2.46 | ∀{0.09-98 Ø4.97}
91% sRGB (Argyll 1.6.3 3D)
59% AdobeRGB 1998 (Argyll 1.6.3 3D)
66.5% AdobeRGB 1998 (Argyll 3D)
90.9% sRGB (Argyll 3D)
65.8% Display P3 (Argyll 3D)
Gamma: 2.38
CCT: 6915 K
| HP Omen 15-ce002ng AUO42ED, 1920x1080 | Acer Aspire VX5-591G-75C4 VX15 LG Philips LGD0550 / LP156WF6-SPK4, 1920x1080 | MSI GS63VR 7RF-228US 3840x2160 | Gigabyte Aero 15 N156HCA-EA1 (CMN15D7), 1920x1080 | Schenker XMG P507 PRO AUO B156HTN05.2 (AUO52ED), 1920x1080 | |
|---|---|---|---|---|---|
| Display | -39% | -24% | 0% | -1% | |
| Display P3 Coverage (%) | 65.8 | 38.88 -41% | 48.21 -27% | 65.2 -1% | 66.4 1% |
| sRGB Coverage (%) | 90.9 | 58.2 -36% | 72.6 -20% | 92.5 2% | 88.9 -2% |
| AdobeRGB 1998 Coverage (%) | 66.5 | 40.2 -40% | 49.81 -25% | 66.5 0% | 65.1 -2% |
| Response Times | 38% | 30% | -1% | 53% | |
| Response Time Grey 50% / Grey 80% * (ms) | 43.2 ? | 22 ? 49% | 28 ? 35% | 42.8 ? 1% | 24 ? 44% |
| Response Time Black / White * (ms) | 31.2 ? | 23 ? 26% | 23.6 ? 24% | 32 ? -3% | 12 ? 62% |
| PWM Frequency (Hz) | 1351 ? | 26000 ? | |||
| Screen | -29% | -66% | -24% | -69% | |
| Brightness middle (cd/m²) | 304 | 281 -8% | 274.2 -10% | 320 5% | 357 17% |
| Brightness (cd/m²) | 289 | 257 -11% | 263 -9% | 316 9% | 365 26% |
| Brightness Distribution (%) | 86 | 85 -1% | 92 7% | 90 5% | 85 -1% |
| Black Level * (cd/m²) | 0.26 | 0.32 -23% | 0.44 -69% | 0.36 -38% | 0.5 -92% |
| Contrast (:1) | 1169 | 878 -25% | 623 -47% | 889 -24% | 714 -39% |
| Colorchecker dE 2000 * | 3.46 | 5.16 -49% | 8 -131% | 4.62 -34% | 9.93 -187% |
| Colorchecker dE 2000 max. * | 7.72 | 9.09 -18% | 14.6 -89% | 9.75 -26% | 14.87 -93% |
| Greyscale dE 2000 * | 2.46 | 4.57 -86% | 9.1 -270% | 6 -144% | 10.32 -320% |
| Gamma | 2.38 92% | 2.59 85% | 2.24 98% | 2.46 89% | 2.11 104% |
| CCT | 6915 94% | 6931 94% | 5020 129% | 6761 96% | 10096 64% |
| Color Space (Percent of AdobeRGB 1998) (%) | 59 | 37 -37% | 45.7 -23% | 60 2% | 58 -2% |
| Color Space (Percent of sRGB) (%) | 91 | 58 -36% | 72.1 -21% | 92 1% | 89 -2% |
| Média Total (Programa/Configurações) | -10% /
-22% | -20% /
-45% | -8% /
-16% | -6% /
-39% |
* ... menor é melhor
Exibir tempos de resposta
| ↔ Tempo de resposta preto para branco | ||
|---|---|---|
| 31.2 ms ... ascensão ↗ e queda ↘ combinadas | ↗ 16.4 ms ascensão | 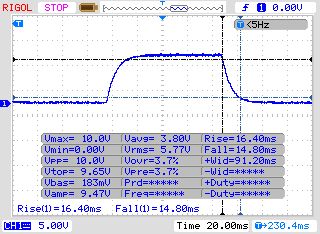 |
| ↘ 14.8 ms queda | ||
| A tela mostra taxas de resposta lentas em nossos testes e será insatisfatória para os jogadores. Em comparação, todos os dispositivos testados variam de 0.1 (mínimo) a 240 (máximo) ms. » 84 % de todos os dispositivos são melhores. Isso significa que o tempo de resposta medido é pior que a média de todos os dispositivos testados (19.8 ms). | ||
| ↔ Tempo de resposta 50% cinza a 80% cinza | ||
| 43.2 ms ... ascensão ↗ e queda ↘ combinadas | ↗ 21.2 ms ascensão | 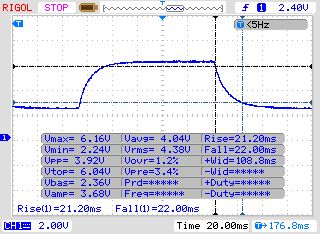 |
| ↘ 22 ms queda | ||
| A tela mostra taxas de resposta lentas em nossos testes e será insatisfatória para os jogadores. Em comparação, todos os dispositivos testados variam de 0.165 (mínimo) a 636 (máximo) ms. » 72 % de todos os dispositivos são melhores. Isso significa que o tempo de resposta medido é pior que a média de todos os dispositivos testados (31 ms). | ||
Cintilação da tela / PWM (modulação por largura de pulso)
| Tela tremeluzindo / PWM não detectado | 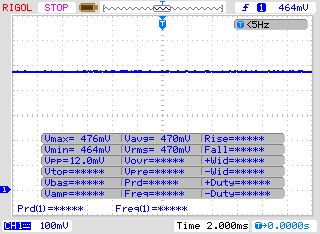 | ||
[pwm_comparison] Em comparação: 52 % de todos os dispositivos testados não usam PWM para escurecer a tela. Se PWM foi detectado, uma média de 7781 (mínimo: 5 - máximo: 343500) Hz foi medida. | |||
| Cinebench R11.5 | |
| CPU Single 64Bit | |
| Gigabyte Aero 15 | |
| HP Omen 15-ce002ng | |
| Schenker XMG P507 PRO | |
| MSI GS63VR 7RF-228US | |
| CPU Multi 64Bit | |
| Gigabyte Aero 15 | |
| MSI GS63VR 7RF-228US | |
| HP Omen 15-ce002ng | |
| Schenker XMG P507 PRO | |
| PCMark 8 | |
| Home Score Accelerated v2 | |
| HP Omen 15-ce002ng | |
| Schenker XMG P507 PRO | |
| Gigabyte Aero 15 | |
| MSI GS63VR 7RF-228US | |
| Acer Aspire VX5-591G-75C4 VX15 | |
| Work Score Accelerated v2 | |
| HP Omen 15-ce002ng | |
| Gigabyte Aero 15 | |
| MSI GS63VR 7RF-228US | |
| Schenker XMG P507 PRO | |
| Acer Aspire VX5-591G-75C4 VX15 | |
| PCMark 10 - Score | |
| HP Omen 15-ce002ng | |
| PCMark 8 Home Score Accelerated v2 | 4858 pontos | |
| PCMark 8 Work Score Accelerated v2 | 5348 pontos | |
| PCMark 10 Score | 4861 pontos | |
Ajuda | ||
| HP Omen 15-ce002ng Samsung PM961 MZVLW256HEHP | Schenker XMG A517 Samsung SSD 960 Evo 500GB m.2 NVMe | Gigabyte P56XT LiteOn CX2-8B256 | Asus Zephyrus GX501 Samsung SSD SM961 1TB M.2 MZVKW1T0HMLH | |
|---|---|---|---|---|
| CrystalDiskMark 5.2 / 6 | 20% | -11% | -3% | |
| Read Seq Q32T1 (MB/s) | 3431 | 3389 -1% | 2445 -29% | 3445 0% |
| Write Seq Q32T1 (MB/s) | 1246 | 1706 37% | 790 -37% | 1848 48% |
| Read 4K Q32T1 (MB/s) | 586 | 627 7% | 588 0% | 547 -7% |
| Write 4K Q32T1 (MB/s) | 486 | 591 22% | 455.5 -6% | 463 -5% |
| Read Seq (MB/s) | 1419 | 1856 31% | 1881 33% | 954 -33% |
| Write Seq (MB/s) | 1266 | 1652 30% | 797 -37% | 1049 -17% |
| Read 4K (MB/s) | 47.14 | 49 4% | 46.69 -1% | 45 -5% |
| Write 4K (MB/s) | 156 | 196 26% | 142.5 -9% | 149 -4% |

| 3DMark - 1920x1080 Fire Strike Graphics | |
| Schenker XMG P507 PRO | |
| MSI GS63VR 7RF-228US | |
| Gigabyte Aero 15 | |
| HP Omen 15-ce002ng | |
| Acer Aspire VX5-591G-75C4 VX15 | |
| 3DMark 11 - 1280x720 Performance GPU | |
| Schenker XMG P507 PRO | |
| MSI GS63VR 7RF-228US | |
| Gigabyte Aero 15 | |
| HP Omen 15-ce002ng | |
| Acer Aspire VX5-591G-75C4 VX15 | |
| Unigine Heaven 4.0 - Extreme Preset DX11 | |
| Schenker XMG P507 PRO | |
| Gigabyte Aero 15 | |
| HP Omen 15-ce002ng | |
| 3DMark 11 Performance | 11902 pontos | |
| 3DMark Ice Storm Standard Score | 138488 pontos | |
| 3DMark Cloud Gate Standard Score | 25573 pontos | |
| 3DMark Fire Strike Score | 8949 pontos | |
| 3DMark Time Spy Score | 3271 pontos | |
Ajuda | ||
| The Witcher 3 - 1920x1080 Ultra Graphics & Postprocessing (HBAO+) | |
| MSI GT62VR-6RE16H21 | |
| Schenker XMG P507 | |
| HP Omen 15-ce002ng | |
| MSI GE72 7RE-046 | |
| Batman: Arkham Knight - 1920x1080 High / On AA:SM AF:16x | |
| MSI GT62VR-6RE16H21 | |
| Schenker XMG P507 | |
| HP Omen 15-ce002ng | |
| MSI GE72 7RE-046 | |
| Star Wars Battlefront - 1920x1080 Ultra Preset AA:FX | |
| MSI GT62VR-6RE16H21 | |
| Schenker XMG P507 | |
| HP Omen 15-ce002ng | |
| MSI GE72 7RE-046 | |
| Assassin's Creed Syndicate - 1920x1080 Ultra High Preset AA:4x MSAA + FX | |
| MSI GT62VR-6RE16H21 | |
| Schenker XMG P507 | |
| HP Omen 15-ce002ng | |
| MSI GE72 7RE-046 | |
| Rainbow Six Siege - 1920x1080 Ultra Preset AA:T AF:16x | |
| MSI GT62VR-6RE16H21 | |
| Schenker XMG P507 | |
| HP Omen 15-ce002ng | |
| MSI GE72 7RE-046 | |
| Rise of the Tomb Raider - 1920x1080 Very High Preset AA:FX AF:16x | |
| MSI GT62VR-6RE16H21 | |
| Schenker XMG P507 | |
| HP Omen 15-ce002ng | |
| MSI GE72 7RE-046 | |
| Far Cry Primal - 1920x1080 Ultra Preset AA:SM | |
| MSI GT62VR-6RE16H21 | |
| Schenker XMG P507 | |
| HP Omen 15-ce002ng | |
| MSI GE72 7RE-046 | |
| The Division - 1920x1080 Ultra Preset AF:16x | |
| MSI GT62VR-6RE16H21 | |
| Schenker XMG P507 | |
| HP Omen 15-ce002ng | |
| MSI GE72 7RE-046 | |
| Doom - 1920x1080 Ultra Preset AA:SM | |
| MSI GT62VR-6RE16H21 | |
| Schenker XMG P507 | |
| HP Omen 15-ce002ng | |
| MSI GE72 7RE-046 | |
| Mirror's Edge Catalyst - 1920x1080 Ultra Preset AF:16x | |
| MSI GT62VR-6RE16H21 | |
| Schenker XMG P507 | |
| HP Omen 15-ce002ng | |
| MSI GE72 7RE-046 | |
| Deus Ex Mankind Divided - 1920x1080 Ultra Preset AA:2xMS AF:8x | |
| Asus G752VS | |
| HP Omen 15-ce002ng | |
| MSI GE72 7RE-046 | |
| Battlefield 1 - 1920x1080 Ultra Preset AA:T | |
| Asus G752VS | |
| HP Omen 15-ce002ng | |
| MSI GE72 7RE-046 | |
| Titanfall 2 - 1920x1080 Very High (Insane Texture Quality) / Enabled AA:TS AF:16x | |
| Asus G752VS | |
| HP Omen 15-ce002ng | |
| MSI GE72 7RE-046 | |
| Call of Duty Infinite Warfare - 1920x1080 Ultra / On AA:T2X SM | |
| Asus G752VS | |
| MSI GT62VR | |
| HP Omen 15-ce002ng | |
| MSI GE72 7RE-046 | |
| Dishonored 2 - 1920x1080 Ultra Preset AA:TX | |
| Asus G752VS | |
| MSI GT62VR | |
| HP Omen 15-ce002ng | |
| MSI GE72 7RE-046 | |
| Watch Dogs 2 - 1920x1080 Ultra Preset | |
| Asus G752VS | |
| MSI GT62VR | |
| HP Omen 15-ce002ng | |
| MSI GE72 7RE-046 | |
| Resident Evil 7 - 1920x1080 Very High / On AA:FXAA+T | |
| Asus G752VS | |
| MSI GT62VR | |
| HP Omen 15-ce002ng | |
| MSI GE72 7RE-046 | |
| For Honor - 1920x1080 Extreme Preset AA:T AF:16x | |
| Asus G752VS | |
| MSI GT62VR | |
| HP Omen 15-ce002ng | |
| MSI GE72 7RE-046 | |
| Ghost Recon Wildlands - 1920x1080 Ultra Preset AA:T AF:16x | |
| Asus G752VS | |
| MSI GT62VR | |
| HP Omen 15-ce002ng | |
| MSI GE72 7RE-046 | |
| Prey - 1920x1080 Very High Preset AA:2TX SM AF:16x | |
| Asus G752VS | |
| MSI GT62VR | |
| HP Omen 15-ce002ng | |
| Dirt 4 - 1920x1080 Ultra Preset AA:4xMS AF:16x | |
| Asus G752VS | |
| MSI GT62VR | |
| HP Omen 15-ce002ng | |
| MSI GE72 7RE-046 | |
| baixo | média | alto | ultra | 4K | |
|---|---|---|---|---|---|
| The Witcher 3 (2015) | 119 | 63.2 | 34.6 | 22.9 | |
| Batman: Arkham Knight (2015) | 129 | 81 | 54 | 26 | |
| Star Wars Battlefront (2015) | 188 | 93 | 80.9 | 29.3 | |
| Assassin's Creed Syndicate (2015) | 82.6 | 65.8 | 29.4 | 22.2 | |
| Rainbow Six Siege (2015) | 224 | 126 | 102 | 37.3 | |
| Rise of the Tomb Raider (2016) | 124 | 65.6 | 51.1 | 23.5 | |
| Far Cry Primal (2016) | 81 | 71 | 53 | 22 | |
| The Division (2016) | 127 | 61.9 | 48.8 | 22.1 | |
| Doom (2016) | 127 | 91.1 | 86.2 | 28.4 | |
| Mirror's Edge Catalyst (2016) | 130 | 66.4 | 59.6 | 20.5 | |
| Deus Ex Mankind Divided (2016) | 93.8 | 50.2 | 26.7 | 15.8 | |
| FIFA 17 (2016) | 330 | 250 | 248 | 95.2 | |
| Battlefield 1 (2016) | 154 | 76 | 67.8 | 25.3 | |
| Titanfall 2 (2016) | 144 | 79 | 67.3 | 24.8 | |
| Call of Duty Infinite Warfare (2016) | 124 | 91.6 | 81.7 | 34.6 | |
| Dishonored 2 (2016) | 85.4 | 64.7 | 54.8 | 23.7 | |
| Watch Dogs 2 (2016) | 101 | 56.8 | 39.4 | 18.9 | |
| Resident Evil 7 (2017) | 169 | 93 | 76.1 | 25.1 | |
| For Honor (2017) | 92.3 | 87.8 | 63.9 | 25.7 | |
| Ghost Recon Wildlands (2017) | 65 | 58.7 | 33.2 | 19.4 | |
| Prey (2017) | 126 | 101 | 84.7 | 27.7 | |
| Rocket League (2017) | 194 | 134 | 56.5 | ||
| Dirt 4 (2017) | 129 | 93.6 | 49.9 |
Barulho
| Ocioso |
| 30 / 33 / 37 dB |
| HDD |
| 34 dB |
| Carga |
| 41 / 50 dB |
 | ||
30 dB silencioso 40 dB(A) audível 50 dB(A) ruidosamente alto |
||
min: | ||
| HP Omen 15-ce002ng GeForce GTX 1060 Max-Q, i7-7700HQ | Acer Aspire VX5-591G-75C4 VX15 GeForce GTX 1050 Ti Mobile, i7-7700HQ | MSI GS63VR 7RF-228US GeForce GTX 1060 Mobile, i7-7700HQ | Gigabyte Aero 15 GeForce GTX 1060 Mobile, i7-7700HQ | Schenker XMG P507 PRO GeForce GTX 1070 Mobile, i7-7700HQ | |
|---|---|---|---|---|---|
| Noise | 7% | 1% | 0% | -9% | |
| desligado / ambiente * (dB) | 30 | 30.4 -1% | 28.8 4% | 31 -3% | 31 -3% |
| Idle Minimum * (dB) | 30 | 31.4 -5% | 33.1 -10% | 32 -7% | 33 -10% |
| Idle Average * (dB) | 33 | 31.4 5% | 33.1 -0% | 33 -0% | 34 -3% |
| Idle Maximum * (dB) | 37 | 31.4 15% | 34 8% | 34 8% | 44 -19% |
| Load Average * (dB) | 41 | 36.8 10% | 37.2 9% | 39 5% | 46 -12% |
| Witcher 3 ultra * (dB) | 42 | 46.1 -10% | 43 -2% | ||
| Load Maximum * (dB) | 50 | 41.3 17% | 47.1 6% | 50 -0% | 52 -4% |
* ... menor é melhor
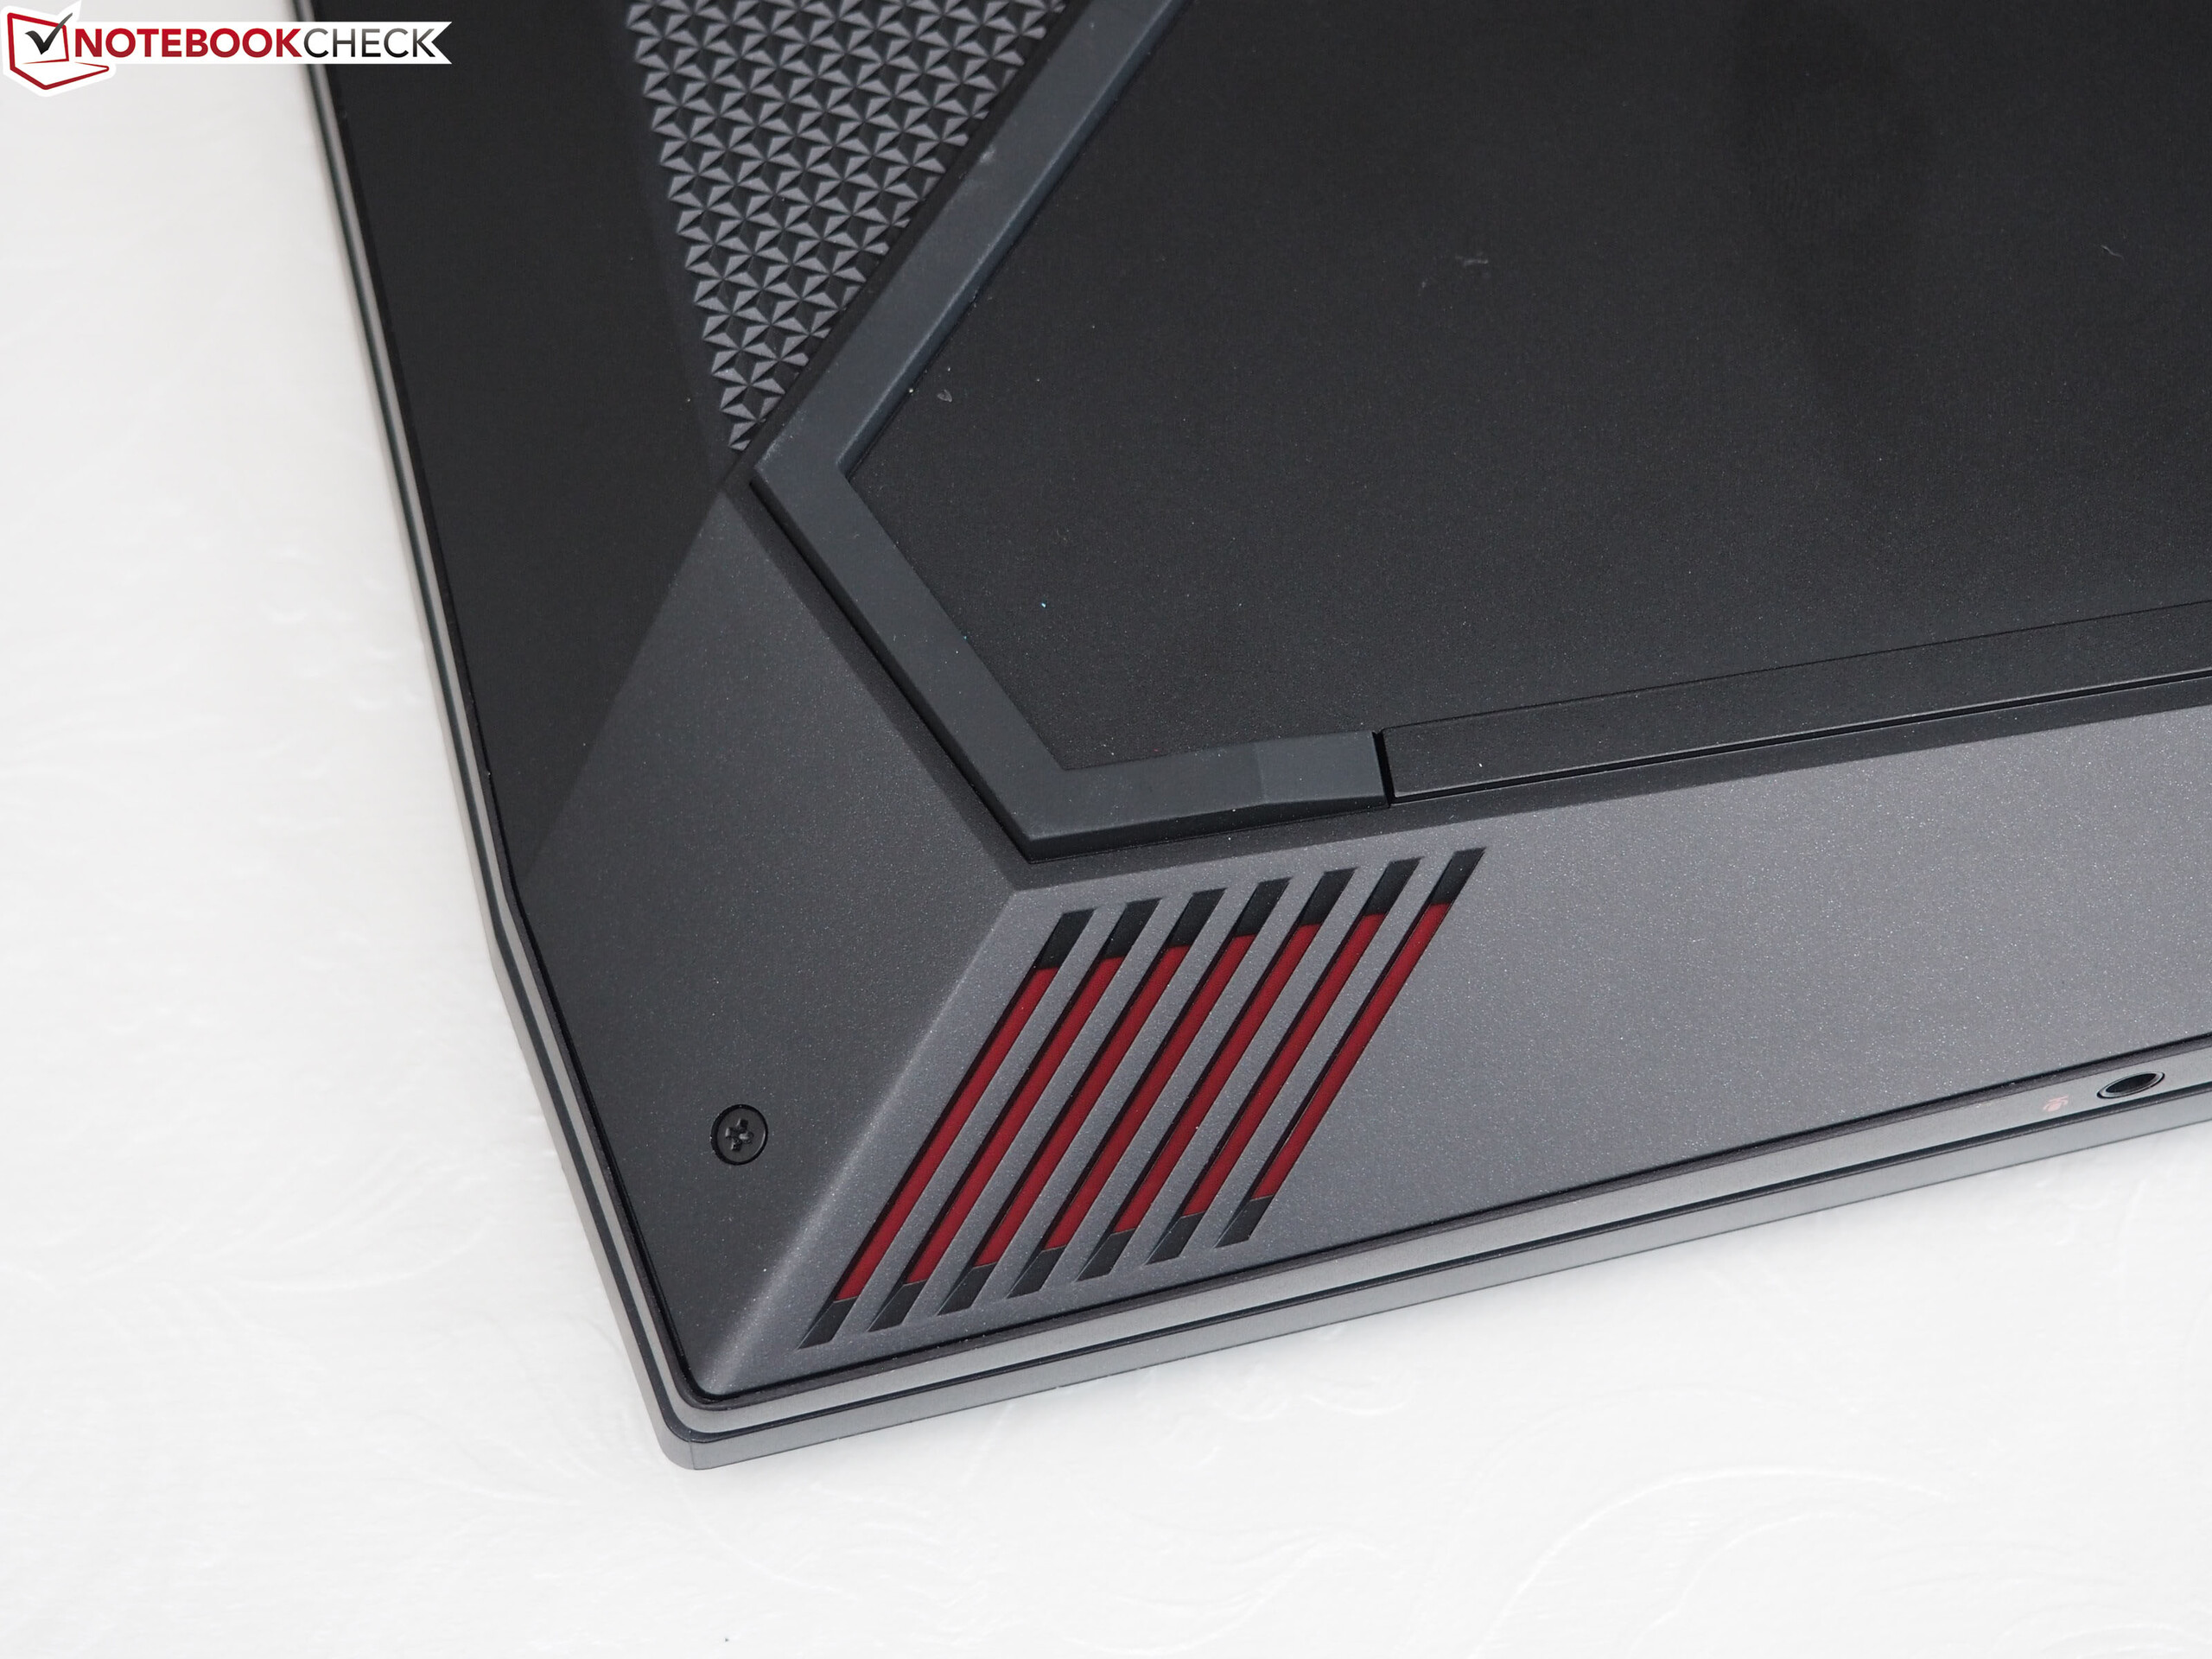
(-) A temperatura máxima no lado superior é 47 °C / 117 F, em comparação com a média de 40.4 °C / 105 F , variando de 21.2 a 68.8 °C para a classe Gaming.
(-) A parte inferior aquece até um máximo de 54 °C / 129 F, em comparação com a média de 43.2 °C / 110 F
(±) Em uso inativo, a temperatura média para o lado superior é 33.8 °C / 93 F, em comparação com a média do dispositivo de 33.9 °C / ### class_avg_f### F.
(-) Jogando The Witcher 3, a temperatura média para o lado superior é 39.8 °C / 104 F, em comparação com a média do dispositivo de 33.9 °C / ## #class_avg_f### F.
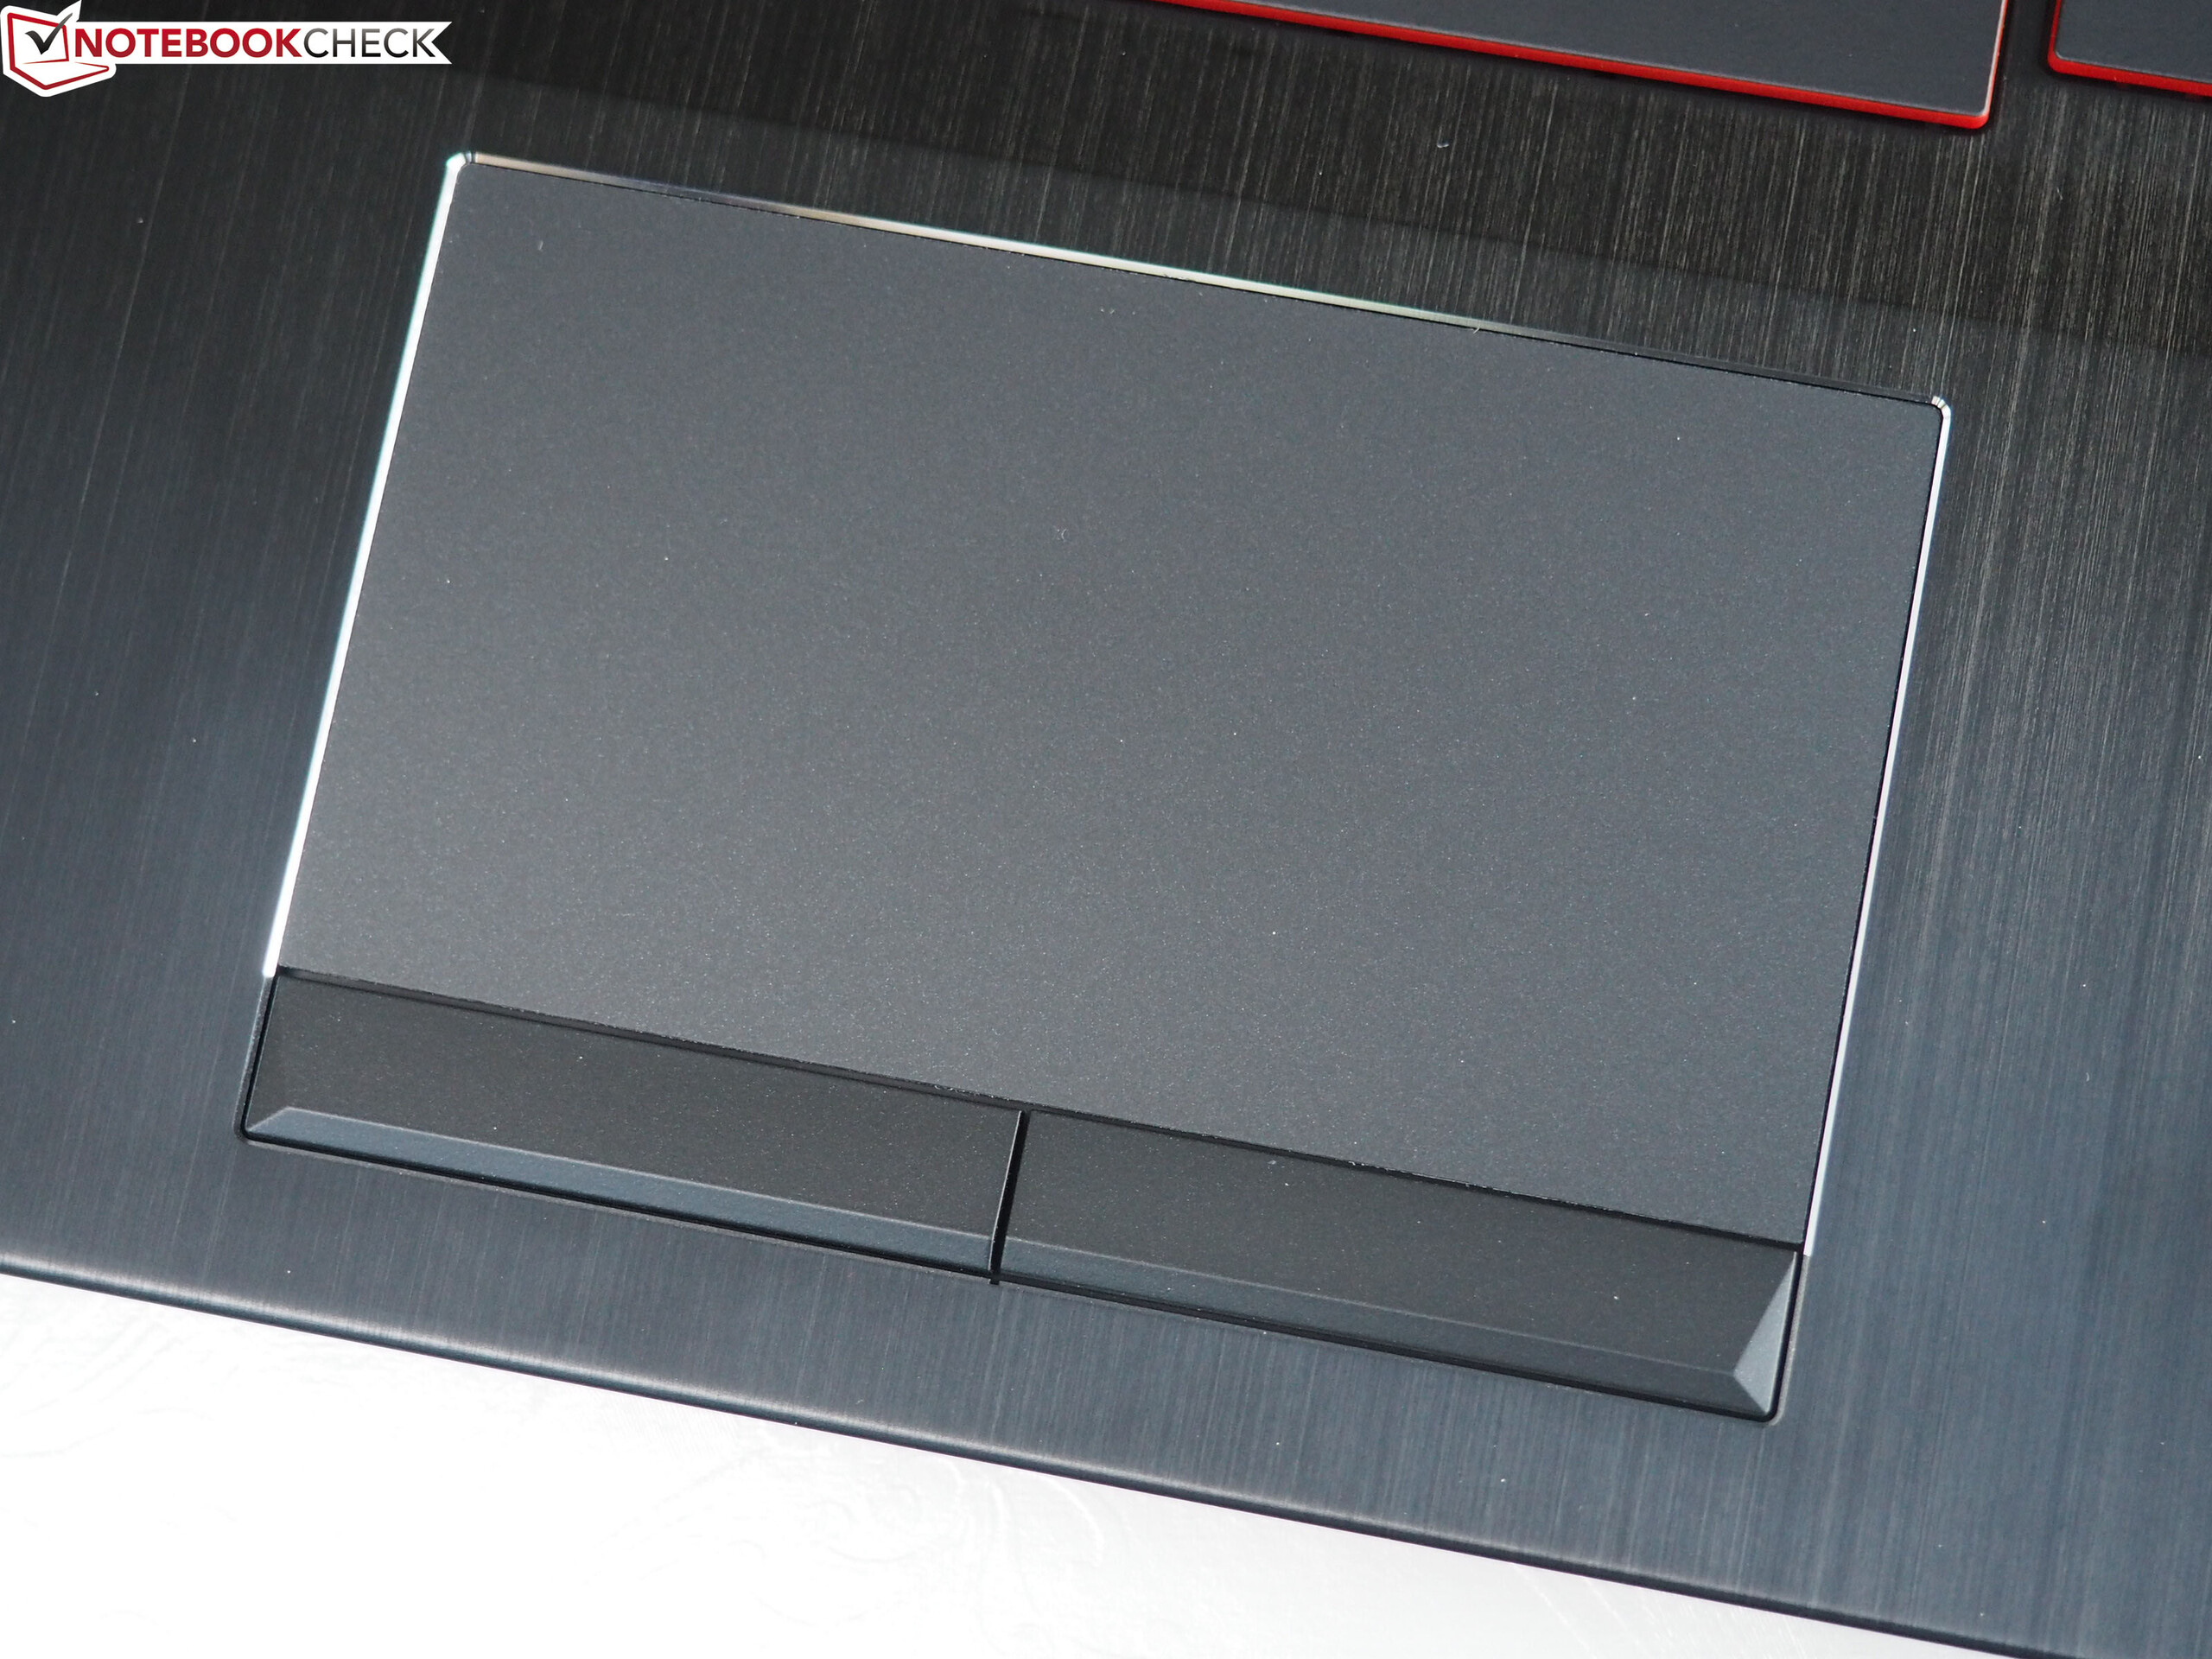
(+) Os apoios para as mãos e o touchpad estão atingindo a temperatura máxima da pele (34 °C / 93.2 F) e, portanto, não estão quentes.
(-) A temperatura média da área do apoio para as mãos de dispositivos semelhantes foi 28.8 °C / 83.8 F (-5.2 °C / -9.4 F).
| HP Omen 15-ce002ng GeForce GTX 1060 Max-Q, i7-7700HQ | Acer Aspire VX5-591G-75C4 VX15 GeForce GTX 1050 Ti Mobile, i7-7700HQ | MSI GS63VR 7RF-228US GeForce GTX 1060 Mobile, i7-7700HQ | Gigabyte Aero 15 GeForce GTX 1060 Mobile, i7-7700HQ | Schenker XMG P507 PRO GeForce GTX 1070 Mobile, i7-7700HQ | |
|---|---|---|---|---|---|
| Heat | 17% | 24% | 10% | 2% | |
| Maximum Upper Side * (°C) | 47 | 47 -0% | 56 -19% | 49.2 -5% | |
| Maximum Bottom * (°C) | 54 | 47 13% | 61 -13% | 62 -15% | |
| Idle Upper Side * (°C) | 36 | 28.4 21% | 28.4 21% | 25 31% | 32.4 10% |
| Idle Bottom * (°C) | 40 | 27.1 32% | 29.6 26% | 24 40% | 33 17% |
* ... menor é melhor
HP Omen 15-ce002ng análise de áudio
(±) | o volume do alto-falante é médio, mas bom (###valor### dB)
Graves 100 - 315Hz
(±) | graves reduzidos - em média 12.9% menor que a mediana
(±) | a linearidade dos graves é média (14.8% delta para a frequência anterior)
Médios 400 - 2.000 Hz
(+) | médios equilibrados - apenas 3.5% longe da mediana
(+) | médios são lineares (3.3% delta para frequência anterior)
Altos 2 - 16 kHz
(+) | agudos equilibrados - apenas 2.9% longe da mediana
(+) | os máximos são lineares (5% delta da frequência anterior)
Geral 100 - 16.000 Hz
(+) | o som geral é linear (13.6% diferença em relação à mediana)
Comparado com a mesma classe
» 20% de todos os dispositivos testados nesta classe foram melhores, 7% semelhantes, 73% piores
» O melhor teve um delta de 6%, a média foi 18%, o pior foi 132%
Comparado com todos os dispositivos testados
» 15% de todos os dispositivos testados foram melhores, 4% semelhantes, 82% piores
» O melhor teve um delta de 4%, a média foi 24%, o pior foi 134%
Acer Aspire VX5-591G-75C4 VX15 análise de áudio
(±) | o volume do alto-falante é médio, mas bom (###valor### dB)
Graves 100 - 315Hz
(-) | quase nenhum baixo - em média 15% menor que a mediana
(±) | a linearidade dos graves é média (10.7% delta para a frequência anterior)
Médios 400 - 2.000 Hz
(+) | médios equilibrados - apenas 1.9% longe da mediana
(+) | médios são lineares (5.9% delta para frequência anterior)
Altos 2 - 16 kHz
(+) | agudos equilibrados - apenas 4.8% longe da mediana
(+) | os máximos são lineares (2.2% delta da frequência anterior)
Geral 100 - 16.000 Hz
(+) | o som geral é linear (14.8% diferença em relação à mediana)
Comparado com a mesma classe
» 35% de todos os dispositivos testados nesta classe foram melhores, 4% semelhantes, 61% piores
» O melhor teve um delta de 5%, a média foi 17%, o pior foi 45%
Comparado com todos os dispositivos testados
» 20% de todos os dispositivos testados foram melhores, 4% semelhantes, 76% piores
» O melhor teve um delta de 4%, a média foi 24%, o pior foi 134%
| desligado | |
| Ocioso | |
| Carga |
|
Key:
min: | |
| HP Omen 15-ce002ng GeForce GTX 1060 Max-Q, i7-7700HQ | Acer Aspire VX5-591G-75C4 VX15 GeForce GTX 1050 Ti Mobile, i7-7700HQ | MSI GS63VR 7RF-228US GeForce GTX 1060 Mobile, i7-7700HQ | Gigabyte Aero 15 GeForce GTX 1060 Mobile, i7-7700HQ | Schenker XMG P507 PRO GeForce GTX 1070 Mobile, i7-7700HQ | |
|---|---|---|---|---|---|
| Power Consumption | 40% | 9% | 15% | 7% | |
| Idle Minimum * (Watt) | 18 | 7 61% | 14.5 19% | 12 33% | 14 22% |
| Idle Average * (Watt) | 23 | 10.2 56% | 17.3 25% | 15 35% | 18 22% |
| Idle Maximum * (Watt) | 30 | 14 53% | 17.4 42% | 20 33% | 24 20% |
| Load Average * (Watt) | 85 | 78 8% | 93 -9% | 82 4% | 87 -2% |
| Witcher 3 ultra * (Watt) | 96 | 128.8 -34% | 111 -16% | ||
| Load Maximum * (Watt) | 158 | 127 20% | 161 -2% | 201 -27% |
* ... menor é melhor
| HP Omen 15-ce002ng GeForce GTX 1060 Max-Q, i7-7700HQ, 70 Wh | Acer Aspire VX5-591G-75C4 VX15 GeForce GTX 1050 Ti Mobile, i7-7700HQ, 52.5 Wh | MSI GS63VR 7RF-228US GeForce GTX 1060 Mobile, i7-7700HQ, 65 Wh | Gigabyte Aero 15 GeForce GTX 1060 Mobile, i7-7700HQ, 94.24 Wh | Schenker XMG P507 PRO GeForce GTX 1070 Mobile, i7-7700HQ, 60 Wh | |
|---|---|---|---|---|---|
| Duração da bateria | 29% | 22% | 103% | -2% | |
| Reader / Idle (h) | 4.3 | 5.4 26% | 6.4 49% | 10.6 147% | |
| H.264 (h) | 3.7 | 7.7 108% | 3.6 -3% | ||
| WiFi v1.3 (h) | 3.3 | 5 52% | 3.9 18% | 7 112% | 3.3 0% |
| Load (h) | 1.3 | 1.4 8% | 1.3 0% | 1.9 46% |
Pro
Contra
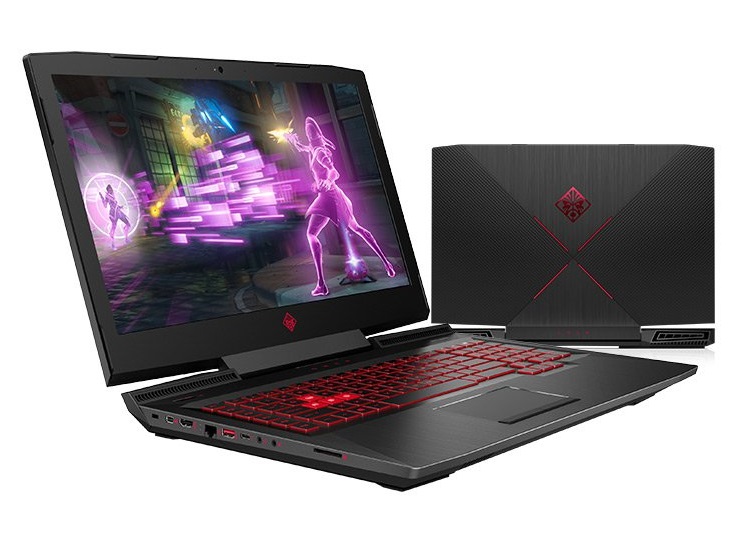
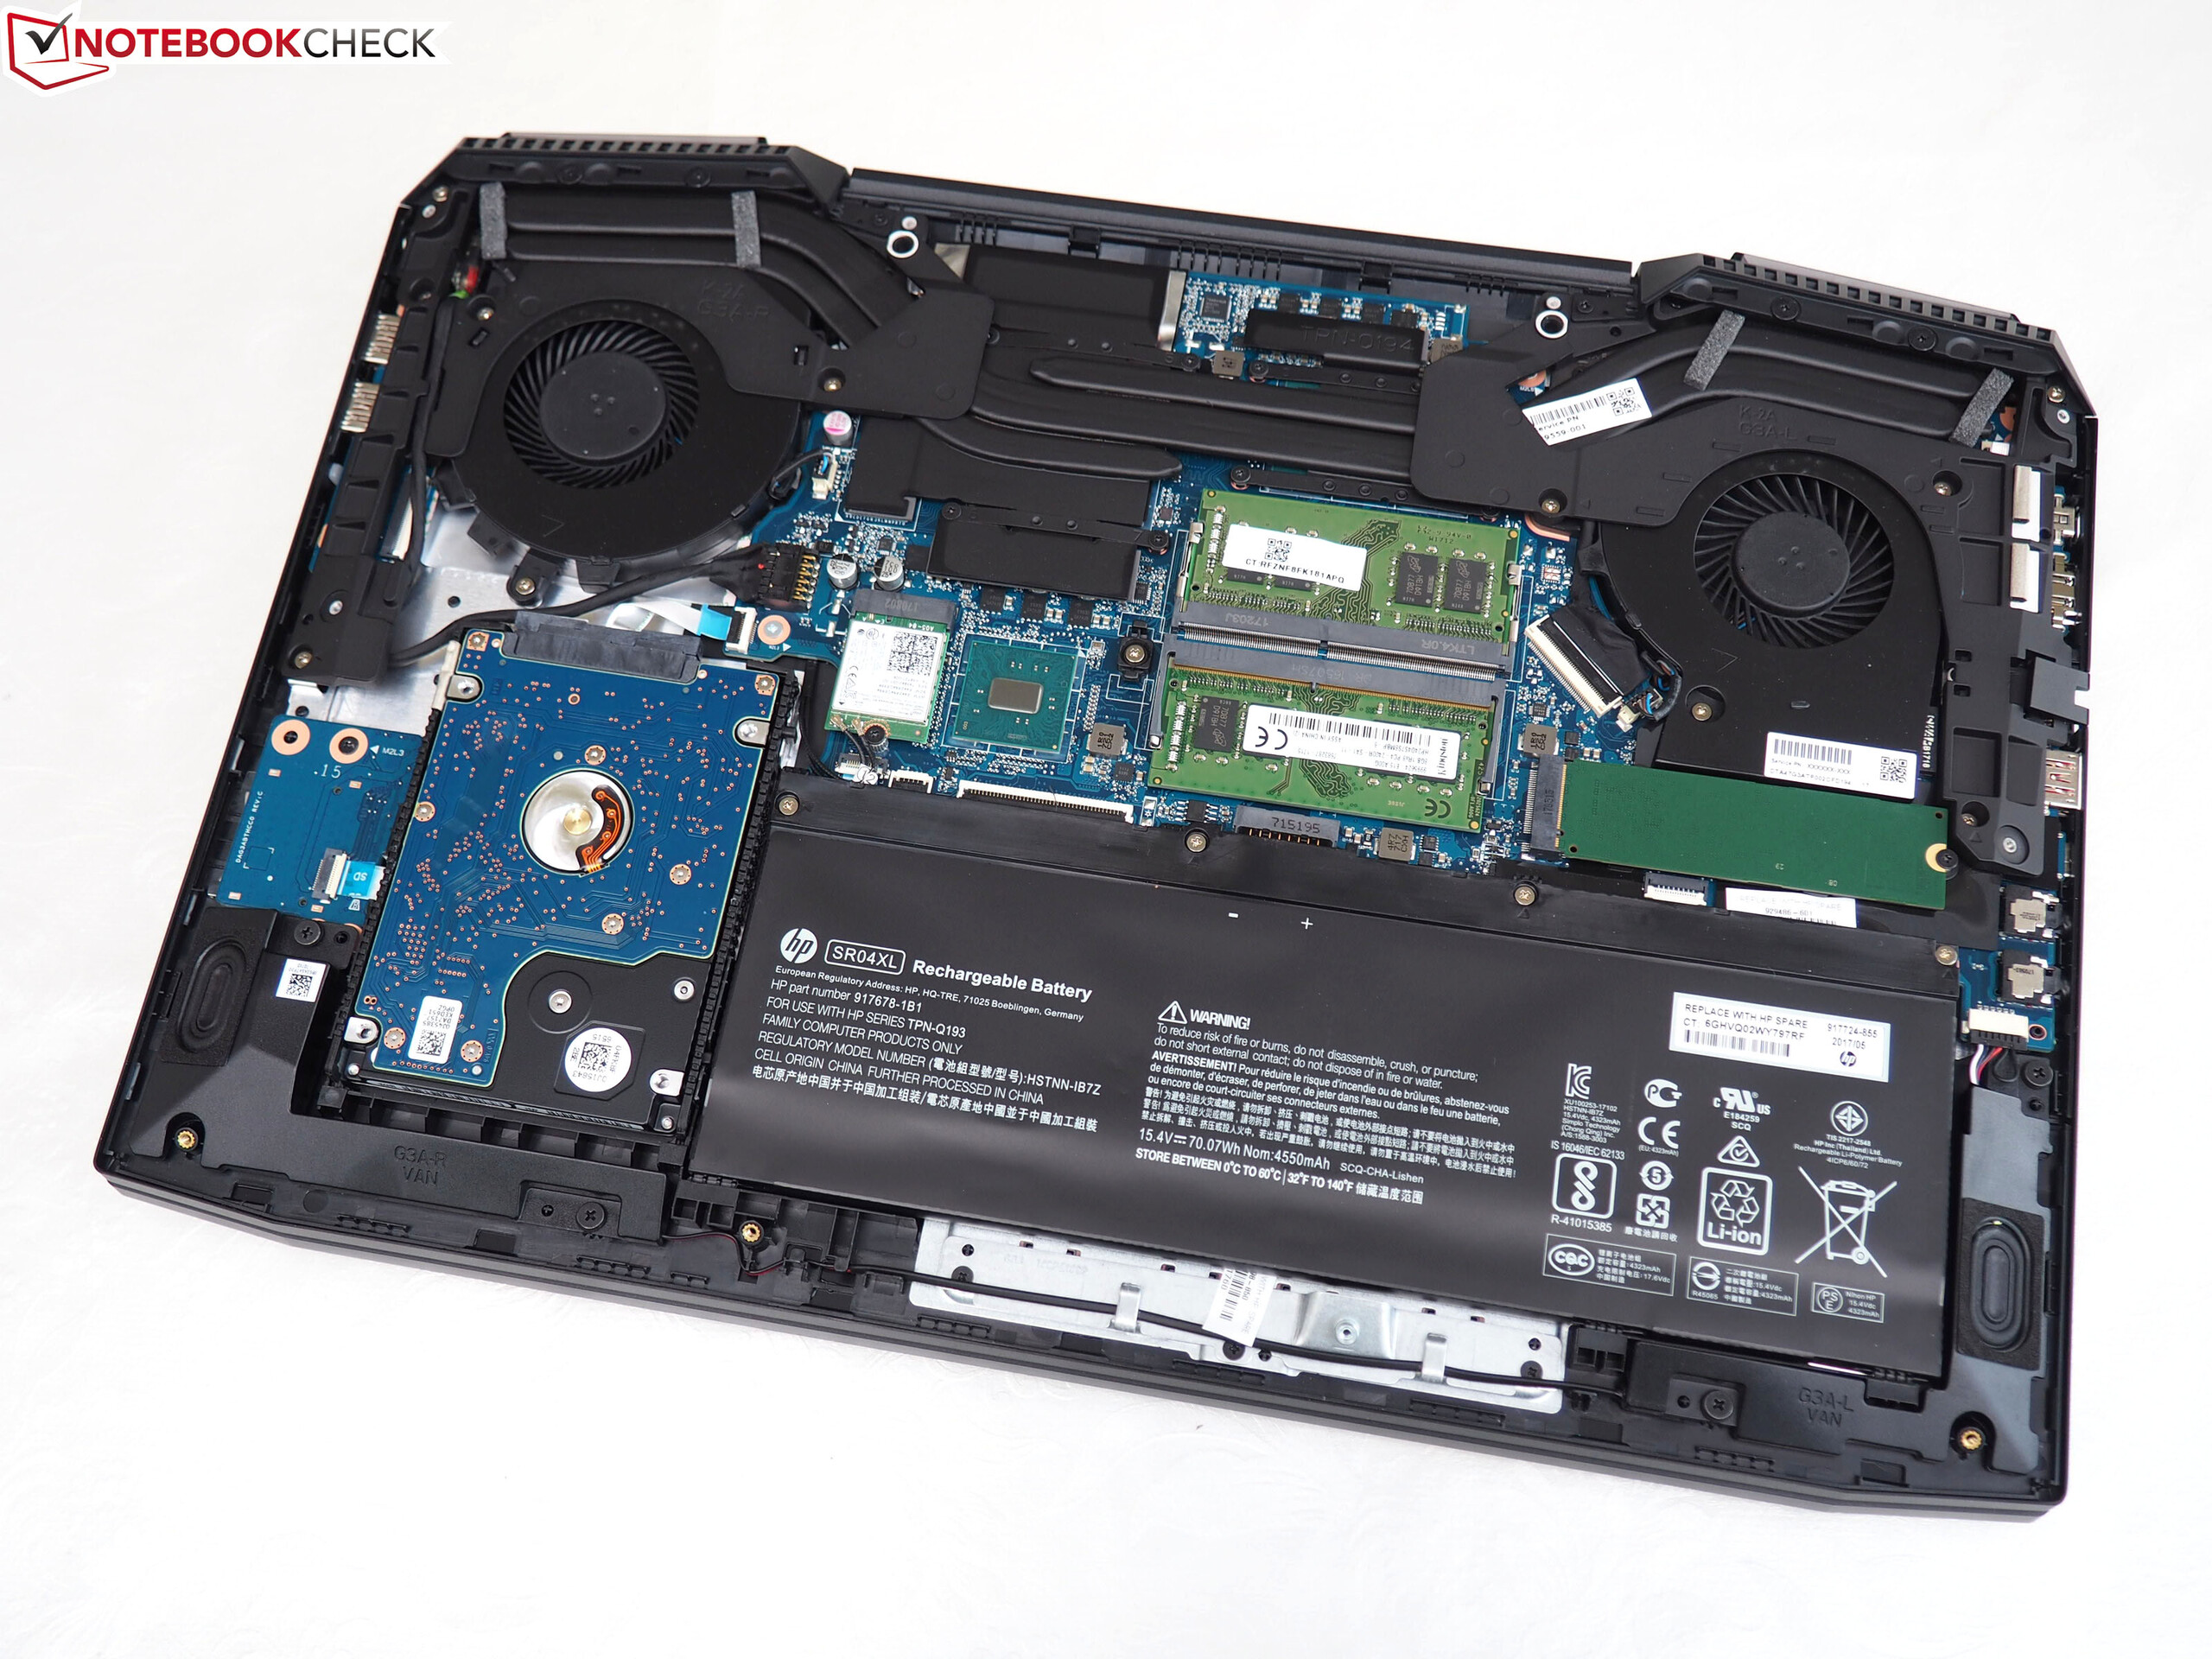
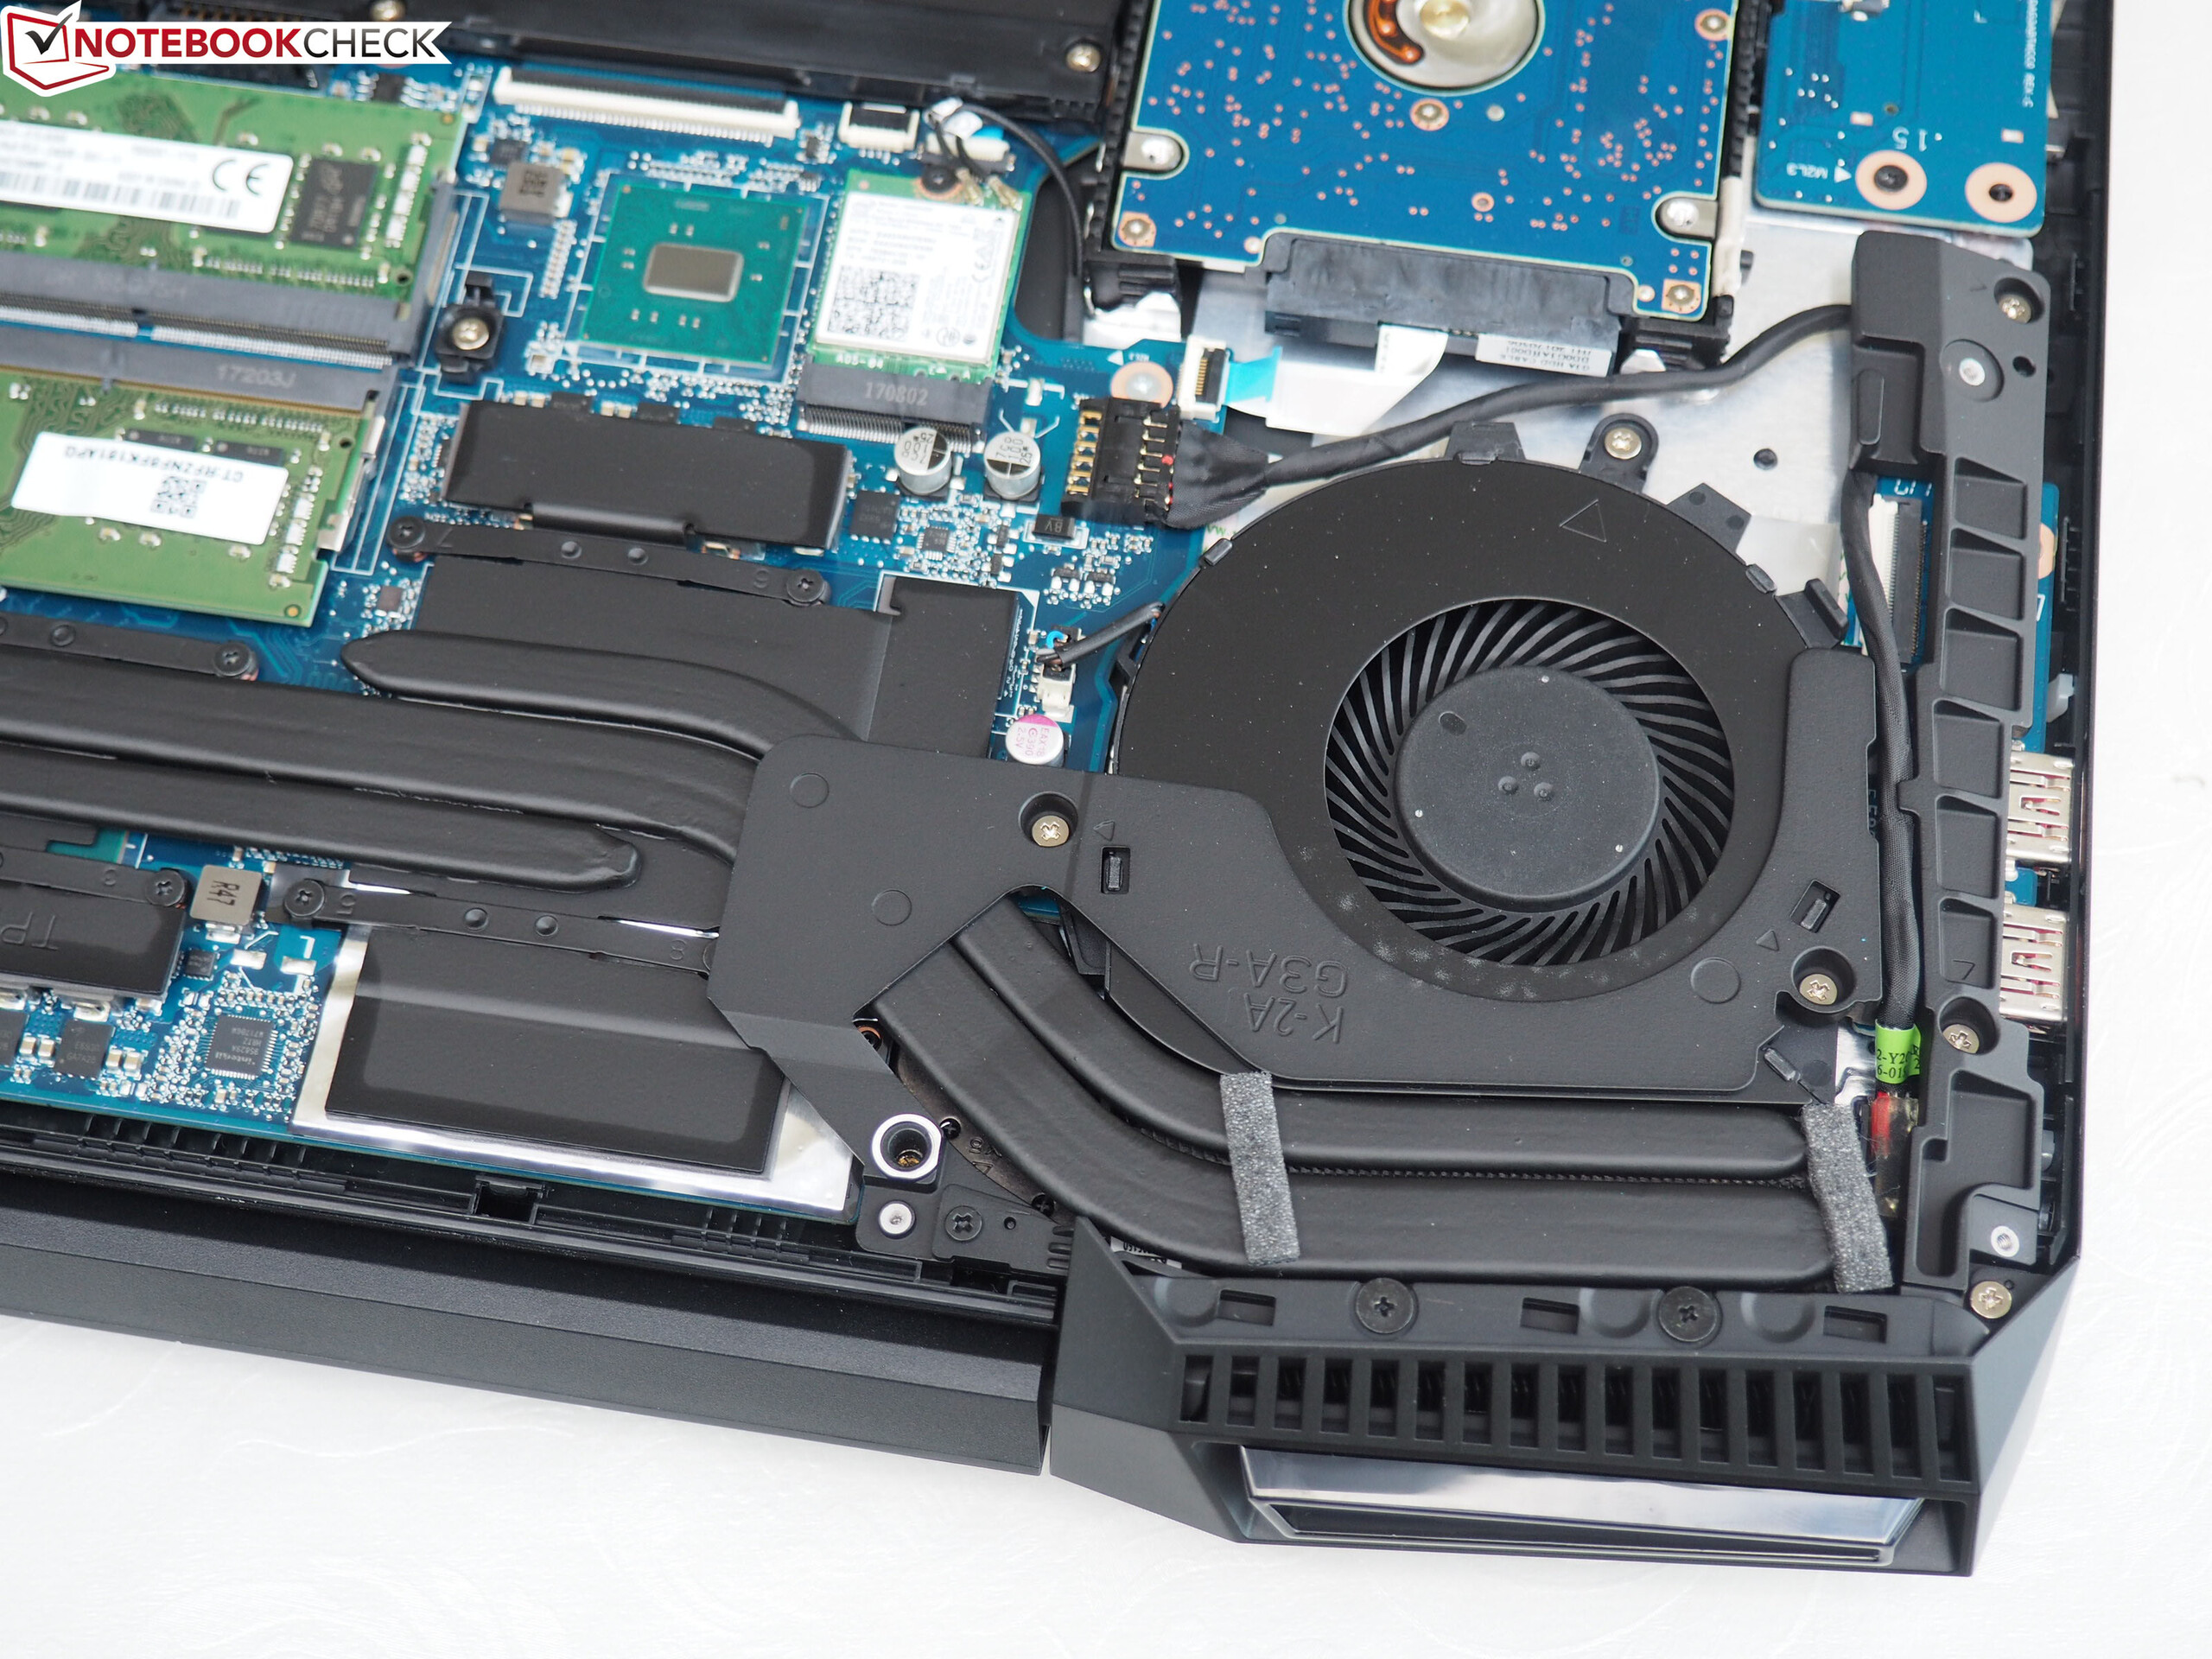
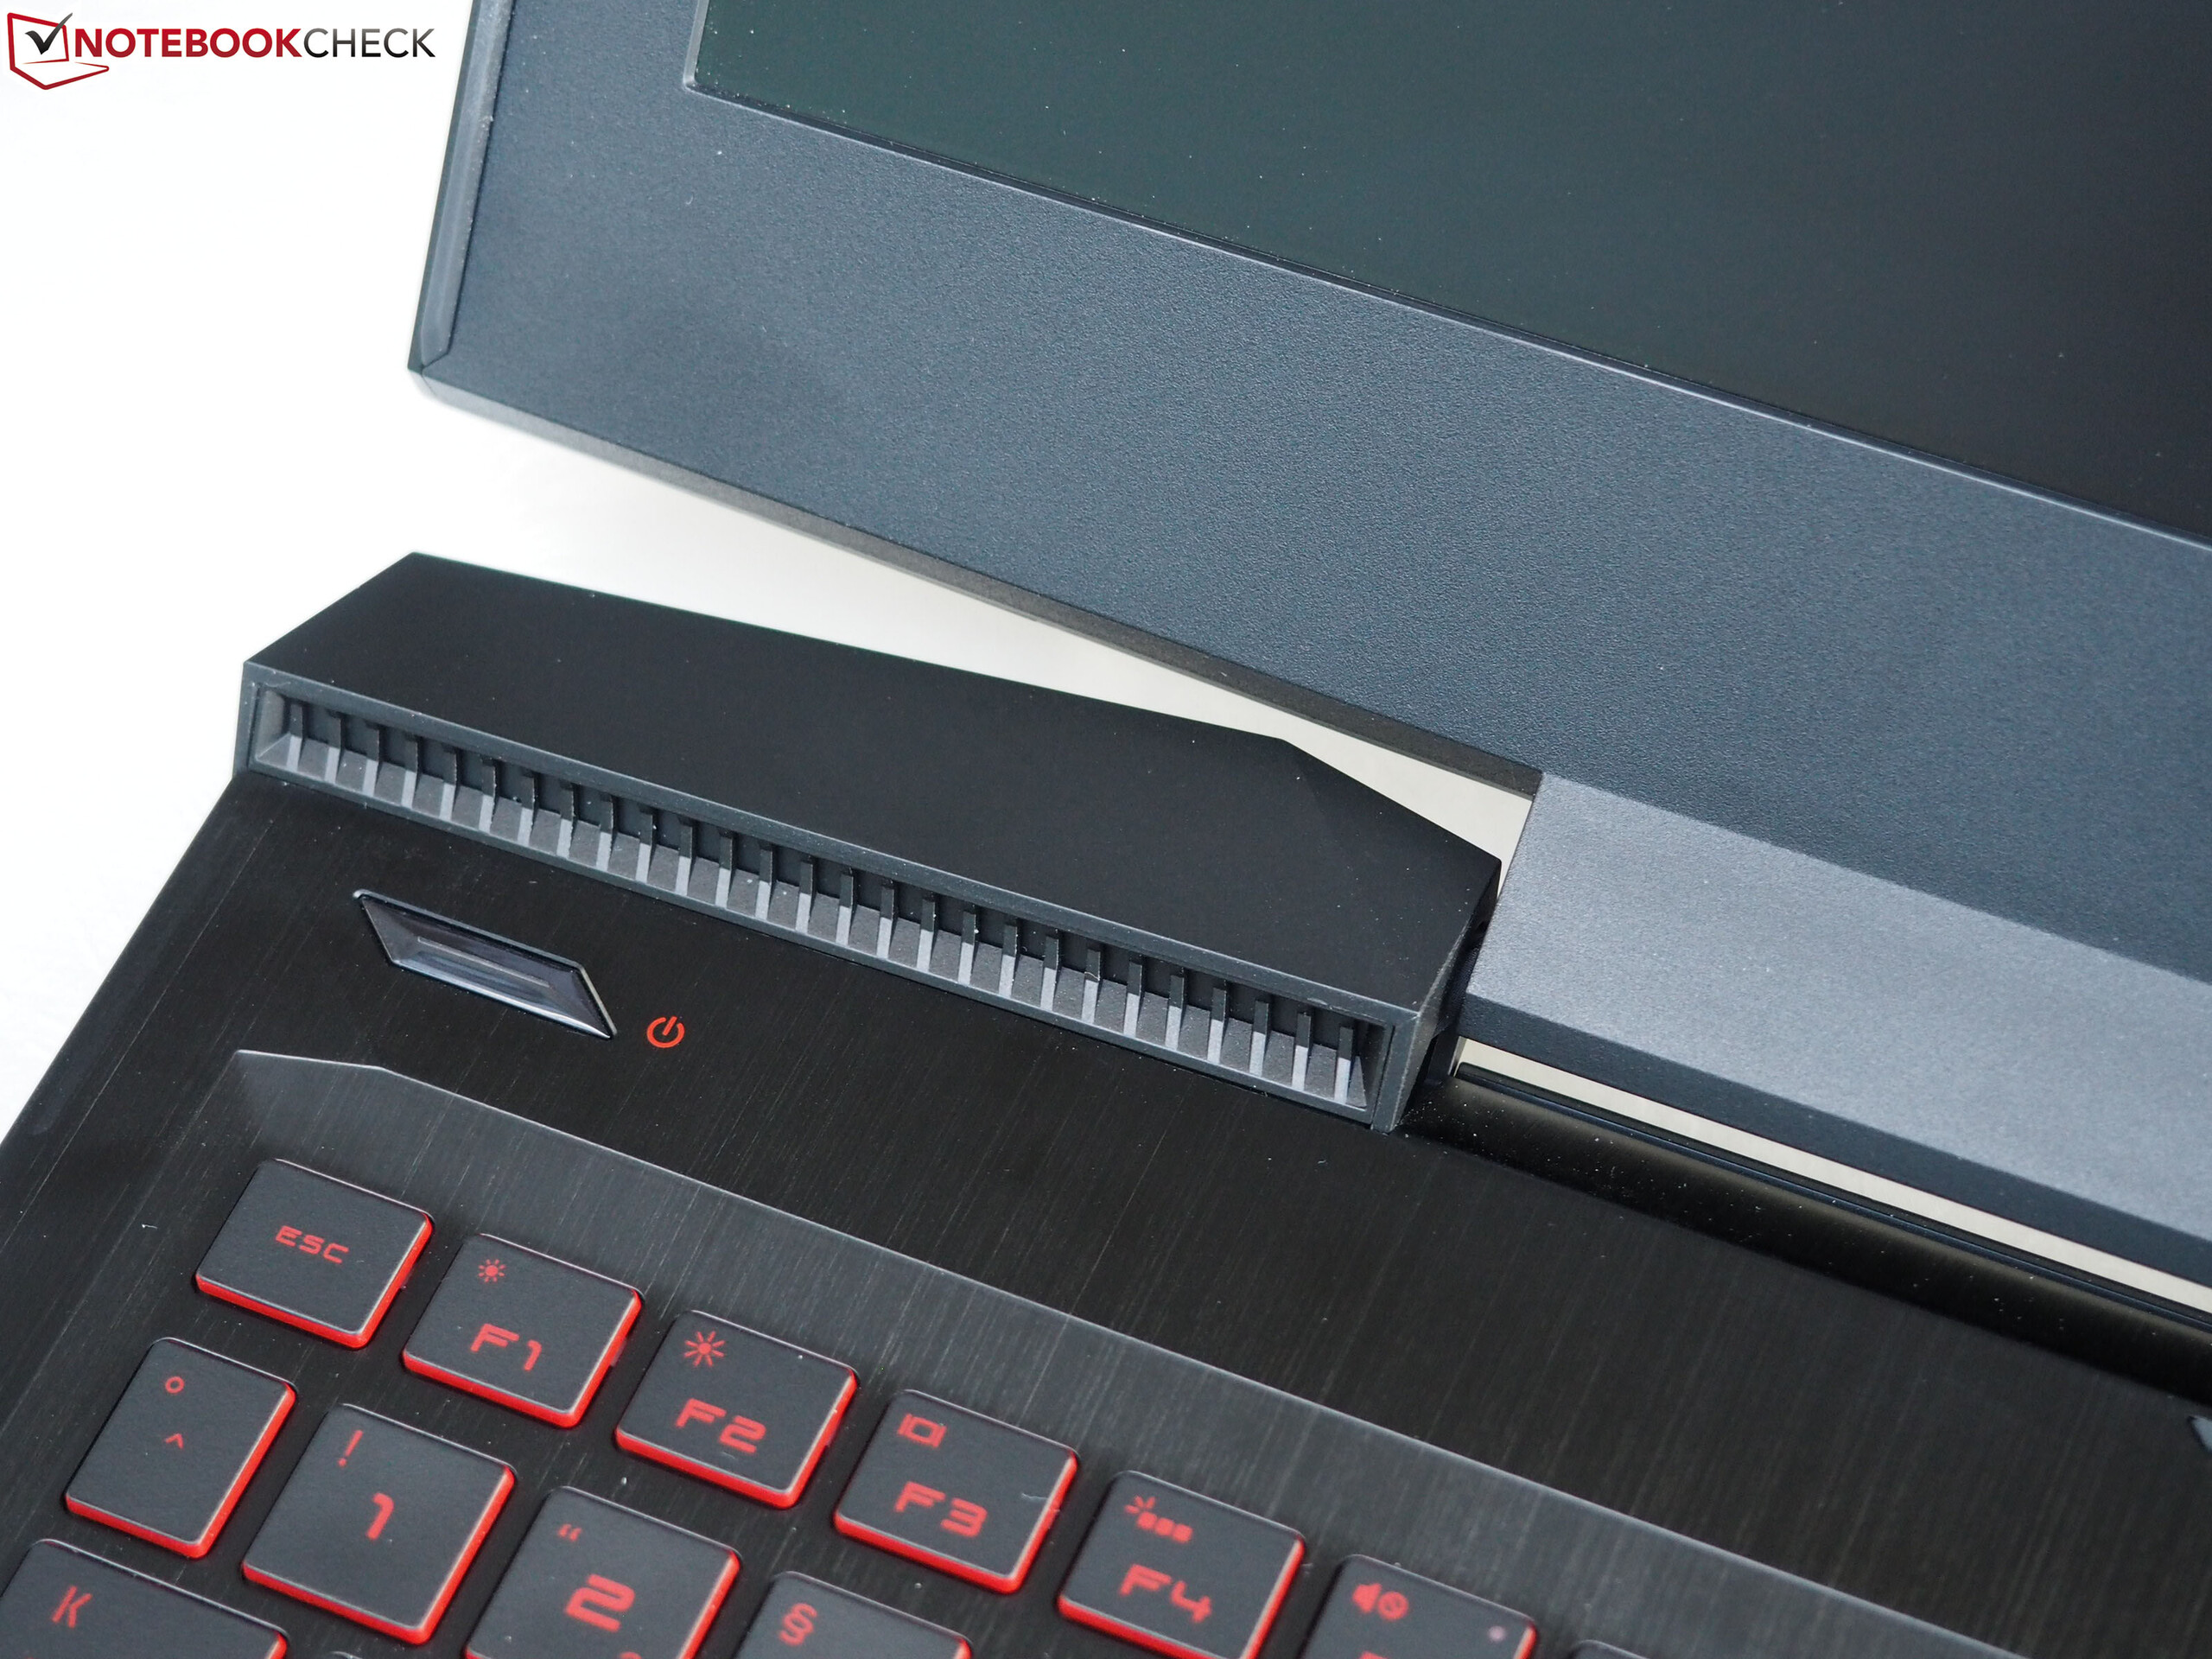
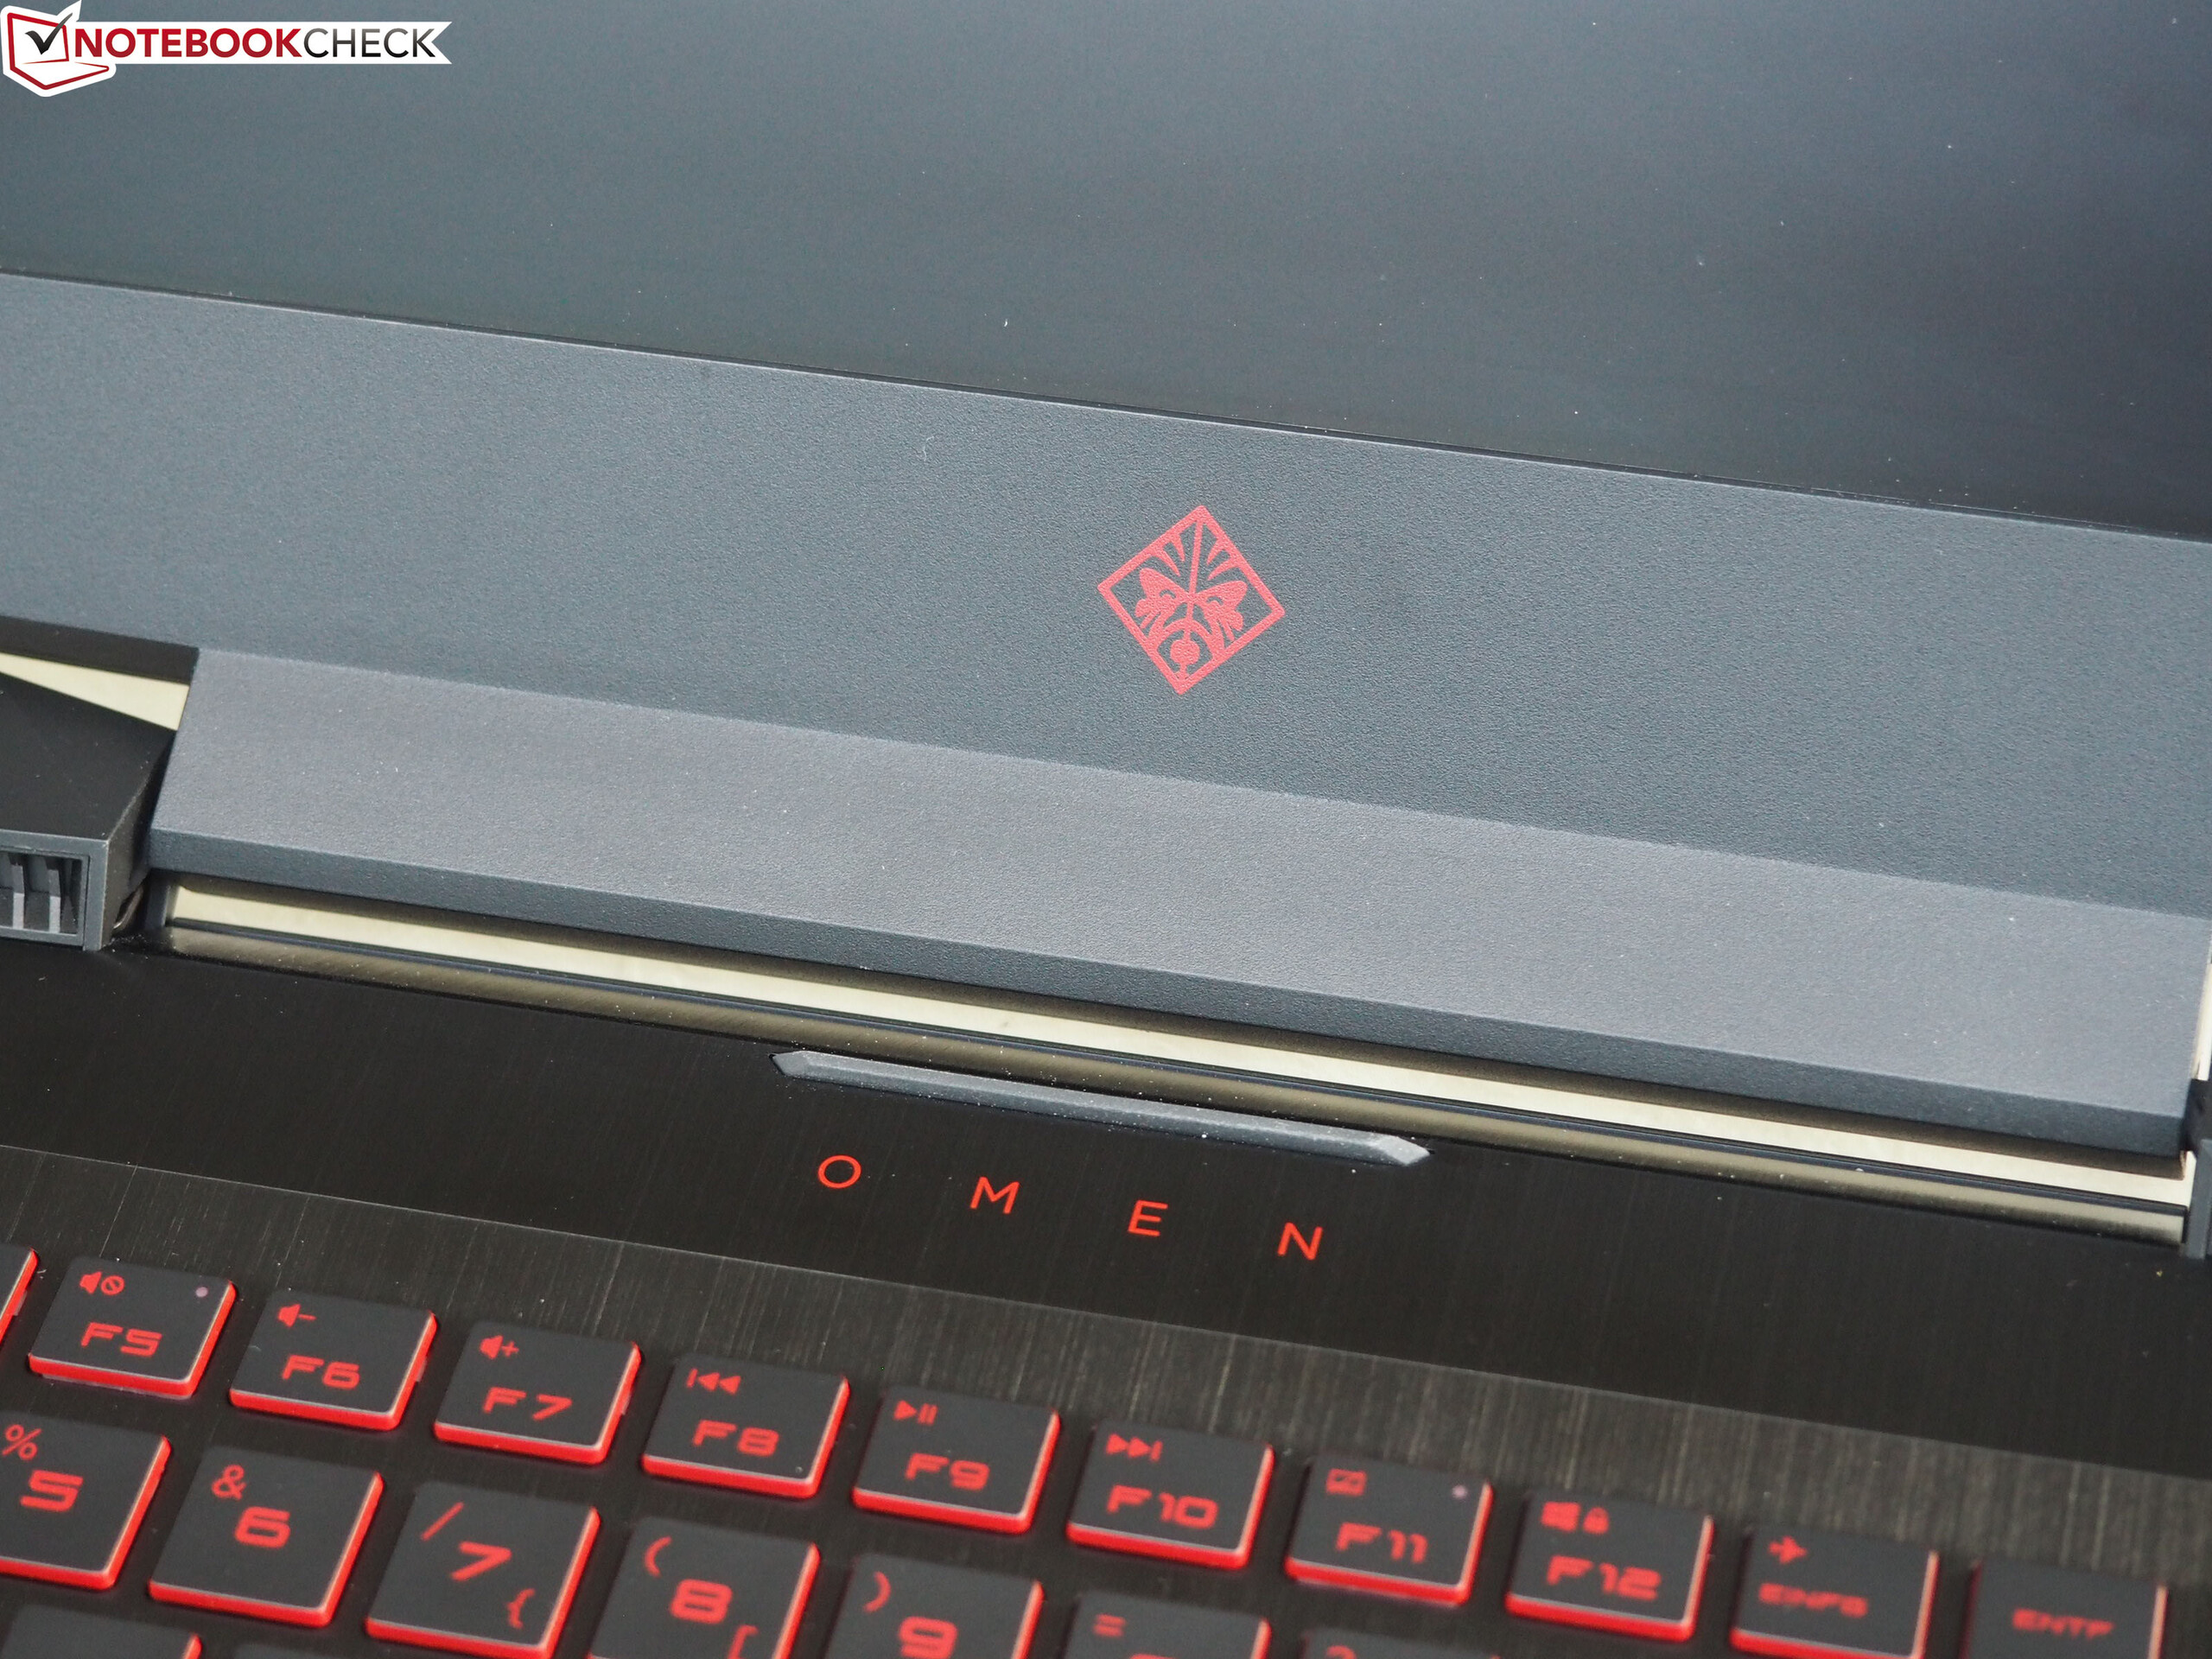
Durante anos, muitos fabricantes de portáteis dormiram em seus louros, ou para ser exatos, seus casos e além das novas GPUs e CPUs, só atualizaram as entranhas, com a nova geração de Omen, a HP se atreve a um redesenho completo que, em nossa opinião parece ter êxito em muitos aspectos.
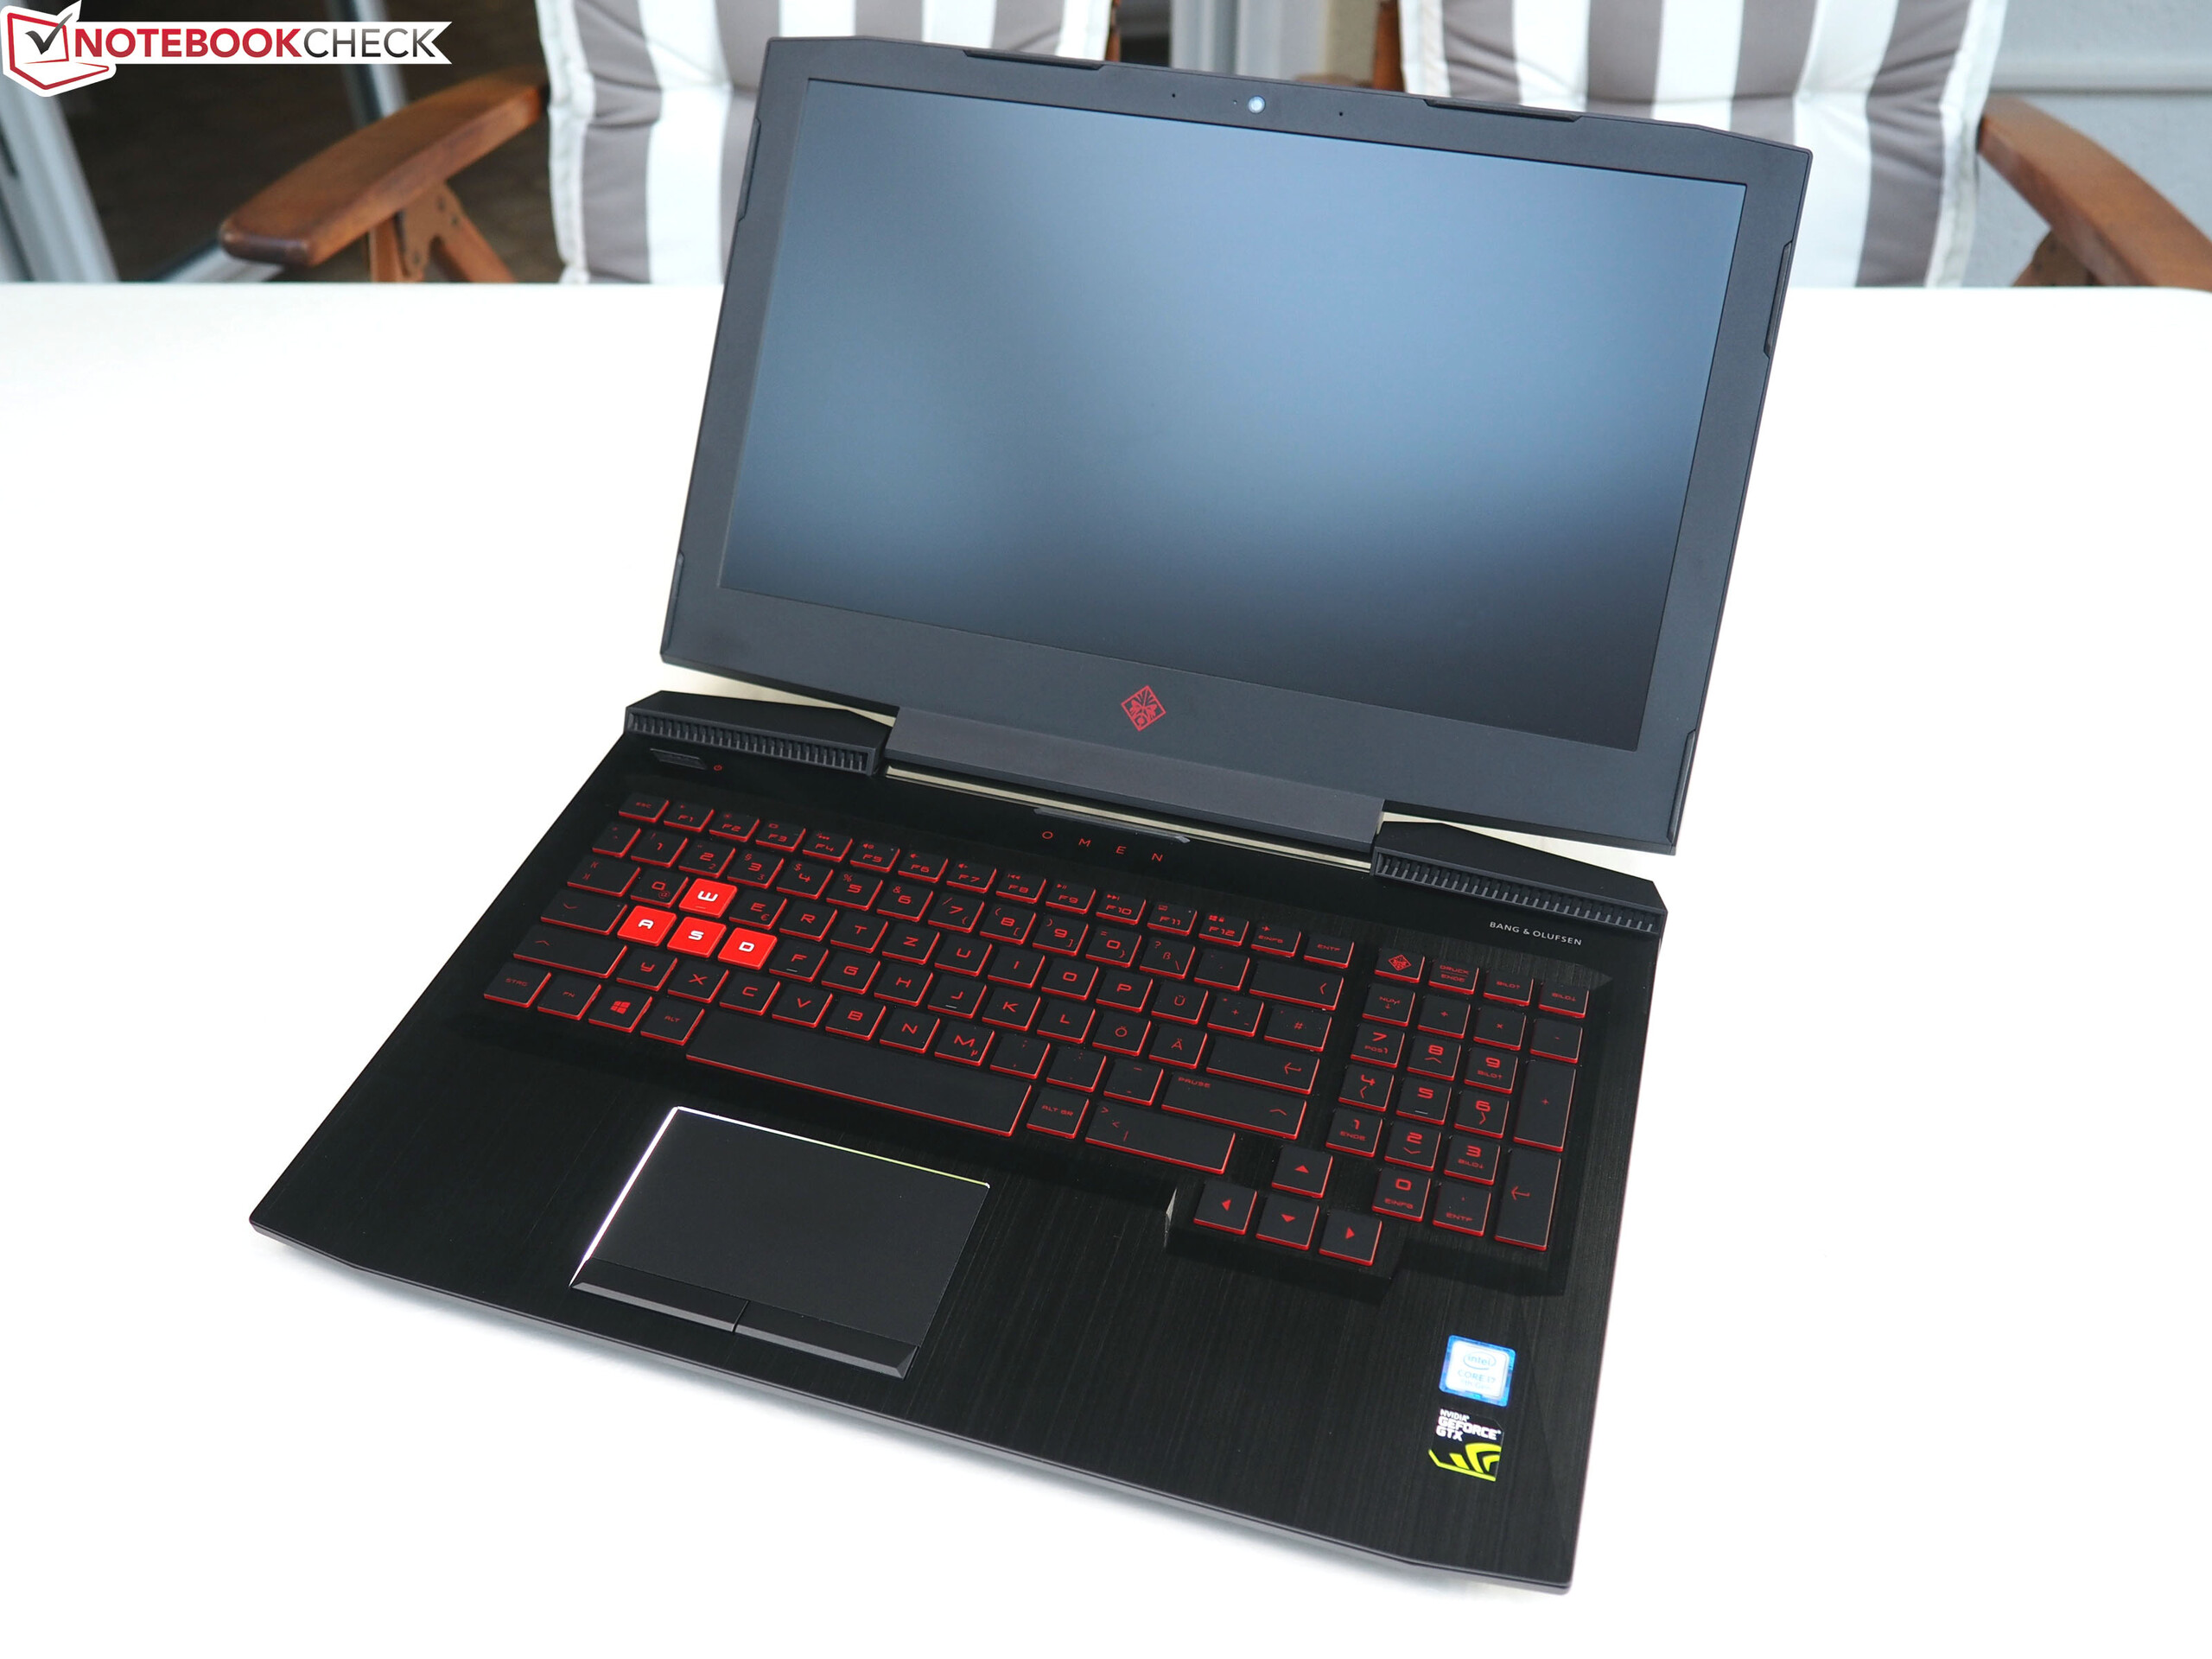
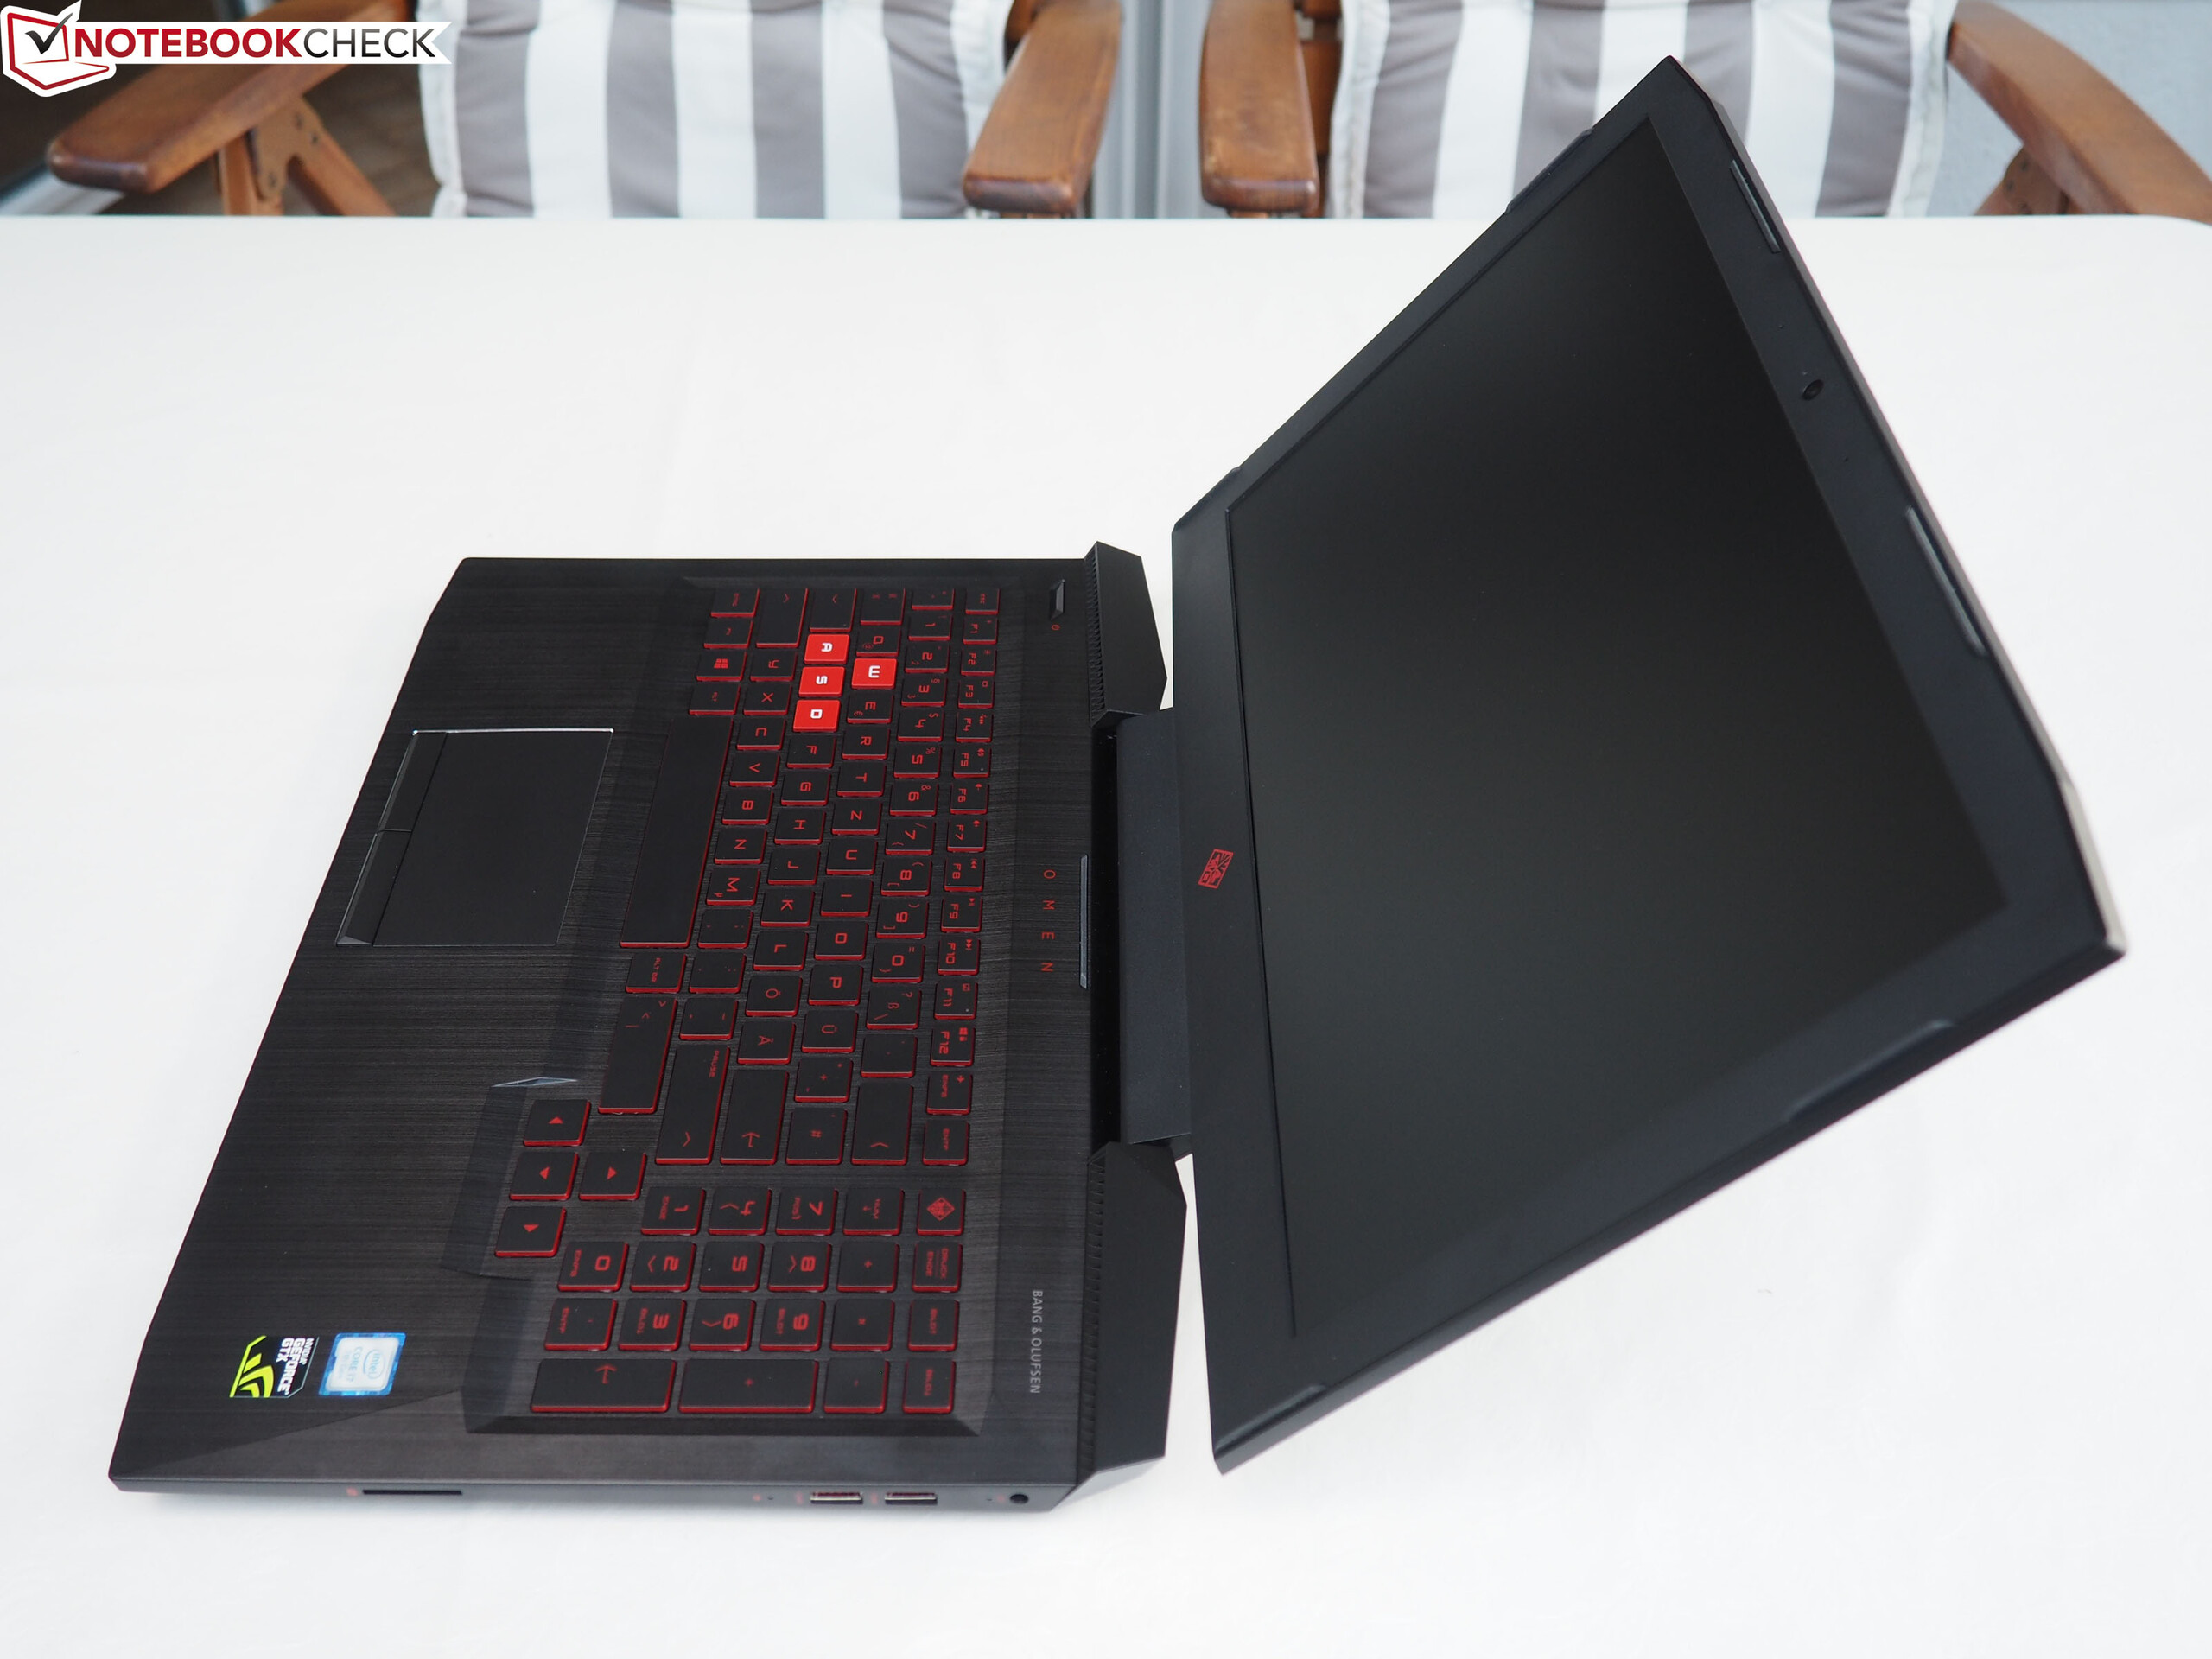
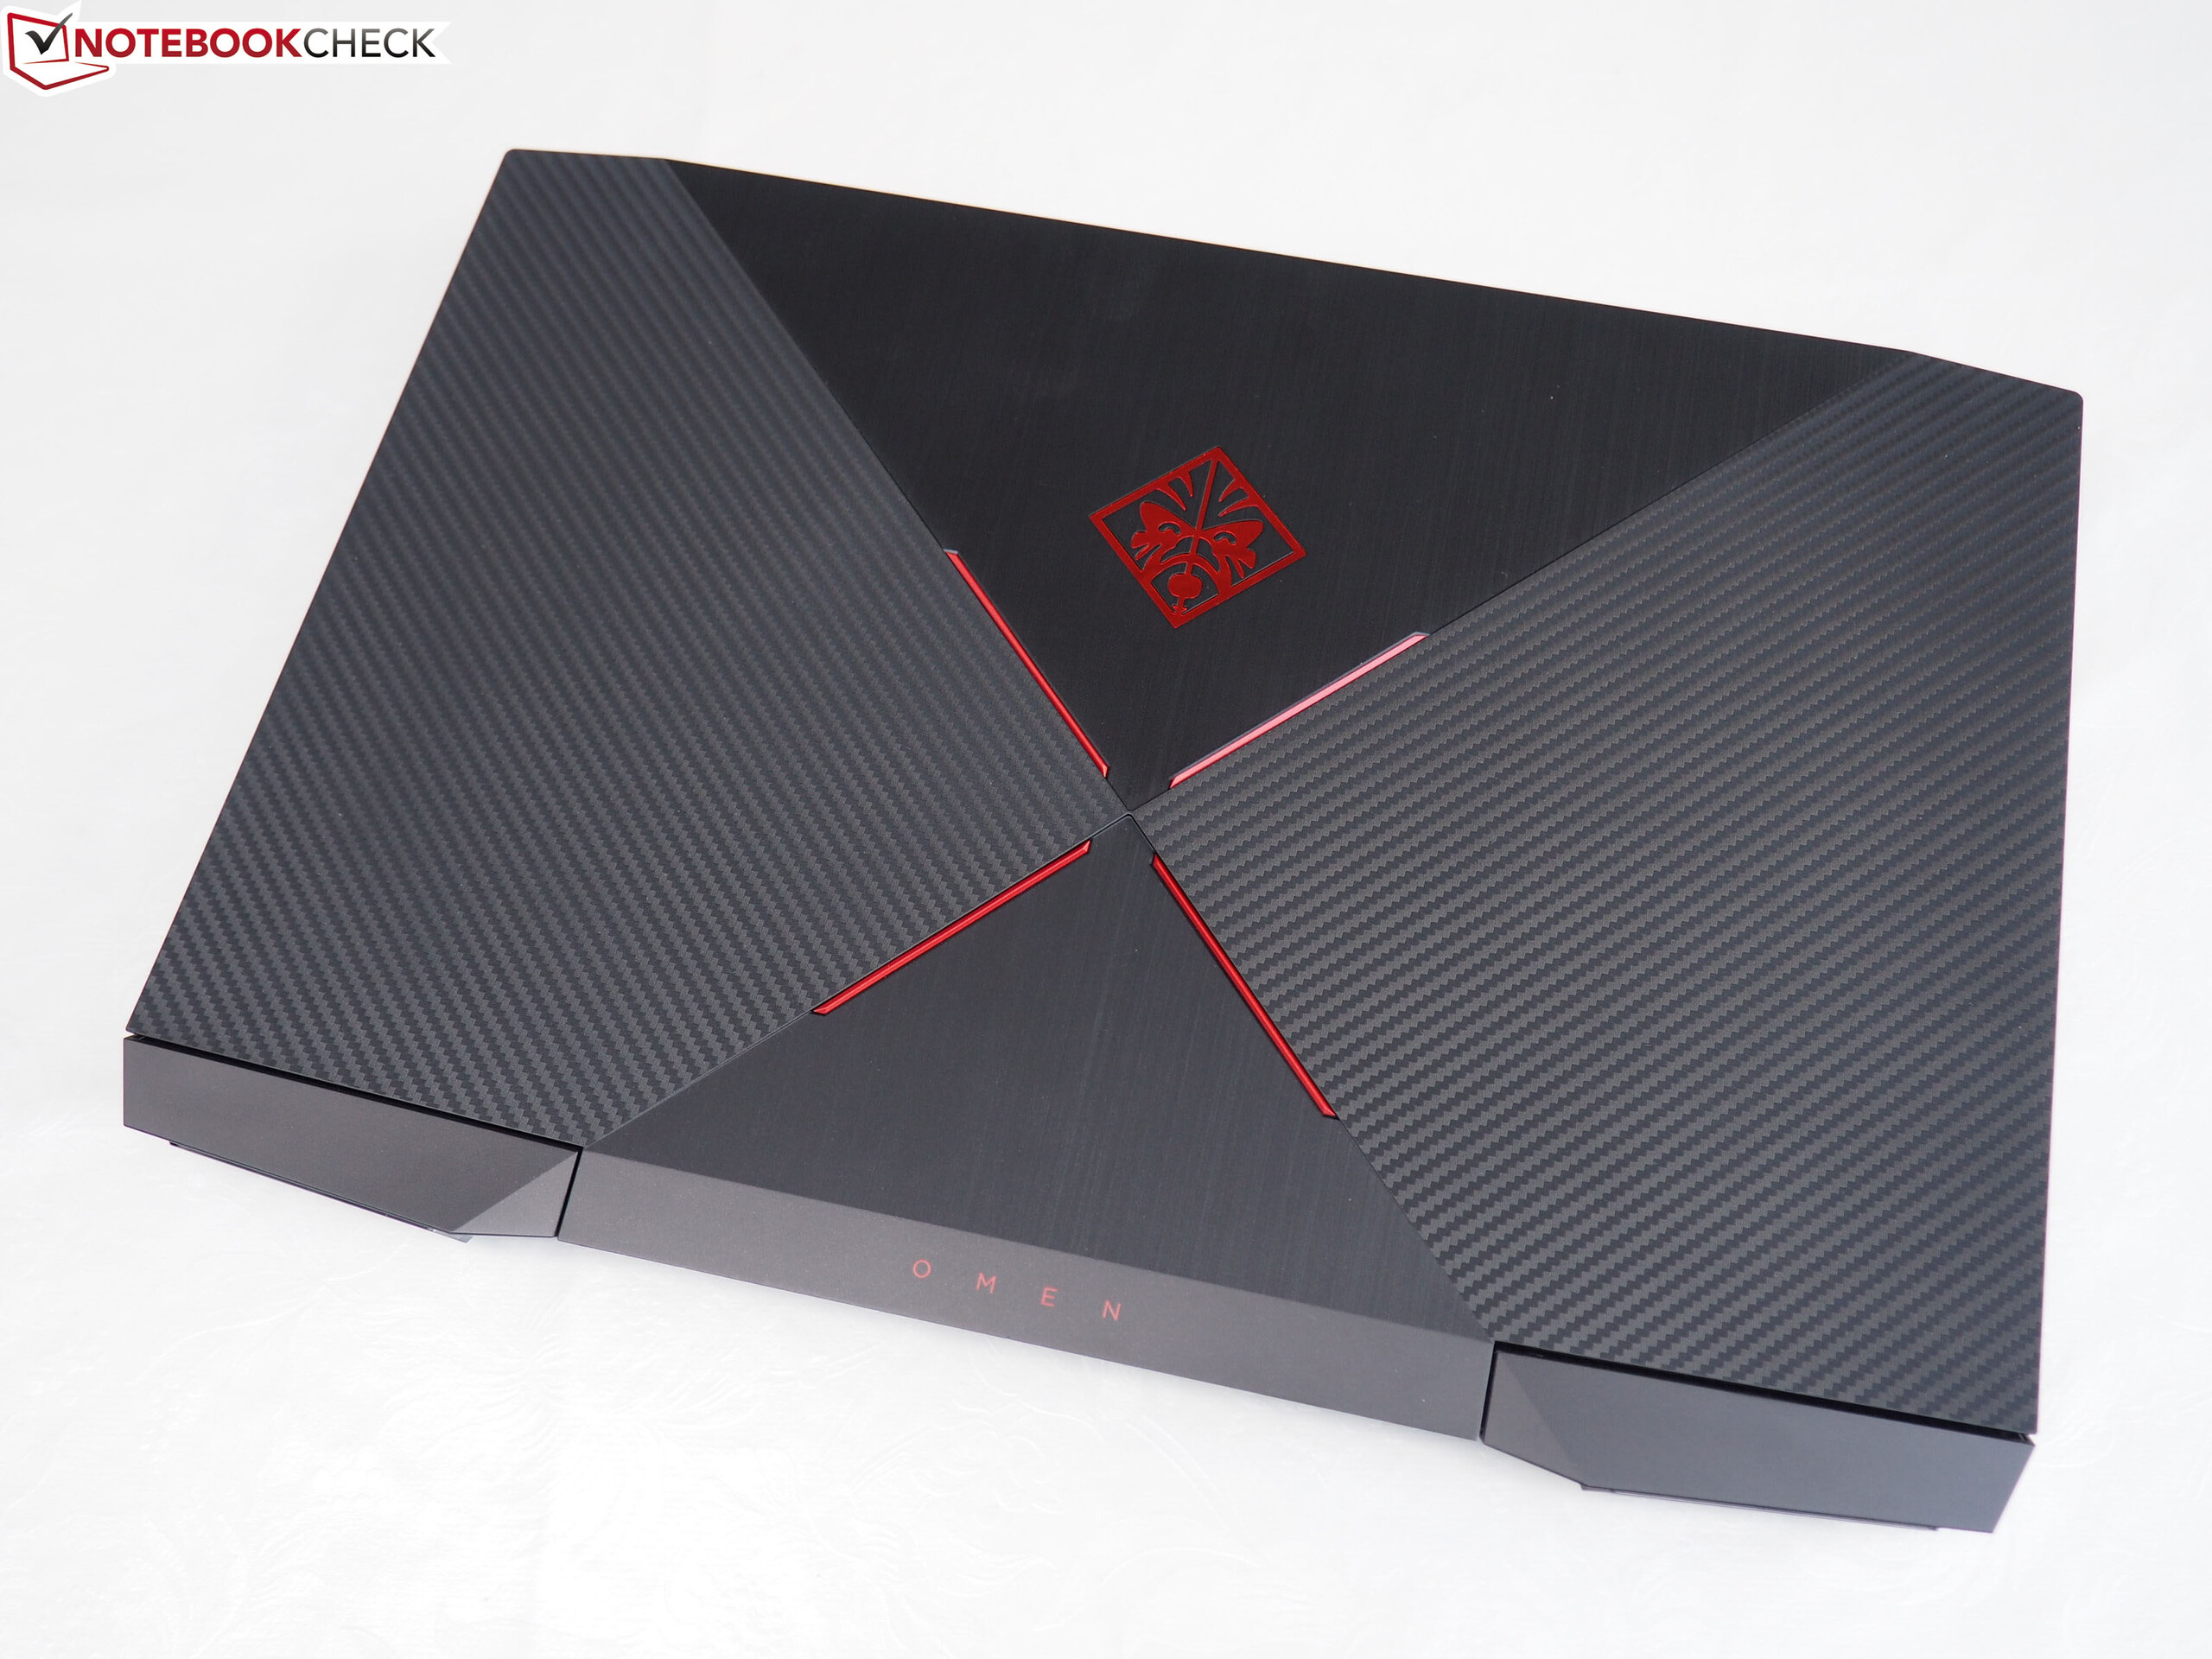
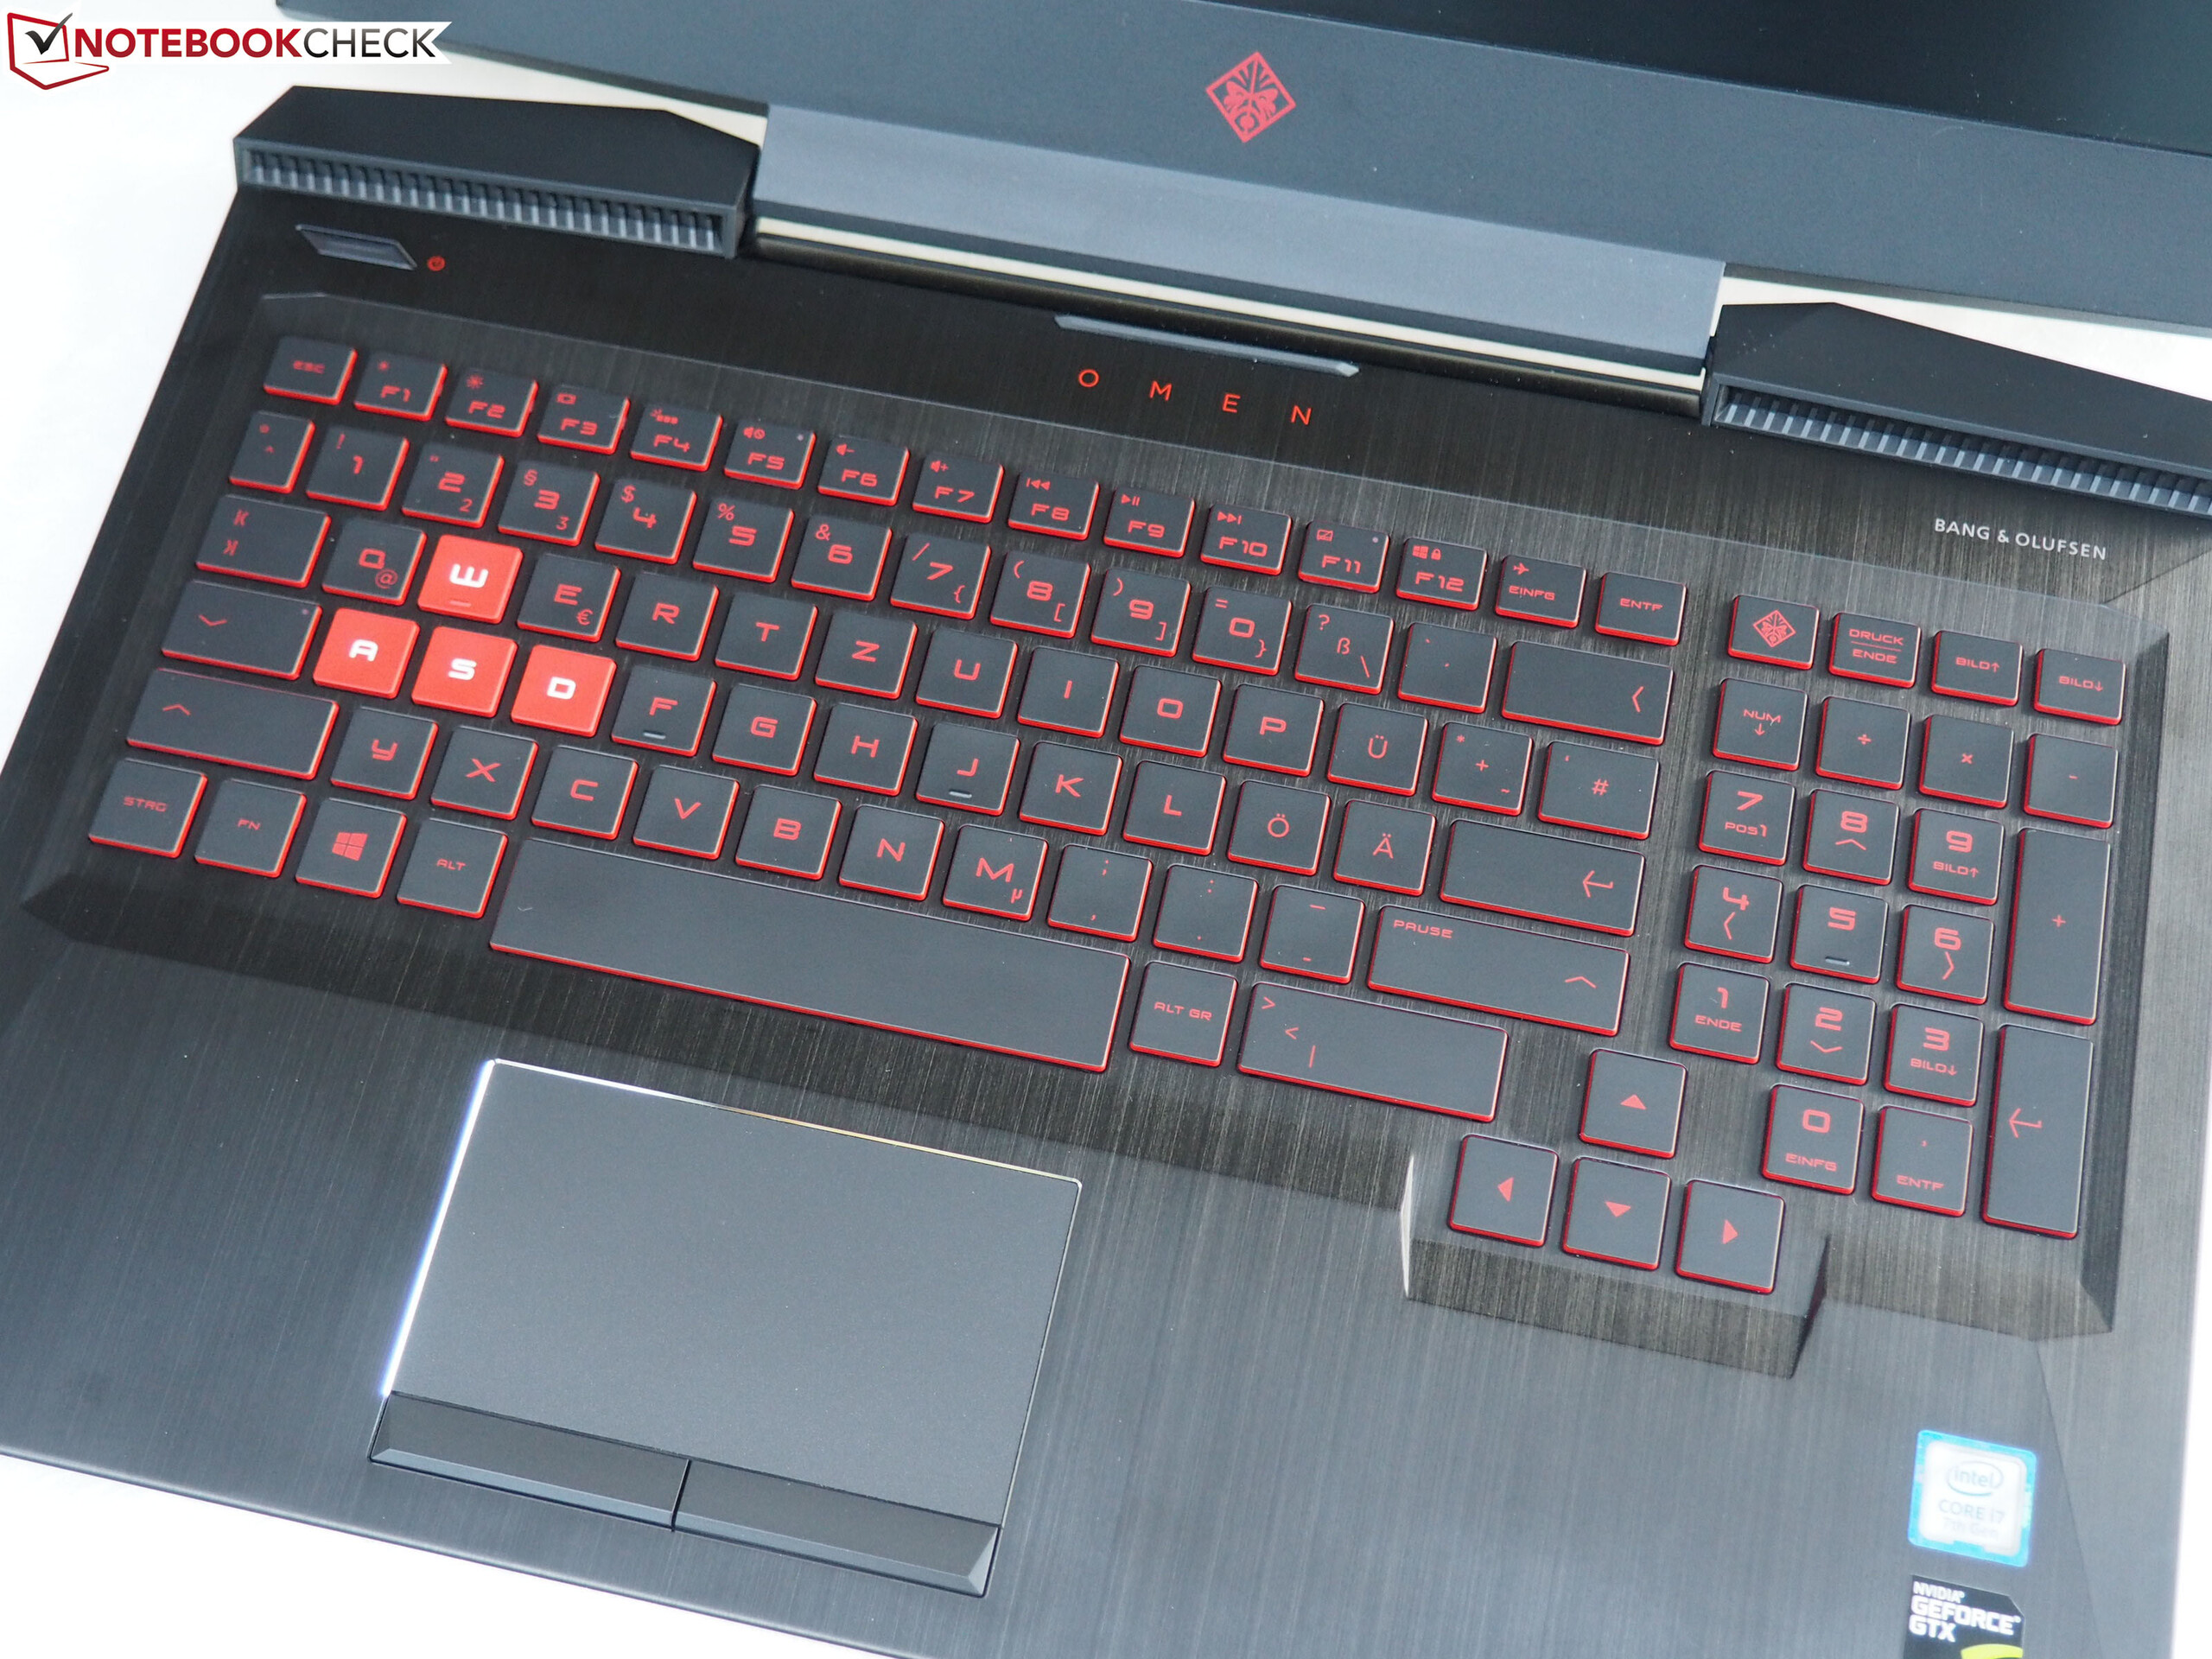
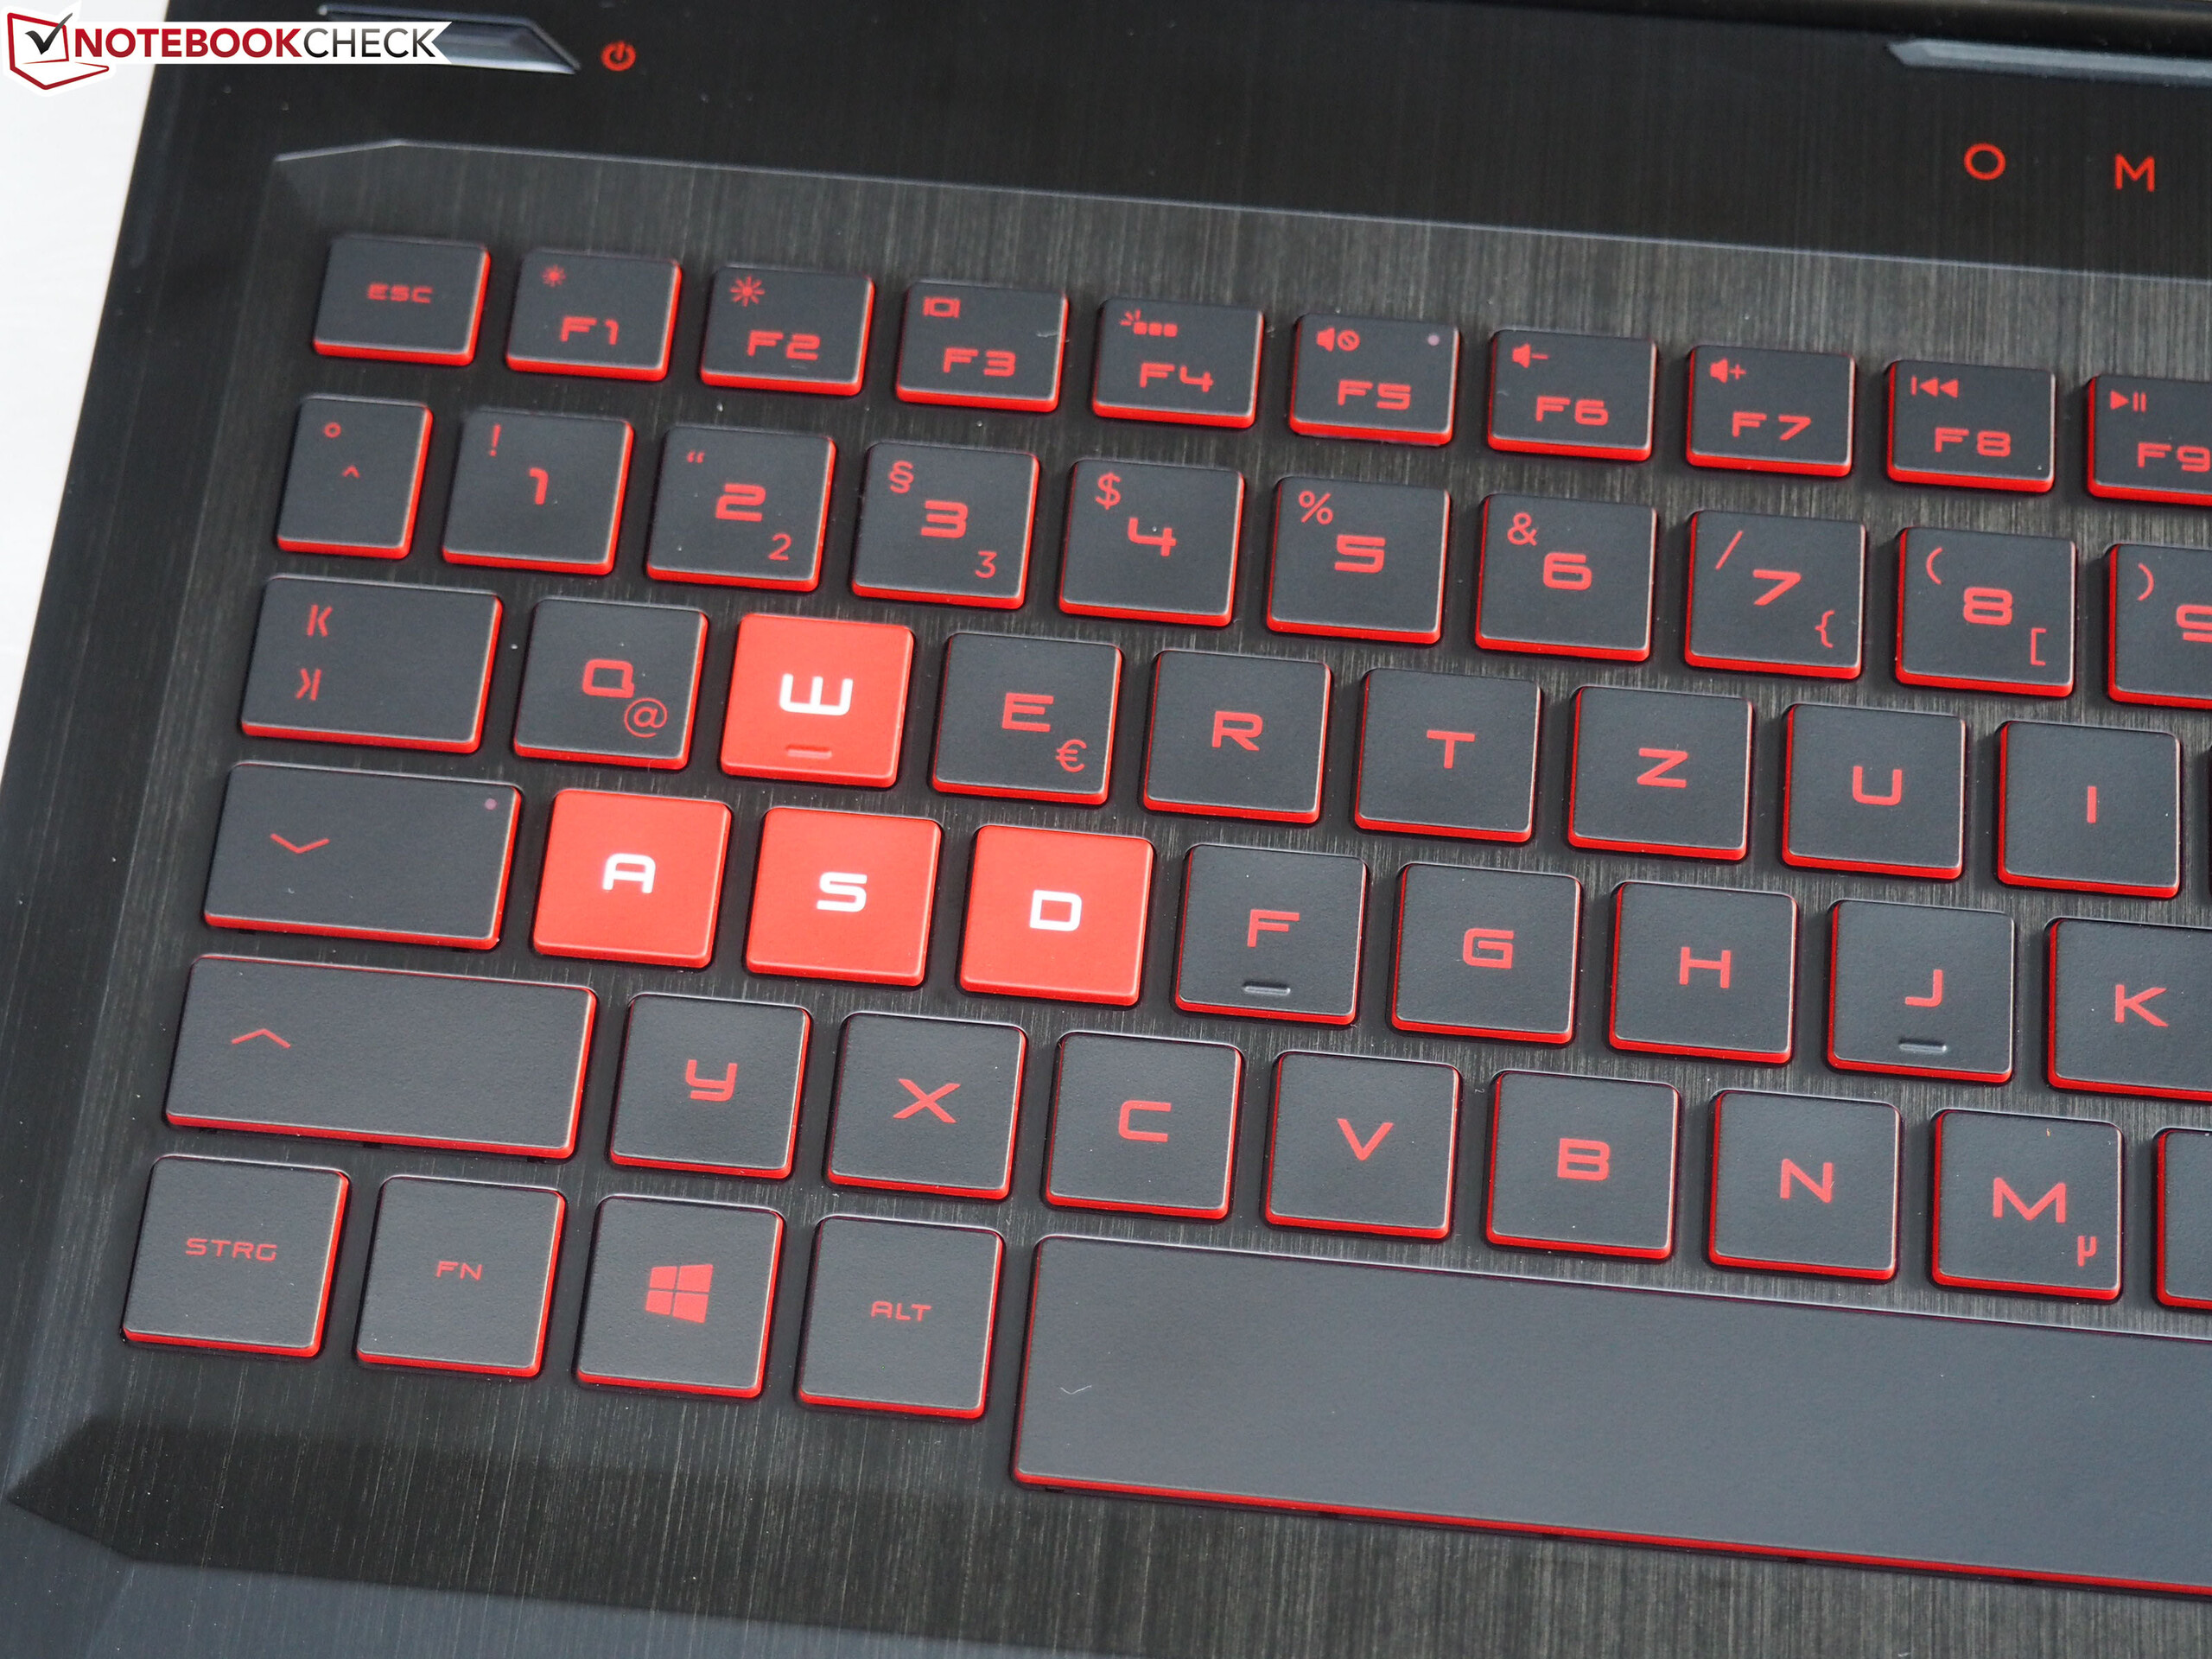
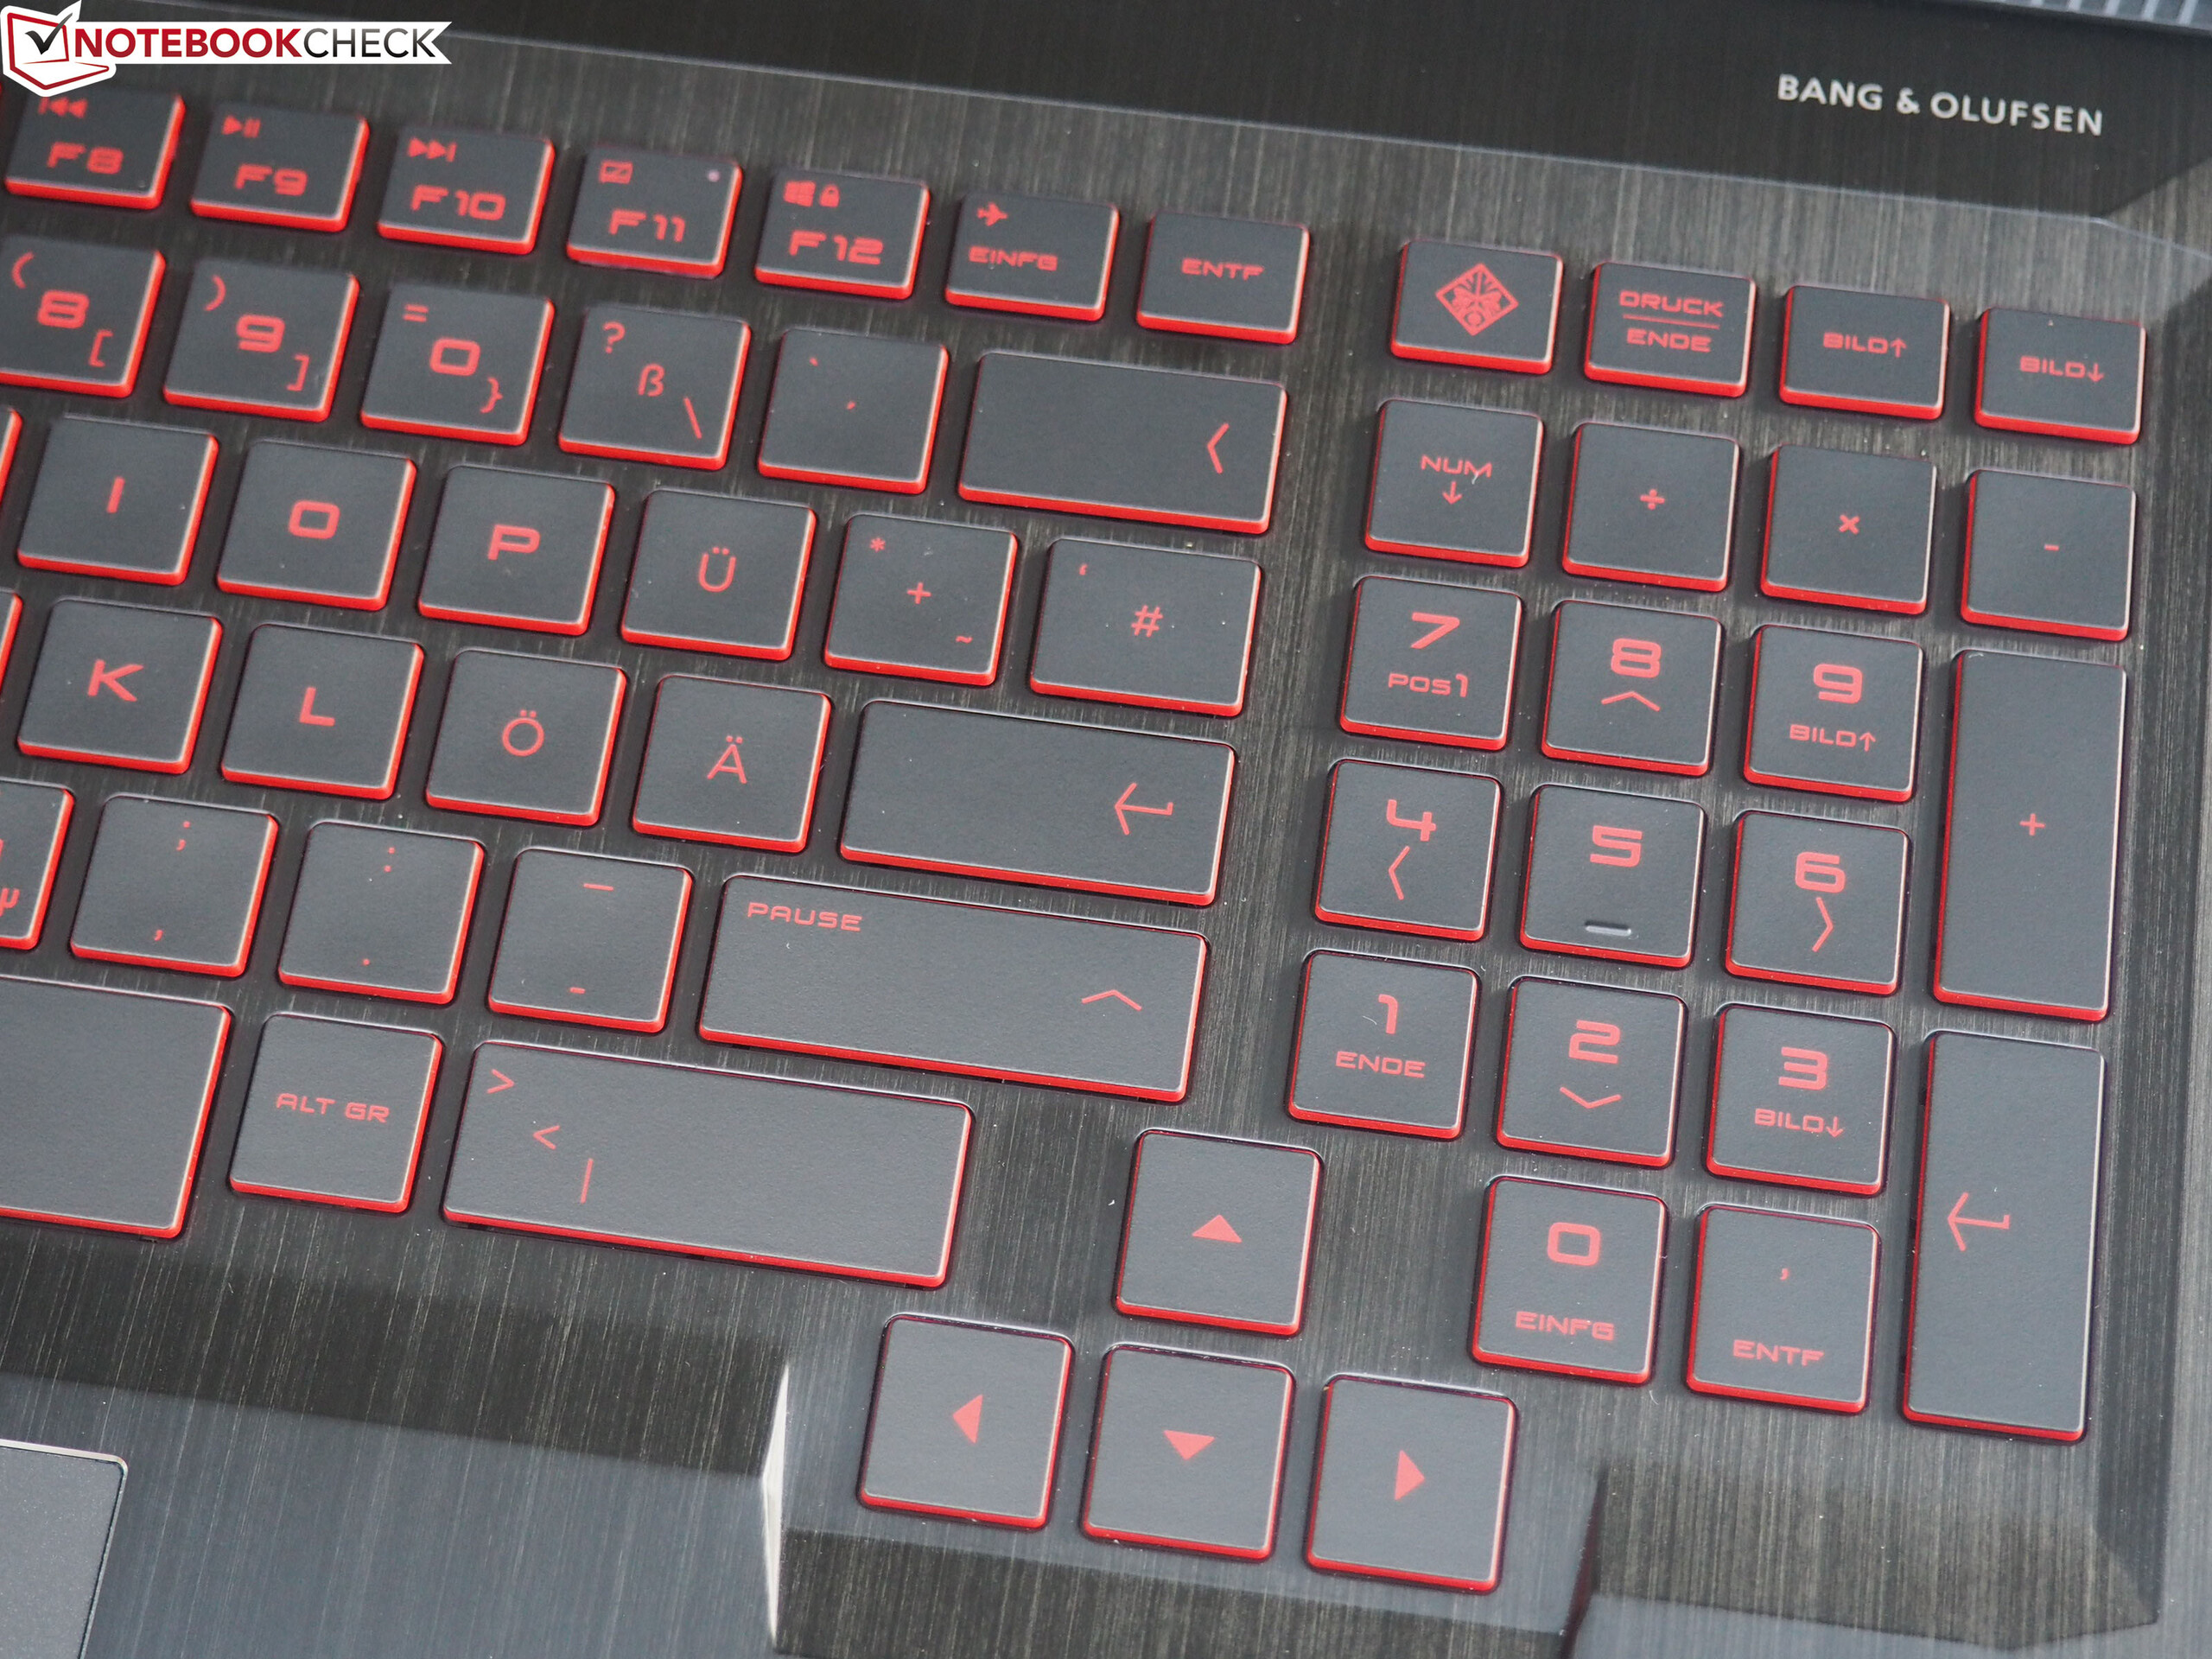
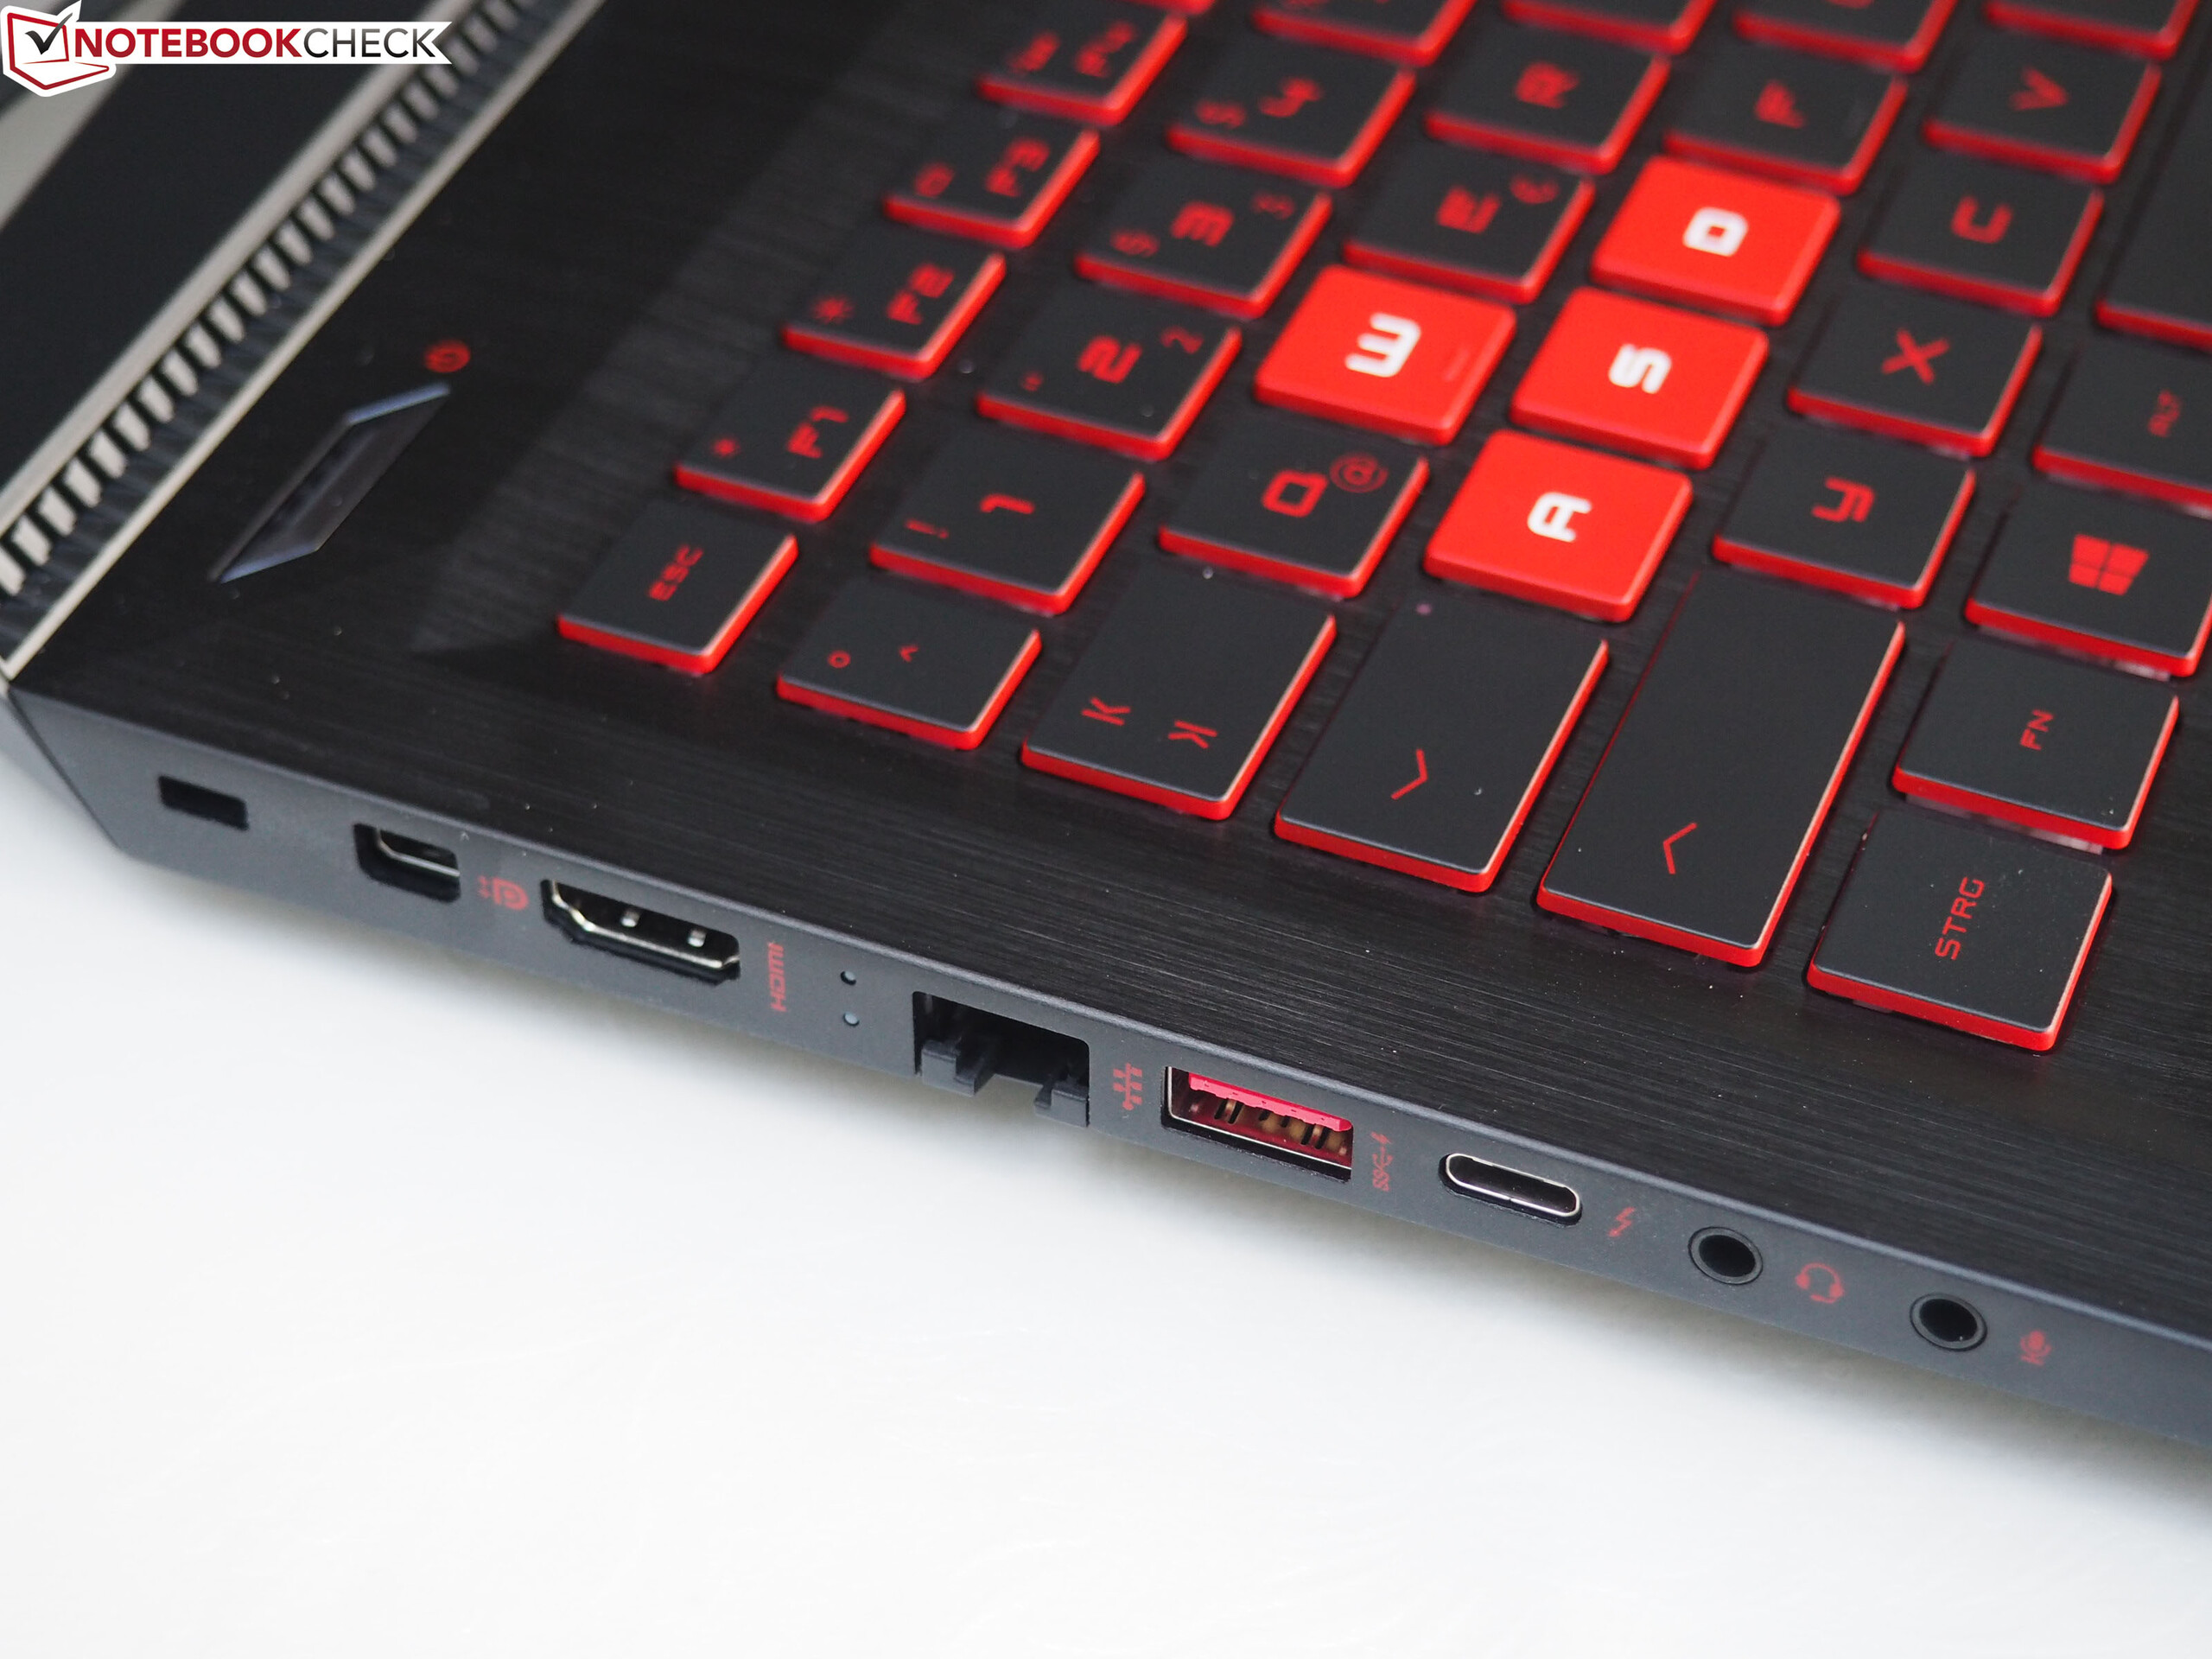
Embora a carcaça não tenha ficado mais fina ou leve, ele ganha pontos com uma maior estabilidade, melhores dispositivos de entrada e materiais mais elegantes. A HP também merece respeito pelo visual excêntrico, você goste ou não. Além dos tempos de resposta um tanto fracos, a tela também é atraente.
O painel de 120 Hz incorporado no modelo top convence com ângulos de visão estáveis, um alto contraste e valores de cor decentes.
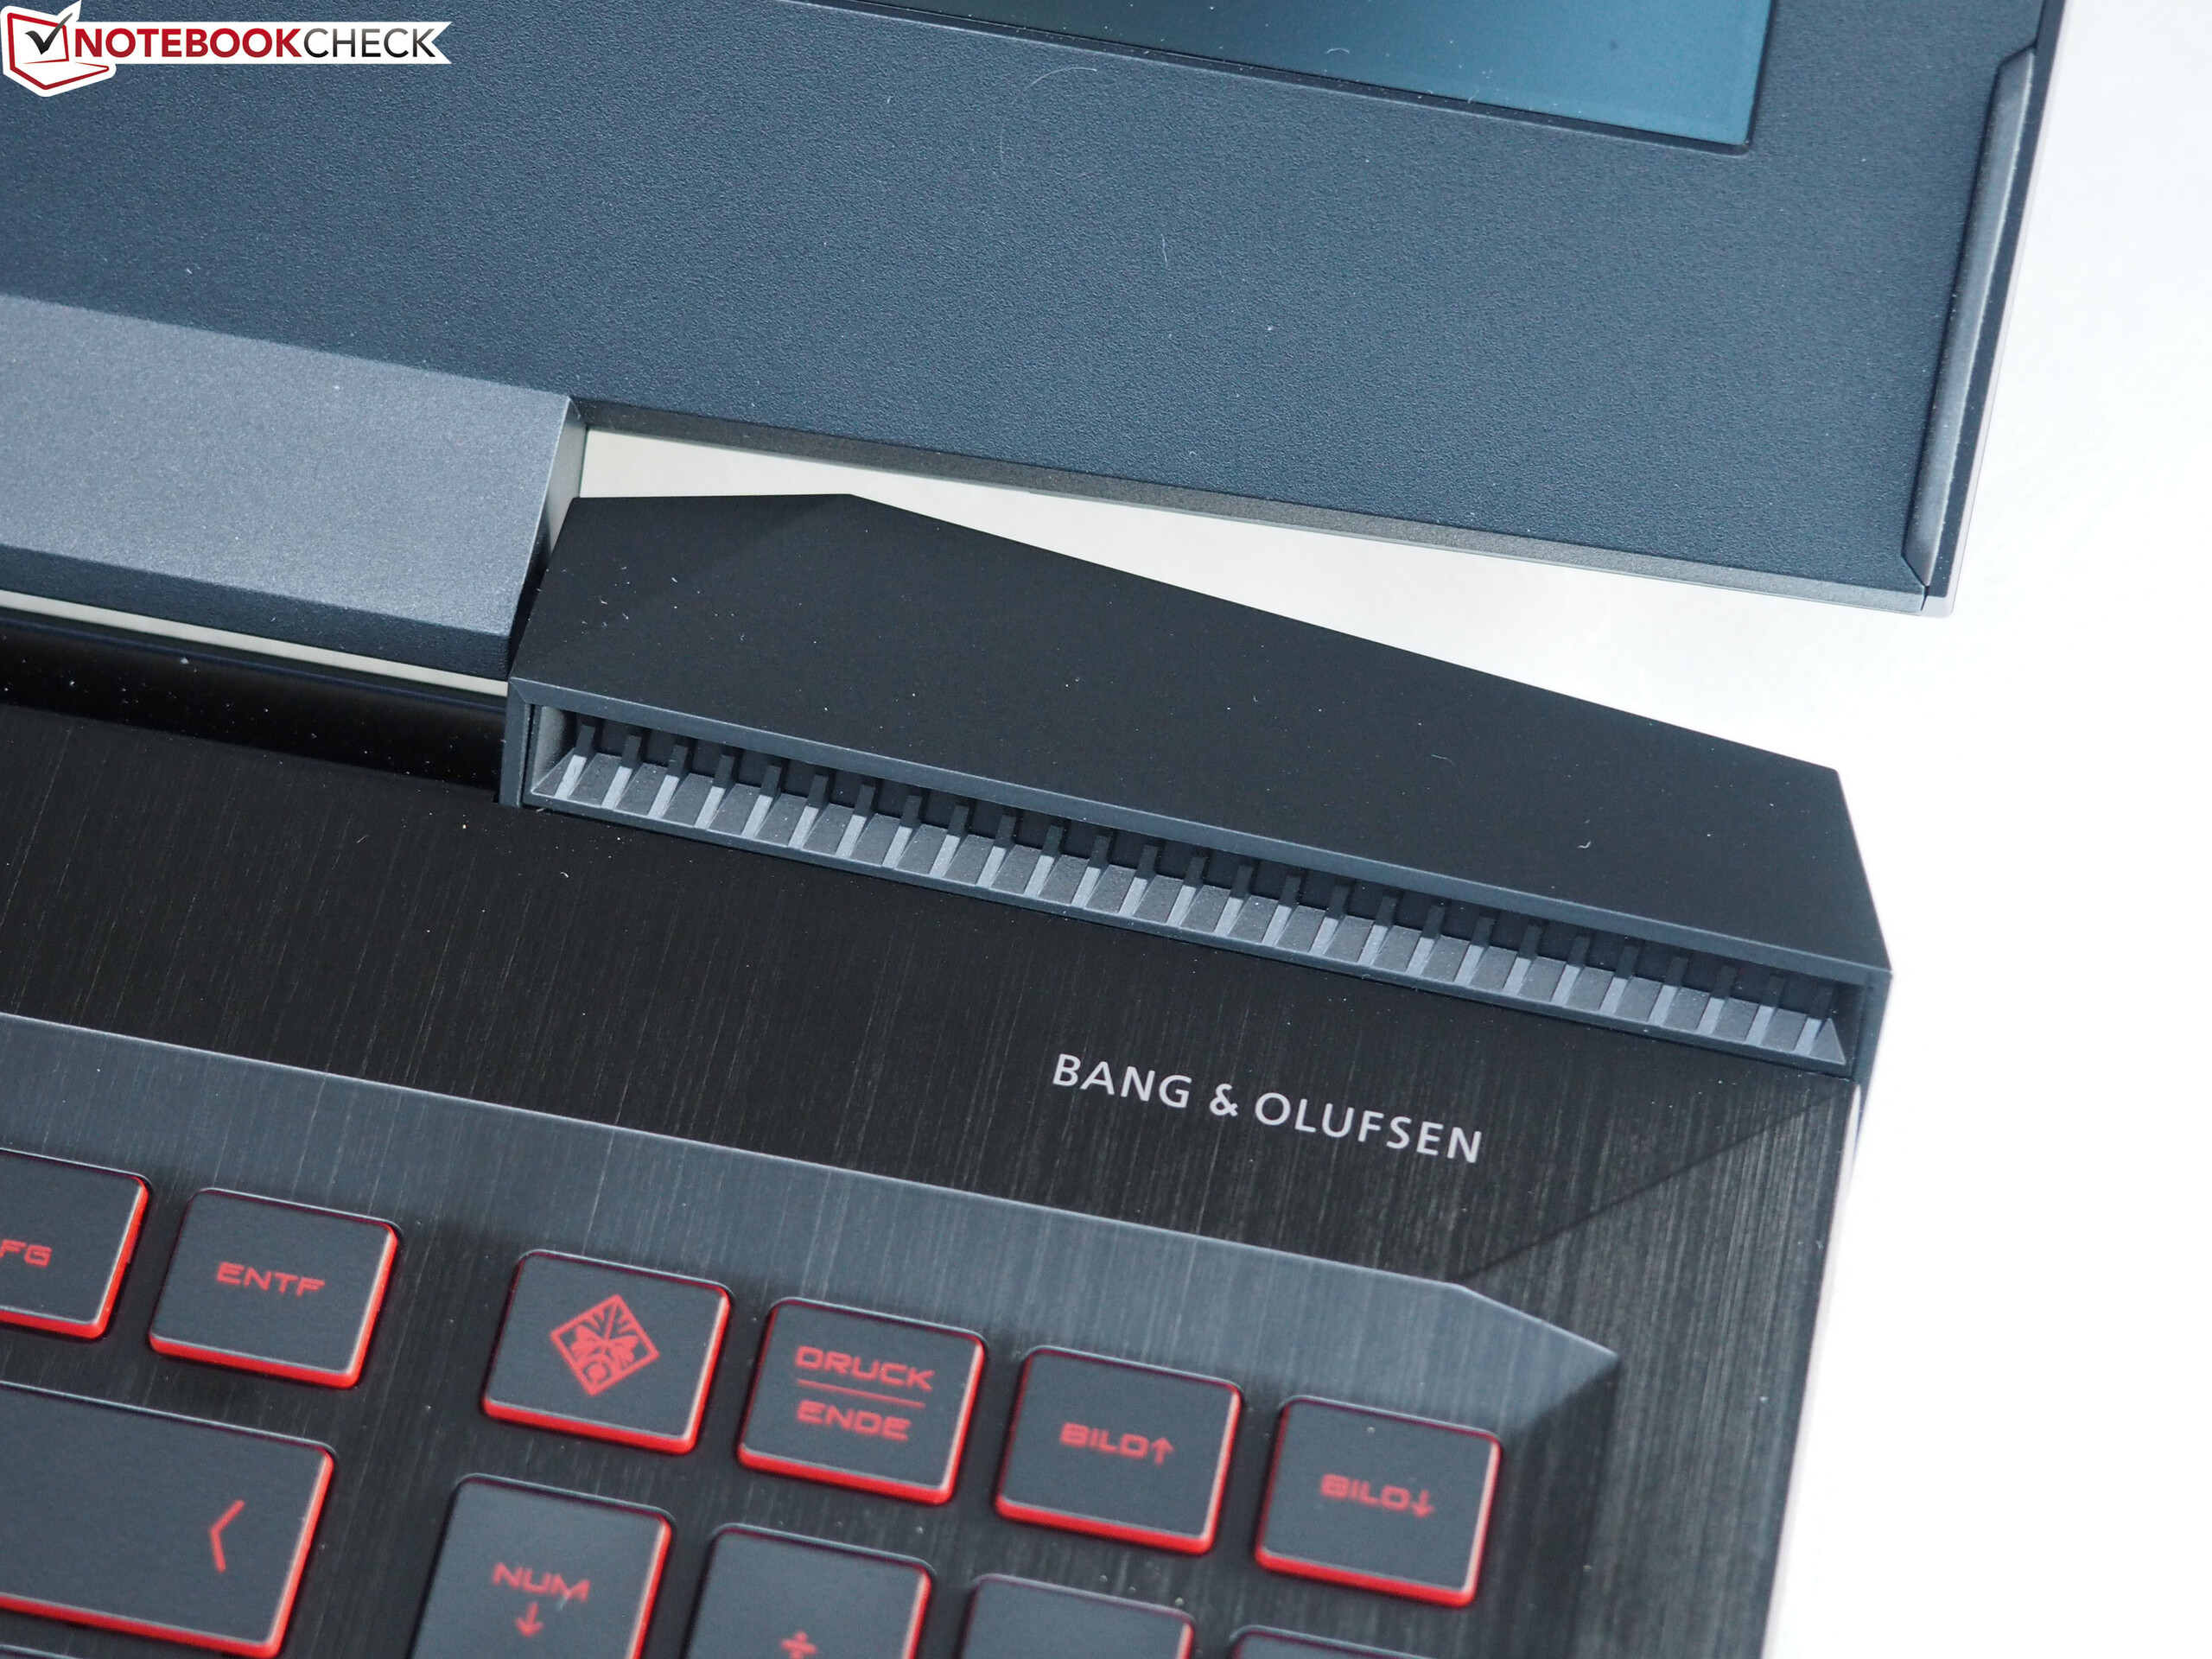
Nós também quase não tivemos queixas sobre os falantes.
Temos impressões confusas sobre a placa gráfica. Na prática, o design Max-Q tem apenas um efeito positivo mínimo, se houver, enquanto, por outro lado, perder quase 10% de desempenho e não o torna mais acessível. Outros fabricantes conseguem as mesmas ou mesmo menores emissões (temperatura, ruído) com uma GTX 1060 regular.
No entanto, a HP consegue dar um passo decisivo, de modo que desta vez seja suficiente para um bom lugar na nossa lista dos Top 10 (Tabelas de Portáteis de Jogos Finos e Leves).
HP Omen 15-ce002ng
- 07/20/2017 v6 (old)
Florian Glaser
Price comparison