Breve Análise do Portátil HP EliteBook 1050 G1 (i7-8750H, 4K, GTX 1050 Max-Q)
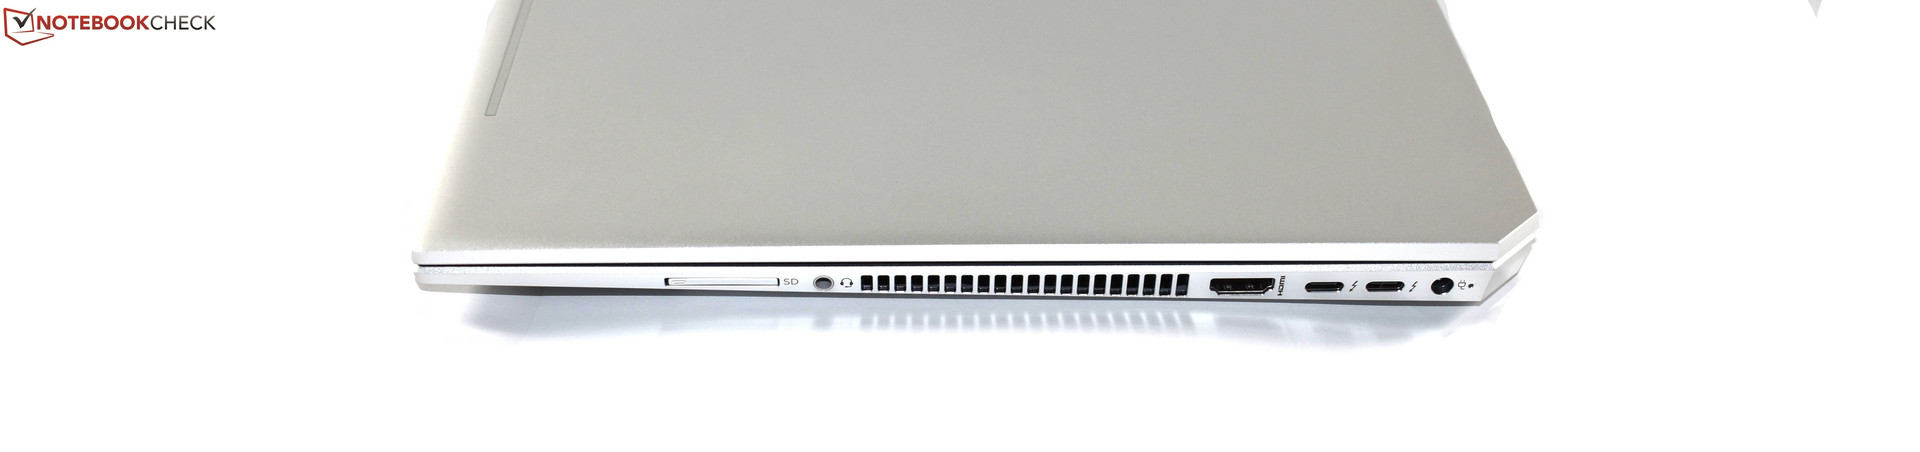

| SD Card Reader | |
| average JPG Copy Test (av. of 3 runs) | |
| HP ZBook Studio G4-Y6K17EA (Toshiba Exceria Pro SDXC 64 GB UHS-II) | |
| Dell XPS 15 9570 i7 UHD (Toshiba Exceria Pro SDXC 64 GB UHS-II) | |
| HP EliteBook 1050 G1-4QY20EA (Toshiba Exceria Pro SDXC 64 GB UHS-II) | |
| Média da turma Multimedia (23 - 531, n=36, últimos 2 anos) | |
| Lenovo ThinkPad T580-20LAS01H00 (Toshiba Exceria Pro SDXC 64 GB UHS-II) | |
| maximum AS SSD Seq Read Test (1GB) | |
| HP ZBook Studio G4-Y6K17EA (Toshiba Exceria Pro SDXC 64 GB UHS-II) | |
| HP EliteBook 1050 G1-4QY20EA (Toshiba Exceria Pro SDXC 64 GB UHS-II) | |
| Média da turma Multimedia (37.3 - 1455, n=35, últimos 2 anos) | |
| Dell XPS 15 9570 i7 UHD (Toshiba Exceria Pro SDXC 64 GB UHS-II) | |
| Lenovo ThinkPad T580-20LAS01H00 (Toshiba Exceria Pro SDXC 64 GB UHS-II) | |
| |||||||||||||||||||||||||
iluminação: 83 %
iluminação com acumulador: 440 cd/m²
Contraste: 1294:1 (Preto: 0.34 cd/m²)
ΔE ColorChecker Calman: 5.04 | ∀{0.5-29.43 Ø4.71}
calibrated: 2.04
ΔE Greyscale Calman: 4.98 | ∀{0.09-98 Ø4.96}
94% sRGB (Argyll 1.6.3 3D)
61% AdobeRGB 1998 (Argyll 1.6.3 3D)
67.9% AdobeRGB 1998 (Argyll 3D)
94.1% sRGB (Argyll 3D)
67.8% Display P3 (Argyll 3D)
Gamma: 2.48
CCT: 7777 K
| HP EliteBook 1050 G1-4QY20EA AUO30EB, , 3840x2160, 15.6" | Dell XPS 15 9570 i7 UHD LQ156D1, , 3840x2160, 15.6" | Apple MacBook Pro 15 2018 (2.6 GHz, 560X) APPA040, , 2880x1800, 15.4" | Lenovo ThinkPad T580-20LAS01H00 NV156QUM-N44, , 3840x2160, 15.6" | HP ZBook Studio G4-Y6K17EA SHP1445, , 3840x2160, 15.6" | HP EliteBook 850 G5 3JX58EA AUO24ED, , 1920x1080, 15.6" | Lenovo ThinkPad P51 20HH0016GE LEN40BD, B156ZAN02.1, , 3840x2160, 15.6" | |
|---|---|---|---|---|---|---|---|
| Display | 13% | 27% | -1% | 24% | -6% | 26% | |
| Display P3 Coverage (%) | 67.8 | 79.1 17% | 98.7 46% | 69.2 2% | 82.6 22% | 63.4 -6% | 86.3 27% |
| sRGB Coverage (%) | 94.1 | 98.8 5% | 99.9 6% | 90.7 -4% | 98.9 5% | 88.8 -6% | 99.5 6% |
| AdobeRGB 1998 Coverage (%) | 67.9 | 79.2 17% | 86.6 28% | 66.3 -2% | 98 44% | 64.4 -5% | 99.3 46% |
| Response Times | 4% | 8% | 4% | 9% | 20% | 20% | |
| Response Time Grey 50% / Grey 80% * (ms) | 56 ? | 46.4 ? 17% | 43.2 ? 23% | 51.2 ? 9% | 44.8 ? 20% | 42 ? 25% | 40.8 ? 27% |
| Response Time Black / White * (ms) | 29 ? | 32 ? -10% | 31.2 ? -8% | 29.6 ? -2% | 30 ? -3% | 25 ? 14% | 25.2 ? 13% |
| PWM Frequency (Hz) | 980 ? | 117000 ? | 952 ? | 1497 ? | |||
| Screen | -4% | 32% | 4% | 15% | -20% | 10% | |
| Brightness middle (cd/m²) | 440 | 494 12% | 520 18% | 310 -30% | 324 -26% | 402 -9% | 317 -28% |
| Brightness (cd/m²) | 389 | 457 17% | 492 26% | 283 -27% | 338 -13% | 383 -2% | 309 -21% |
| Brightness Distribution (%) | 83 | 88 6% | 88 6% | 87 5% | 78 -6% | 88 6% | 89 7% |
| Black Level * (cd/m²) | 0.34 | 0.34 -0% | 0.39 -15% | 0.24 29% | 0.3 12% | 0.41 -21% | 0.36 -6% |
| Contrast (:1) | 1294 | 1453 12% | 1333 3% | 1292 0% | 1080 -17% | 980 -24% | 881 -32% |
| Colorchecker dE 2000 * | 5.04 | 5.2 -3% | 1.2 76% | 3.1 38% | 1.6 68% | 5.25 -4% | 2.7 46% |
| Colorchecker dE 2000 max. * | 6.99 | 17.5 -150% | 2.3 67% | 7.6 -9% | 4.6 34% | 8.65 -24% | 4.1 41% |
| Colorchecker dE 2000 calibrated * | 2.04 | 2.2 -8% | 5.19 -154% | ||||
| Greyscale dE 2000 * | 4.98 | 2.7 46% | 1.3 74% | 2.3 54% | 2.5 50% | 4 20% | 3 40% |
| Gamma | 2.48 89% | 2.1 105% | 2.18 101% | 2.21 100% | 2.21 100% | 2.68 82% | 2.27 97% |
| CCT | 7777 84% | 7038 92% | 6738 96% | 6876 95% | 6273 104% | 6756 96% | 6077 107% |
| Color Space (Percent of AdobeRGB 1998) (%) | 61 | 71.2 17% | 59.1 -3% | 85.7 40% | 58 -5% | 87.6 44% | |
| Color Space (Percent of sRGB) (%) | 94 | 98.8 5% | 90.1 -4% | 98.9 5% | 89 -5% | 99.5 6% | |
| Média Total (Programa/Configurações) | 4% /
1% | 22% /
27% | 2% /
3% | 16% /
16% | -2% /
-13% | 19% /
14% |
* ... menor é melhor
Exibir tempos de resposta
| ↔ Tempo de resposta preto para branco | ||
|---|---|---|
| 29 ms ... ascensão ↗ e queda ↘ combinadas | ↗ 14 ms ascensão | 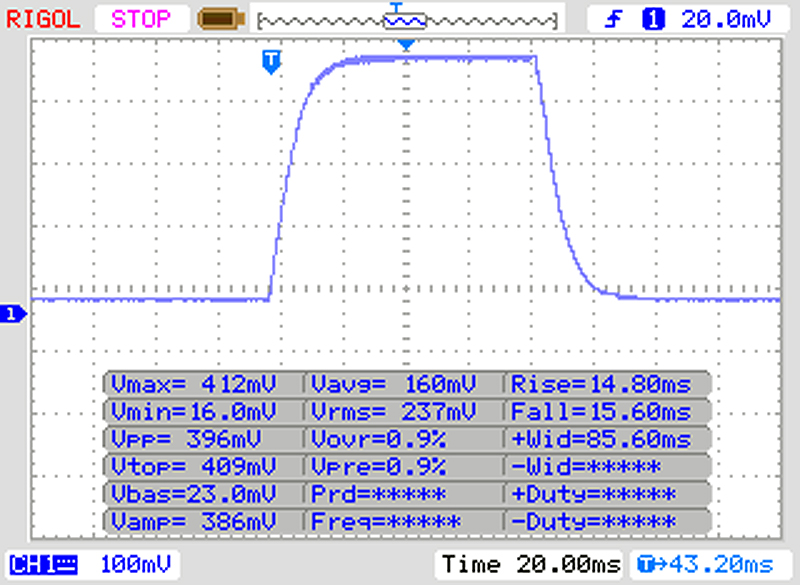 |
| ↘ 15 ms queda | ||
| A tela mostra taxas de resposta relativamente lentas em nossos testes e pode ser muito lenta para os jogadores. Em comparação, todos os dispositivos testados variam de 0.1 (mínimo) a 240 (máximo) ms. » 77 % de todos os dispositivos são melhores. Isso significa que o tempo de resposta medido é pior que a média de todos os dispositivos testados (19.8 ms). | ||
| ↔ Tempo de resposta 50% cinza a 80% cinza | ||
| 56 ms ... ascensão ↗ e queda ↘ combinadas | ↗ 26 ms ascensão | 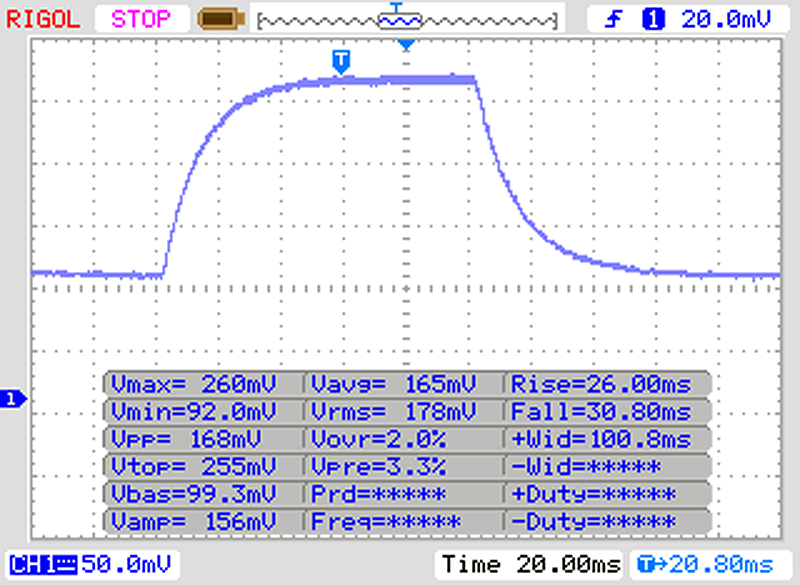 |
| ↘ 30 ms queda | ||
| A tela mostra taxas de resposta lentas em nossos testes e será insatisfatória para os jogadores. Em comparação, todos os dispositivos testados variam de 0.165 (mínimo) a 636 (máximo) ms. » 93 % de todos os dispositivos são melhores. Isso significa que o tempo de resposta medido é pior que a média de todos os dispositivos testados (30.9 ms). | ||
Cintilação da tela / PWM (modulação por largura de pulso)
| Tela tremeluzindo / PWM não detectado | 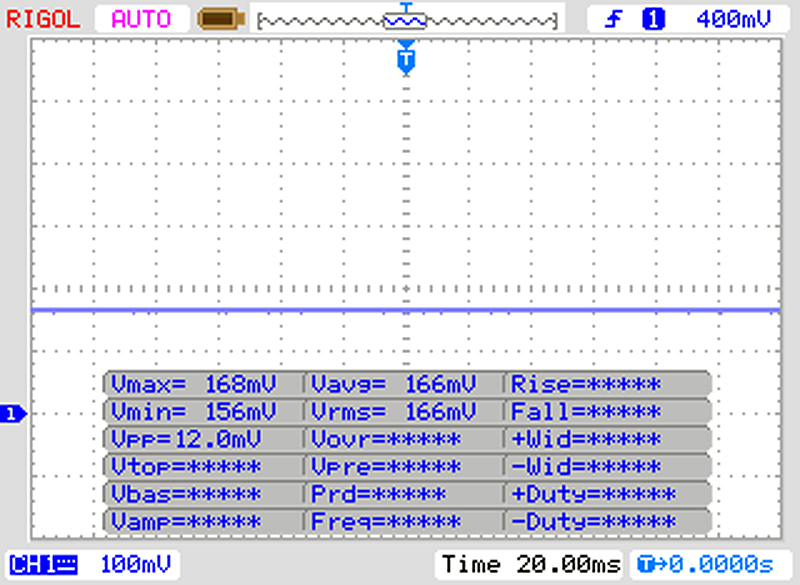 | ||
[pwm_comparison] Em comparação: 52 % de todos os dispositivos testados não usam PWM para escurecer a tela. Se PWM foi detectado, uma média de 7748 (mínimo: 5 - máximo: 343500) Hz foi medida. | |||
| PCMark 8 Home Score Accelerated v2 | 3433 pontos | |
| PCMark 8 Work Score Accelerated v2 | 4643 pontos | |
| PCMark 10 Score | 4666 pontos | |
Ajuda | ||
| HP EliteBook 1050 G1-4QY20EA Toshiba XG5-P KXG50PNV2T04 | Dell XPS 15 9570 i7 UHD Toshiba XG5 KXG50ZNV512G | Apple MacBook Pro 15 2018 (2.6 GHz, 560X) Apple SSD AP0512 | Lenovo ThinkPad T580-20LAS01H00 Samsung SSD PM981 MZVLB512HAJQ | HP ZBook Studio G4-Y6K17EA Samsung SM961 MZVKW512HMJP m.2 PCI-e | HP EliteBook 850 G5 3JX58EA Toshiba XG5 KXG50ZNV256G | Média Toshiba XG5-P KXG50PNV2T04 | |
|---|---|---|---|---|---|---|---|
| CrystalDiskMark 3.0 | -11% | 1% | 3% | 51% | -9% | 4% | |
| Read Seq (MB/s) | 1733 | 1805 4% 1805 4% | 1511 -13% | 944 -46% | 2229 29% | 2069 19% | 1714 ? -1% |
| Write Seq (MB/s) | 1030 | 523 -49% 523 -49% | 1466 42% | 924 -10% | 1562 52% | 393.4 -62% | 1039 ? 1% |
| Read 512 (MB/s) | 547 | 807 48% 807 48% | 1015 86% | 555 1% | 391.4 -28% | 914 67% | 600 ? 10% |
| Write 512 (MB/s) | 802 | 499.7 -38% 499.7 -38% | 1166 45% | 565 -30% | 1279 59% | 284.9 -64% | 922 ? 15% |
| Read 4k (MB/s) | 27.81 | 29.02 4% 29.02 4% | 10.97 -61% | 63.9 130% | 56.5 103% | 31.76 14% | 27.2 ? -2% |
| Write 4k (MB/s) | 112.4 | 79.4 -29% 79.4 -29% | 19.53 -83% | 135.3 20% | 182 62% | 99.2 -12% | 108.2 ? -4% |
| Read 4k QD32 (MB/s) | 415.8 | 279 -33% 279 -33% | 525 26% | 336.2 -19% | 645 55% | 282 -32% | 437 ? 5% |
| Write 4k QD32 (MB/s) | 345.2 | 351.9 2% 351.9 2% | 212.4 -38% | 264.9 -23% | 595 72% | 338.5 -2% | 372 ? 8% |

| 3DMark 06 Standard Score | 29687 pontos | |
| 3DMark Vantage P Result | 26117 pontos | |
| 3DMark 11 Performance | 7396 pontos | |
| 3DMark Ice Storm Standard Score | 51461 pontos | |
| 3DMark Cloud Gate Standard Score | 14739 pontos | |
| 3DMark Fire Strike Score | 5114 pontos | |
| 3DMark Time Spy Score | 1709 pontos | |
Ajuda | ||
| BioShock Infinite - 1920x1080 Ultra Preset, DX11 (DDOF) | |
| Dell XPS 15 9570 i7 UHD | |
| HP EliteBook 1050 G1-4QY20EA | |
| Média NVIDIA GeForce GTX 1050 Max-Q (59 - 62.1, n=4) | |
| Lenovo ThinkPad P52 20MAS03N00 | |
| Apple MacBook Pro 15 2018 (2.6 GHz, 560X) | |
| The Witcher 3 | |
| 1920x1080 High Graphics & Postprocessing (Nvidia HairWorks Off) | |
| Média da turma Multimedia (22 - 157, n=5, últimos 2 anos) | |
| Dell XPS 15 9570 i7 UHD | |
| Média NVIDIA GeForce GTX 1050 Max-Q (34 - 41, n=3) | |
| Apple MacBook Pro 15 2018 (2.6 GHz, 560X) | |
| HP EliteBook 1050 G1-4QY20EA | |
| Lenovo ThinkPad P52 20MAS03N00 | |
| 1920x1080 Ultra Graphics & Postprocessing (HBAO+) | |
| Média da turma Multimedia (11 - 107, n=5, últimos 2 anos) | |
| Dell XPS 15 9570 i7 UHD | |
| Média NVIDIA GeForce GTX 1050 Max-Q (18.5 - 30, n=3) | |
| Apple MacBook Pro 15 2018 (2.6 GHz, 560X) | |
| HP EliteBook 1050 G1-4QY20EA | |
| Lenovo ThinkPad P52 20MAS03N00 | |
| Battlefield 1 - 1920x1080 High Preset AA:T | |
| Dell XPS 15 9570 i7 UHD | |
| HP EliteBook 1050 G1-4QY20EA | |
| Média NVIDIA GeForce GTX 1050 Max-Q (n=1) | |
| Apple MacBook Pro 15 2018 (2.6 GHz, 560X) | |
| baixo | média | alto | ultra | 4K | |
|---|---|---|---|---|---|
| BioShock Infinite (2013) | 285.1 | 172.6 | 150.4 | 62.1 | |
| Company of Heroes 2 (2013) | 79.7 | 71.8 | 48.7 | 21.87 | |
| GTA V (2015) | 118.7 | 112.9 | 62.1 | 27 | 26.1 |
| The Witcher 3 (2015) | 103.2 | 59.3 | 34 | 18.5 | 12 |
| Dota 2 Reborn (2015) | 149.5 | 134.1 | 115.5 | 104.1 | 37.1 |
| Rainbow Six Siege (2015) | 108 | 93.5 | 67.5 | 62.8 | 22.1 |
| Rise of the Tomb Raider (2016) | 105.5 | 56 | 33.9 | 30.3 | 12.9 |
| The Division (2016) | 109.9 | 69.8 | 32.3 | 24.8 | 10.9 |
| Overwatch (2016) | 256.9 | 160 | 80.5 | 48.9 | 26 |
| Deus Ex Mankind Divided (2016) | 71.5 | 52.6 | 28.3 | 20.3 | 9 |
| Battlefield 1 (2016) | 144.7 | 89.2 | 45 | 41.3 | 15.9 |
| Civilization 6 (2016) | 141 | 82.7 | 35 | 28.6 | 23 |
| For Honor (2017) | 140.5 | 53.5 | 49.8 | 38.1 | 14.7 |
| Ghost Recon Wildlands (2017) | 80.6 | 35.7 | 32.5 | 17.1 | 10.5 |
| Rocket League (2017) | 240.3 | 155.4 | 98.8 | 36.7 | |
| Dirt 4 (2017) | 191.1 | 88 | 47.1 | 26.2 | 15.4 |
| Team Fortress 2 (2017) | 136 | 128 | 120 | 118 | 55 |
| Playerunknown's Battlegrounds (PUBG) (2017) | 51.4 | 33.6 | 11.3 | ||
| FIFA 18 (2017) | 254.7 | 153.2 | 127.5 | 127 | 55.5 |
| Middle-earth: Shadow of War (2017) | 97 | 44 | 31 | 24 | 10 |
| Destiny 2 (2017) | 82.2 | 57.4 | 51.6 | 38.1 | 13.5 |
| Assassin´s Creed Origins (2017) | 59 | 40 | 35 | 28 | 11 |
| Call of Duty WWII (2017) | 144.8 | 99.6 | 46.7 | 36.7 | 16.1 |
| Star Wars Battlefront 2 (2017) | 82.5 | 56.5 | 48.8 | 32.7 | 7.4 |
| Fortnite (2018) | 142.8 | 111.8 | 49.4 | 36.5 | 9.3 |
| Final Fantasy XV Benchmark (2018) | 56.9 | 29.3 | 20.6 | 7.9 | |
| Kingdom Come: Deliverance (2018) | 82.1 | 36.8 | 29.5 | 21.5 | 6 |
| X-Plane 11.11 (2018) | 88.8 | 80.9 | 65.1 | 30.3 | |
| Far Cry 5 (2018) | 66 | 35 | 33 | 30 | 10 |
| The Crew 2 (2018) | 42 | 37 | 33.4 | 10.4 | |
| Monster Hunter World (2018) | 73.7 | 32 | 24 | 20 | 5.8 |
| F1 2018 (2018) | 104 | 63 | 47 | 29 | 13 |
Barulho
| Ocioso |
| 30.25 / 30.25 / 31.8 dB |
| Carga |
| 44.7 / 42 dB |
 | ||
30 dB silencioso 40 dB(A) audível 50 dB(A) ruidosamente alto |
||
min: | ||
(±) A temperatura máxima no lado superior é 44.4 °C / 112 F, em comparação com a média de 36.8 °C / 98 F , variando de 21 a 71 °C para a classe Multimedia.
(-) A parte inferior aquece até um máximo de 46.4 °C / 116 F, em comparação com a média de 39.1 °C / 102 F
(+) Em uso inativo, a temperatura média para o lado superior é 26.5 °C / 80 F, em comparação com a média do dispositivo de 31.3 °C / ### class_avg_f### F.
(+) Os apoios para as mãos e o touchpad são mais frios que a temperatura da pele, com um máximo de 29.3 °C / 84.7 F e, portanto, são frios ao toque.
(±) A temperatura média da área do apoio para as mãos de dispositivos semelhantes foi 28.7 °C / 83.7 F (-0.6 °C / -1 F).
HP EliteBook 1050 G1-4QY20EA análise de áudio
(±) | o volume do alto-falante é médio, mas bom (###valor### dB)
Graves 100 - 315Hz
(-) | quase nenhum baixo - em média 18.2% menor que a mediana
(±) | a linearidade dos graves é média (11% delta para a frequência anterior)
Médios 400 - 2.000 Hz
(+) | médios equilibrados - apenas 3.6% longe da mediana
(±) | a linearidade dos médios é média (9.5% delta para frequência anterior)
Altos 2 - 16 kHz
(+) | agudos equilibrados - apenas 1.9% longe da mediana
(+) | os máximos são lineares (3% delta da frequência anterior)
Geral 100 - 16.000 Hz
(+) | o som geral é linear (14.7% diferença em relação à mediana)
Comparado com a mesma classe
» 35% de todos os dispositivos testados nesta classe foram melhores, 4% semelhantes, 61% piores
» O melhor teve um delta de 5%, a média foi 17%, o pior foi 45%
Comparado com todos os dispositivos testados
» 19% de todos os dispositivos testados foram melhores, 4% semelhantes, 77% piores
» O melhor teve um delta de 4%, a média foi 23%, o pior foi 134%
Apple MacBook Pro 15 2018 (2.6 GHz, 560X) análise de áudio
(+) | os alto-falantes podem tocar relativamente alto (###valor### dB)
Graves 100 - 315Hz
(+) | bons graves - apenas 4.7% longe da mediana
(±) | a linearidade dos graves é média (8.3% delta para a frequência anterior)
Médios 400 - 2.000 Hz
(+) | médios equilibrados - apenas 1.8% longe da mediana
(+) | médios são lineares (3.5% delta para frequência anterior)
Altos 2 - 16 kHz
(+) | agudos equilibrados - apenas 2.6% longe da mediana
(+) | os máximos são lineares (5.7% delta da frequência anterior)
Geral 100 - 16.000 Hz
(+) | o som geral é linear (6.4% diferença em relação à mediana)
Comparado com a mesma classe
» 4% de todos os dispositivos testados nesta classe foram melhores, 1% semelhantes, 95% piores
» O melhor teve um delta de 5%, a média foi 17%, o pior foi 45%
Comparado com todos os dispositivos testados
» 1% de todos os dispositivos testados foram melhores, 0% semelhantes, 99% piores
» O melhor teve um delta de 4%, a média foi 23%, o pior foi 134%
Dell XPS 15 2018 i5 FHD 97Wh análise de áudio
(±) | o volume do alto-falante é médio, mas bom (###valor### dB)
Graves 100 - 315Hz
(±) | graves reduzidos - em média 10.9% menor que a mediana
(+) | o baixo é linear (4.9% delta para a frequência anterior)
Médios 400 - 2.000 Hz
(±) | médios mais altos - em média 6.8% maior que a mediana
(+) | médios são lineares (6.8% delta para frequência anterior)
Altos 2 - 16 kHz
(+) | agudos equilibrados - apenas 3.7% longe da mediana
(+) | os máximos são lineares (6.9% delta da frequência anterior)
Geral 100 - 16.000 Hz
(±) | a linearidade do som geral é média (16.6% diferença em relação à mediana)
Comparado com a mesma classe
» 44% de todos os dispositivos testados nesta classe foram melhores, 7% semelhantes, 50% piores
» O melhor teve um delta de 5%, a média foi 17%, o pior foi 45%
Comparado com todos os dispositivos testados
» 29% de todos os dispositivos testados foram melhores, 6% semelhantes, 65% piores
» O melhor teve um delta de 4%, a média foi 23%, o pior foi 134%
| desligado | |
| Ocioso | |
| Carga |
|
Key:
min: | |
| HP EliteBook 1050 G1-4QY20EA i7-8750H, GeForce GTX 1050 Max-Q, Toshiba XG5-P KXG50PNV2T04, IPS LED, 3840x2160, 15.6" | Dell XPS 15 9570 i7 UHD i7-8750H, GeForce GTX 1050 Ti Max-Q, Toshiba XG5 KXG50ZNV512G, IPS, 3840x2160, 15.6" | Apple MacBook Pro 15 2018 (2.6 GHz, 560X) i7-8850H, Radeon Pro 560X, Apple SSD AP0512, IPS, 2880x1800, 15.4" | HP ZBook Studio G4-Y6K17EA E3-1505M v6, Quadro M1200, Samsung SM961 MZVKW512HMJP m.2 PCI-e, IPS, 3840x2160, 15.6" | Lenovo ThinkPad P52 20MAS03N00 i7-8750H, Quadro P1000, Samsung SSD PM981 MZVLB512HAJQ, IPS LED, 1920x1080, 15.6" | Lenovo ThinkPad T580-20LAS01H00 i5-8550U, GeForce MX150, Samsung SSD PM981 MZVLB512HAJQ, IPS LED, 3840x2160, 15.6" | HP EliteBook 850 G5 3JX58EA i5-8250U, UHD Graphics 620, Toshiba XG5 KXG50ZNV256G, IPS LED, 1920x1080, 15.6" | Média NVIDIA GeForce GTX 1050 Max-Q | Média da turma Multimedia | |
|---|---|---|---|---|---|---|---|---|---|
| Power Consumption | -32% | 11% | -50% | 12% | 17% | 45% | 13% | 9% | |
| Idle Minimum * (Watt) | 6.1 | 9.48 -55% | 3.4 44% | 12.6 -107% | 4.02 34% | 5.3 13% | 2.7 56% | 4.48 ? 27% | 5.62 ? 8% |
| Idle Average * (Watt) | 10.2 | 16.1 -58% | 11 -8% | 17.1 -68% | 7.2 29% | 10.2 -0% | 8.1 21% | 9.58 ? 6% | 10.2 ? -0% |
| Idle Maximum * (Watt) | 13.4 | 16.9 -26% | 14.9 -11% | 19.3 -44% | 11.46 14% | 13.6 -1% | 10.1 25% | 11.6 ? 13% | 12.5 ? 7% |
| Load Average * (Watt) | 82 | 90.8 -11% | 78.9 4% | 88.3 -8% | 76.3 7% | 58.3 29% | 39 52% | 77.3 ? 6% | 65 ? 21% |
| Load Maximum * (Watt) | 122 | 134.4 -10% | 91.2 25% | 147.3 -21% | 154 -26% | 65.3 46% | 37.2 70% | 105.5 ? 14% | 111.9 ? 8% |
| Witcher 3 ultra * (Watt) | 74.8 | 74 | 47.8 |
* ... menor é melhor
| HP EliteBook 1050 G1-4QY20EA i7-8750H, GeForce GTX 1050 Max-Q, 96 Wh | Dell XPS 15 9570 i7 UHD i7-8750H, GeForce GTX 1050 Ti Max-Q, 97 Wh | Apple MacBook Pro 15 2018 (2.6 GHz, 560X) i7-8850H, Radeon Pro 560X, 83 Wh | Lenovo ThinkPad T580-20LAS01H00 i5-8550U, GeForce MX150, 105 Wh | HP ZBook Studio G4-Y6K17EA E3-1505M v6, Quadro M1200, 64 Wh | HP EliteBook 850 G5 3JX58EA i5-8250U, UHD Graphics 620, 56 Wh | Lenovo ThinkPad P52 20MAS03N00 i7-8750H, Quadro P1000, 96 Wh | Média da turma Multimedia | |
|---|---|---|---|---|---|---|---|---|
| Duração da bateria | -0% | 19% | 9% | -61% | 22% | 15% | 35% | |
| Reader / Idle (h) | 17.1 | 19.7 15% | 6.8 -60% | 17.8 4% | 25.3 48% | 24.9 ? 46% | ||
| H.264 (h) | 9.7 | 12.3 27% | 11.7 21% | 9.4 -3% | 10.5 8% | 12.2 26% | 16.8 ? 73% | |
| WiFi v1.3 (h) | 8.7 | 9.6 10% | 10.2 17% | 8.7 0% | 3.4 -61% | 9.3 7% | 10.6 22% | 12.3 ? 41% |
| Load (h) | 2.1 | 1.3 -38% | 2.6 24% | 0.8 -62% | 3.5 67% | 1.3 -38% | 1.645 ? -22% | |
| Witcher 3 ultra (h) | 1 | 1.5 |
Pro
Contra
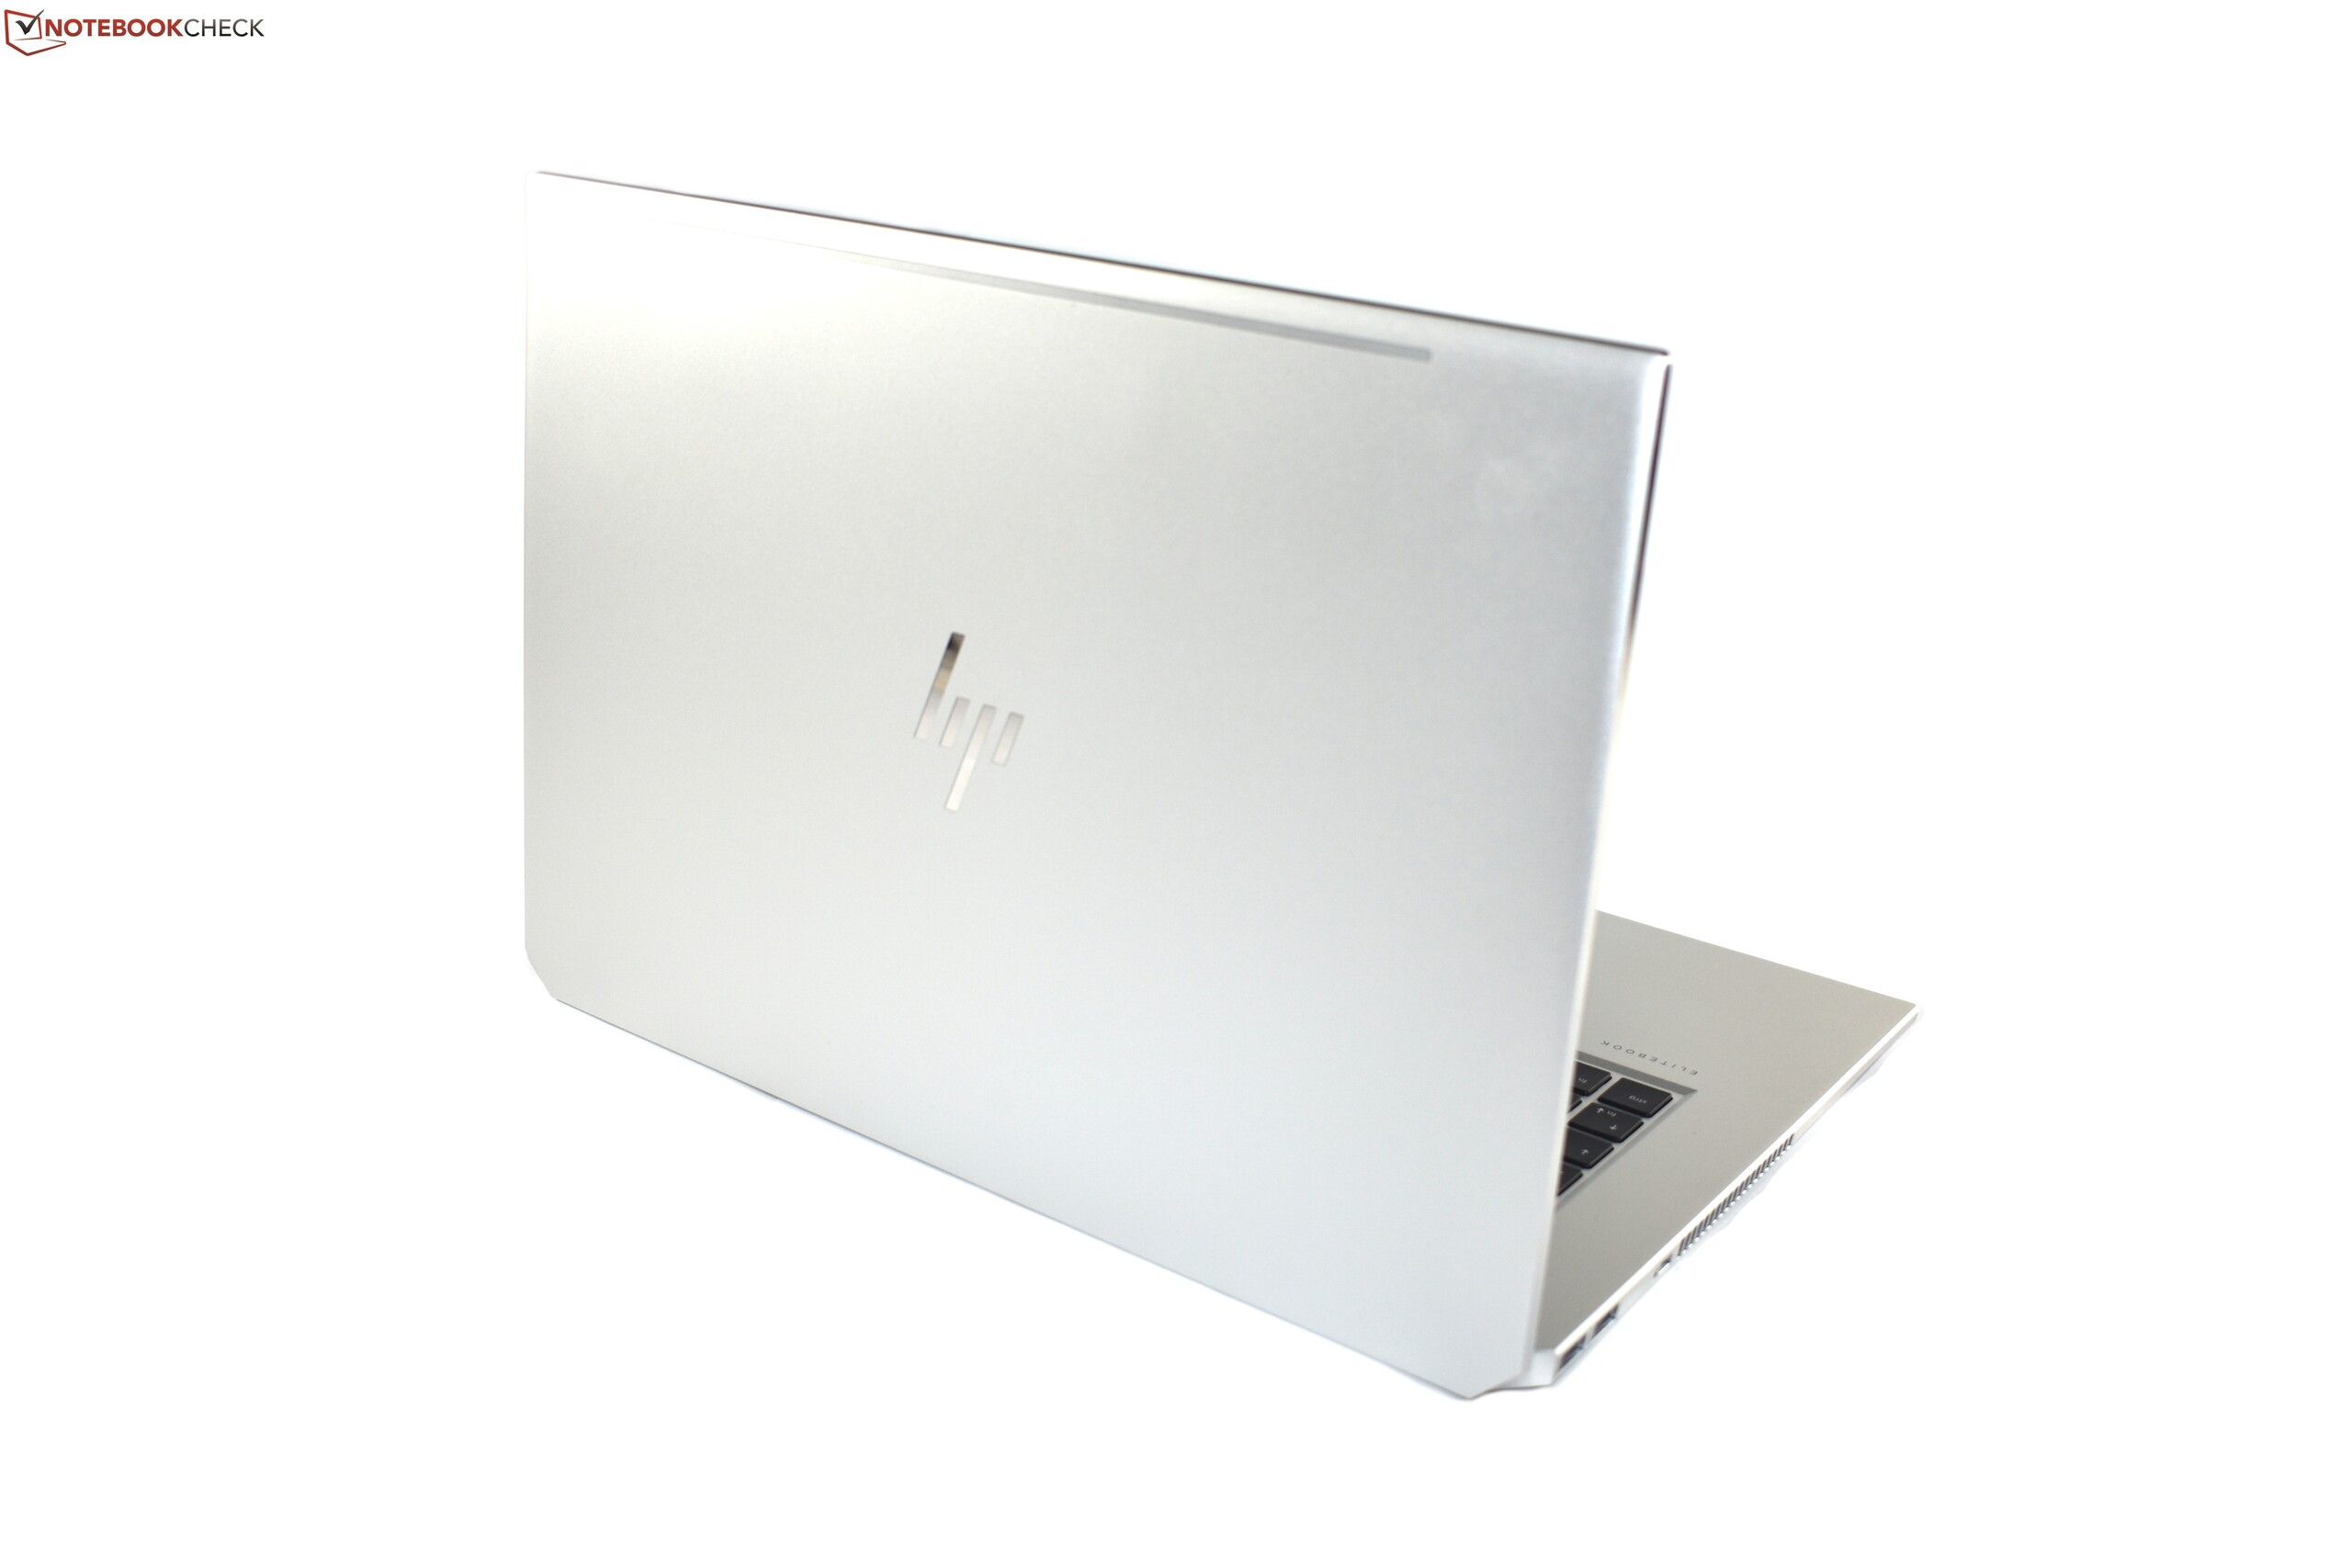
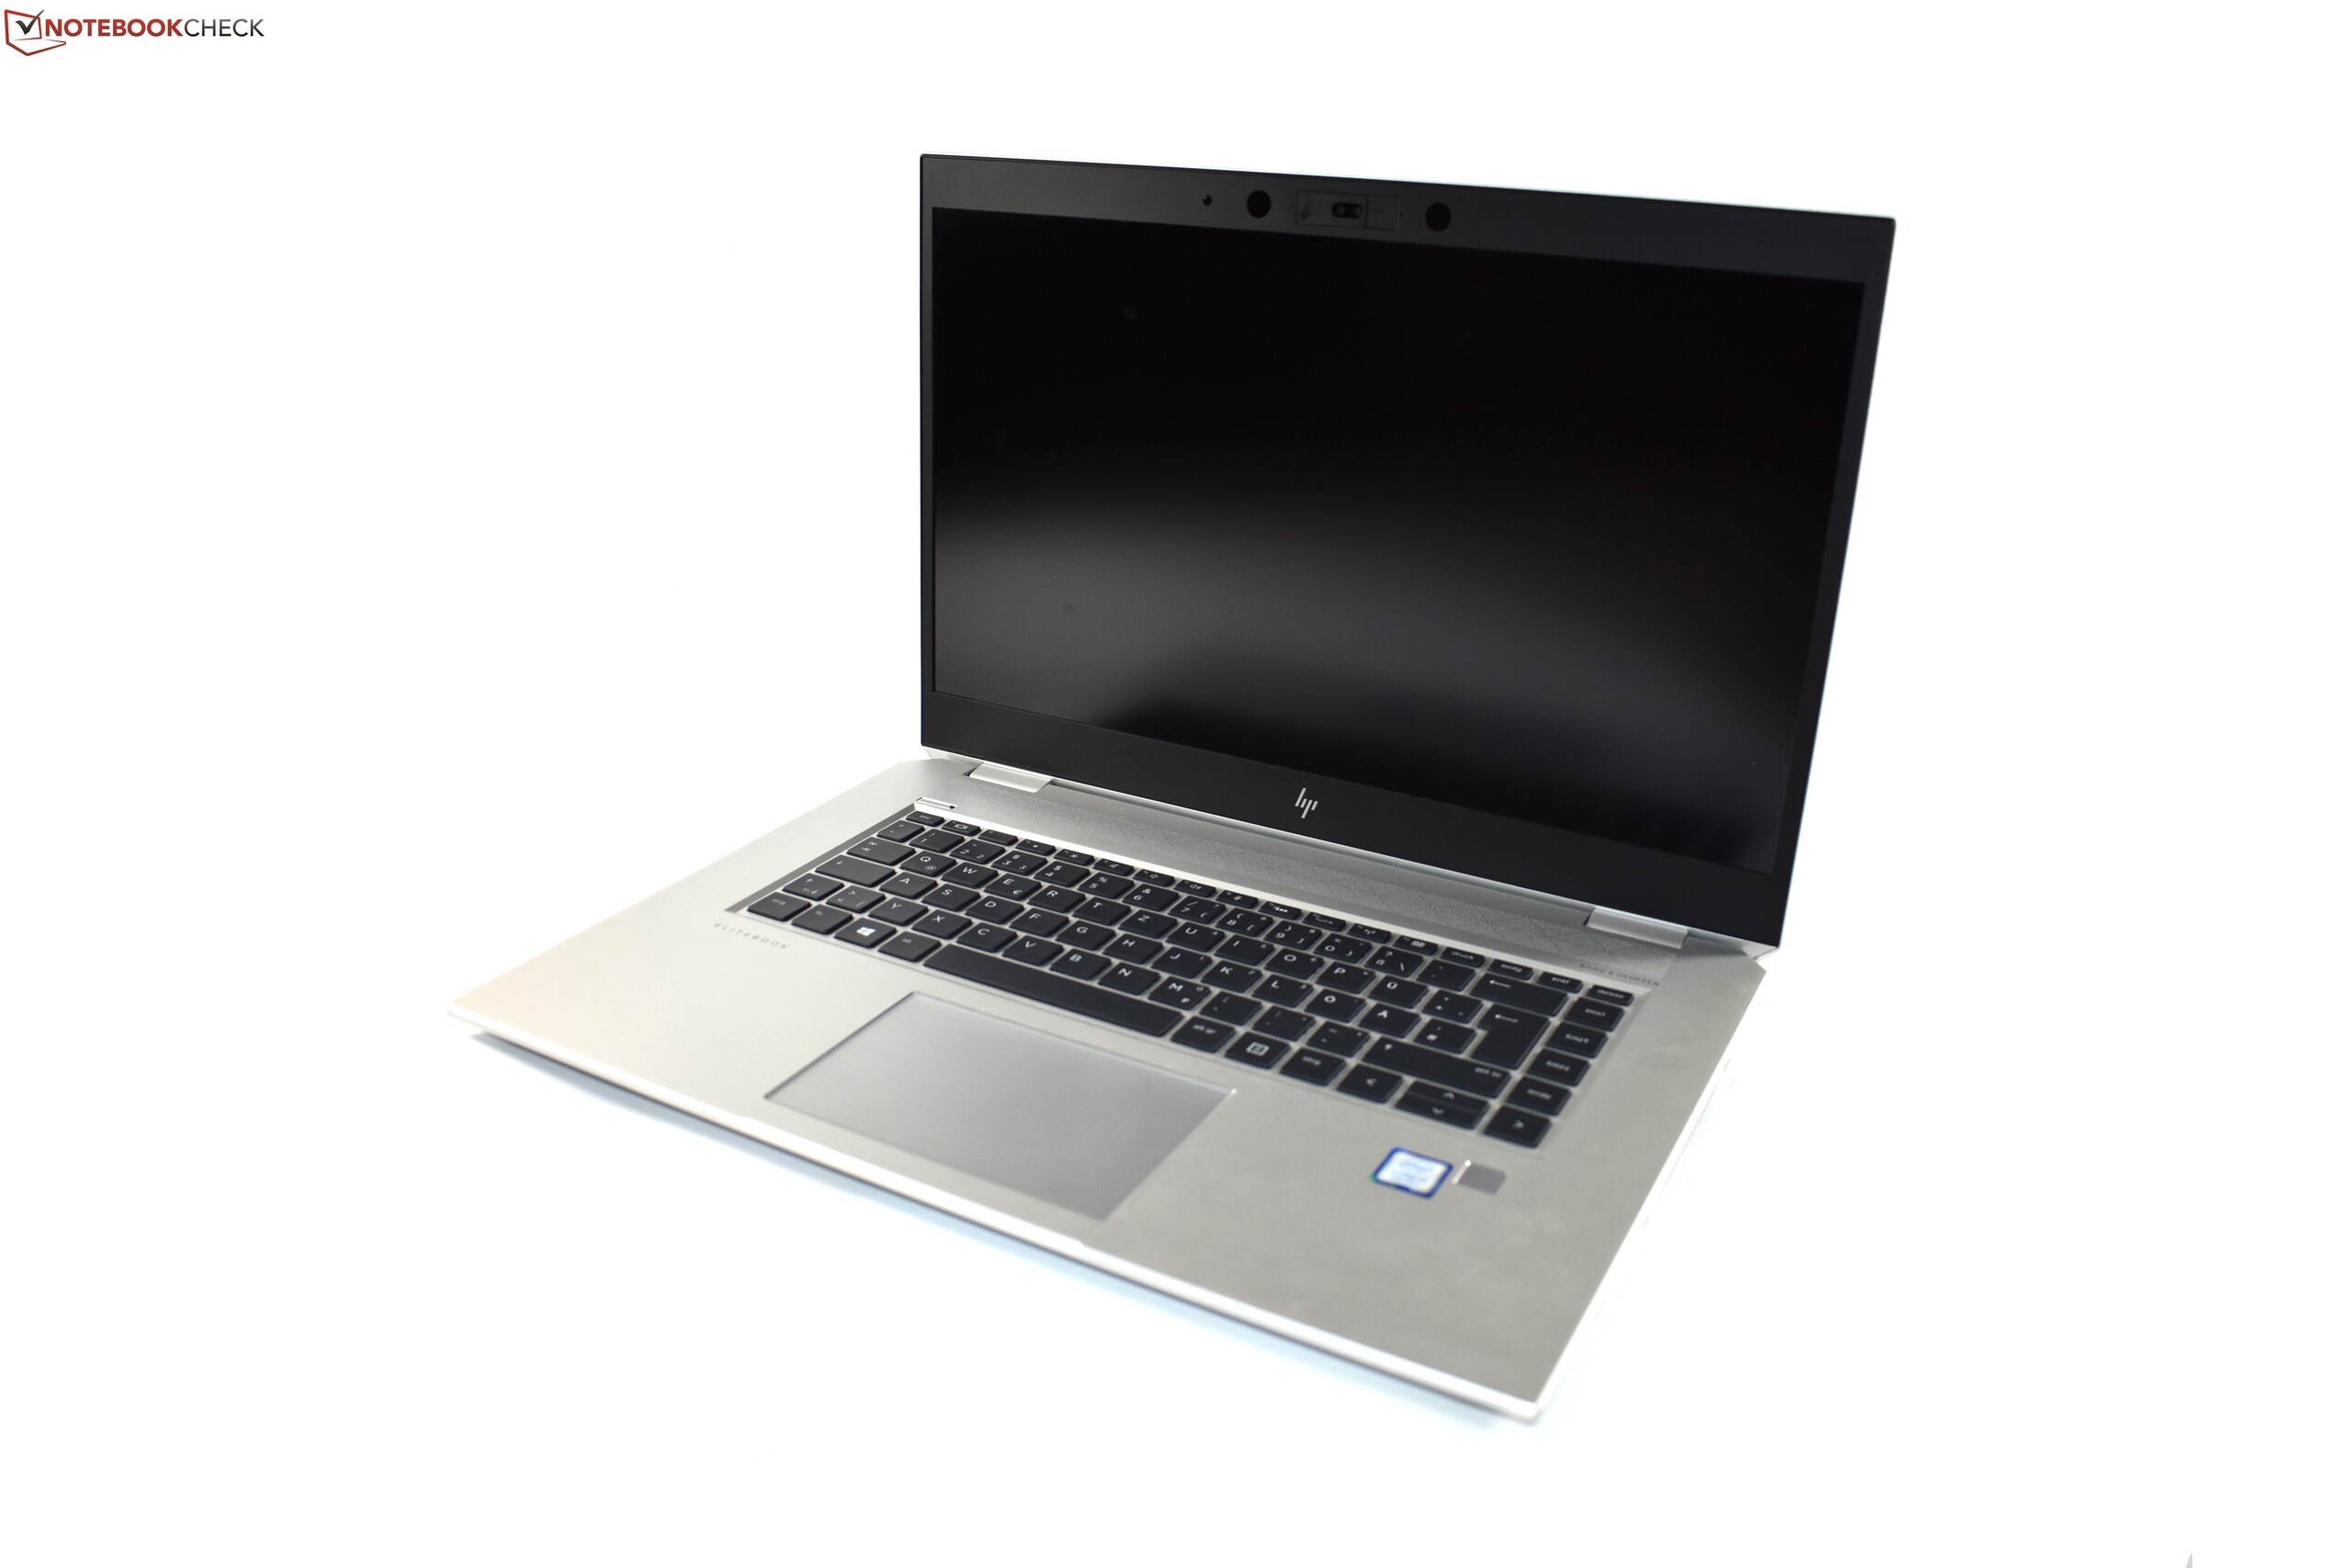
Modelos de portátil completamente novos sem um predecessor, como o HP EliteBook 1050 G1, são sempre interessantes. A HP teve sucesso com seu primeiro modelo multimídia real da série EliteBook, e será que é um concorrente digno para o Dell XPS 15?
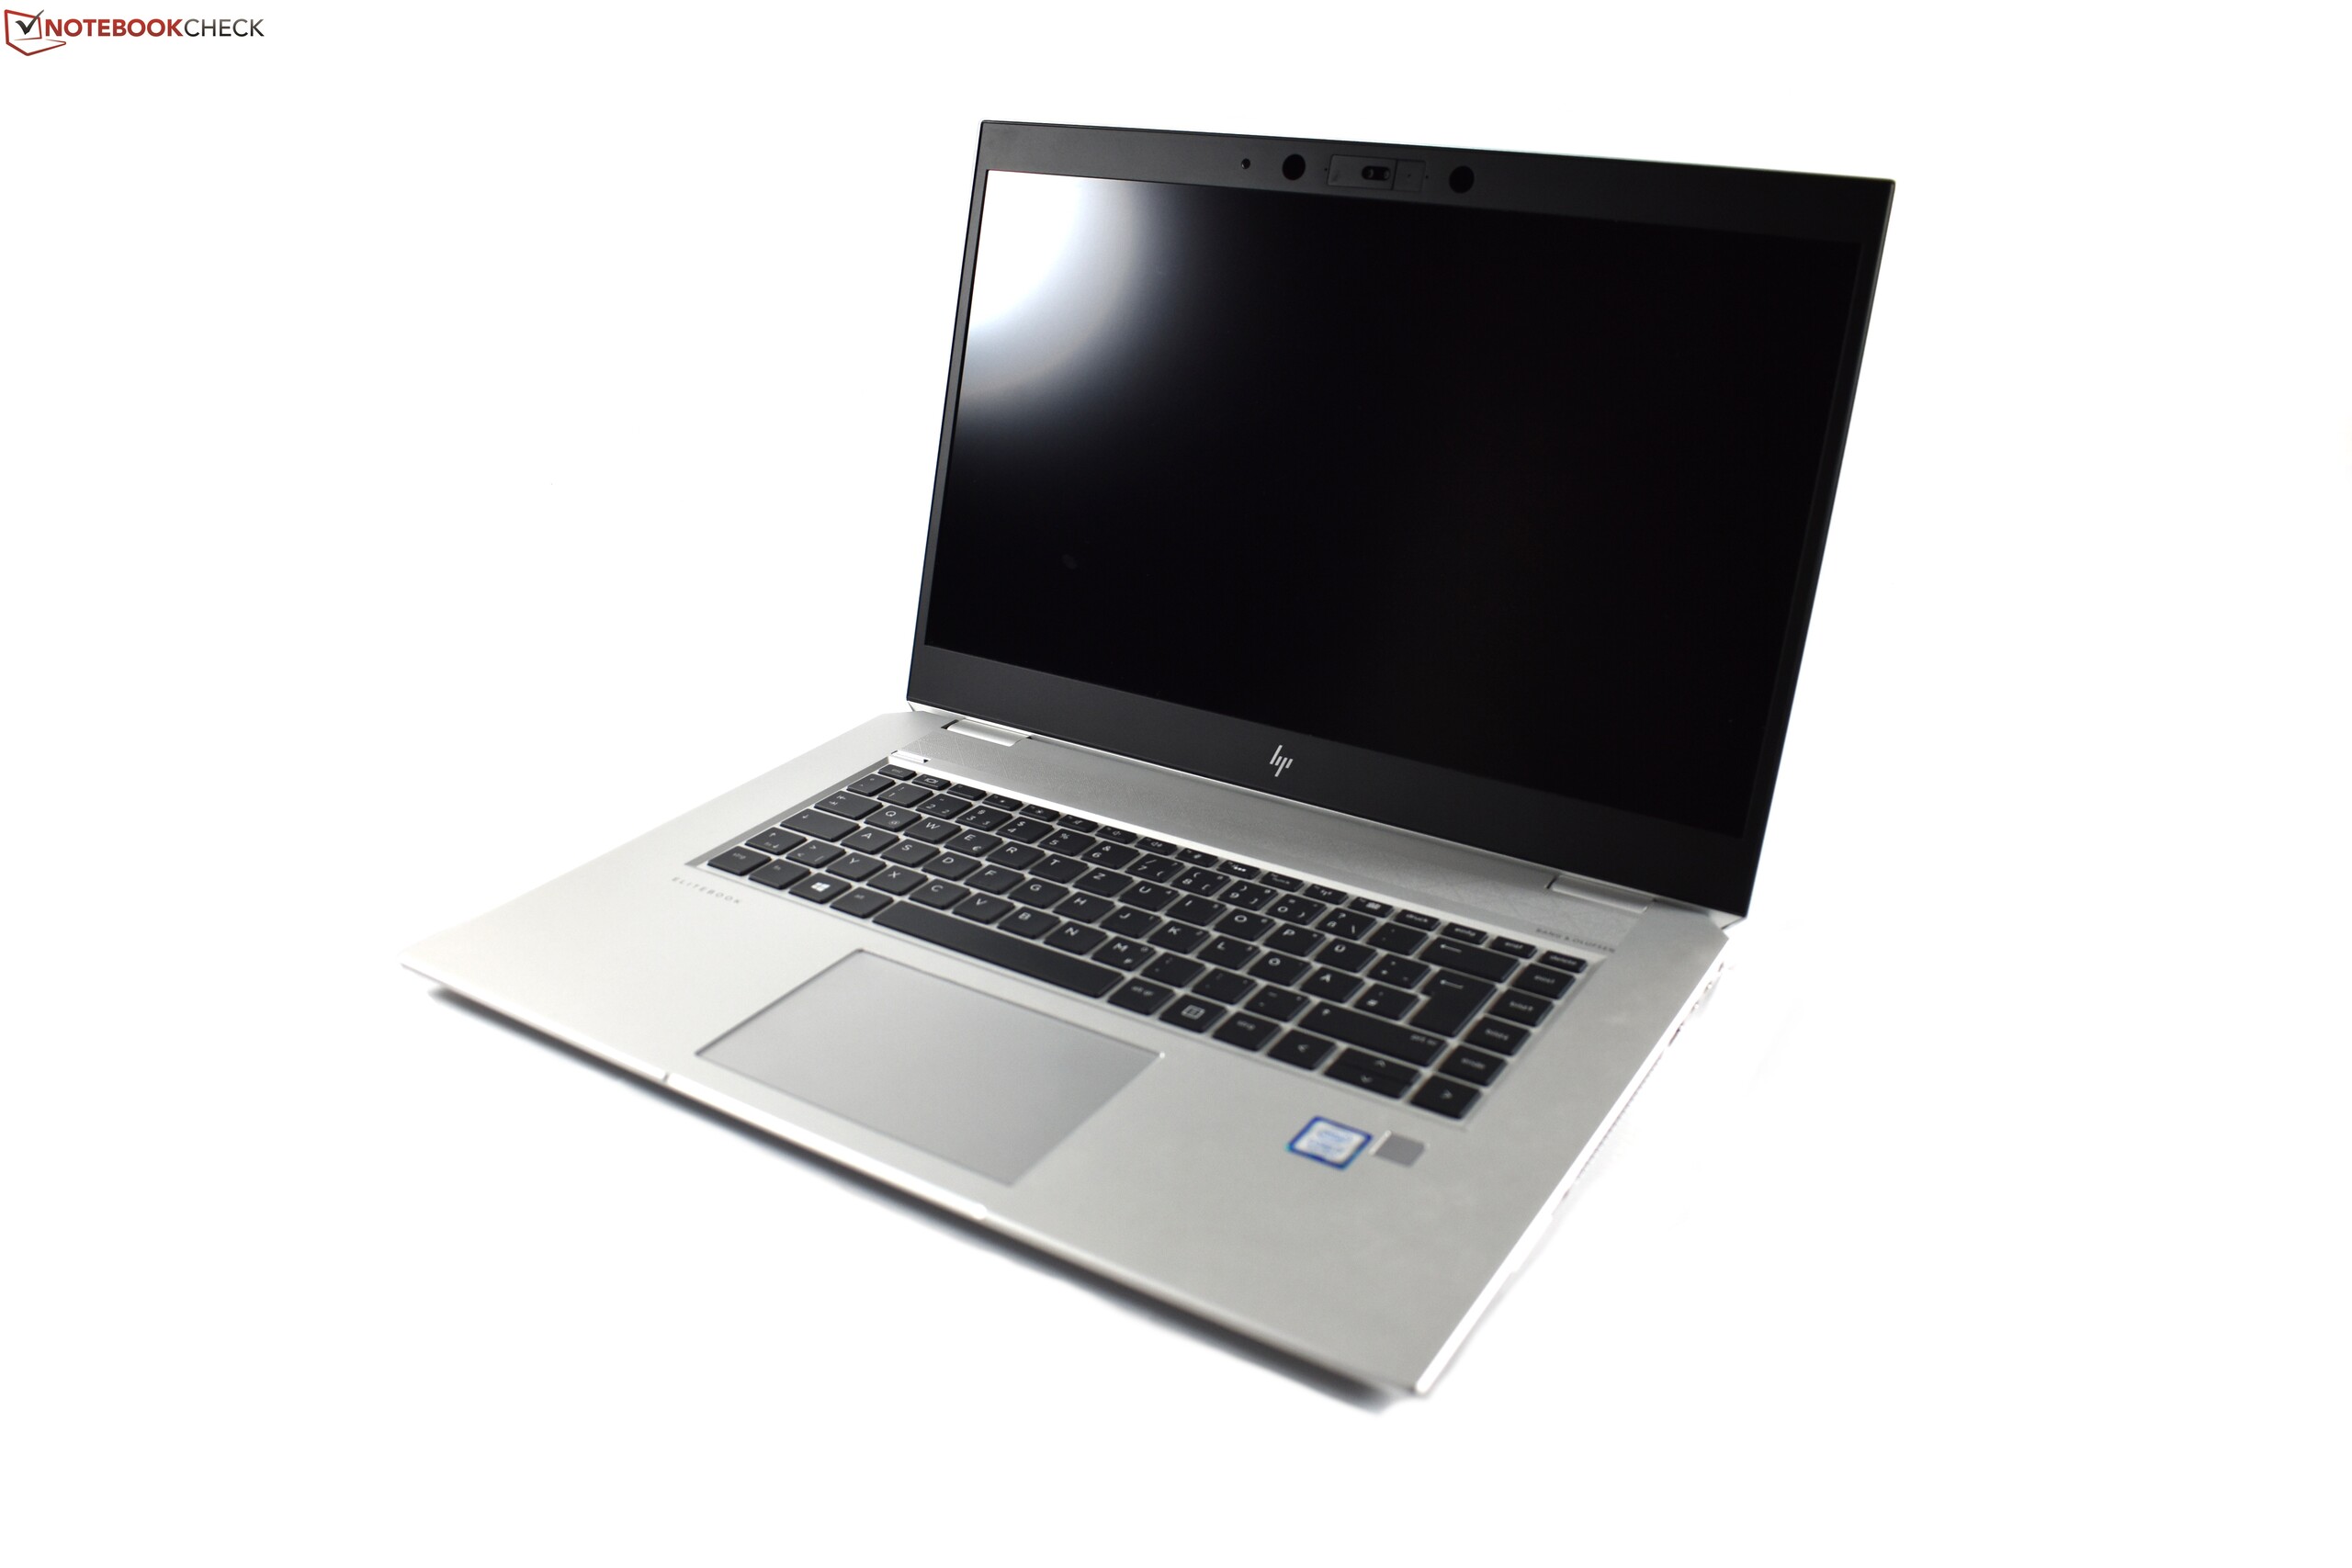
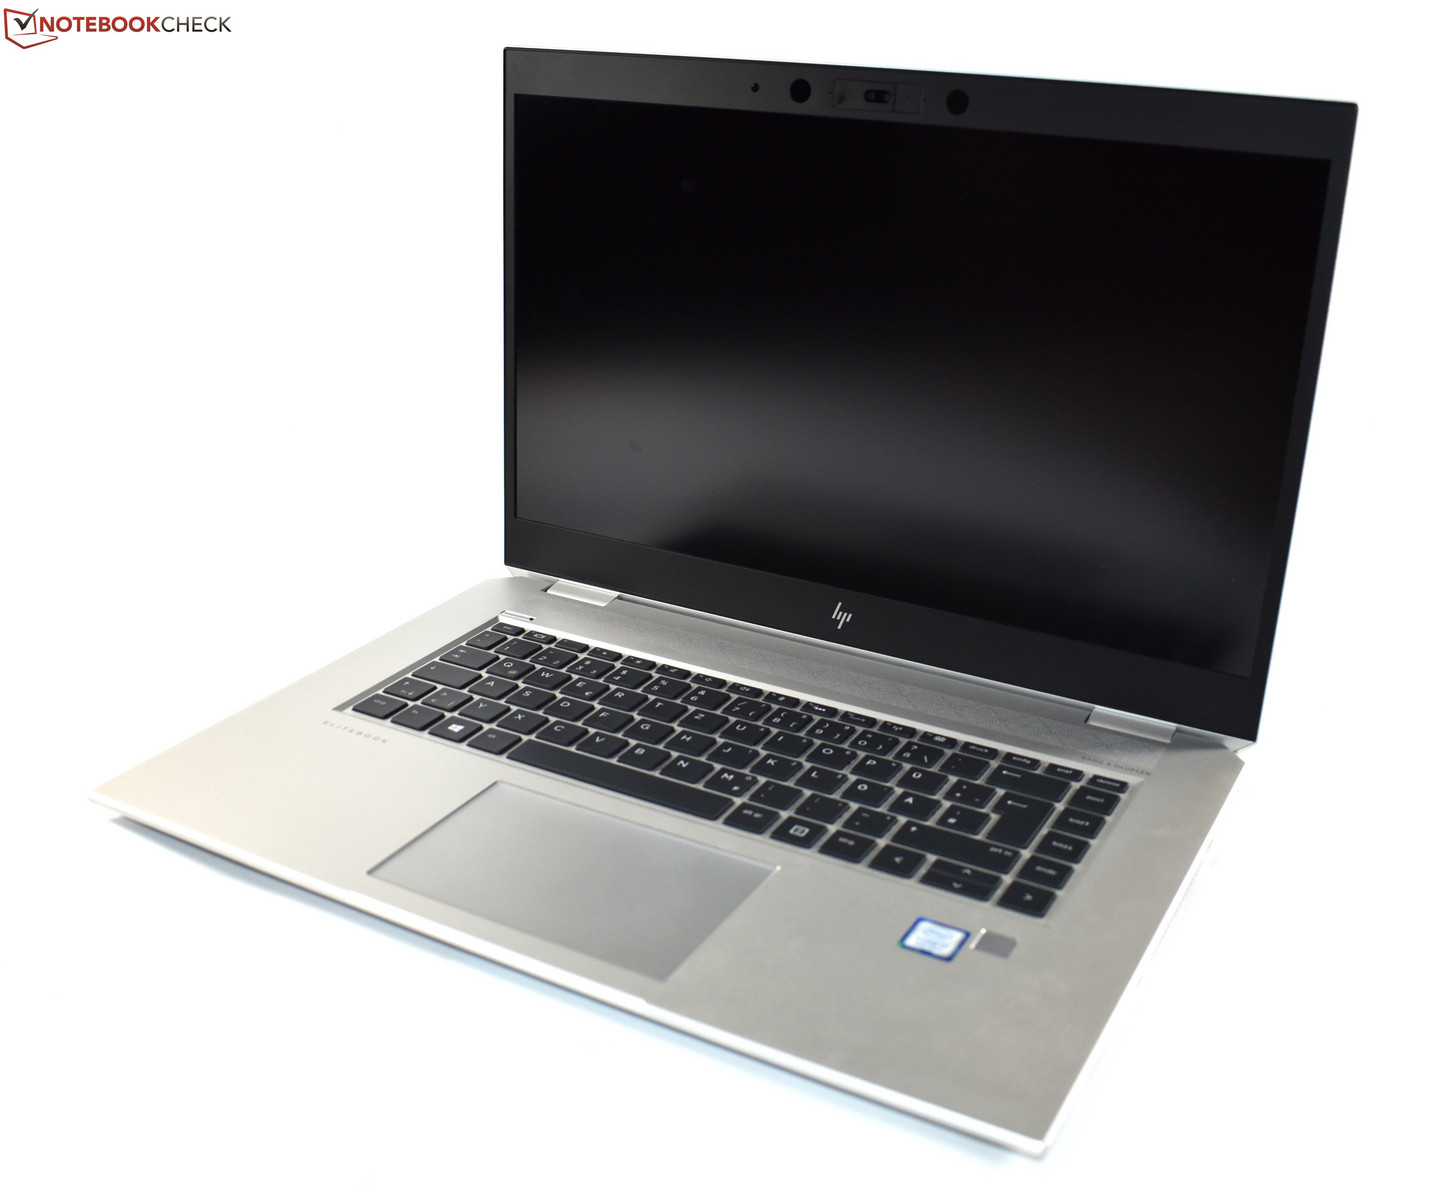
A HP definitivamente teve sucesso com a carcaça e o design do EliteBook 1050: qualidade extremamente alta, muito resistente e visualmente atraente - adequado para a faixa de preço. Também não há nada que reclamar dos dispositivos de entrada. A HP usa um touchpad de vidro que pode ser operado de forma confortável e um bom teclado (mesmo que não seja perfeito). Quanto à tela, a HP oferece um LCD UHD 4K, que é uma opção que nenhum dos concorrentes pode oferecer. Esta tela também possui bons valores de brilho de quase 400 cd / m². O equipamento de conexão é sólido e significativamente mais extenso do que, por exemplo, no Apple MacBook Air 15. Embora a webcam não seja melhor que a do Dell XPS 15, pelo menos está posicionada corretamente acima do monitor. Ele também oferece mais funções com sua abertura de privacidade e sensores infravermelhos. Graças a um segundo slot M.2-2280, o EliteBook 1050 G1 também é mais expansível do que o Dell XPS 15. Além disso, o EliteBook permanece significativamente mais frio em comparação, e também possui bons alto-falantes (para um portátil).
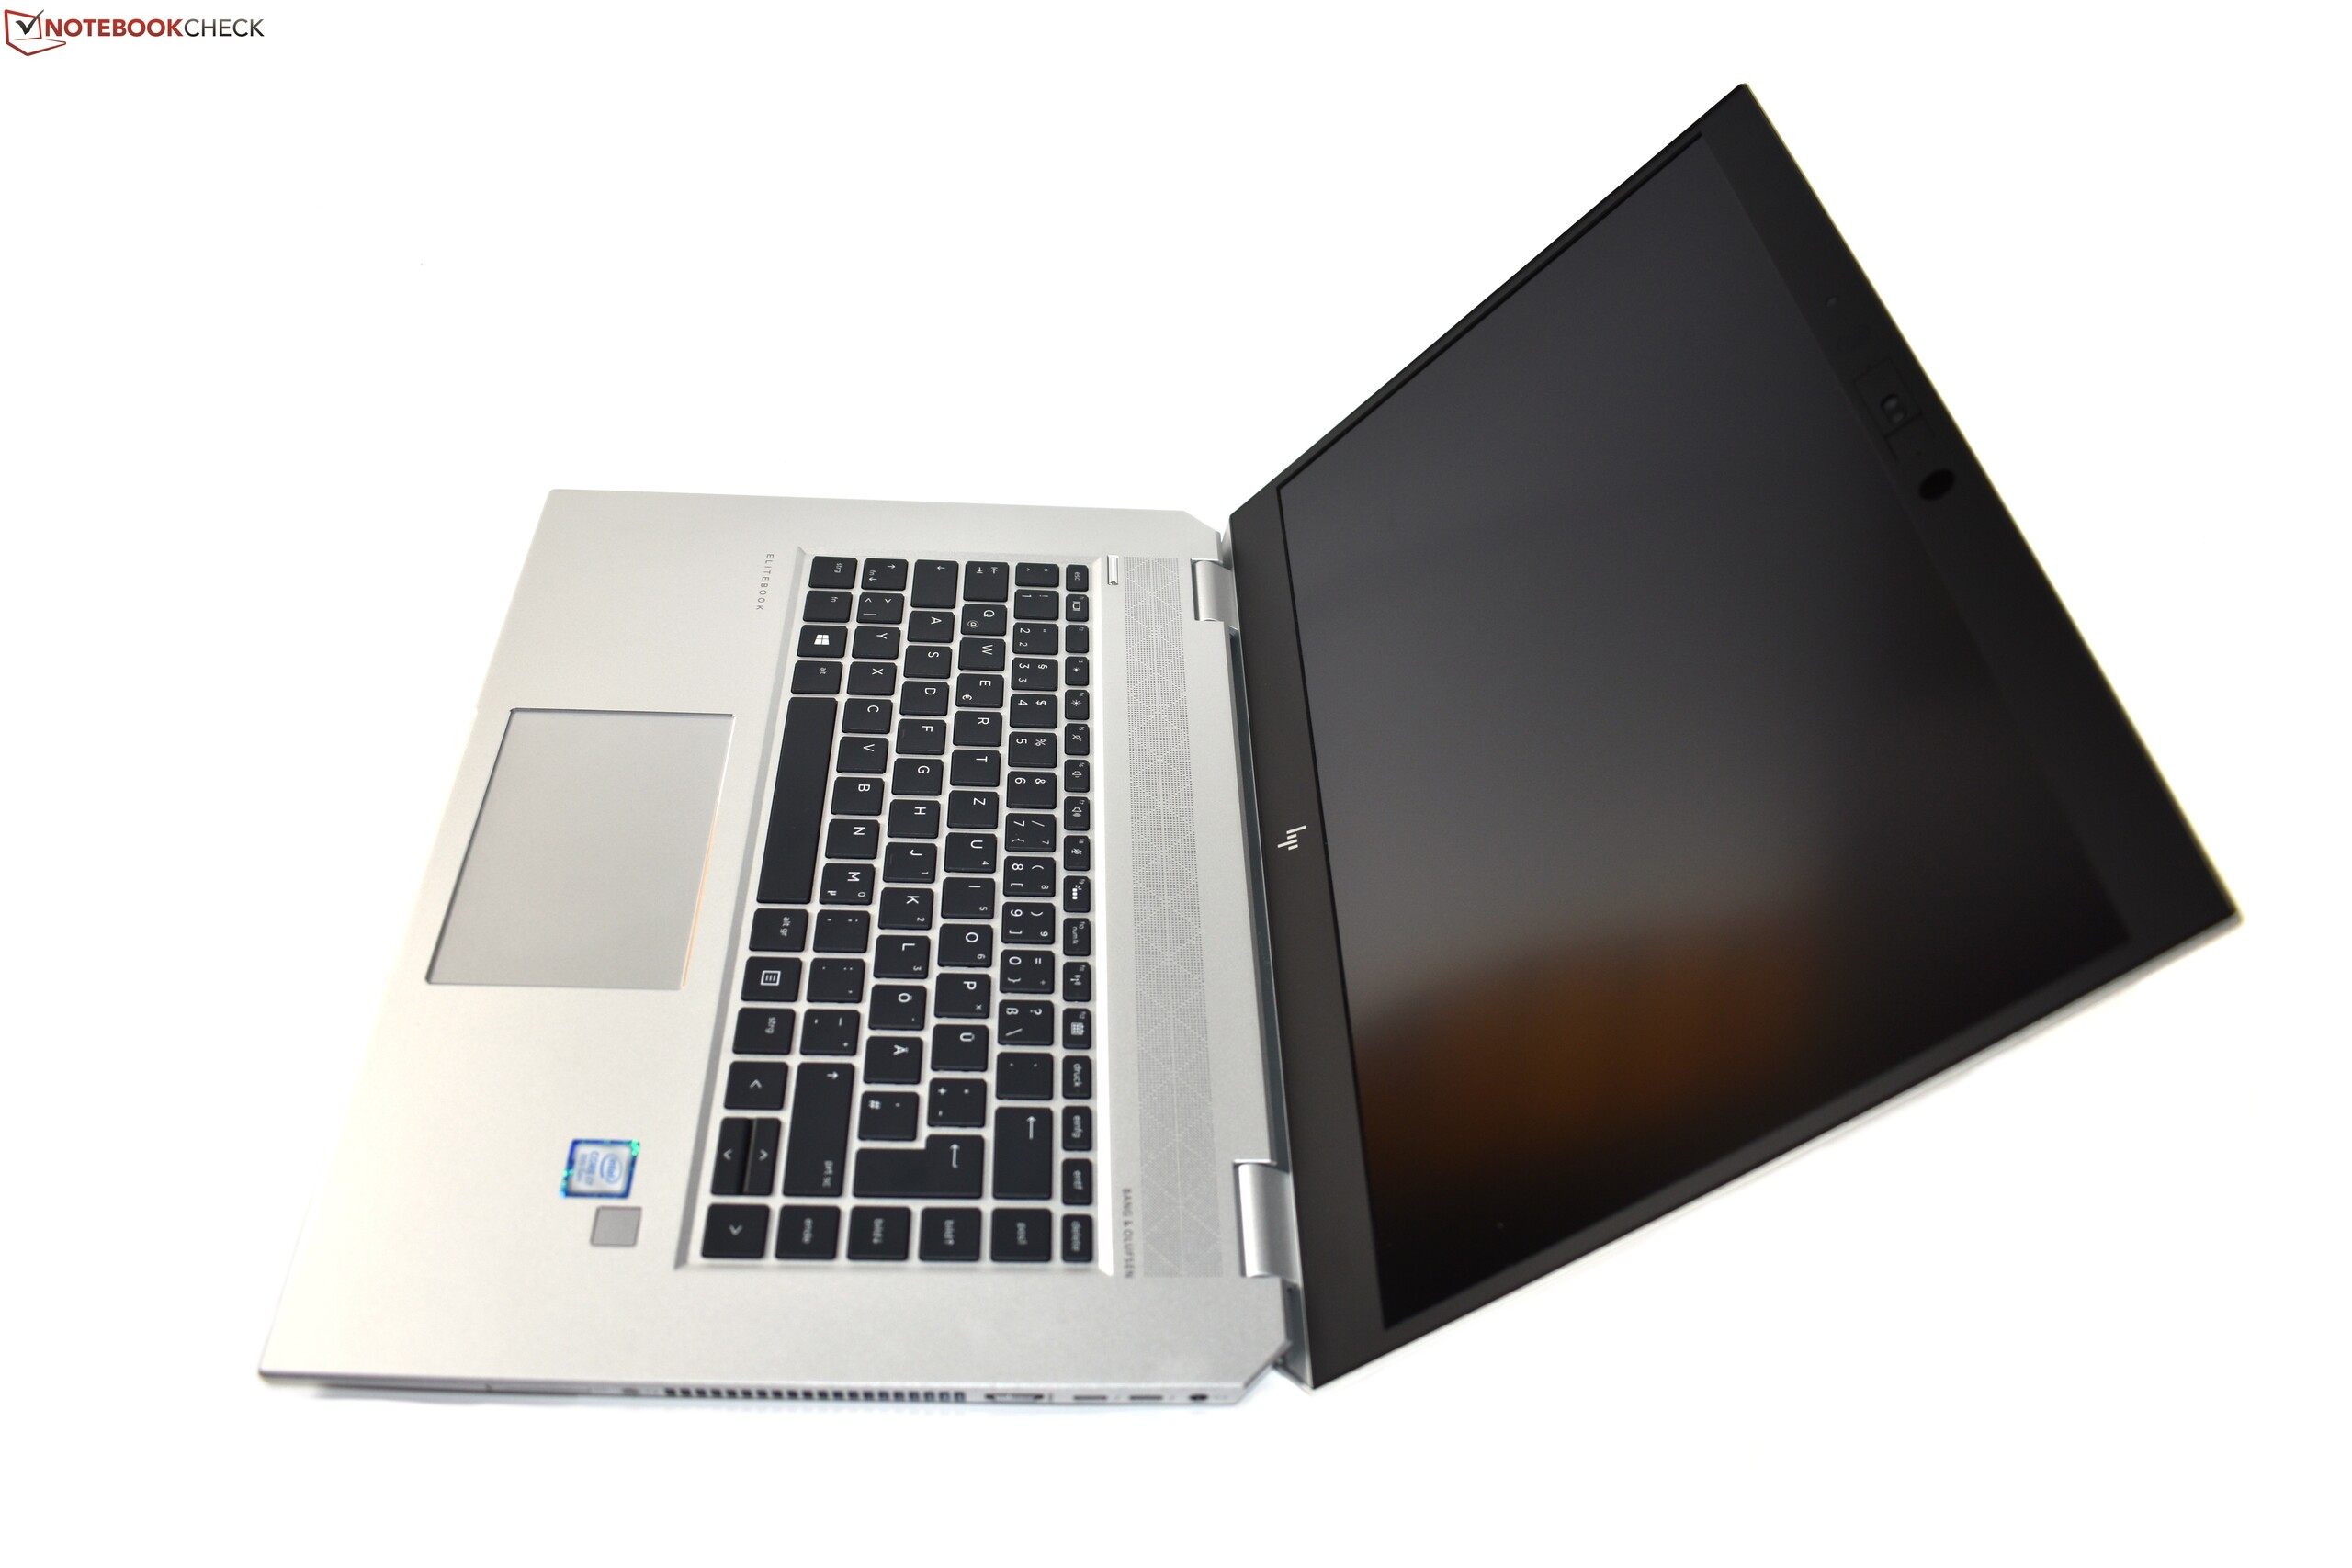
No entanto, isso é suficiente para enfrentar os concorrentes? Provavelmente não, dado que o EliteBook 1050 G1 não só é consideravelmente mais caro, mas também tem alguns pontos fracos. Estes incluem, por exemplo, o fato de que, embora a carcaça seja bastante resistente, ela também é relativamente pesada e há grandes marcos acima e abaixo da tela. O EliteBook 1050 G1 não é apenas o modelo mais pesado da sua classe, também não é tão compacto como o Dell XPS 15. Além disso, seu desempenho geral é mais baixo que o do concorrente da Dell: Embora o GeForce GTX 1050 Max-Q em combinação com o processador hexacore da Intel o torna basicamente apto para jogos, o Nvidia GeForce GTX 1050 Ti Max-Q no Dell XPS 15é notoriamente mais rápido. Além disso, o EliteBook é significativamente afogado no teste de estresse - a desvantagem de manter as temperaturas baixas. Também não gostamos do nível de ruído do EliteBook. O ventilador funciona muito frequentemente e com um ruído de frequência muito alta, e é relativamente barulhento; há também alguns ruídos de bobina no topo, e os ventiladores sopram o ar quente nas mãos dos usuários do mouse, devido ao posicionamento não ideal das aberturas de ventilação.
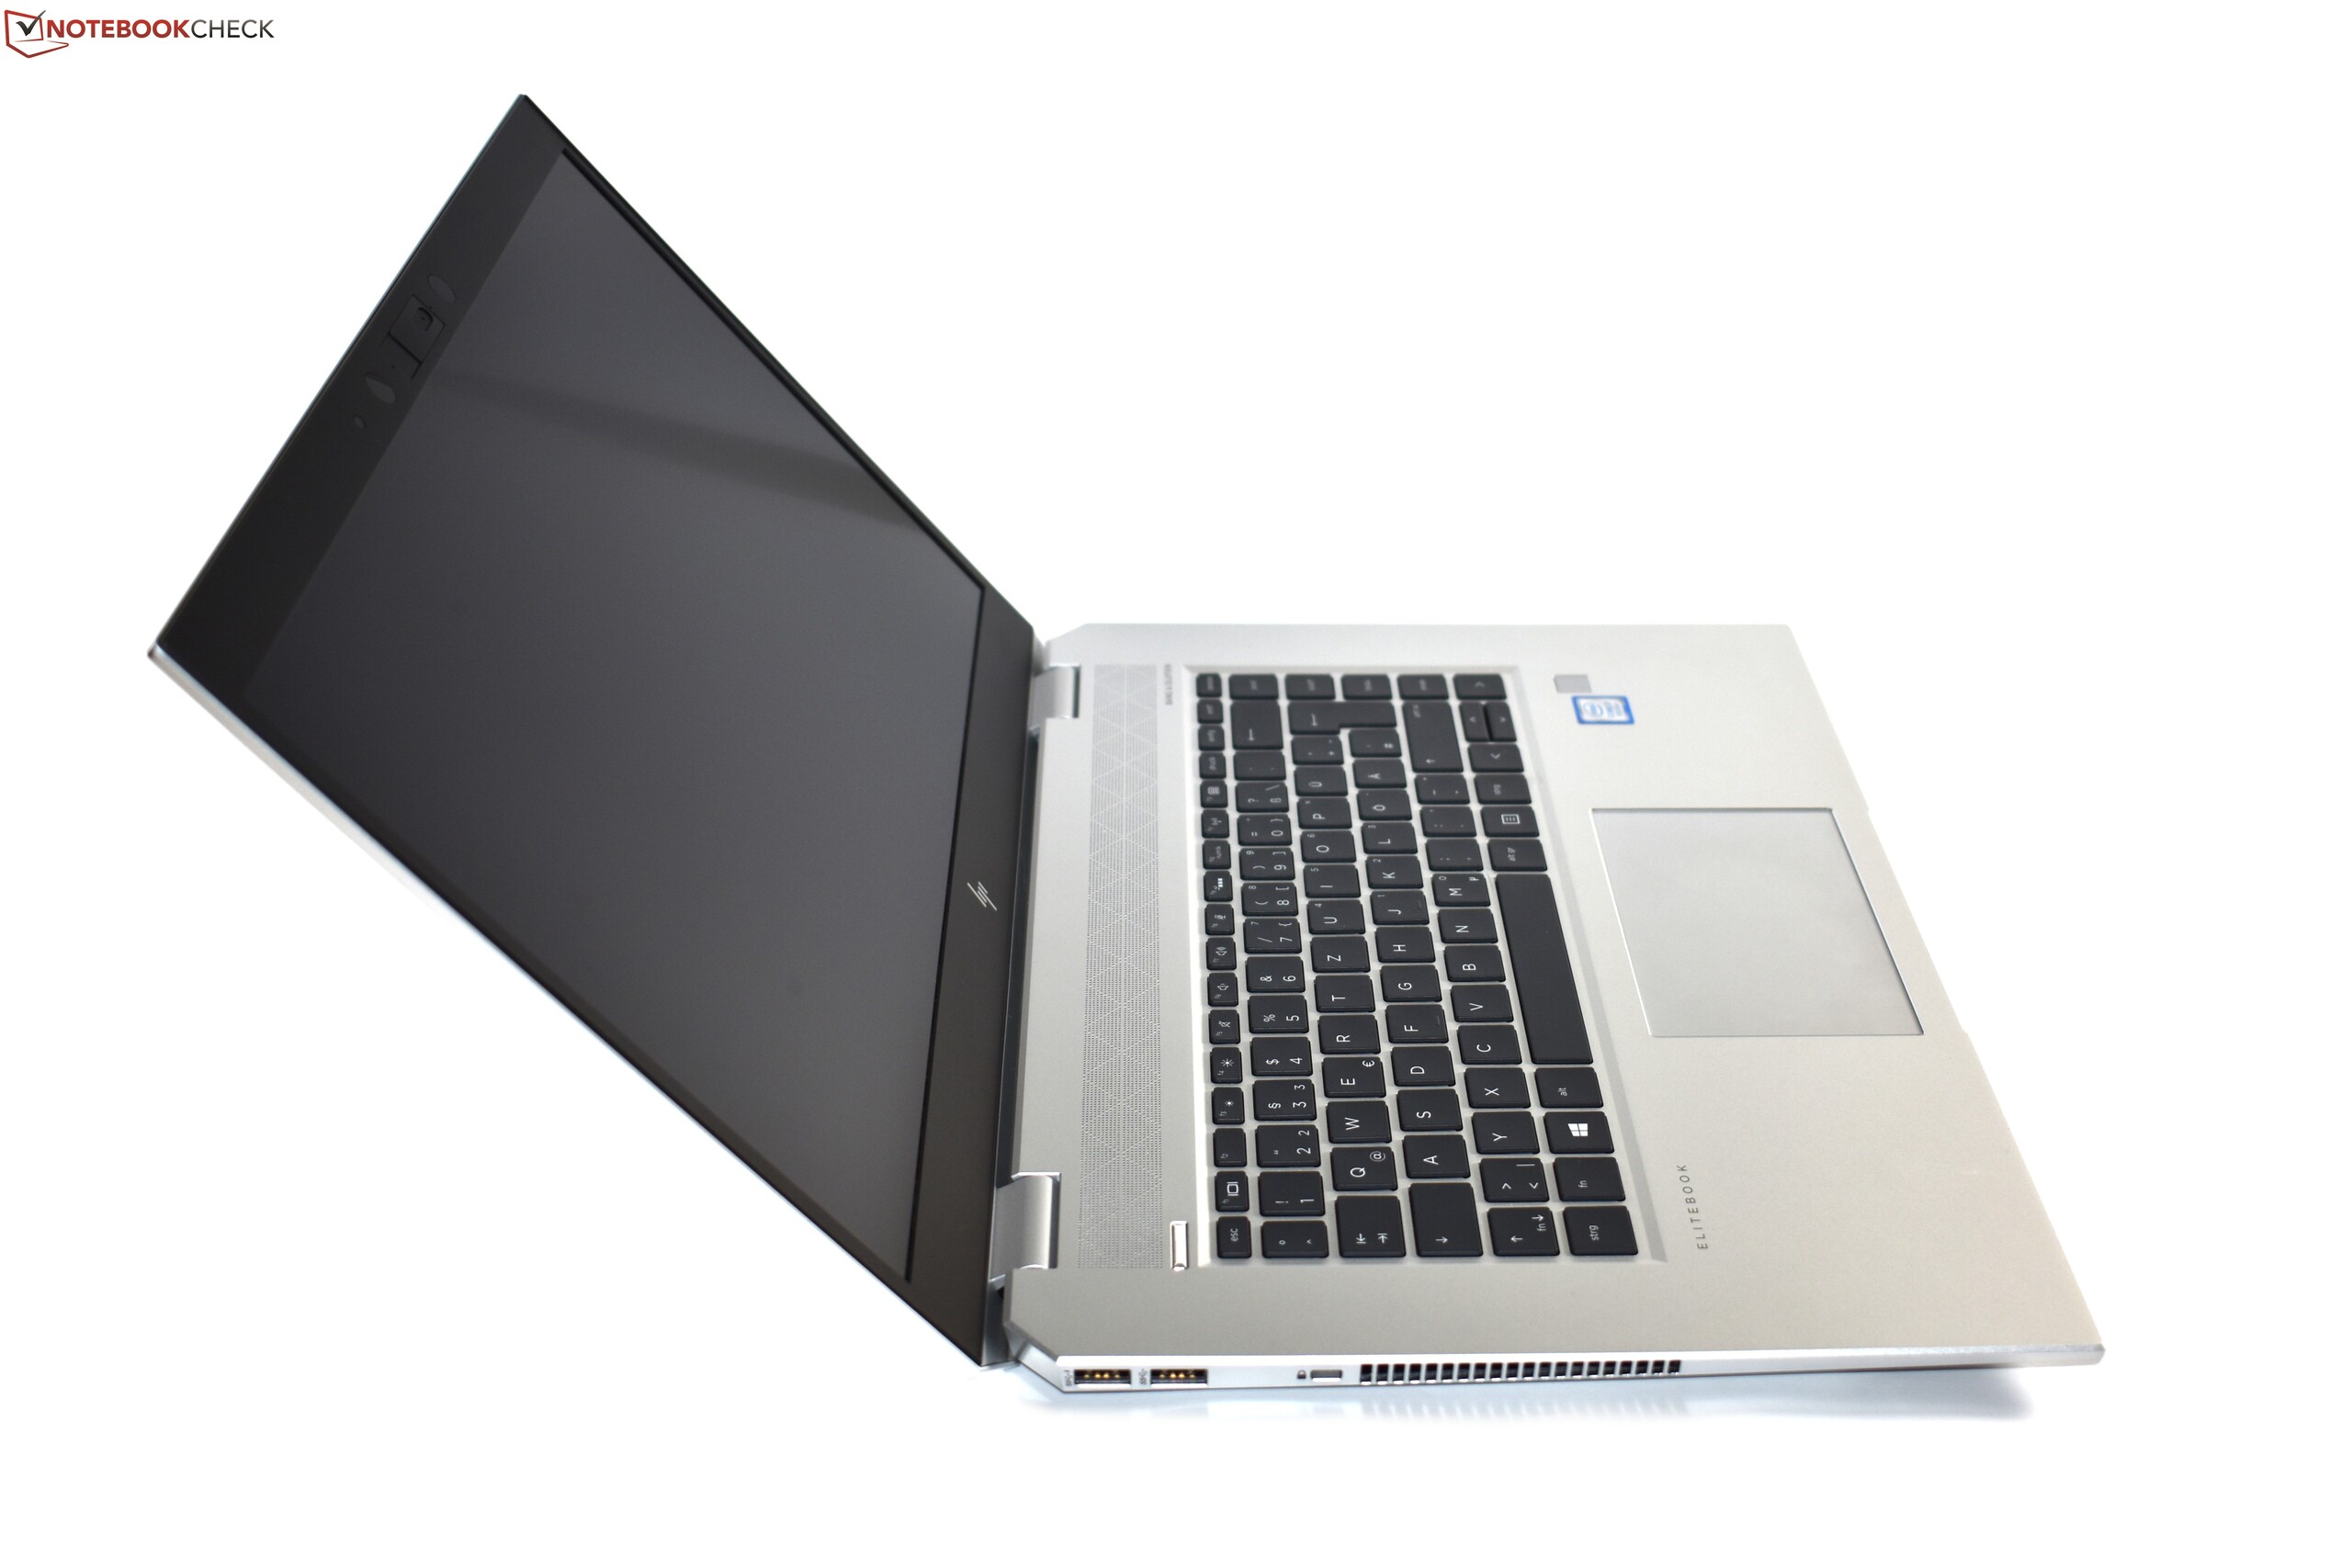
Também temos algumas reclamações sobre a tela, como a distribuição de brilho que é bastante desigual. Mas o que é mais sério é que a HP retém a tela DreamColor 4K-UHD consideravelmente mais brilhante e vibrante do EliteBook 1050 G1, apesar de ser oferecida no HP ZBook Studio G5, equipado de forma idêntica. Esta decisão é incompreensível para um portátil tão caro. No geral, também gostaríamos de ter mais recursos empresariais, como um PointStick, um leitor de cartões smart, ou Ethernet. Esta é uma chance perdida de transformar o EliteBook 1050 G1 em um verdadeiro poli funcional empresarial.
Muito bom às vezes não é bom o suficiente: O HP EliteBook 1050 G1 é um portátil multimídia empresarial de alta qualidade que, no entanto, é inferior ao Dell XPS 15 em geral.
Finalmente, o HP EliteBook 1050 G1 consegue um resultado muito bom de 89% em nossa avaliação. Embora isso possa parecer surpreendente à primeira vista, considerando nossas reclamações, é claro que nossos pontos críticos estão em um nível alto. Afinal, o preço é correspondentemente alto e os concorrentes são muito fortes. O Apple MacBook Pro 15 2018 alcança uma avaliação de 90% e o Dell XPS 15 9570 alcança até 92% – e isso como uma variante mais acessível. Enquanto o HP EliteBook 1050 G1 recebe nossa recomendação, não há muitas razões claras para preferi-lo sobre os concorrentes. O Dell XPS 15, em particular, oferece simplesmente uma melhor relação preço-desempenho. Então, enquanto a Dell não precisa temer o EliteBook, pode se tornar interessante nesta categoria, já que o Lenovo ThinkPad X1 Extreme alcançará o mercado em breve. A nossa próxima análise provavelmente irá dizer se ele pode se tornar mais perigoso para o XPS 15.
HP EliteBook 1050 G1-4QY20EA
- 10/25/2019 v7 (old)
Benjamin Herzig