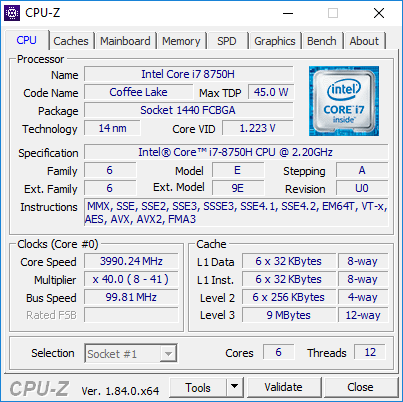
Breve Análise do Workstation Lenovo ThinkPad P52 (i7, P1000, FHD)
| SD Card Reader | |
| average JPG Copy Test (av. of 3 runs) | |
| HP ZBook 15 G4-Y4E80AV (Toshiba Exceria Pro SDXC 64 GB UHS-II) | |
| Lenovo ThinkPad P52 20MAS03N00 (Toshiba Exceria Pro SDXC 64 GB UHS-II) | |
| Dell Precision 5520 UHD (Toshiba Exceria Pro SDXC 64 GB UHS-II) | |
| Lenovo ThinkPad P51 20HH0016GE (Toshiba Exceria Pro SDXC 64 GB UHS-II) | |
| Média da turma Workstation (49.6 - 681, n=14, últimos 2 anos) | |
| Dell Precision 7510 (4K IGZO) | |
| Lenovo ThinkPad P52s-20LB000HGE (Toshiba Exceria Pro SDXC 64 GB UHS-II) | |
| maximum AS SSD Seq Read Test (1GB) | |
| Dell Precision 5520 UHD (Toshiba Exceria Pro SDXC 64 GB UHS-II) | |
| Média da turma Workstation (87.6 - 1455, n=14, últimos 2 anos) | |
| Lenovo ThinkPad P51 20HH0016GE (Toshiba Exceria Pro SDXC 64 GB UHS-II) | |
| HP ZBook 15 G4-Y4E80AV (Toshiba Exceria Pro SDXC 64 GB UHS-II) | |
| Lenovo ThinkPad P52 20MAS03N00 (Toshiba Exceria Pro SDXC 64 GB UHS-II) | |
| Lenovo ThinkPad P52s-20LB000HGE (Toshiba Exceria Pro SDXC 64 GB UHS-II) | |
| |||||||||||||||||||||||||
iluminação: 88 %
iluminação com acumulador: 307 cd/m²
Contraste: 1169:1 (Preto: 0.26 cd/m²)
ΔE ColorChecker Calman: 4.5 | ∀{0.5-29.43 Ø4.73}
calibrated: 2.4
ΔE Greyscale Calman: 5.2 | ∀{0.09-98 Ø4.97}
90.1% sRGB (Argyll 1.6.3 3D)
53.8% AdobeRGB 1998 (Argyll 1.6.3 3D)
65.9% AdobeRGB 1998 (Argyll 3D)
90.3% sRGB (Argyll 3D)
65.6% Display P3 (Argyll 3D)
Gamma: 2.26
CCT: 6789 K
| Lenovo ThinkPad P52 20MAS03N00 N156HCE-EN1, , 1920x1080, 15.6" | Lenovo ThinkPad P50 LP156WF6-SPK1, , 1920x1080, 15.6" | Lenovo ThinkPad P51 20HH0016GE LEN40BD, B156ZAN02.1, , 3840x2160, 15.6" | HP ZBook 15 G4-Y4E80AV LG Philips LGD057E, , 1920x1080, 15.6" | Dell Precision 7510 (4K IGZO) Sharp LQ156D1, , 3840x2160, 15.6" | Lenovo ThinkPad P52s-20LB000HGE NV156FHM-N47, , 1920x1080, 15.6" | HP ZBook 15u G5 2ZC05EA CMN15E7, , 1920x1080, 15.6" | Dell Precision 5520 UHD SHP1476, , 3840x2160, 15.6" | |
|---|---|---|---|---|---|---|---|---|
| Display | -38% | 31% | -6% | 30% | -34% | -31% | 6% | |
| Display P3 Coverage (%) | 65.6 | 39.13 -40% | 86.3 32% | 64 -2% | 86.2 31% | 41.83 -36% | 43.05 -34% | 67.4 3% |
| sRGB Coverage (%) | 90.3 | 58.5 -35% | 99.5 10% | 82.7 -8% | 99.7 10% | 62.1 -31% | 64.7 -28% | 98.5 9% |
| AdobeRGB 1998 Coverage (%) | 65.9 | 40.45 -39% | 99.3 51% | 60.4 -8% | 99 50% | 43.22 -34% | 44.5 -32% | 68.9 5% |
| Response Times | -9% | -1% | 1% | -5% | -34% | -9% | -56% | |
| Response Time Grey 50% / Grey 80% * (ms) | 39.2 ? | 46 ? -17% | 40.8 ? -4% | 39.2 ? -0% | 40.4 ? -3% | 47.2 ? -20% | 41.6 ? -6% | 59.2 ? -51% |
| Response Time Black / White * (ms) | 26 ? | 26 ? -0% | 25.2 ? 3% | 25.6 ? 2% | 27.6 ? -6% | 38.4 ? -48% | 28.8 ? -11% | 41.6 ? -60% |
| PWM Frequency (Hz) | 25250 ? | 20830 ? | 198.4 ? | 21550 ? | 25770 ? | |||
| Screen | -10% | 15% | 1% | 10% | -15% | -23% | 6% | |
| Brightness middle (cd/m²) | 304 | 263 -13% | 317 4% | 321 6% | 279.2 -8% | 291 -4% | 229 -25% | 372.4 22% |
| Brightness (cd/m²) | 293 | 236 -19% | 309 5% | 320 9% | 271 -8% | 284 -3% | 212 -28% | 368 26% |
| Brightness Distribution (%) | 88 | 78 -11% | 89 1% | 89 1% | 83 -6% | 91 3% | 88 0% | 90 2% |
| Black Level * (cd/m²) | 0.26 | 0.34 -31% | 0.36 -38% | 0.29 -12% | 0.266 -2% | 0.11 58% | 0.23 12% | 0.48 -85% |
| Contrast (:1) | 1169 | 774 -34% | 881 -25% | 1107 -5% | 1050 -10% | 2645 126% | 996 -15% | 776 -34% |
| Colorchecker dE 2000 * | 4.5 | 2.35 48% | 2.7 40% | 4.5 -0% | 4.14 8% | 6.7 -49% | 4.2 7% | 2.6 42% |
| Colorchecker dE 2000 max. * | 7.7 | 4.1 47% | 9.5 -23% | 6.56 15% | 20.2 -162% | 18 -134% | 5.6 27% | |
| Colorchecker dE 2000 calibrated * | 2.4 | 4.5 -88% | 4.2 -75% | |||||
| Greyscale dE 2000 * | 5.2 | 3.33 36% | 3 42% | 2.9 44% | 3.26 37% | 4.5 13% | 2 62% | 3.7 29% |
| Gamma | 2.26 97% | 2.38 92% | 2.27 97% | 2.27 97% | 2.19 100% | 2.28 96% | 2.23 99% | 2.14 103% |
| CCT | 6789 96% | 6917 94% | 6077 107% | 6519 100% | 6375 102% | 7503 87% | 6292 103% | 7096 92% |
| Color Space (Percent of AdobeRGB 1998) (%) | 53.8 | 37 -31% | 87.6 63% | 54.2 1% | 85.68 59% | 39.6 -26% | 41 -24% | 63 17% |
| Color Space (Percent of sRGB) (%) | 90.1 | 58 -36% | 99.5 10% | 82.6 -8% | 99.72 11% | 61.7 -32% | 64.5 -28% | 99 10% |
| Média Total (Programa/Configurações) | -19% /
-16% | 15% /
16% | -1% /
-0% | 12% /
12% | -28% /
-21% | -21% /
-22% | -15% /
-3% |
* ... menor é melhor
Exibir tempos de resposta
| ↔ Tempo de resposta preto para branco | ||
|---|---|---|
| 26 ms ... ascensão ↗ e queda ↘ combinadas | ↗ 14.4 ms ascensão | 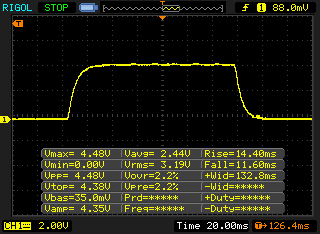 |
| ↘ 11.6 ms queda | ||
| A tela mostra taxas de resposta relativamente lentas em nossos testes e pode ser muito lenta para os jogadores. Em comparação, todos os dispositivos testados variam de 0.1 (mínimo) a 240 (máximo) ms. » 62 % de todos os dispositivos são melhores. Isso significa que o tempo de resposta medido é pior que a média de todos os dispositivos testados (19.9 ms). | ||
| ↔ Tempo de resposta 50% cinza a 80% cinza | ||
| 39.2 ms ... ascensão ↗ e queda ↘ combinadas | ↗ 21.2 ms ascensão | 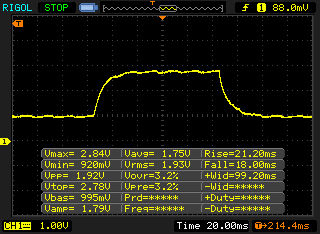 |
| ↘ 18 ms queda | ||
| A tela mostra taxas de resposta lentas em nossos testes e será insatisfatória para os jogadores. Em comparação, todos os dispositivos testados variam de 0.165 (mínimo) a 636 (máximo) ms. » 60 % de todos os dispositivos são melhores. Isso significa que o tempo de resposta medido é pior que a média de todos os dispositivos testados (31.1 ms). | ||
Cintilação da tela / PWM (modulação por largura de pulso)
| Tela tremeluzindo/PWM detectado | 25250 Hz | ≤ 50 % configuração de brilho | 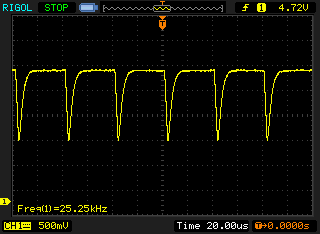 |
A luz de fundo da tela pisca em 25250 Hz (pior caso, por exemplo, utilizando PWM) Cintilação detectada em uma configuração de brilho de 50 % e abaixo. Não deve haver cintilação ou PWM acima desta configuração de brilho. A frequência de 25250 Hz é bastante alta, então a maioria dos usuários sensíveis ao PWM não deve notar nenhuma oscilação. [pwm_comparison] Em comparação: 52 % de todos os dispositivos testados não usam PWM para escurecer a tela. Se PWM foi detectado, uma média de 7784 (mínimo: 5 - máximo: 343500) Hz foi medida. | |||
| PCMark 8 Home Score Accelerated v2 | 3959 pontos | |
| PCMark 8 Work Score Accelerated v2 | 5329 pontos | |
| PCMark 10 Score | 4428 pontos | |
Ajuda | ||
| Lenovo ThinkPad P52 20MAS03N00 Samsung SSD PM981 MZVLB512HAJQ | Lenovo ThinkPad P50 Samsung SSD PM871 MZNLN256HCHP | Lenovo ThinkPad P51 20HH0016GE Samsung PM961 NVMe MZVLW512HMJP | HP ZBook 15 G4-Y4E80AV Samsung SSD SM961 1TB M.2 MZVKW1T0HMLH | Dell Precision 7510 (4K IGZO) Samsung SSD SM951a 512GB M.2 PCIe 3.0 x4 NVMe (MZVKV512) | Lenovo ThinkPad P52s-20LB000HGE Samsung PM961 MZVLW256HEHP | HP ZBook 15u G5 2ZC05EA Toshiba XG5 KXG50ZNV256G | Dell Precision 5520 UHD Samsung SM961 MZVKW512HMJP m.2 PCI-e | Média Samsung SSD PM981 MZVLB512HAJQ | |
|---|---|---|---|---|---|---|---|---|---|
| AS SSD | -56% | -1% | 11% | -14% | -17% | -52% | 3% | -19% | |
| Score Total (Points) | 4307 | 1070 -75% | 3424 -21% | 4303 0% | 2637 -39% | 3131 -27% | 1697 -61% | 3681 -15% | 3966 ? -8% |
| Score Write (Points) | 2079 | 374 -82% | 917 -56% | 1472 -29% | 669 -68% | 868 -58% | 710 -66% | 1379 -34% | 1780 ? -14% |
| Score Read (Points) | 1485 | 462 -69% | 1690 14% | 1902 28% | 1311 -12% | 1504 1% | 689 -54% | 1554 5% | 1451 ? -2% |
| Access Time Write * (ms) | 0.031 | 0.038 -23% | 0.025 19% | 0.023 26% | 0.025 19% | 0.026 16% | 0.051 -65% | 0.023 26% | 0.08337 ? -169% |
| Access Time Read * (ms) | 0.072 | 0.058 19% | 0.032 56% | 0.034 53% | 0.036 50% | 0.065 10% | 0.103 -43% | 0.038 47% | 0.05092 ? 29% |
| 4K-64 Write (MB/s) | 1780 | 258.3 -85% | 623 -65% | 1136 -36% | 375.7 -79% | 612 -66% | 564 -68% | 1055 -41% | 1504 ? -16% |
| 4K-64 Read (MB/s) | 1203 | 381.2 -68% | 1372 14% | 1578 31% | 1067 -11% | 1312 9% | 488.4 -59% | 1223 2% | 1203 ? 0% |
| 4K Write (MB/s) | 121 | 88.8 -27% | 143.1 18% | 158 31% | 145.1 20% | 140 16% | 101.5 -16% | 155.3 28% | 112 ? -7% |
| 4K Read (MB/s) | 52.6 | 29.14 -45% | 55.6 6% | 51.7 -2% | 49.22 -6% | 44.98 -14% | 31.28 -41% | 51.5 -2% | 50.5 ? -4% |
| Seq Write (MB/s) | 1781 | 272.8 -85% | 1506 -15% | 1777 0% | 1484 -17% | 1164 -35% | 441 -75% | 1694 -5% | 1637 ? -8% |
| Seq Read (MB/s) | 2294 | 515 -78% | 2624 14% | 2719 19% | 1953 -15% | 1463 -36% | 1696 -26% | 2799 22% | 1976 ? -14% |
* ... menor é melhor

| SiSoft Sandra 2016 | |
| Image Processing | |
| Lenovo ThinkPad P52 20MAS03N00 | |
| Média NVIDIA Quadro P1000 (264 - 269, n=3) | |
| Lenovo ThinkPad P51 20HH0016GE | |
| HP ZBook 15 G4-Y4E80AV | |
| HP ZBook 15u G5 2ZC05EA | |
| Lenovo ThinkPad P52s-20LB000HGE | |
| GP Cryptography (Higher Security AES256+SHA2-512) | |
| HP ZBook 15 G4-Y4E80AV | |
| Lenovo ThinkPad P51 20HH0016GE | |
| Média NVIDIA Quadro P1000 (10.8 - 11, n=3) | |
| Lenovo ThinkPad P52 20MAS03N00 | |
| Lenovo ThinkPad P52s-20LB000HGE | |
| HP ZBook 15u G5 2ZC05EA | |
| GP Financial Analysis (FP High/Double Precision) | |
| Lenovo ThinkPad P51 20HH0016GE | |
| HP ZBook 15 G4-Y4E80AV | |
| HP ZBook 15u G5 2ZC05EA | |
| Lenovo ThinkPad P52 20MAS03N00 | |
| Média NVIDIA Quadro P1000 (23.2 - 23.8, n=3) | |
| Lenovo ThinkPad P52s-20LB000HGE | |
| 3DMark 06 Standard Score | 32223 pontos | |
| 3DMark Vantage P Result | 24240 pontos | |
| 3DMark 11 Performance | 6363 pontos | |
| 3DMark Ice Storm Standard Score | 73409 pontos | |
| 3DMark Cloud Gate Standard Score | 20654 pontos | |
| 3DMark Fire Strike Score | 4545 pontos | |
Ajuda | ||
| The Witcher 3 - 1920x1080 High Graphics & Postprocessing (Nvidia HairWorks Off) | |
| Média da turma Workstation (53.4 - 156.4, n=3, últimos 2 anos) | |
| Dell XPS 15 9570 i7 UHD | |
| MSI GL63 8RC-069US | |
| Lenovo ThinkPad P51 20HH0016GE | |
| Lenovo ThinkPad P52 20MAS03N00 | |
| Dell Precision 5520 UHD | |
| Média NVIDIA Quadro P1000 (26.1 - 29.9, n=3) | |
| Lenovo ThinkPad P52s-20LB000HGE | |
| Rise of the Tomb Raider - 1366x768 Medium Preset AF:2x | |
| MSI GL63 8RC-069US | |
| Dell XPS 15 9570 i7 UHD | |
| Lenovo ThinkPad P51 20HH0016GE | |
| Lenovo ThinkPad P52 20MAS03N00 | |
| Média NVIDIA Quadro P1000 (55.7 - 59.1, n=3) | |
| Lenovo ThinkPad P52s-20LB000HGE | |
| BioShock Infinite - 1920x1080 Ultra Preset, DX11 (DDOF) | |
| Dell XPS 15 9570 i7 UHD | |
| MSI GL63 8RC-069US | |
| Lenovo ThinkPad P52 20MAS03N00 | |
| Média NVIDIA Quadro P1000 (51 - 51.7, n=3) | |
| Dell Precision 5520 UHD | |
| Lenovo ThinkPad P52s-20LB000HGE | |
| baixo | média | alto | ultra | |
|---|---|---|---|---|
| BioShock Infinite (2013) | 229.9 | 149.3 | 132.3 | 51.3 |
| The Witcher 3 (2015) | 88.8 | 53.8 | 29.9 | 15.7 |
| Rise of the Tomb Raider (2016) | 101.5 | 59.1 | 32 | 26.2 |
| Doom (2016) | 91.7 | 78.4 | 43.3 | 41.6 |
| Civilization 6 (2016) | 114.7 | 71.3 | 33.5 | 27 |
| Rocket League (2017) | 235.5 | 123.8 | 81.8 | |
| Call of Duty WWII (2017) | 127.1 | 81 | 41.1 | 33.4 |
| Star Wars Battlefront 2 (2017) | 114.4 | 44.6 | 37.9 | 26.6 |
| Far Cry 5 (2018) | 64 | 32 | 29 | 27 |
Barulho
| Ocioso |
| 29.5 / 29.5 / 29.5 dB |
| Carga |
| 34.7 / 39.4 dB |
 | ||
30 dB silencioso 40 dB(A) audível 50 dB(A) ruidosamente alto |
||
min: | ||
(±) A temperatura máxima no lado superior é 42.7 °C / 109 F, em comparação com a média de 38.2 °C / 101 F , variando de 22.2 a 69.8 °C para a classe Workstation.
(±) A parte inferior aquece até um máximo de 43 °C / 109 F, em comparação com a média de 41.1 °C / 106 F
(+) Em uso inativo, a temperatura média para o lado superior é 23.4 °C / 74 F, em comparação com a média do dispositivo de 32 °C / ### class_avg_f### F.
(±) Jogando The Witcher 3, a temperatura média para o lado superior é 36.2 °C / 97 F, em comparação com a média do dispositivo de 32 °C / ## #class_avg_f### F.
(+) Os apoios para as mãos e o touchpad estão atingindo a temperatura máxima da pele (32.1 °C / 89.8 F) e, portanto, não estão quentes.
(-) A temperatura média da área do apoio para as mãos de dispositivos semelhantes foi 27.8 °C / 82 F (-4.3 °C / -7.8 F).
Lenovo ThinkPad P52 20MAS03N00 análise de áudio
(±) | o volume do alto-falante é médio, mas bom (###valor### dB)
Graves 100 - 315Hz
(-) | quase nenhum baixo - em média 15.1% menor que a mediana
(±) | a linearidade dos graves é média (10.3% delta para a frequência anterior)
Médios 400 - 2.000 Hz
(±) | médios mais altos - em média 10.8% maior que a mediana
(±) | a linearidade dos médios é média (11% delta para frequência anterior)
Altos 2 - 16 kHz
(+) | agudos equilibrados - apenas 2.7% longe da mediana
(±) | a linearidade dos máximos é média (7.6% delta para frequência anterior)
Geral 100 - 16.000 Hz
(-) | o som geral não é linear (30.8% diferença em relação à mediana)
Comparado com a mesma classe
» 97% de todos os dispositivos testados nesta classe foram melhores, 1% semelhantes, 1% piores
» O melhor teve um delta de 7%, a média foi 17%, o pior foi 35%
Comparado com todos os dispositivos testados
» 89% de todos os dispositivos testados foram melhores, 3% semelhantes, 8% piores
» O melhor teve um delta de 4%, a média foi 24%, o pior foi 134%
Dell Precision 5520 UHD análise de áudio
(±) | o volume do alto-falante é médio, mas bom (###valor### dB)
Graves 100 - 315Hz
(±) | graves reduzidos - em média 12.8% menor que a mediana
(±) | a linearidade dos graves é média (14.2% delta para a frequência anterior)
Médios 400 - 2.000 Hz
(+) | médios equilibrados - apenas 4% longe da mediana
(±) | a linearidade dos médios é média (9.9% delta para frequência anterior)
Altos 2 - 16 kHz
(+) | agudos equilibrados - apenas 3.3% longe da mediana
(±) | a linearidade dos máximos é média (12% delta para frequência anterior)
Geral 100 - 16.000 Hz
(±) | a linearidade do som geral é média (16.7% diferença em relação à mediana)
Comparado com a mesma classe
» 46% de todos os dispositivos testados nesta classe foram melhores, 9% semelhantes, 45% piores
» O melhor teve um delta de 7%, a média foi 17%, o pior foi 35%
Comparado com todos os dispositivos testados
» 29% de todos os dispositivos testados foram melhores, 7% semelhantes, 64% piores
» O melhor teve um delta de 4%, a média foi 24%, o pior foi 134%
| desligado | |
| Ocioso | |
| Carga |
|
Key:
min: | |
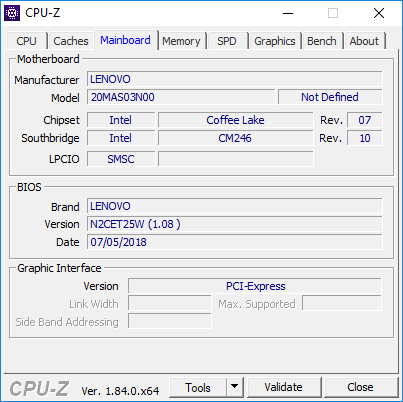
| Lenovo ThinkPad P52 20MAS03N00 i7-8750H, Quadro P1000, Samsung SSD PM981 MZVLB512HAJQ, IPS LED, 1920x1080, 15.6" | Lenovo ThinkPad P50 6820HQ, Quadro M2000M, Samsung SSD PM871 MZNLN256HCHP, IPS, 1920x1080, 15.6" | Lenovo ThinkPad P51 20HH0016GE E3-1505M v6, Quadro M2200, Samsung PM961 NVMe MZVLW512HMJP, IPS, 3840x2160, 15.6" | HP ZBook 15 G4-Y4E80AV E3-1535M v6, Quadro M2200, Samsung SSD SM961 1TB M.2 MZVKW1T0HMLH, IPS, 1920x1080, 15.6" | Dell Precision 7510 (4K IGZO) E3-1535M v5, Quadro M2000M, Samsung SSD SM951a 512GB M.2 PCIe 3.0 x4 NVMe (MZVKV512), IGZO IPS, 3840x2160, 15.6" | Lenovo ThinkPad P52s-20LB000HGE i5-8550U, Quadro P500, Samsung PM961 MZVLW256HEHP, IPS LED, 1920x1080, 15.6" | HP ZBook 15u G5 2ZC05EA i5-8550U, Radeon Pro WX 3100, Toshiba XG5 KXG50ZNV256G, IPS LED, 1920x1080, 15.6" | Dell Precision 5520 UHD E3-1505M v6, Quadro M1200, Samsung SM961 MZVKW512HMJP m.2 PCI-e, IPS, 3840x2160, 15.6" | Média NVIDIA Quadro P1000 | Média da turma Workstation | |
|---|---|---|---|---|---|---|---|---|---|---|
| Power Consumption | -5% | -65% | -21% | -197% | 23% | 26% | -47% | -11% | -61% | |
| Idle Minimum * (Watt) | 4.02 | 5.6 -39% | 8.6 -114% | 5.9 -47% | 23.9 -495% | 4.1 -2% | 3.2 20% | 8.9 -121% | 5.09 ? -27% | 8.94 ? -122% |
| Idle Average * (Watt) | 7.2 | 8.6 -19% | 15.9 -121% | 8.9 -24% | 28.9 -301% | 7.7 -7% | 6.1 15% | 13.6 -89% | 9.25 ? -28% | 13.8 ? -92% |
| Idle Maximum * (Watt) | 11.46 | 9.3 19% | 22.1 -93% | 12.7 -11% | 30 -162% | 10.7 7% | 9.7 15% | 14.1 -23% | 13 ? -13% | 17.5 ? -53% |
| Load Average * (Watt) | 76.3 | 89.5 -17% | 84.4 -11% | 95.2 -25% | 95.2 -25% | 52 32% | 62 19% | 100.3 -31% | 78.2 ? -2% | 95 ? -25% |
| Witcher 3 ultra * (Watt) | 74 | 87.7 -19% | 38.8 48% | 48 35% | 100.2 -35% | |||||
| Load Maximum * (Watt) | 154 | 105 32% | 130.6 15% | 154 -0% | 157.1 -2% | 65 58% | 71 54% | 126.3 18% | 132.7 ? 14% | 175.2 ? -14% |
* ... menor é melhor
| Lenovo ThinkPad P52 20MAS03N00 i7-8750H, Quadro P1000, 96 Wh | Lenovo ThinkPad P50 6820HQ, Quadro M2000M, 90 Wh | Lenovo ThinkPad P51 20HH0016GE E3-1505M v6, Quadro M2200, 90 Wh | HP ZBook 15 G4-Y4E80AV E3-1535M v6, Quadro M2200, 90 Wh | Dell Precision 7510 (4K IGZO) E3-1535M v5, Quadro M2000M, 91 Wh | Lenovo ThinkPad P52s-20LB000HGE i5-8550U, Quadro P500, 104 Wh | HP ZBook 15u G5 2ZC05EA i5-8550U, Radeon Pro WX 3100, 56 Wh | Dell Precision 5520 UHD E3-1505M v6, Quadro M1200, 97 Wh | Média da turma Workstation | |
|---|---|---|---|---|---|---|---|---|---|
| Duração da bateria | -12% | -21% | -3% | -51% | 87% | 27% | -45% | -7% | |
| Reader / Idle (h) | 25.3 | 14.3 -43% | 16.4 -35% | 18.3 -28% | 4.5 -82% | 39.3 55% | 21.7 -14% | 12.1 -52% | 26.1 ? 3% |
| H.264 (h) | 12.2 | 8.9 -27% | 7.6 -38% | 10.5 -14% | 18.9 55% | 10.4 -15% | 9.51 ? -22% | ||
| WiFi v1.3 (h) | 10.6 | 8.3 -22% | 6.9 -35% | 9.1 -14% | 4 -62% | 16.2 53% | 8.6 -19% | 4.2 -60% | 8.53 ? -20% |
| Load (h) | 1.3 | 1.9 46% | 1.6 23% | 1.9 46% | 1.2 -8% | 3.7 185% | 3.3 154% | 1 -23% | 1.429 ? 10% |
Pro
Contra
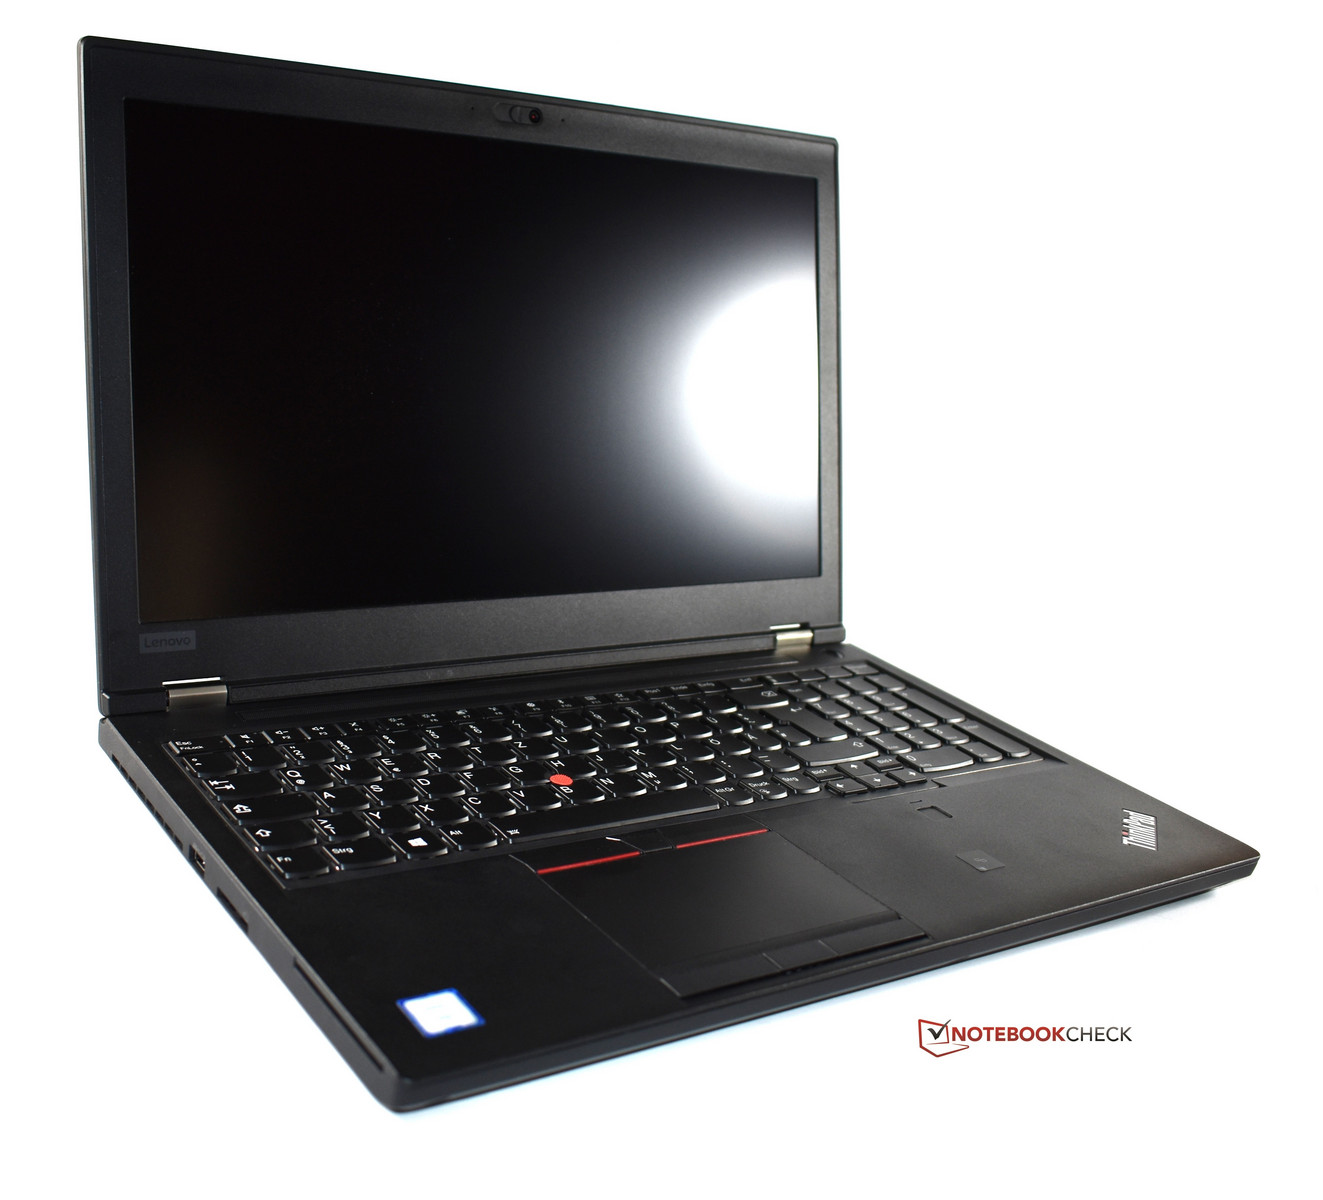
Para sua série ThinkPad P50 da terceira geração, a Lenovo optou por uma evolução cuidadosa, em vez de um novo design revolucionário.
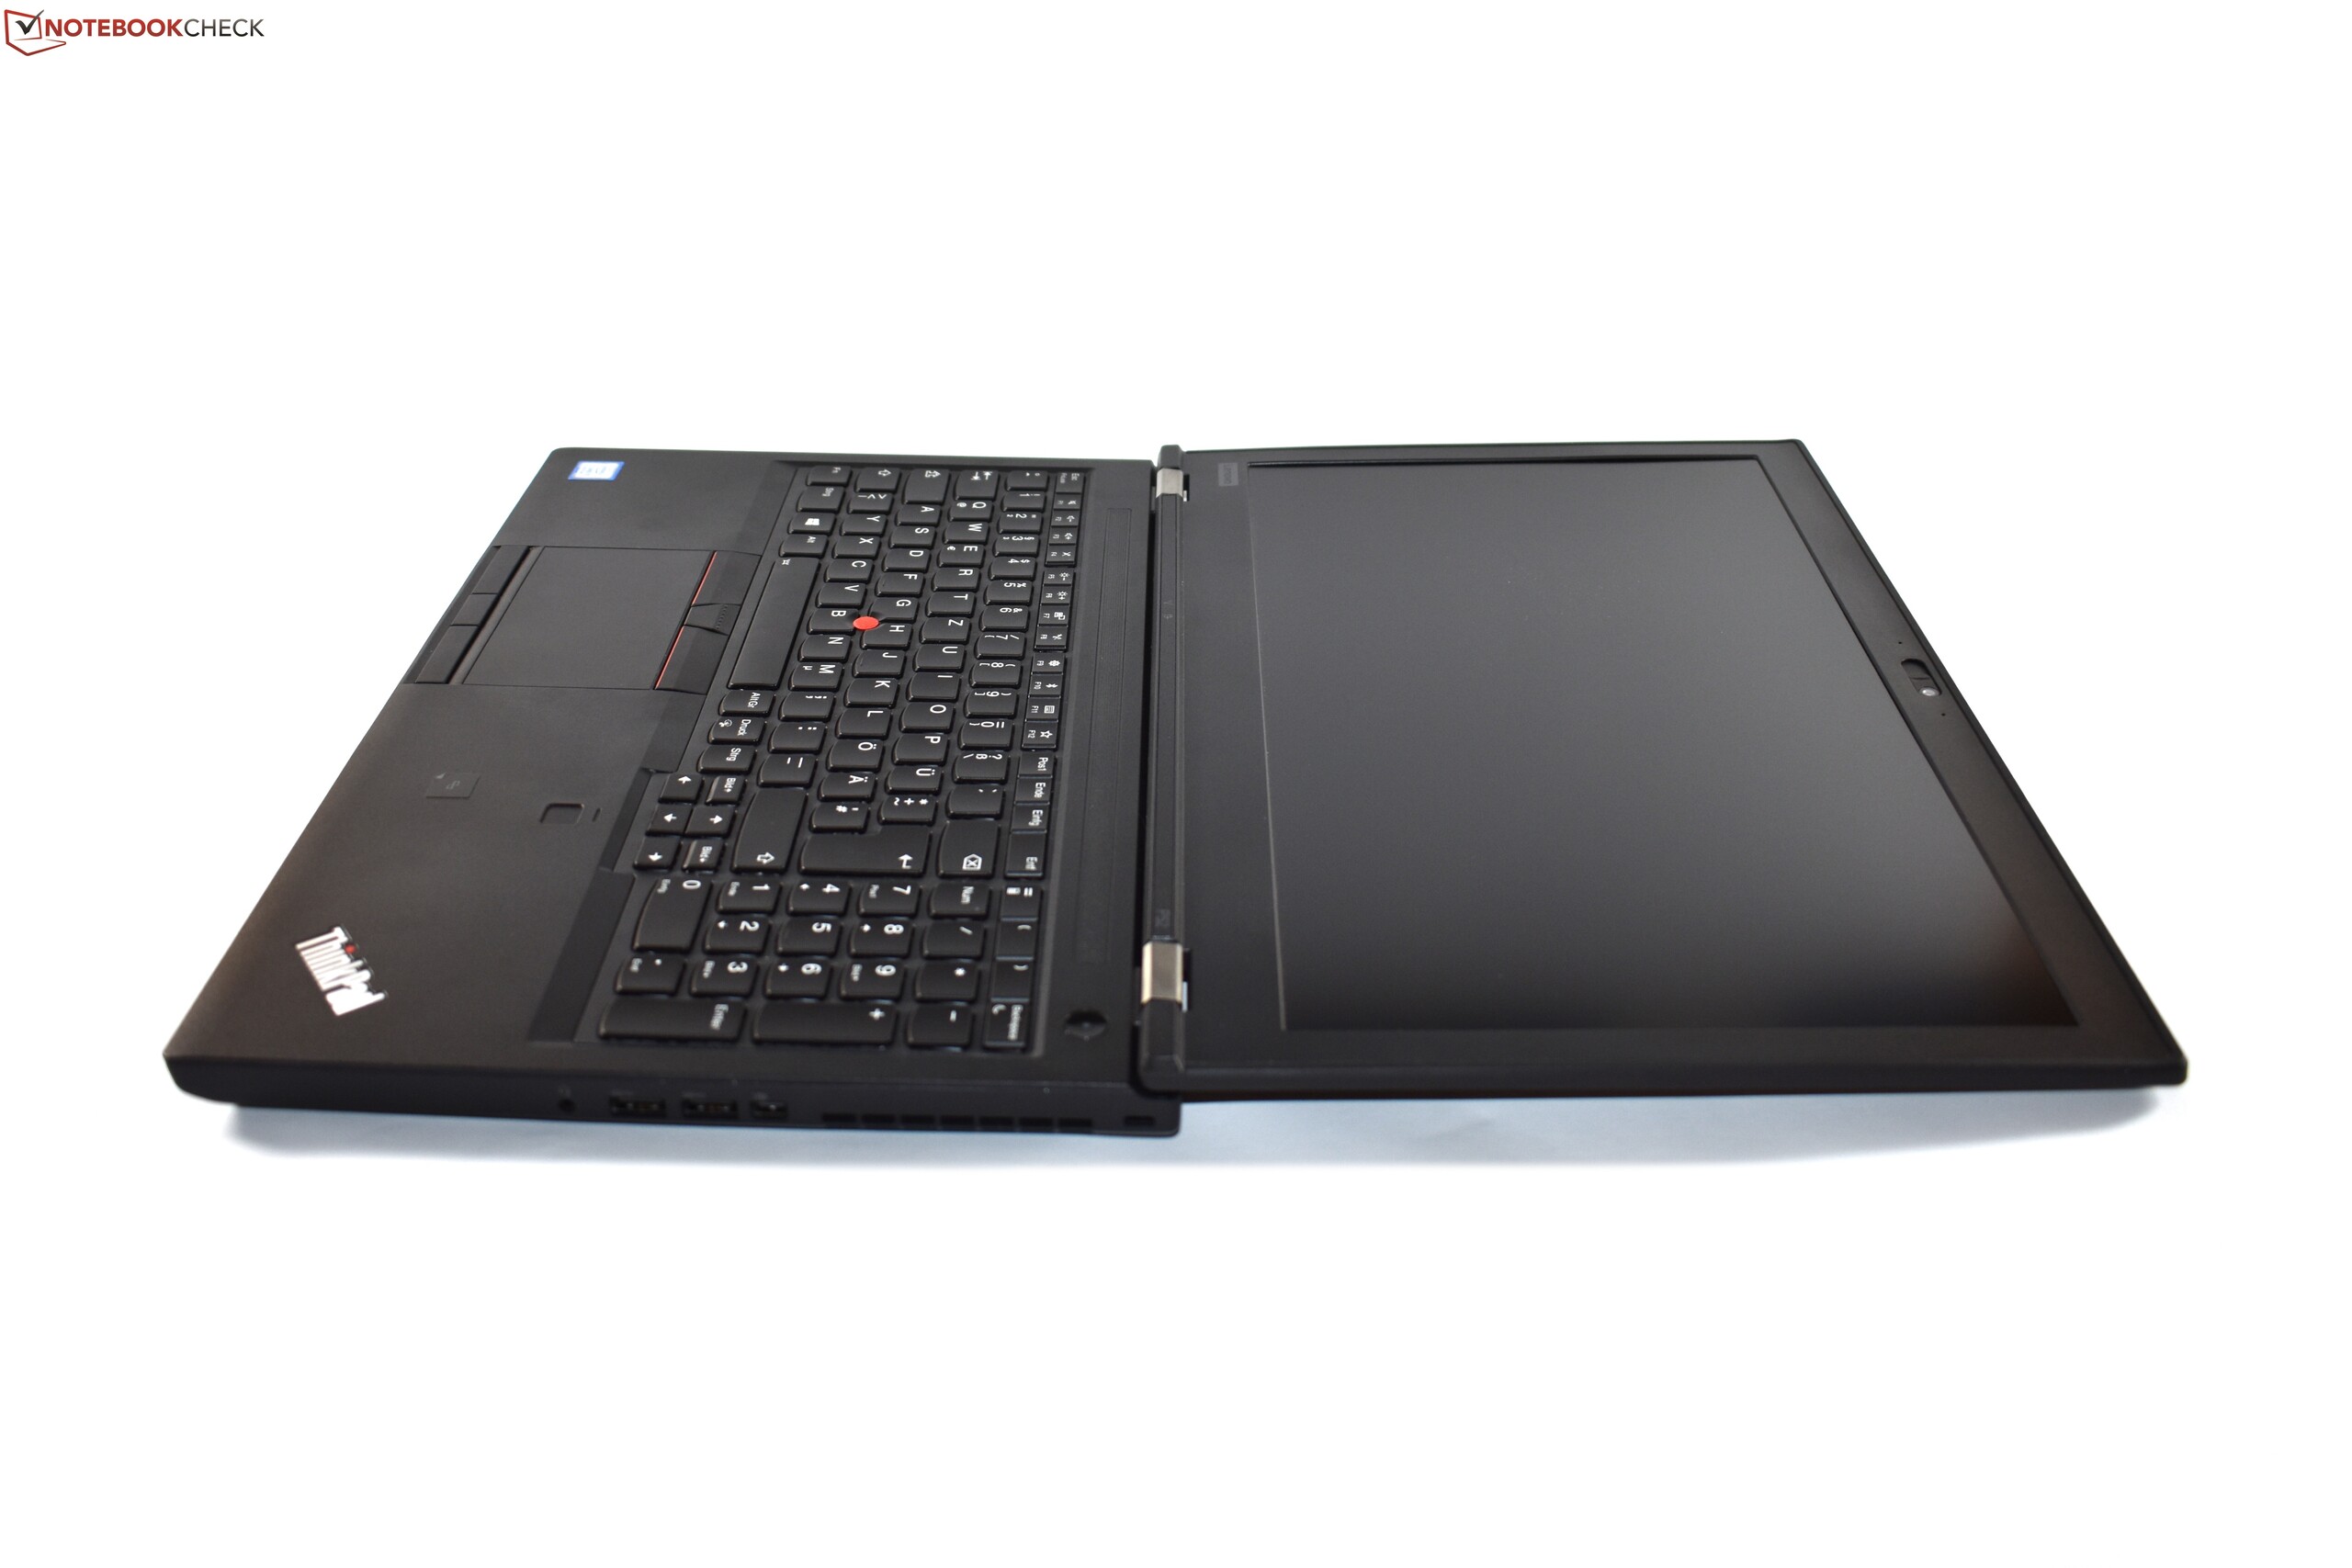
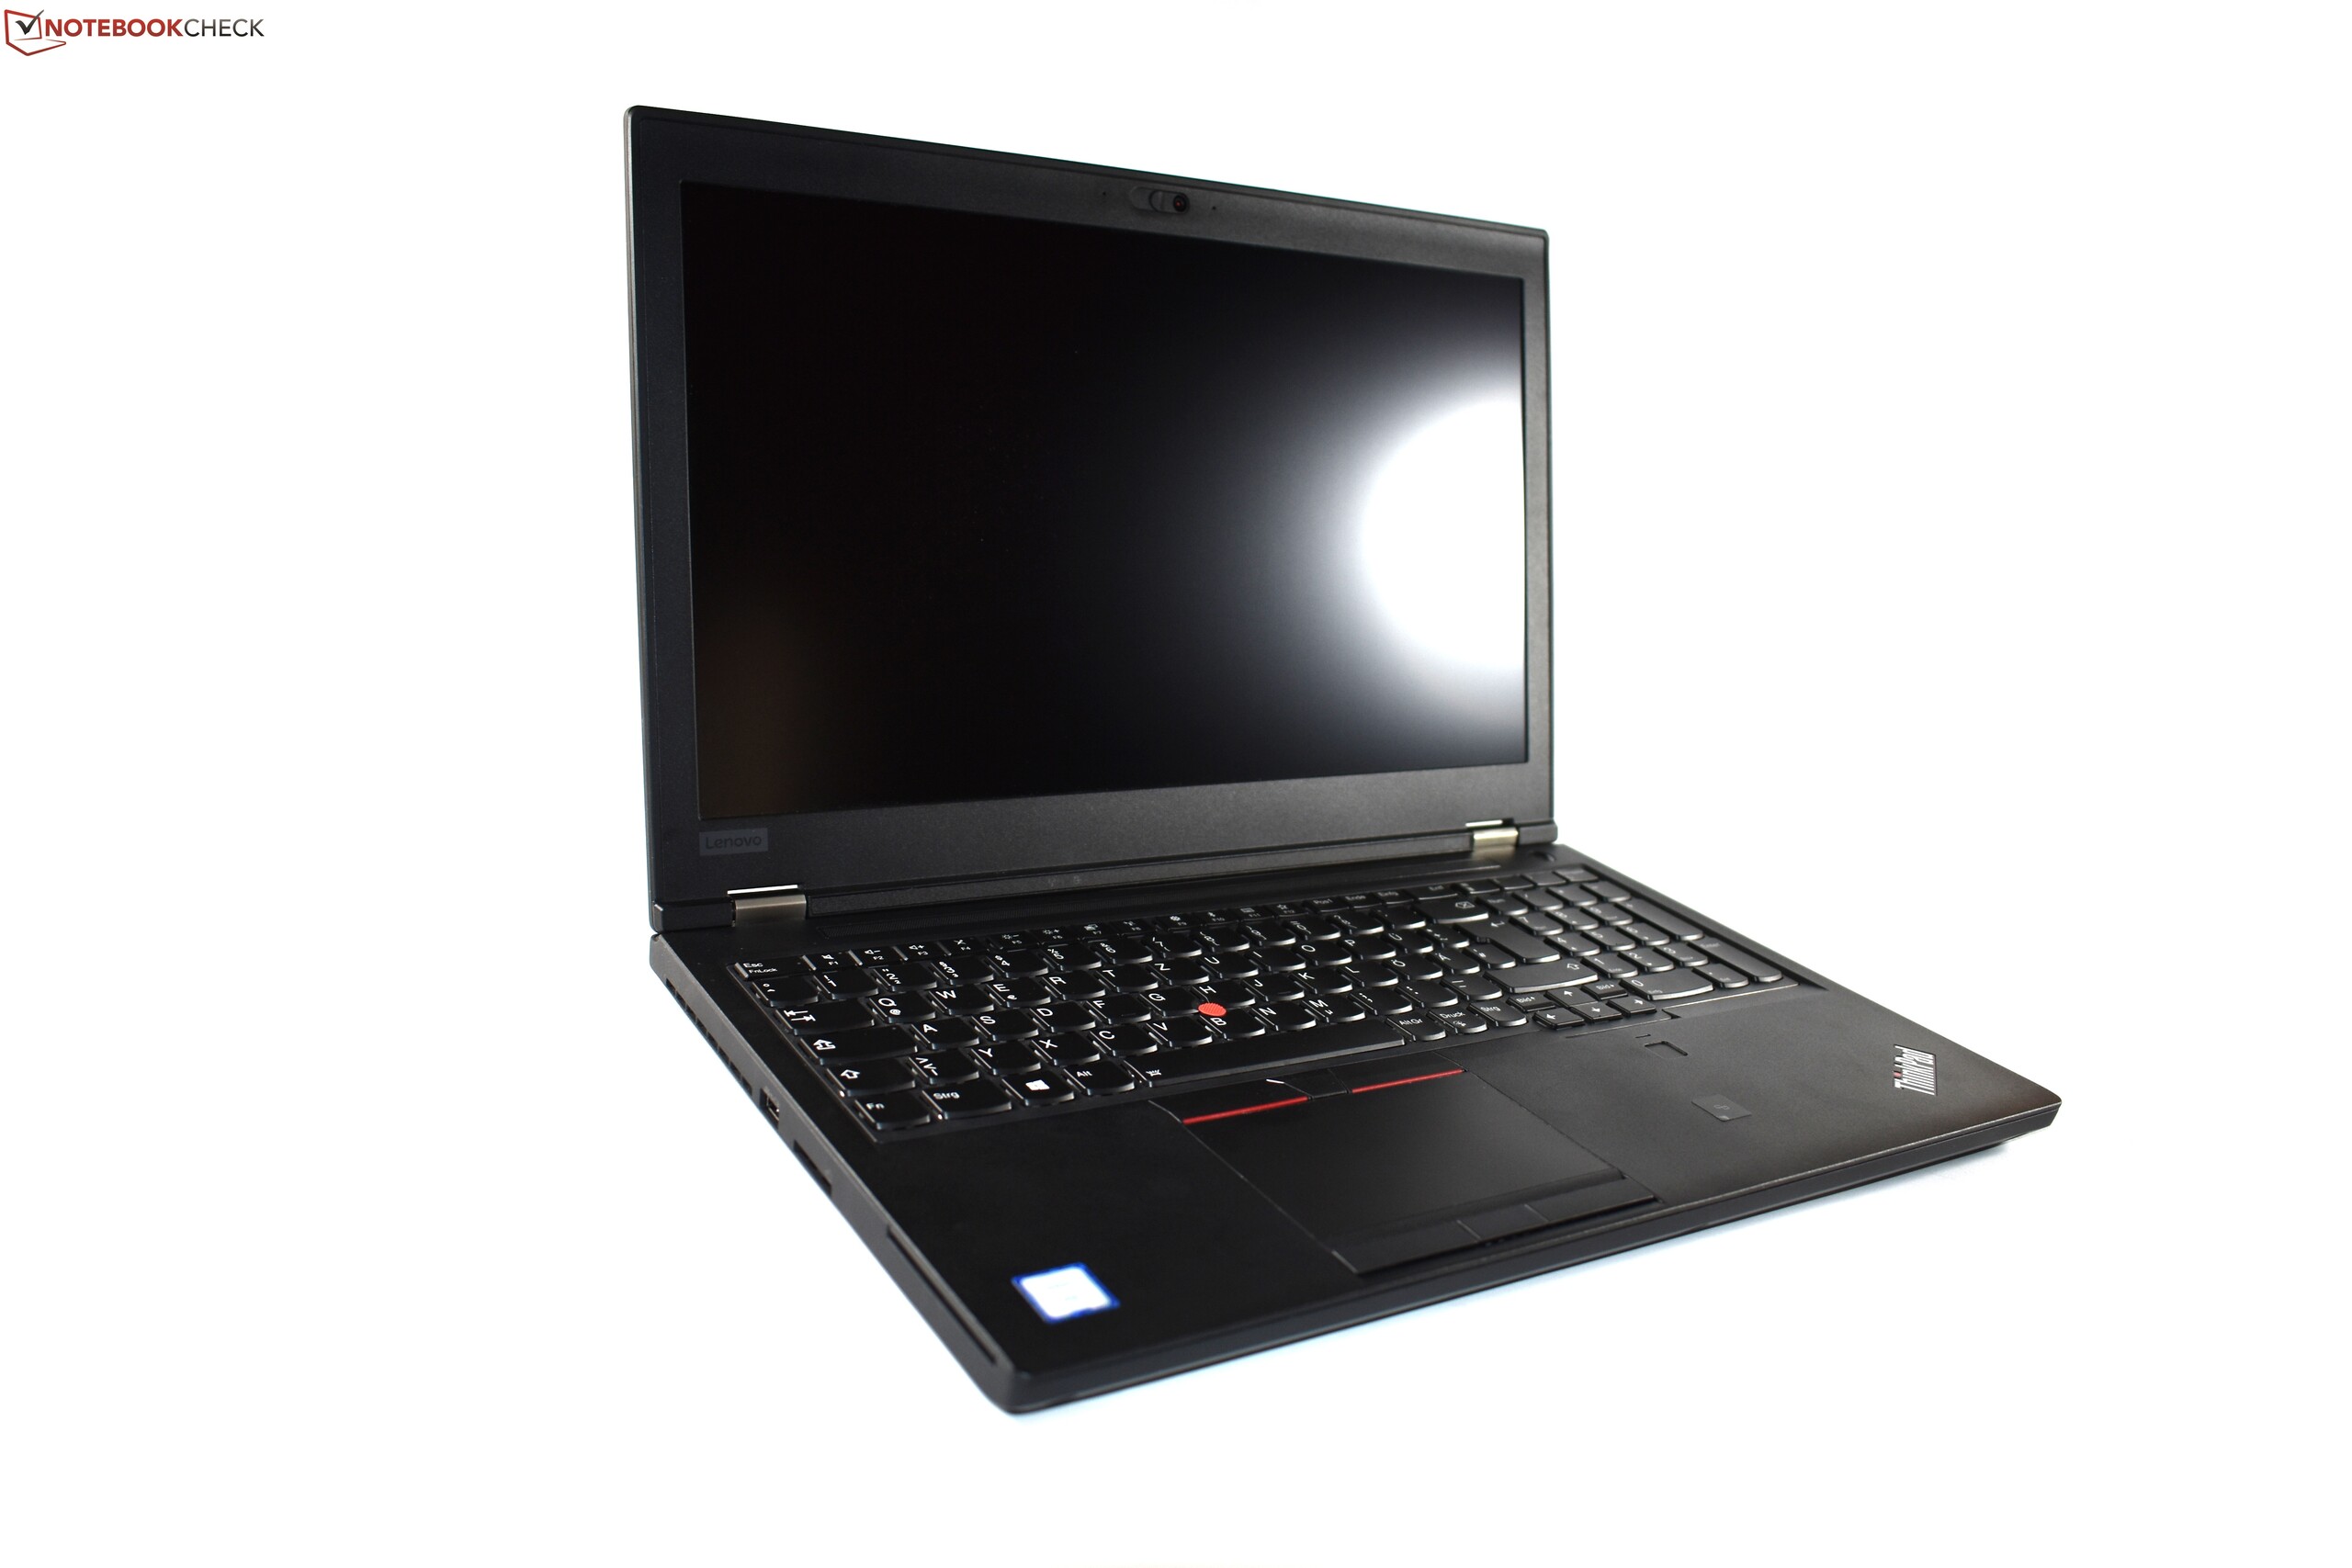
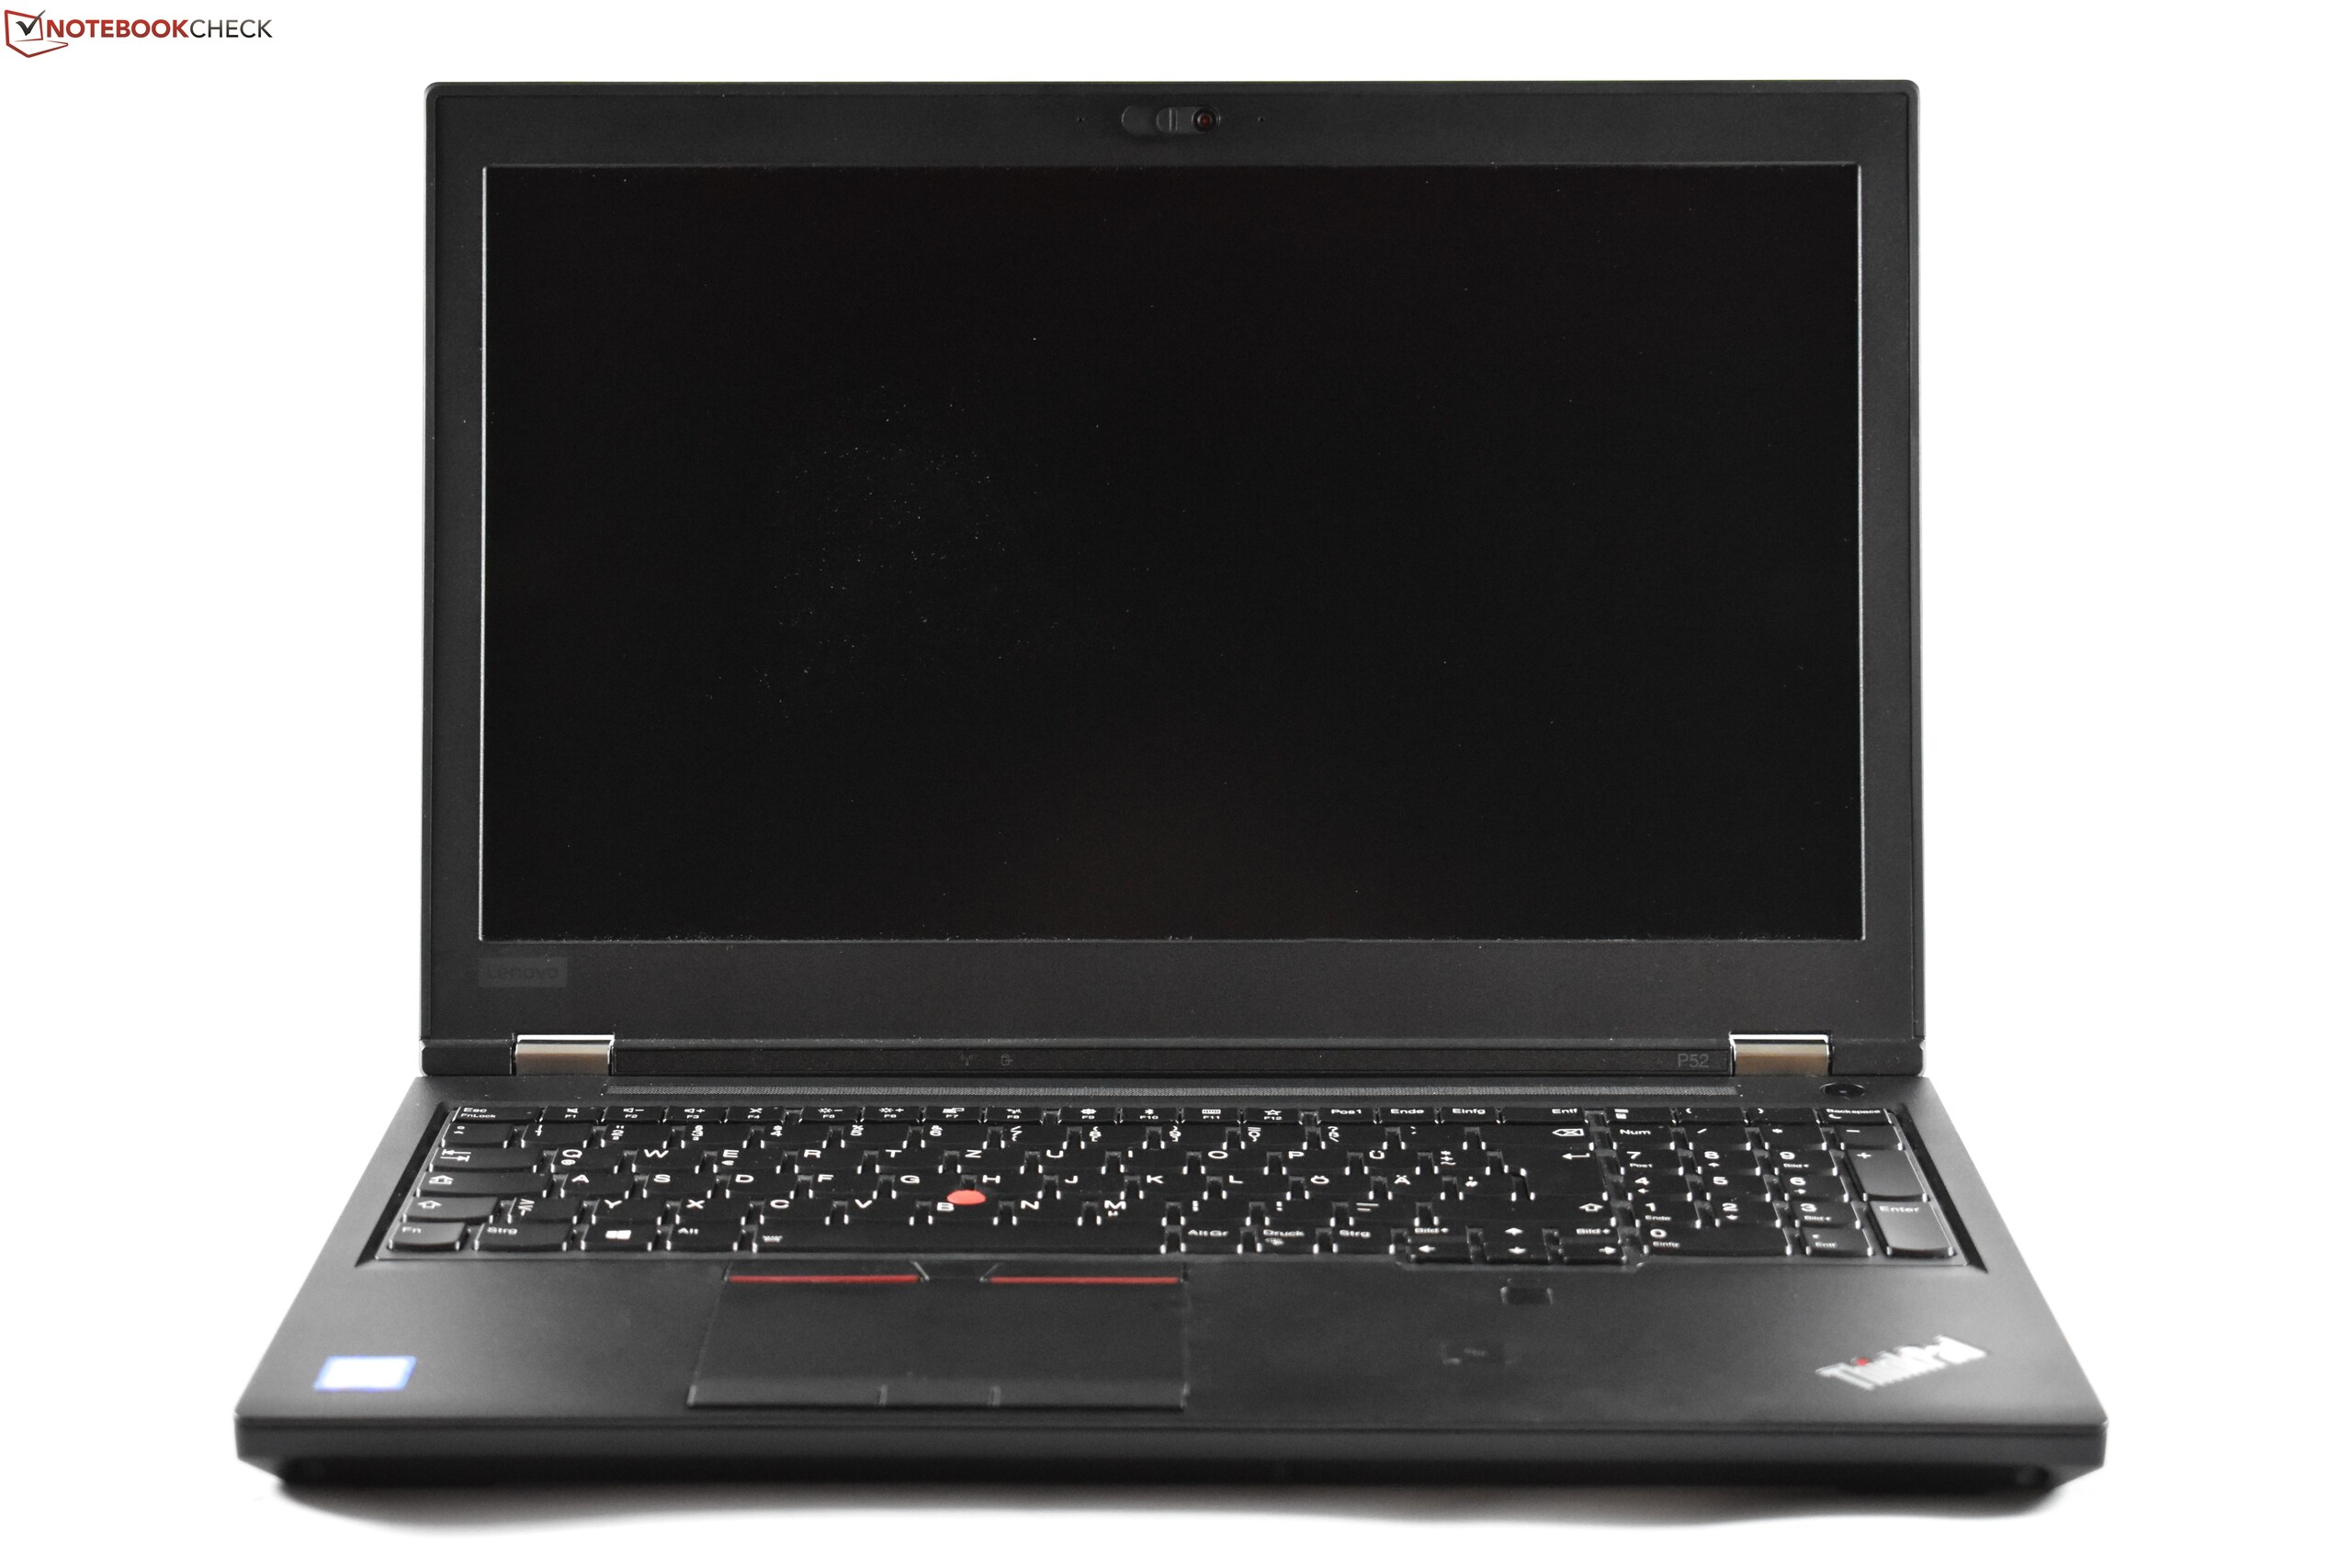
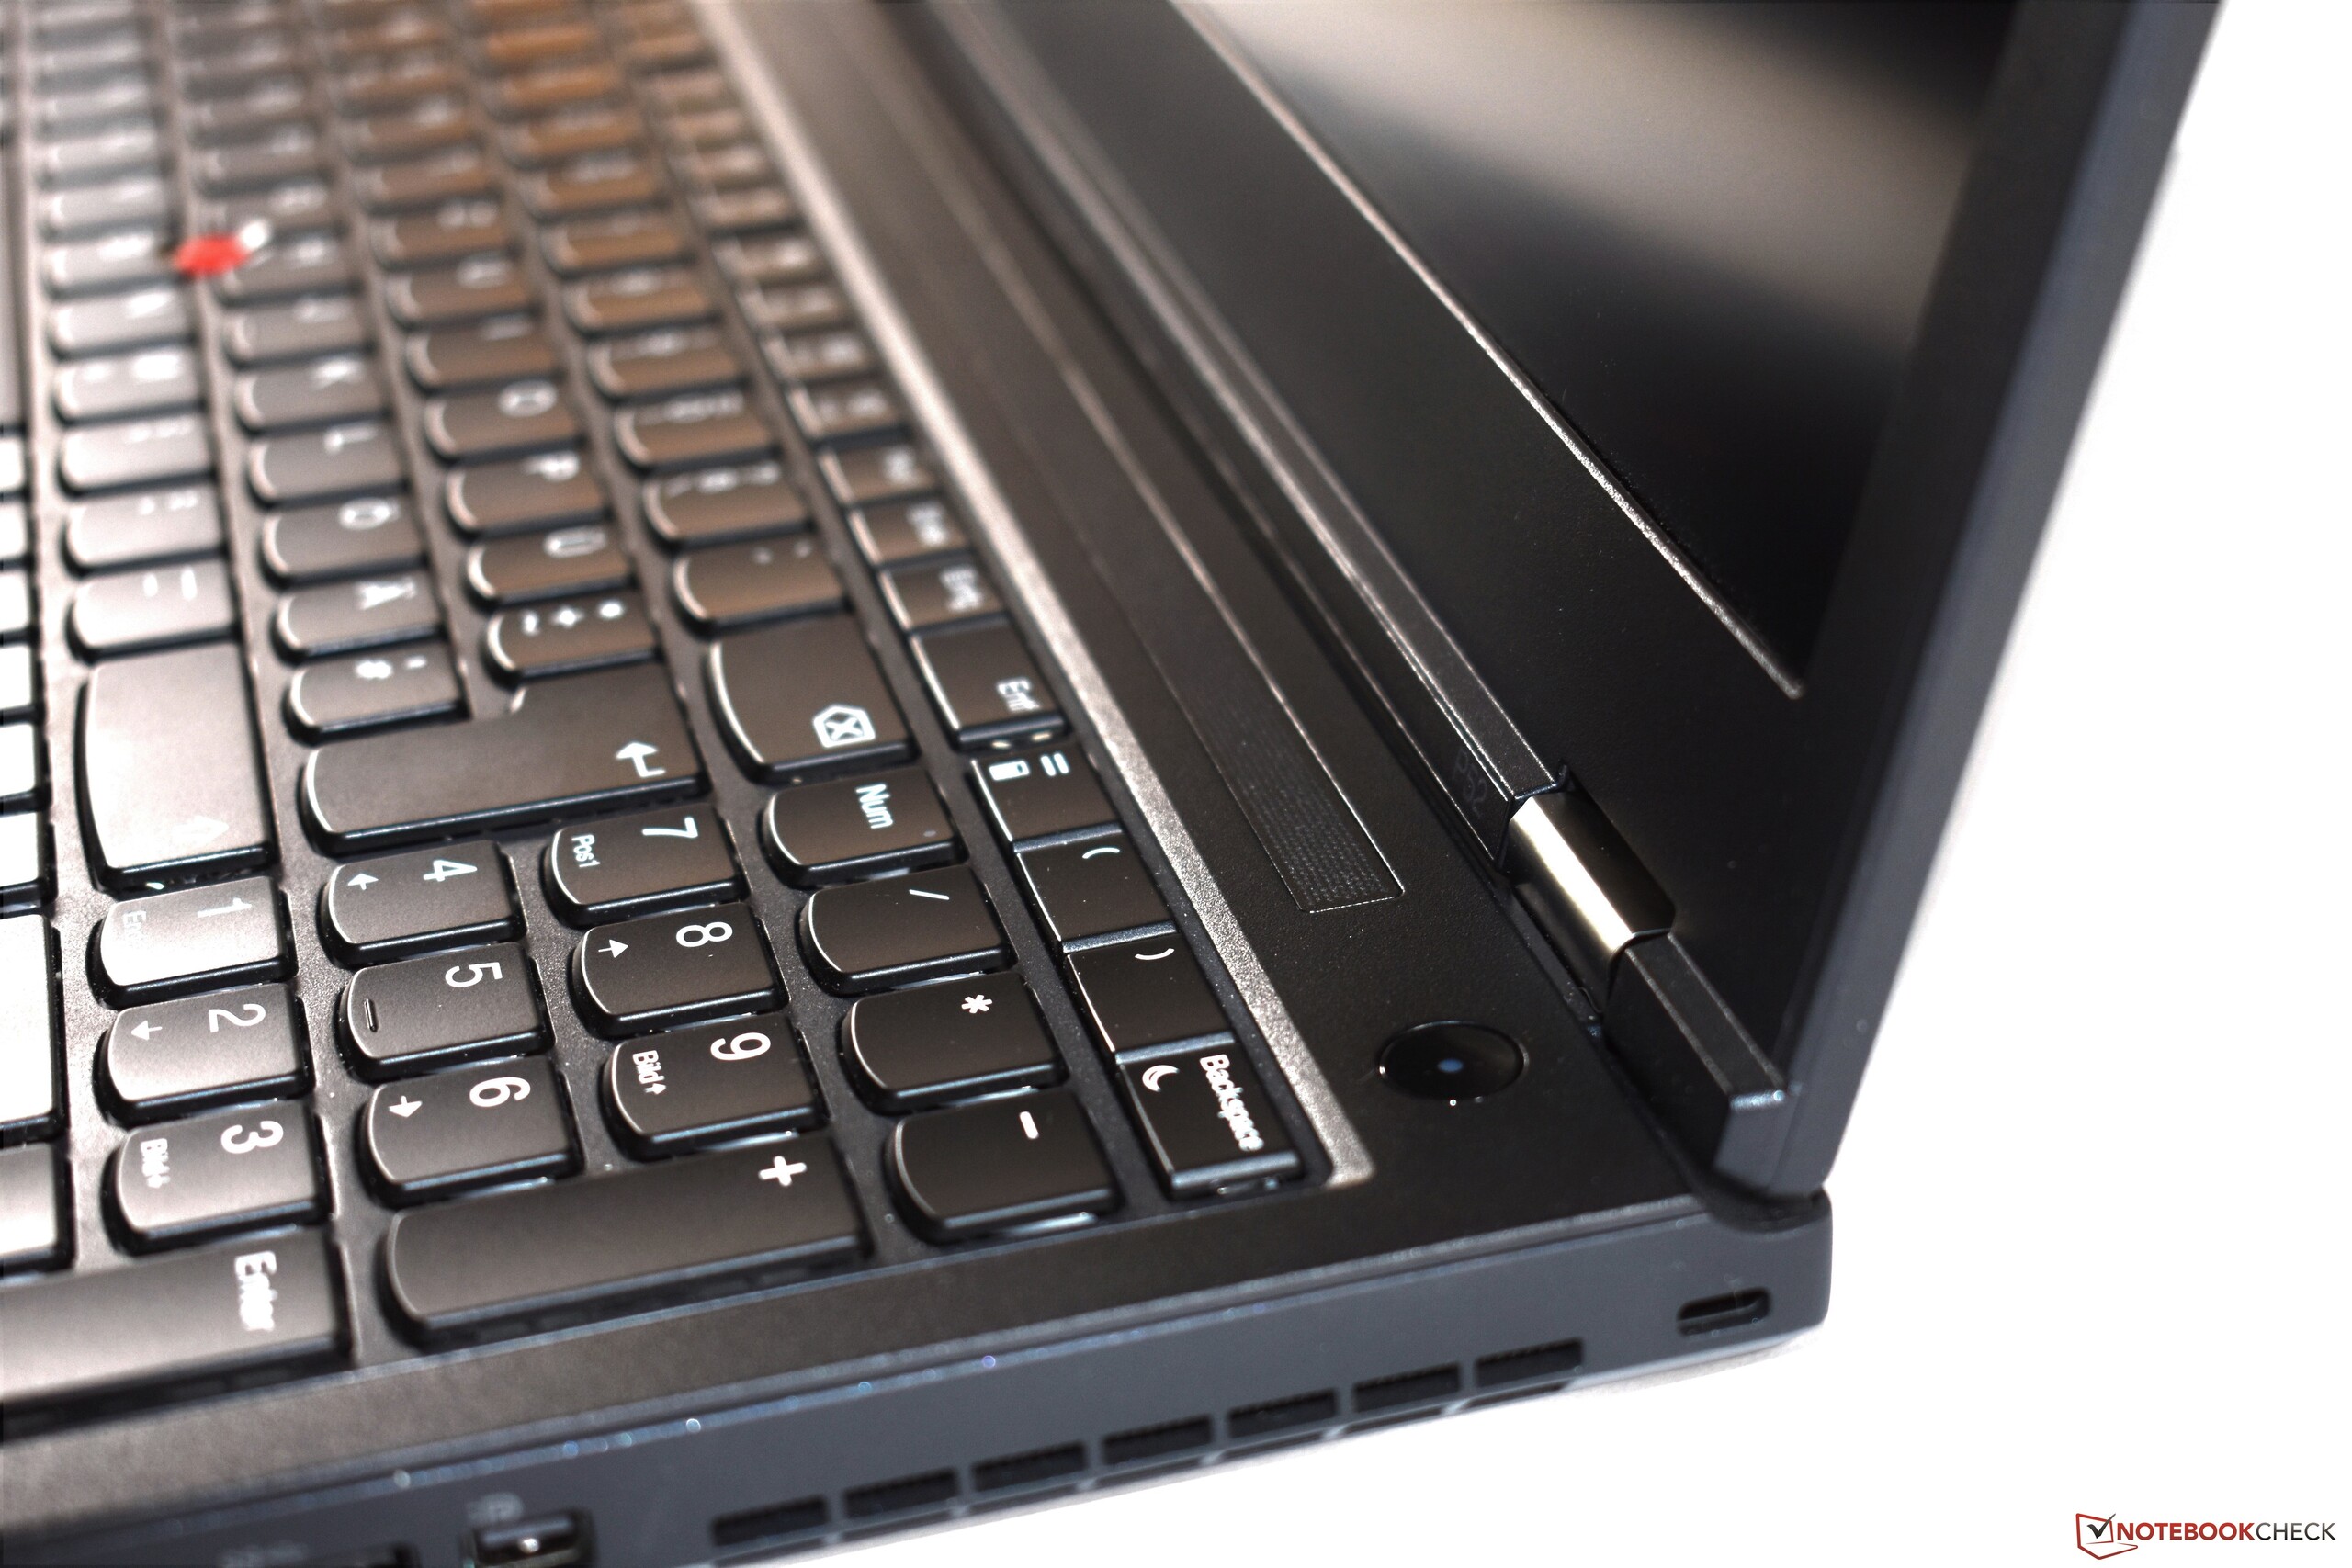
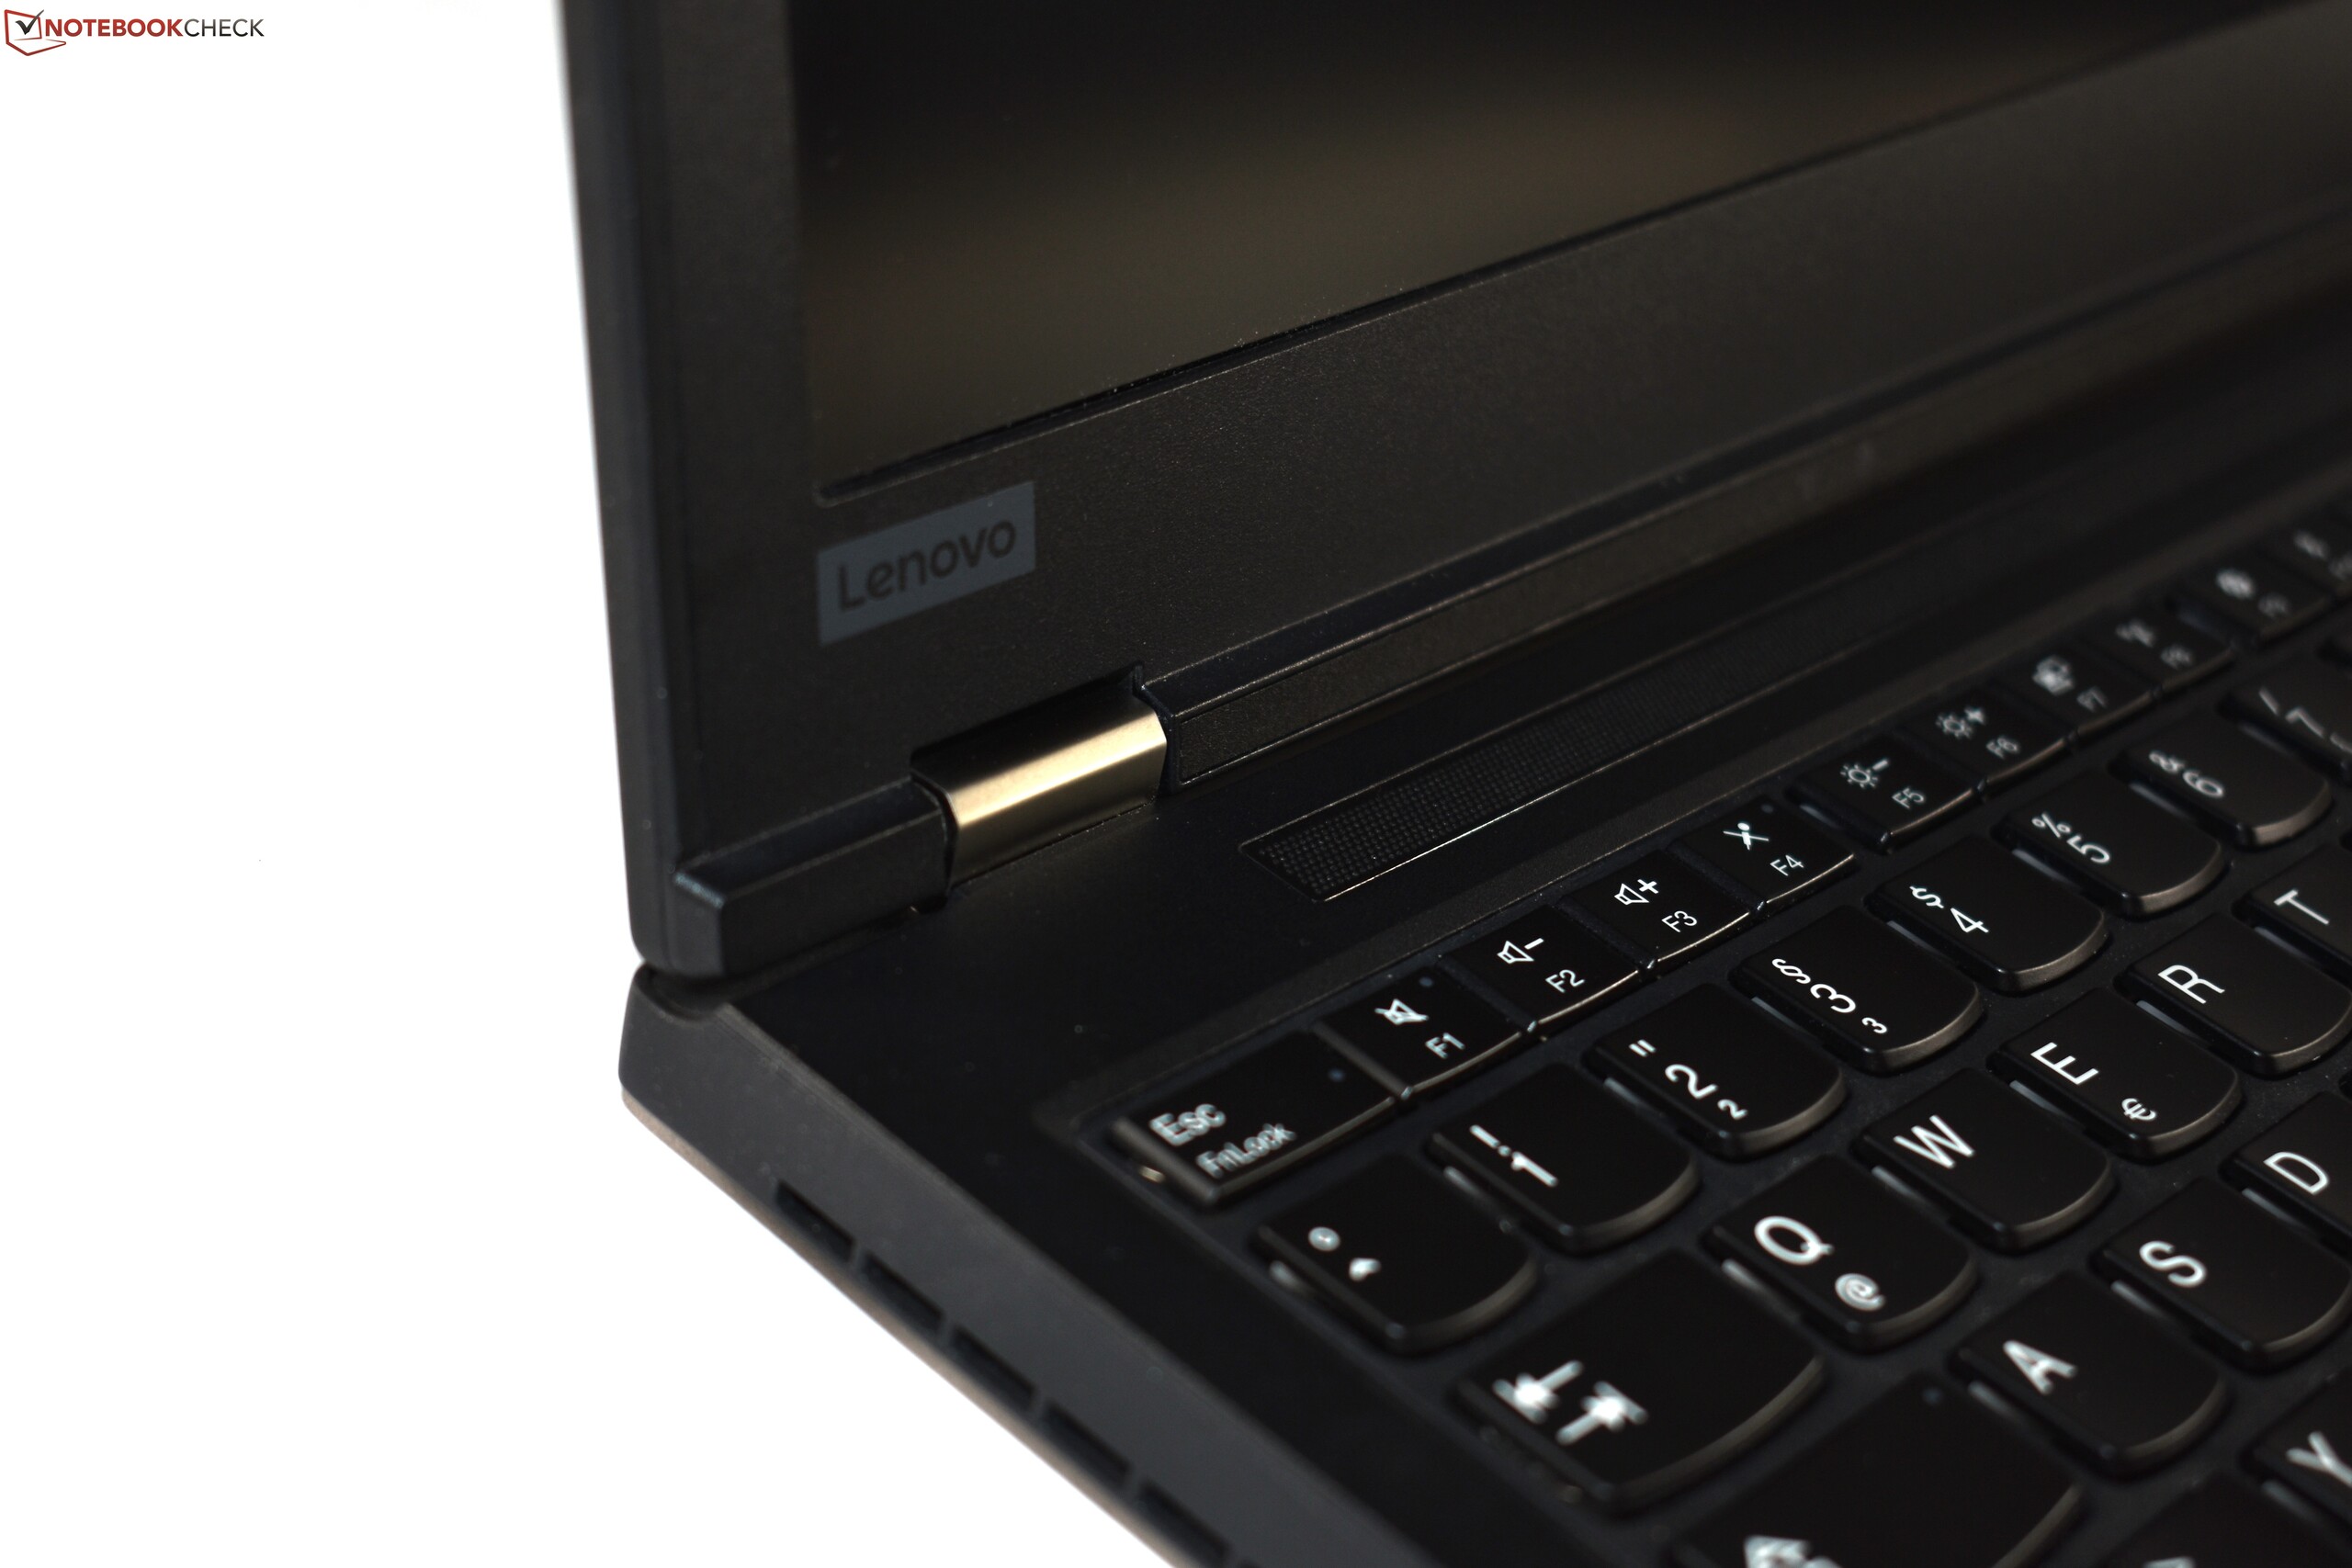
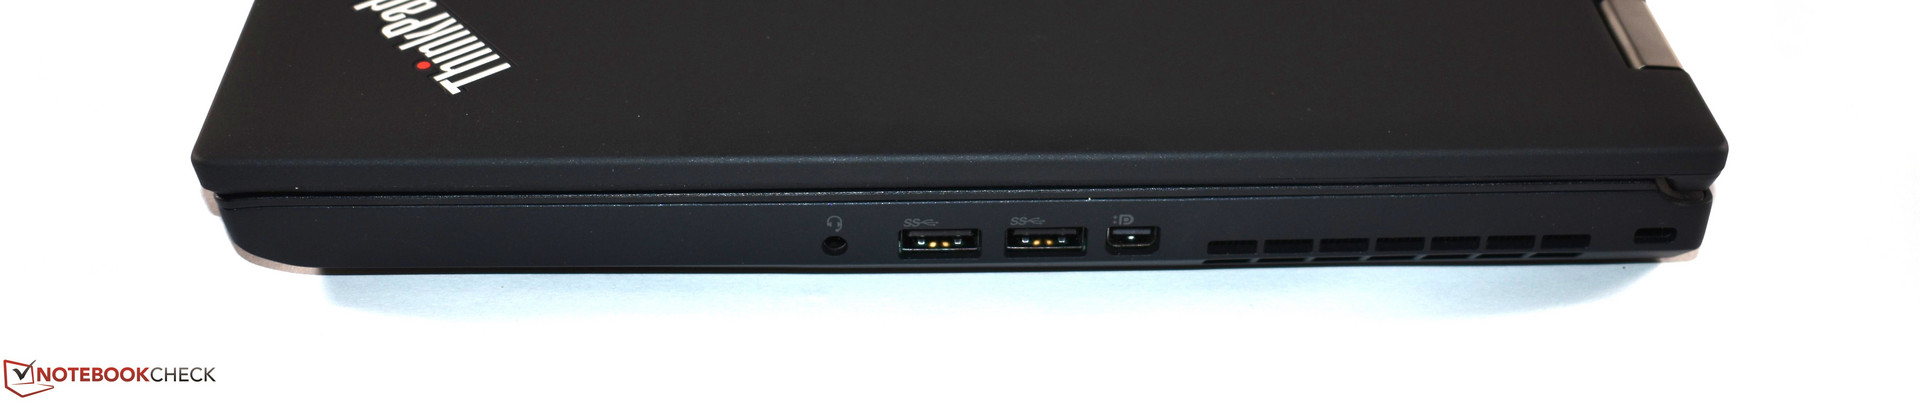
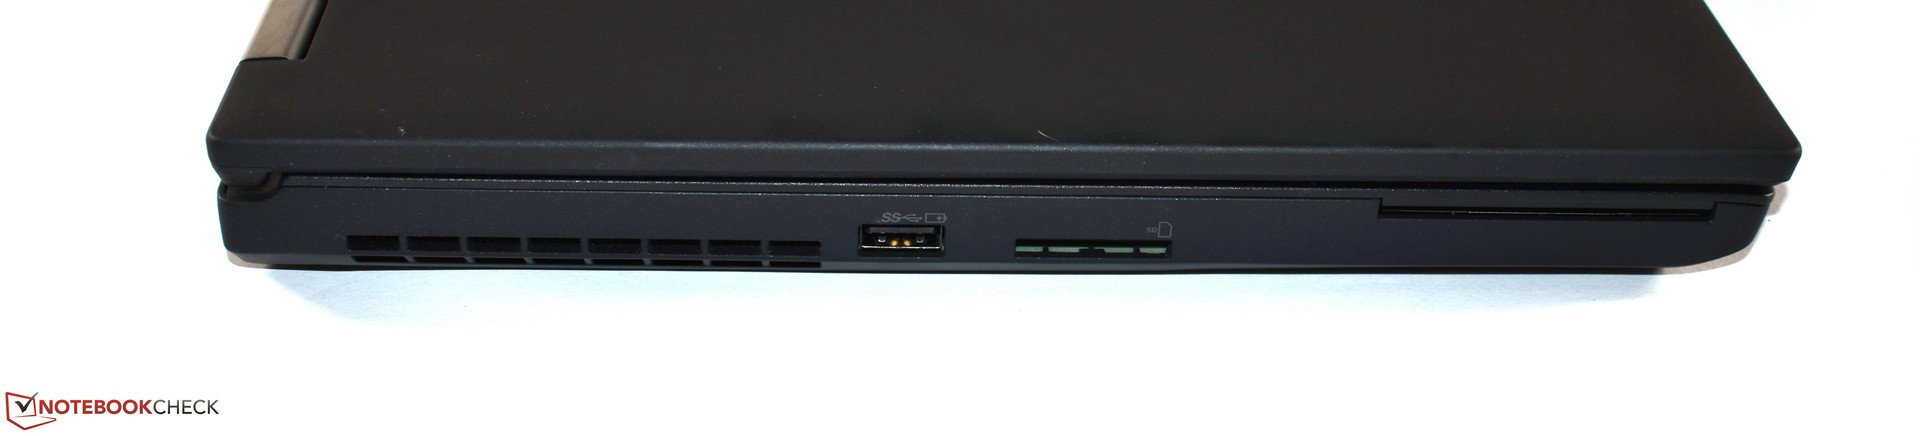
Este passo evolucionário conhecido como ThinkPad P52 resultou muito bem, pois incorporou muitas das vantagens de seu antecessor, como por exemplo a carcaça robusta e sólida ou os dispositivos de entrada excelentes e típicos para um ThinkPad. A seleção de portas do dispositivo foi modernizada extensivamente sem sacrificar sua versatilidade, e seus recursos de segurança foram aprimorados com o novíssimo controle deslizante de lente da câmera ThinkShutter e a câmera infravermelha opcional para o Windows Hello. A tela foi melhorada significativamente, e a tela de nível de entrada agora é finalmente uma opção adequada e decente. O único problema que tivemos foi que ele não cobre sRGB plenamente. Outras vantagens incluem sua garantia estendida padrão de três anos no local (limitada a determinados países e SKUs), o muito rápido SSD PCIe NVMe fabricado pela Samsung, seu baixíssimo consumo de energia e a duração da bateria muito respeitável, conforme determinado pelos nossos benchmarks de bateria realistas.
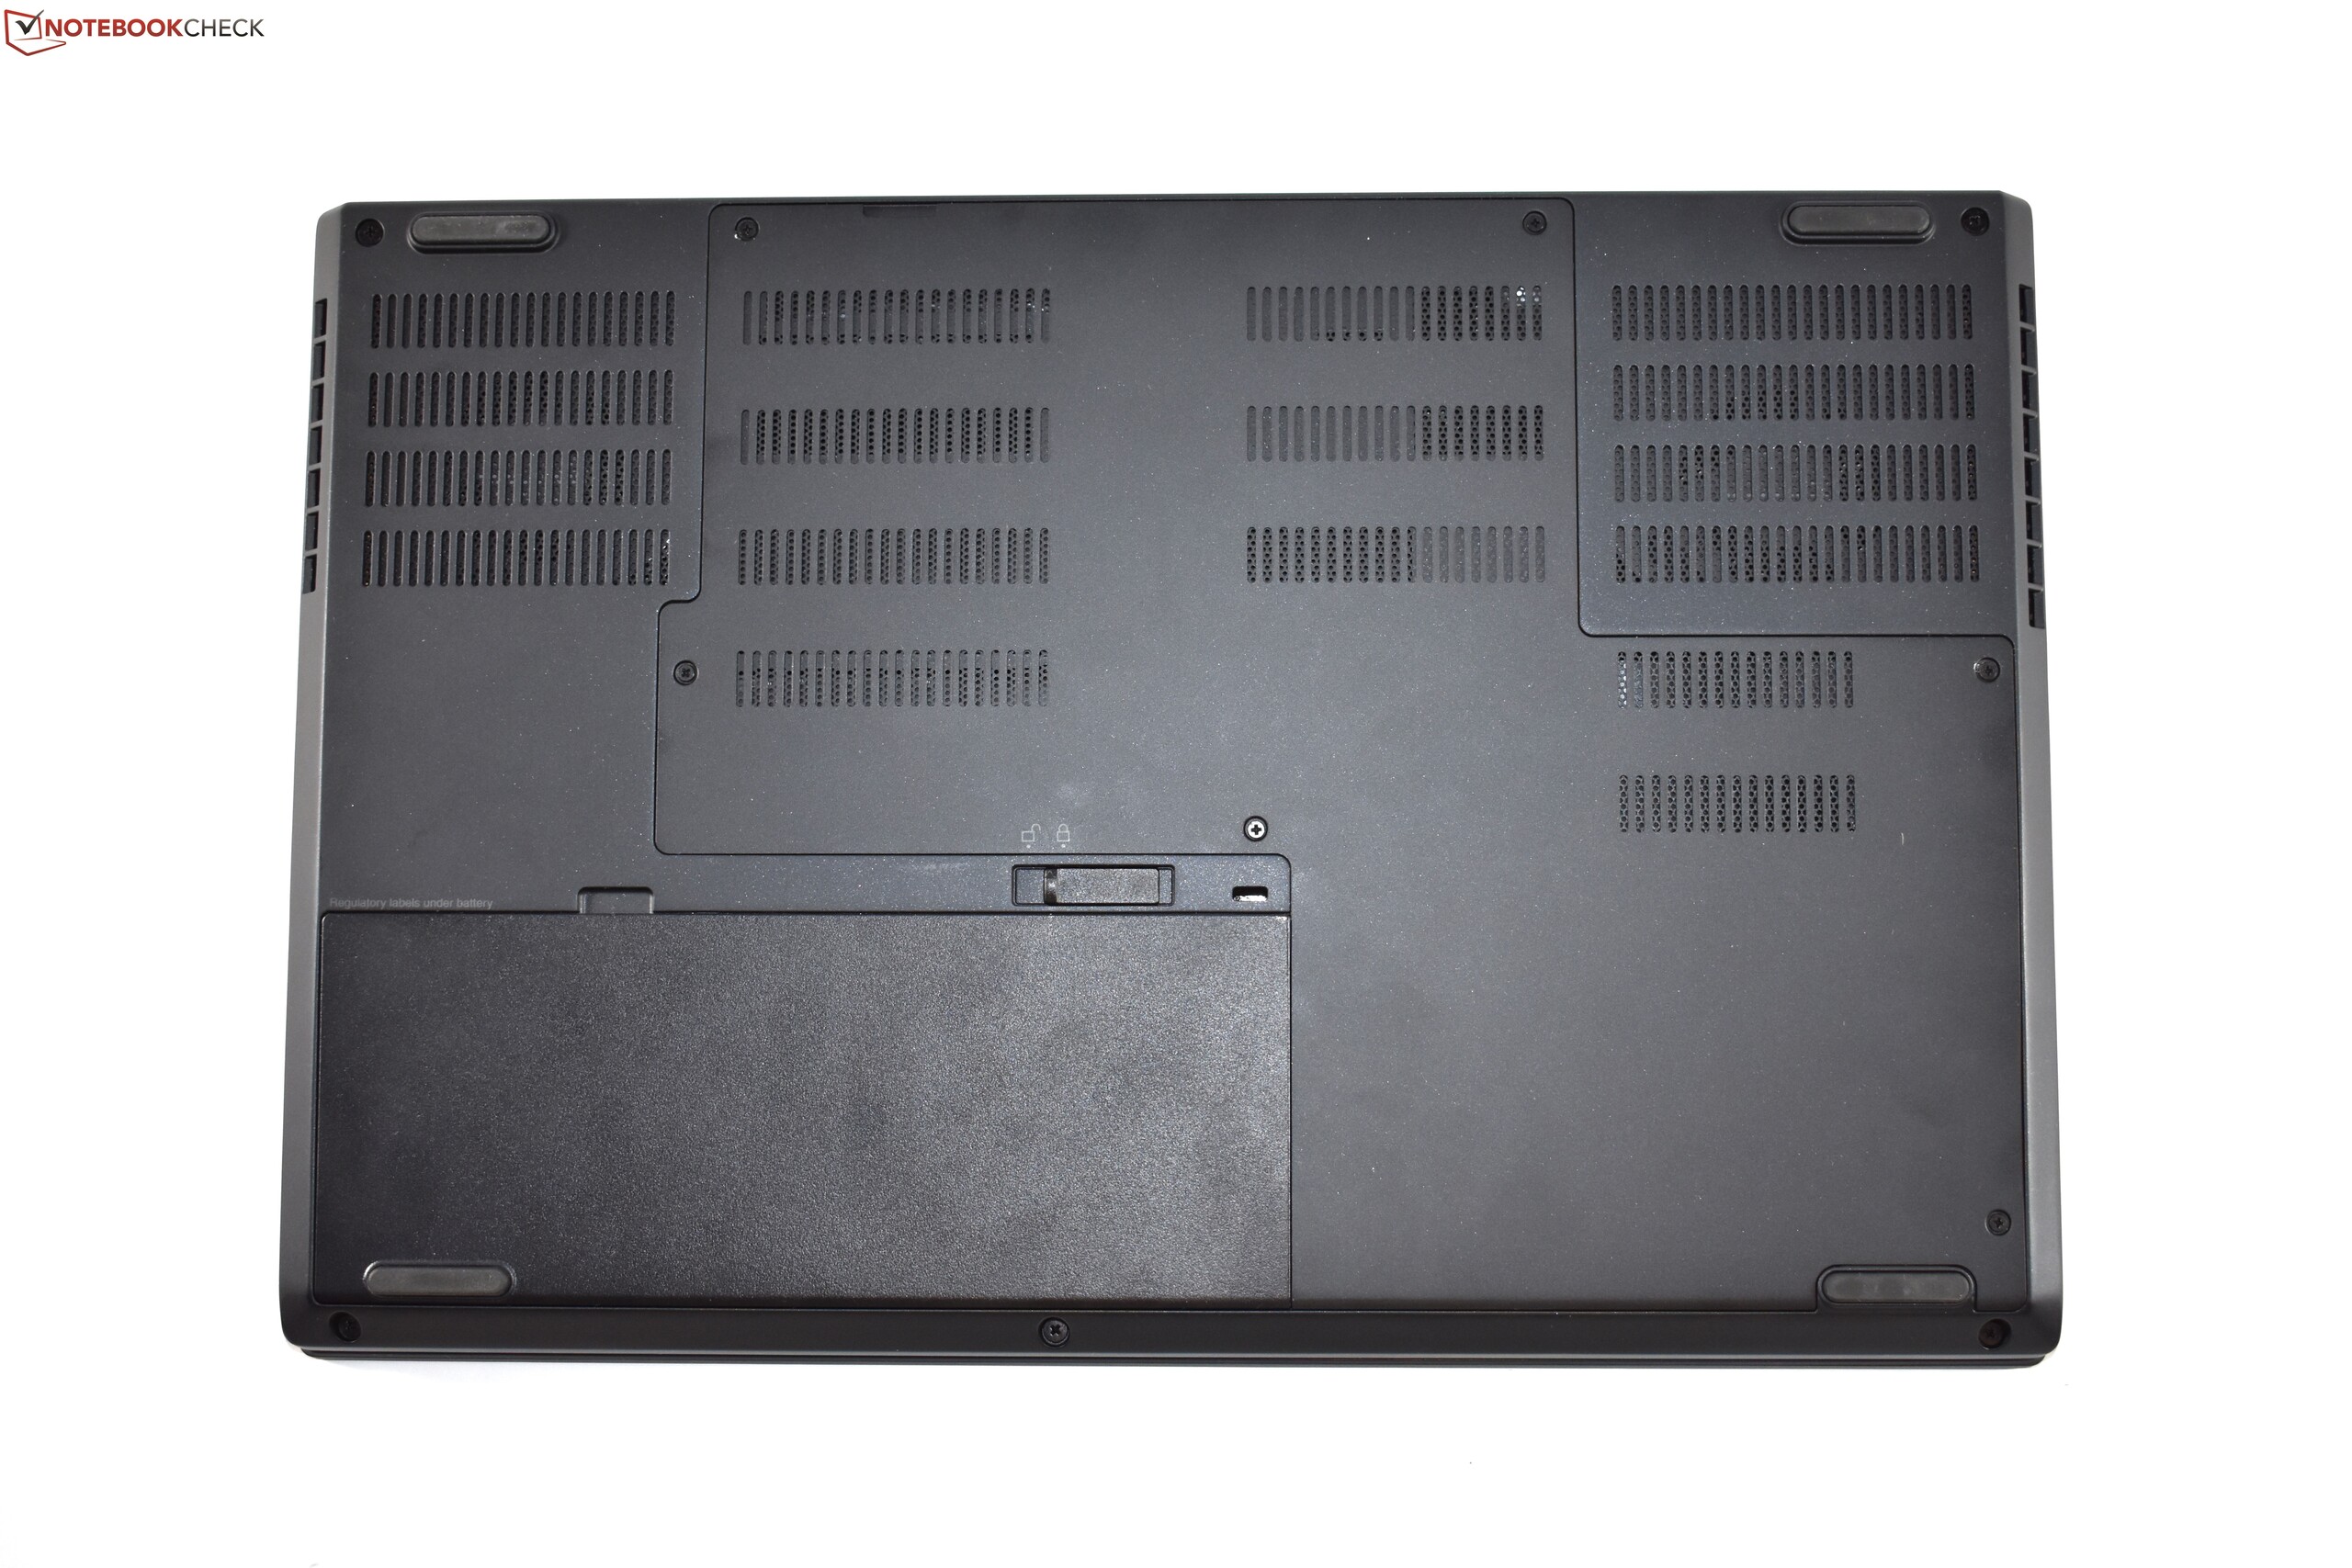
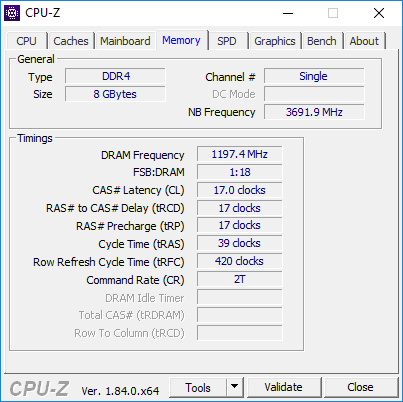
O P52 pode ser configurado individualmente e atualizado retroativamente. Nossa unidade de teste apresentava um slot WWAN vazio, três slots de RAM livres e dois slots/compartimentos de armazenamento livres. Infelizmente, a atualização do P52 foi desnecessariamente complicada pelo fato de que a remoção do teclado requer uma ferramenta especial. Embora essa ferramenta possa ser solicitada à Lenovo, ainda não está disponível. O teclado precisa ser removido para acessar dois dos quatro slots de RAM, bem como o slot WWAN. O sistema de resfriamento 0permaneceu fora do alcance e, portanto, não é possível sua manutenção. Em compensação, a tampa inferior era mais fácil de remover, já que não tem os clipes de plástico que a maioria dos outros portáteis tem.
O sistema de resfriamento revisado e o desempenho geral do P52 podem ser melhor descritos como uma faca de dois gumes. Por um lado, o desempenho da CPU foi melhorado drasticamente graças à CPU Core i7 2670QM hexa-core de desempenho acima da média. Os ventiladores permaneceram comparativamente silenciosos mesmo sob carga e foram desligados durante o modo ocioso, e como bônus, a Lenovo conseguiu reduzir as temperaturas da superfície mesmo assim. Por outro lado, o sistema de resfriamento já estava sobrecarregado com o nosso SKU de nível de entrada equipado com o Core i7-8750H e o Quadro P1000. Isso é tanto culpa da Lenovo quanto da Intel - quase nenhum portátil equipado com seis núcleos é capaz de utilizar totalmente os chips mais recentes da Intel em todo o seu potencial. Assim, temos algumas dúvidas sérias sobre os mais potentes SKUs Core i7-8850H e Quadro P3200.
Outros contras incluem os alto-falantes pobres do P52 e os leves ruídos de bobina que detectamos. Também teríamos preferido um touchpad com cobertura de vidro em vez da superfície de plástico e ficamos surpresos pelo fato de que não há como desativar o afogamento do desempenho da CPU com a bateria.
Tela decente, carcaça robusta e sólida, dispositivos de entrada agradáveis e confortáveis, bateria de longa duração, excelente desempenho da CPU e silencioso na inicialização - o ThinkPad P52 da Lenovo é bom demais para ser verdade. Infelizmente, o sistema de resfriamento já estava sobrecarregado pelo nosso modelo de entrada.
Considerando tudo, o ThinkPad P52 é uma excelente opção se você estiver no mercado em busca de um portátil workstation poderoso e não se importar com seu peso. Até mesmo o modelo de nível de entrada conseguiu cruzar o limite "muito bom" em nosso ranking, principalmente graças a sua muito boa tela FHD. Finalmente, um ThinkPad que não exige que você obtenha um modelo mais caro para receber uma tela decente. Estamos particularmente interessados como o P52 se compara com seus rivais imediatos, o Precision 7530 da Dell e o ZBook 15 G5 da HP, e estamos ansiosos para analisar esses dois o mais rápido possível.
Lenovo ThinkPad P52 20MAS03N00
- 08/10/2018 v6 (old)
Benjamin Herzig
Price comparison
