Breve Análise do Portátil HP Envy 17-ce1002ng: Um máquina fina de 17 polegadas com desempenho misto
Avaliação | Data | Modelo | Peso | Altura | Size | Resolução | Preço |
|---|---|---|---|---|---|---|---|
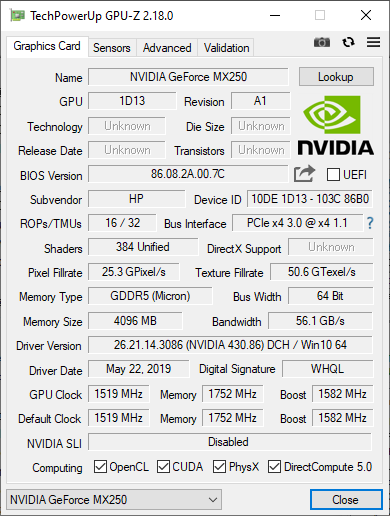
| 78.5 % v7 (old) | 11/2019 | HP Envy 17-ce1004ng i7-10510U, GeForce MX250 | 2.8 kg | 23 mm | 17.30" | 1920x1080 | |
| 83.5 % v6 (old) | 04/2019 | LG Gram 17Z990-R.AAS7U1 i7-8565U, UHD Graphics 620 | 1.3 kg | 17.8 mm | 17.00" | 2560x1600 | |
| 84 % v7 (old) | Acer Aspire 7 A715-74G-50U5 i5-9300H, GeForce GTX 1650 Mobile | 2.4 kg | 20.85 mm | 15.60" | 1920x1080 | ||
| 79.7 % v6 (old) | 08/2019 | Dell Inspiron 15 5000 5585 R7 3700U, Vega 10 | 1.8 kg | 19.5 mm | 15.60" | 1920x1080 | |
| 85.3 % v7 (old) | 10/2019 | Lenovo IdeaPad S540-15IWL 81SW0015GE i7-8565U, GeForce GTX 1650 Max-Q | 1.9 kg | 19.1 mm | 15.60" | 1920x1080 |


| SD Card Reader | |
| average JPG Copy Test (av. of 3 runs) | |
| Média da turma Multimedia (23 - 531, n=44, últimos 2 anos) | |
| Lenovo IdeaPad S540-15IWL 81SW0015GE (Toshiba Exceria Pro SDXC 64 GB UHS-II) | |
| LG Gram 17Z990-R.AAS7U1 (Toshiba Exceria Pro M501 64 GB UHS-II) | |
| HP Envy 17-ce1004ng (Toshiba Exceria Pro SDXC 64 GB UHS-II) | |
| Dell Inspiron 15 5000 5585 (Toshiba Exceria Pro SDXC 64 GB UHS-II) | |
| maximum AS SSD Seq Read Test (1GB) | |
| Média da turma Multimedia (27.9 - 1455, n=43, últimos 2 anos) | |
| Lenovo IdeaPad S540-15IWL 81SW0015GE (Toshiba Exceria Pro SDXC 64 GB UHS-II) | |
| LG Gram 17Z990-R.AAS7U1 (Toshiba Exceria Pro M501 64 GB UHS-II) | |
| HP Envy 17-ce1004ng (Toshiba Exceria Pro SDXC 64 GB UHS-II) | |
| Dell Inspiron 15 5000 5585 (Toshiba Exceria Pro SDXC 64 GB UHS-II) | |
| Networking | |
| iperf3 transmit AX12 | |
| Apple MacBook Pro 13 2019 i5 4TB3 | |
| HP Envy 17-ce1004ng | |
| iperf3 receive AX12 | |
| Apple MacBook Pro 13 2019 i5 4TB3 | |
| HP Envy 17-ce1004ng | |
| |||||||||||||||||||||||||
iluminação: 83 %
iluminação com acumulador: 280 cd/m²
Contraste: 875:1 (Preto: 0.335 cd/m²)
ΔE ColorChecker Calman: 4.79 | ∀{0.5-29.43 Ø4.72}
calibrated: 1.76
ΔE Greyscale Calman: 6.32 | ∀{0.09-98 Ø4.97}
91% sRGB (Argyll 1.6.3 3D)
59% AdobeRGB 1998 (Argyll 1.6.3 3D)
64.6% AdobeRGB 1998 (Argyll 3D)
91.5% sRGB (Argyll 3D)
63.3% Display P3 (Argyll 3D)
Gamma: 2.49
CCT: 8002 K
| HP Envy 17-ce1004ng BOE0825, IPS, 1920x1080, 17.3" | LG Gram 17Z990-R.AAS7U1 LG Philips LP170WQ1-SPA1, IPS, 2560x1600, 17" | Acer Aspire 7 A715-74G-50U5 AU Optronics B156HAN02.1, IPS, 1920x1080, 15.6" | Dell Inspiron 15 5000 5585 LG Philips 156WFC, IPS, 1920x1080, 15.6" | Lenovo IdeaPad S540-15IWL 81SW0015GE CMN N156HCE-EN1, IPS, 1920x1080, 15.6" | |
|---|---|---|---|---|---|
| Display | 3% | -38% | -40% | 0% | |
| Display P3 Coverage (%) | 63.3 | 64.2 1% | 38.3 -39% | 37.31 -41% | 64.9 3% |
| sRGB Coverage (%) | 91.5 | 96.3 5% | 57.5 -37% | 56.2 -39% | 88.7 -3% |
| AdobeRGB 1998 Coverage (%) | 64.6 | 66.3 3% | 39.57 -39% | 38.55 -40% | 64.9 0% |
| Response Times | -57% | -47% | -23% | -48% | |
| Response Time Grey 50% / Grey 80% * (ms) | 30 ? | 42 ? -40% | 41 ? -37% | 28.4 ? 5% | 39.2 ? -31% |
| Response Time Black / White * (ms) | 18 ? | 31.2 ? -73% | 28 ? -56% | 27.2 ? -51% | 29.6 ? -64% |
| PWM Frequency (Hz) | 25510 ? | ||||
| Screen | 25% | -7% | -24% | 15% | |
| Brightness middle (cd/m²) | 293 | 370.6 26% | 271 -8% | 253.6 -13% | 330 13% |
| Brightness (cd/m²) | 280 | 356 27% | 256 -9% | 227 -19% | 315 13% |
| Brightness Distribution (%) | 83 | 89 7% | 91 10% | 84 1% | 88 6% |
| Black Level * (cd/m²) | 0.335 | 0.28 16% | 0.26 22% | 0.27 19% | 0.2 40% |
| Contrast (:1) | 875 | 1324 51% | 1042 19% | 939 7% | 1650 89% |
| Colorchecker dE 2000 * | 4.79 | 3.28 32% | 3.63 24% | 6.05 -26% | 4.4 8% |
| Colorchecker dE 2000 max. * | 11.42 | 5.85 49% | 7.13 38% | 14.03 -23% | 7.4 35% |
| Colorchecker dE 2000 calibrated * | 1.76 | 1.03 41% | 4.62 -163% | 4.97 -182% | 2.7 -53% |
| Greyscale dE 2000 * | 6.32 | 4.9 22% | 2.21 65% | 3.2 49% | 4.8 24% |
| Gamma | 2.49 88% | 2.19 100% | 2.5 88% | 2 110% | 2.24 98% |
| CCT | 8002 81% | 6376 102% | 6383 102% | 6820 95% | 6760 96% |
| Color Space (Percent of AdobeRGB 1998) (%) | 59 | 60.8 3% | 36 -39% | 35.5 -40% | 57.8 -2% |
| Color Space (Percent of sRGB) (%) | 91 | 96.6 6% | 57 -37% | 55.6 -39% | 88.5 -3% |
| Média Total (Programa/Configurações) | -10% /
11% | -31% /
-18% | -29% /
-27% | -11% /
5% |
* ... menor é melhor
Exibir tempos de resposta
| ↔ Tempo de resposta preto para branco | ||
|---|---|---|
| 18 ms ... ascensão ↗ e queda ↘ combinadas | ↗ 10 ms ascensão | 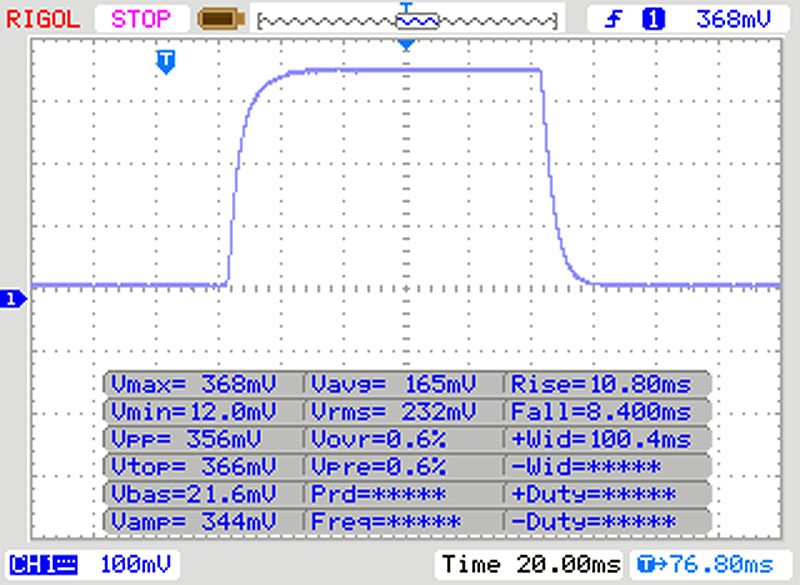 |
| ↘ 8 ms queda | ||
| A tela mostra boas taxas de resposta em nossos testes, mas pode ser muito lenta para jogadores competitivos. Em comparação, todos os dispositivos testados variam de 0.1 (mínimo) a 240 (máximo) ms. » 40 % de todos os dispositivos são melhores. Isso significa que o tempo de resposta medido é semelhante à média de todos os dispositivos testados (19.8 ms). | ||
| ↔ Tempo de resposta 50% cinza a 80% cinza | ||
| 30 ms ... ascensão ↗ e queda ↘ combinadas | ↗ 15 ms ascensão | 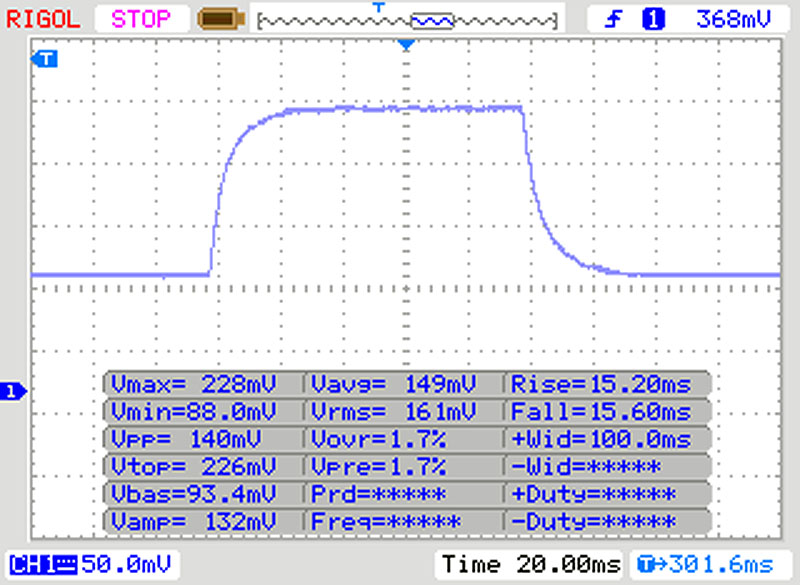 |
| ↘ 15 ms queda | ||
| A tela mostra taxas de resposta lentas em nossos testes e será insatisfatória para os jogadores. Em comparação, todos os dispositivos testados variam de 0.165 (mínimo) a 636 (máximo) ms. » 40 % de todos os dispositivos são melhores. Isso significa que o tempo de resposta medido é semelhante à média de todos os dispositivos testados (31 ms). | ||
Cintilação da tela / PWM (modulação por largura de pulso)
| Tela tremeluzindo / PWM não detectado | 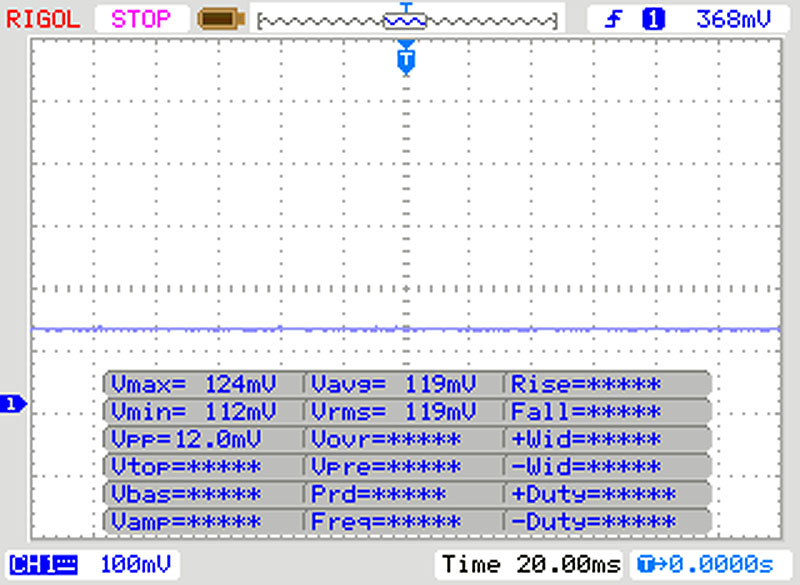 | ||
[pwm_comparison] Em comparação: 52 % de todos os dispositivos testados não usam PWM para escurecer a tela. Se PWM foi detectado, uma média de 7772 (mínimo: 5 - máximo: 343500) Hz foi medida. | |||
| Cinebench R15 | |
| CPU Single 64Bit | |
| Média da turma Multimedia (184.8 - 326, n=66, últimos 2 anos) | |
| Lenovo IdeaPad S540-15IWL 81SW0015GE | |
| HP Envy 17-ce1004ng | |
| Média Intel Core i7-10510U (113 - 202, n=42) | |
| Acer Aspire 7 A715-74G-50U5 | |
| LG Gram 17Z990-R.AAS7U1 | |
| Dell Inspiron 15 5000 5585 | |
| CPU Multi 64Bit | |
| Média da turma Multimedia (856 - 5224, n=68, últimos 2 anos) | |
| Acer Aspire 7 A715-74G-50U5 | |
| Dell Inspiron 15 5000 5585 | |
| Média Intel Core i7-10510U (482 - 856, n=45) | |
| Lenovo IdeaPad S540-15IWL 81SW0015GE | |
| HP Envy 17-ce1004ng | |
| LG Gram 17Z990-R.AAS7U1 | |
| PCMark 8 | |
| Home Score Accelerated v2 | |
| Média da turma Multimedia (n=1últimos 2 anos) | |
| Acer Aspire 7 A715-74G-50U5 | |
| Lenovo IdeaPad S540-15IWL 81SW0015GE | |
| Média Intel Core i7-10510U, NVIDIA GeForce MX250 (3214 - 3958, n=8) | |
| Dell Inspiron 15 5000 5585 | |
| HP Envy 17-ce1004ng | |
| LG Gram 17Z990-R.AAS7U1 | |
| Work Score Accelerated v2 | |
| Lenovo IdeaPad S540-15IWL 81SW0015GE | |
| HP Envy 17-ce1004ng | |
| Acer Aspire 7 A715-74G-50U5 | |
| Média Intel Core i7-10510U, NVIDIA GeForce MX250 (4599 - 5443, n=8) | |
| LG Gram 17Z990-R.AAS7U1 | |
| Dell Inspiron 15 5000 5585 | |
| PCMark 8 Home Score Accelerated v2 | 3502 pontos | |
| PCMark 8 Work Score Accelerated v2 | 5138 pontos | |
| PCMark 10 Score | 4442 pontos | |
Ajuda | ||
| HP Envy 17-ce1004ng Intel SSD 660p SSDPEKNW512G8 | LG Gram 17Z990-R.AAS7U1 Samsung SSD PM871b MZNLN256HAJQ | Acer Aspire 7 A715-74G-50U5 WDC PC SN520 SDAPNUW-512G | Dell Inspiron 15 5000 5585 WDC PC SN520 SDAPNUW-512G | Lenovo IdeaPad S540-15IWL 81SW0015GE Samsung PM981a MZVLB1T0HBLR | Média Intel SSD 660p SSDPEKNW512G8 | |
|---|---|---|---|---|---|---|
| CrystalDiskMark 5.2 / 6 | -39% | 11% | -19% | 54% | 2% | |
| Write 4K (MB/s) | 134.8 | 89.7 -33% | 113.3 -16% | 105.9 -21% | 173 28% | 136 ? 1% |
| Read 4K (MB/s) | 54.7 | 36.59 -33% | 42.7 -22% | 36.56 -33% | 51.9 -5% | 55.2 ? 1% |
| Write Seq (MB/s) | 872 | 422.4 -52% | 1457 67% | 1165 34% | 1067 22% | 926 ? 6% |
| Read Seq (MB/s) | 1447 | 454.9 -69% | 1432 -1% | 423.2 -71% | 1024 -29% | 1523 ? 5% |
| Write 4K Q32T1 (MB/s) | 392.2 | 321.1 -18% | 347.5 -11% | 332.1 -15% | 462 18% | 380 ? -3% |
| Read 4K Q32T1 (MB/s) | 331.6 | 340.1 3% | 382.6 15% | 229.3 -31% | 549 66% | 334 ? 1% |
| Write Seq Q32T1 (MB/s) | 920 | 509 -45% | 1454 58% | 1460 59% | 3011 227% | 987 ? 7% |
| Read Seq Q32T1 (MB/s) | 1723 | 545 -68% | 1726 0% | 472.5 -73% | 3520 104% | 1744 ? 1% |
| AS SSD | -28% | 77% | 20% | 167% | 1% | |
| Seq Read (MB/s) | 1620 | 454.5 -72% | 1581 -2% | 398.9 -75% | 2170 34% | 1423 ? -12% |
| Seq Write (MB/s) | 373.7 | 461 23% | 1391 272% | 884 137% | 2411 545% | 828 ? 122% |
| 4K Read (MB/s) | 53.8 | 30.18 -44% | 40.5 -25% | 34.54 -36% | 58.5 9% | 51.3 ? -5% |
| 4K Write (MB/s) | 170.3 | 71 -58% | 109.4 -36% | 82.1 -52% | 138.2 -19% | 128.9 ? -24% |
| 4K-64 Read (MB/s) | 321.5 | 369.6 15% | 1030 220% | 647 101% | 1671 420% | 326 ? 1% |
| 4K-64 Write (MB/s) | 715 | 305.5 -57% | 1278 79% | 985 38% | 1782 149% | 721 ? 1% |
| Access Time Read * (ms) | 0.081 | 0.084 -4% | 0.058 28% | 0.072 11% | 0.032 60% | 0.09003 ? -11% |
| Access Time Write * (ms) | 0.046 | 0.05 -9% | 0.037 20% | 0.047 -2% | 0.027 41% | 0.07378 ? -60% |
| Score Read (Points) | 537 | 445 -17% | 1229 129% | 721 34% | 1947 263% | 519 ? -3% |
| Score Write (Points) | 923 | 423 -54% | 1527 65% | 1155 25% | 2161 134% | 932 ? 1% |
| Score Total (Points) | 1693 | 1106 -35% | 3381 100% | 2279 35% | 5123 203% | 1708 ? 1% |
| Copy ISO MB/s (MB/s) | 816 | 939 | 862 | 1109 ? | ||
| Copy Program MB/s (MB/s) | 614 | 406.4 | 457 | 468 ? | ||
| Copy Game MB/s (MB/s) | 414.9 | 650 | 902 | 760 ? | ||
| Média Total (Programa/Configurações) | -34% /
-33% | 44% /
49% | 1% /
3% | 111% /
119% | 2% /
2% |
* ... menor é melhor

| 3DMark 11 - 1280x720 Performance GPU | |
| Média da turma Multimedia (3749 - 60002, n=62, últimos 2 anos) | |
| Acer Aspire 7 A715-74G-50U5 | |
| Lenovo IdeaPad S540-15IWL 81SW0015GE | |
| HP Envy 17-ce1004ng | |
| Média NVIDIA GeForce MX250 (3585 - 4942, n=29) | |
| Dell Inspiron 15 5000 5585 | |
| LG Gram 17Z990-R.AAS7U1 | |
| 3DMark | |
| 1280x720 Cloud Gate Standard Graphics | |
| Acer Aspire 7 A715-74G-50U5 | |
| Média da turma Multimedia (16765 - 143501, n=35, últimos 2 anos) | |
| Lenovo IdeaPad S540-15IWL 81SW0015GE | |
| HP Envy 17-ce1004ng | |
| Média NVIDIA GeForce MX250 (13805 - 23863, n=25) | |
| Dell Inspiron 15 5000 5585 | |
| LG Gram 17Z990-R.AAS7U1 | |
| 1920x1080 Fire Strike Graphics | |
| Média da turma Multimedia (2328 - 48907, n=66, últimos 2 anos) | |
| Acer Aspire 7 A715-74G-50U5 | |
| Lenovo IdeaPad S540-15IWL 81SW0015GE | |
| HP Envy 17-ce1004ng | |
| Média NVIDIA GeForce MX250 (2939 - 3885, n=29) | |
| Dell Inspiron 15 5000 5585 | |
| 2560x1440 Time Spy Graphics | |
| Média da turma Multimedia (696 - 19403, n=67, últimos 2 anos) | |
| Acer Aspire 7 A715-74G-50U5 | |
| Média NVIDIA GeForce MX250 (881 - 1169, n=22) | |
| Dell Inspiron 15 5000 5585 | |
| 3DMark 11 Performance | 5183 pontos | |
| 3DMark Cloud Gate Standard Score | 14417 pontos | |
| 3DMark Fire Strike Score | 3567 pontos | |
Ajuda | ||
| BioShock Infinite | |
| 1280x720 Very Low Preset | |
| Acer Aspire 7 A715-74G-50U5 | |
| Média NVIDIA GeForce MX250 (133.9 - 212, n=14) | |
| HP Envy 17-ce1004ng | |
| Dell Inspiron 15 5000 5585 | |
| 1366x768 Medium Preset | |
| Acer Aspire 7 A715-74G-50U5 | |
| HP Envy 17-ce1004ng | |
| Média NVIDIA GeForce MX250 (98.4 - 117.5, n=14) | |
| 1366x768 High Preset | |
| Acer Aspire 7 A715-74G-50U5 | |
| HP Envy 17-ce1004ng | |
| Média NVIDIA GeForce MX250 (84 - 100.5, n=14) | |
| 1920x1080 Ultra Preset, DX11 (DDOF) | |
| Acer Aspire 7 A715-74G-50U5 | |
| HP Envy 17-ce1004ng | |
| Média NVIDIA GeForce MX250 (32.3 - 38.1, n=14) | |
| Dell Inspiron 15 5000 5585 | |
| Final Fantasy XV Benchmark | |
| 1280x720 Lite Quality | |
| Média da turma Multimedia (21.4 - 232, n=65, últimos 2 anos) | |
| HP Envy 17-ce1004ng | |
| Média NVIDIA GeForce MX250 (33.7 - 41, n=5) | |
| 1920x1080 Standard Quality | |
| Média da turma Multimedia (11.4 - 181.1, n=66, últimos 2 anos) | |
| HP Envy 17-ce1004ng | |
| Média NVIDIA GeForce MX250 (16.4 - 19.4, n=5) | |
| 1920x1080 High Quality | |
| Média da turma Multimedia (7.61 - 144.4, n=66, últimos 2 anos) | |
| HP Envy 17-ce1004ng | |
| Média NVIDIA GeForce MX250 (9.9 - 12.2, n=4) | |
| baixo | média | alto | ultra | |
|---|---|---|---|---|
| BioShock Infinite (2013) | 166 | 116.4 | 96.3 | 37.08 |
| The Witcher 3 (2015) | 67.6 | 38.63 | 22.42 | 12.52 |
| Dota 2 Reborn (2015) | 112.3 | 102.9 | 77.4 | 63.1 |
| Final Fantasy XV Benchmark (2018) | 37.7 | 18.3 | 12.2 |
Barulho
| Ocioso |
| 30 / 30 / 30 dB |
| Carga |
| 36.4 / 36.5 dB |
 | ||
30 dB silencioso 40 dB(A) audível 50 dB(A) ruidosamente alto |
||
min: | ||
(±) A temperatura máxima no lado superior é 42.6 °C / 109 F, em comparação com a média de 36.8 °C / 98 F , variando de 21 a 71 °C para a classe Multimedia.
(+) A parte inferior aquece até um máximo de 39.3 °C / 103 F, em comparação com a média de 39.1 °C / 102 F
(+) Em uso inativo, a temperatura média para o lado superior é 25.4 °C / 78 F, em comparação com a média do dispositivo de 31.3 °C / ### class_avg_f### F.
(+) Os apoios para as mãos e o touchpad são mais frios que a temperatura da pele, com um máximo de 31.1 °C / 88 F e, portanto, são frios ao toque.
(-) A temperatura média da área do apoio para as mãos de dispositivos semelhantes foi 28.7 °C / 83.7 F (-2.4 °C / -4.3 F).
HP Envy 17-ce1004ng análise de áudio
(±) | o volume do alto-falante é médio, mas bom (###valor### dB)
Graves 100 - 315Hz
(-) | quase nenhum baixo - em média 20% menor que a mediana
(±) | a linearidade dos graves é média (10.7% delta para a frequência anterior)
Médios 400 - 2.000 Hz
(+) | médios equilibrados - apenas 3.9% longe da mediana
(±) | a linearidade dos médios é média (12.3% delta para frequência anterior)
Altos 2 - 16 kHz
(+) | agudos equilibrados - apenas 1.8% longe da mediana
(+) | os máximos são lineares (1.9% delta da frequência anterior)
Geral 100 - 16.000 Hz
(±) | a linearidade do som geral é média (18.4% diferença em relação à mediana)
Comparado com a mesma classe
» 56% de todos os dispositivos testados nesta classe foram melhores, 7% semelhantes, 37% piores
» O melhor teve um delta de 5%, a média foi 17%, o pior foi 45%
Comparado com todos os dispositivos testados
» 41% de todos os dispositivos testados foram melhores, 8% semelhantes, 52% piores
» O melhor teve um delta de 4%, a média foi 24%, o pior foi 134%
Apple MacBook 12 (Early 2016) 1.1 GHz análise de áudio
(+) | os alto-falantes podem tocar relativamente alto (###valor### dB)
Graves 100 - 315Hz
(±) | graves reduzidos - em média 11.3% menor que a mediana
(±) | a linearidade dos graves é média (14.2% delta para a frequência anterior)
Médios 400 - 2.000 Hz
(+) | médios equilibrados - apenas 2.4% longe da mediana
(+) | médios são lineares (5.5% delta para frequência anterior)
Altos 2 - 16 kHz
(+) | agudos equilibrados - apenas 2% longe da mediana
(+) | os máximos são lineares (4.5% delta da frequência anterior)
Geral 100 - 16.000 Hz
(+) | o som geral é linear (10.2% diferença em relação à mediana)
Comparado com a mesma classe
» 7% de todos os dispositivos testados nesta classe foram melhores, 2% semelhantes, 91% piores
» O melhor teve um delta de 5%, a média foi 18%, o pior foi 53%
Comparado com todos os dispositivos testados
» 5% de todos os dispositivos testados foram melhores, 1% semelhantes, 94% piores
» O melhor teve um delta de 4%, a média foi 24%, o pior foi 134%
| desligado | |
| Ocioso | |
| Carga |
|
Key:
min: | |
| HP Envy 17-ce1004ng i7-10510U, GeForce MX250, Intel SSD 660p SSDPEKNW512G8, IPS, 1920x1080, 17.3" | LG Gram 17Z990-R.AAS7U1 i7-8565U, UHD Graphics 620, Samsung SSD PM871b MZNLN256HAJQ, IPS, 2560x1600, 17" | Acer Aspire 7 A715-74G-50U5 i5-9300H, GeForce GTX 1650 Mobile, WDC PC SN520 SDAPNUW-512G, IPS, 1920x1080, 15.6" | Dell Inspiron 15 5000 5585 R7 3700U, Vega 10, WDC PC SN520 SDAPNUW-512G, IPS, 1920x1080, 15.6" | Lenovo IdeaPad S540-15IWL 81SW0015GE i7-8565U, GeForce GTX 1650 Max-Q, Samsung PM981a MZVLB1T0HBLR, IPS, 1920x1080, 15.6" | Média NVIDIA GeForce MX250 | Média da turma Multimedia | |
|---|---|---|---|---|---|---|---|
| Power Consumption | 23% | -23% | 19% | -20% | -6% | -40% | |
| Idle Minimum * (Watt) | 3.6 | 2.7 25% | 2.9 19% | 4.2 -17% | 4.2 -17% | 4.1 ? -14% | 5.64 ? -57% |
| Idle Average * (Watt) | 8.5 | 8.1 5% | 5.3 38% | 6.8 20% | 7.8 8% | 7.91 ? 7% | 10 ? -18% |
| Idle Maximum * (Watt) | 10.4 | 10.2 2% | 10.7 -3% | 7 33% | 10.2 2% | 10.4 ? -0% | 12.2 ? -17% |
| Load Average * (Watt) | 52.6 | 32.7 38% | 78 -48% | 36.5 31% | 73.6 -40% | 58.6 ? -11% | 64.8 ? -23% |
| Load Maximum * (Watt) | 61 | 34.8 43% | 135 -121% | 44 28% | 92.7 -52% | 68.9 ? -13% | 111.7 ? -83% |
| Witcher 3 ultra * (Watt) | 87 | 37.9 | 75 |
* ... menor é melhor
| HP Envy 17-ce1004ng i7-10510U, GeForce MX250, 52 Wh | LG Gram 17Z990-R.AAS7U1 i7-8565U, UHD Graphics 620, 72 Wh | Acer Aspire 7 A715-74G-50U5 i5-9300H, GeForce GTX 1650 Mobile, 58.7 Wh | Dell Inspiron 15 5000 5585 R7 3700U, Vega 10, 42 Wh | Lenovo IdeaPad S540-15IWL 81SW0015GE i7-8565U, GeForce GTX 1650 Max-Q, 70 Wh | Média da turma Multimedia | |
|---|---|---|---|---|---|---|
| Duração da bateria | 101% | 130% | 11% | 63% | 79% | |
| Reader / Idle (h) | 17 | 34.8 105% | 14.3 -16% | 25.2 ? 48% | ||
| WiFi v1.3 (h) | 4 | 11.9 198% | 9.2 130% | 7 75% | 8.8 120% | 12 ? 200% |
| Load (h) | 1.9 | 1.9 0% | 1.4 -26% | 2 5% | 1.675 ? -12% | |
| Witcher 3 ultra (h) | 1.1 |
Pro
Contra
Veredicto - Um bom portátil multimídia que poderia oferecer mais
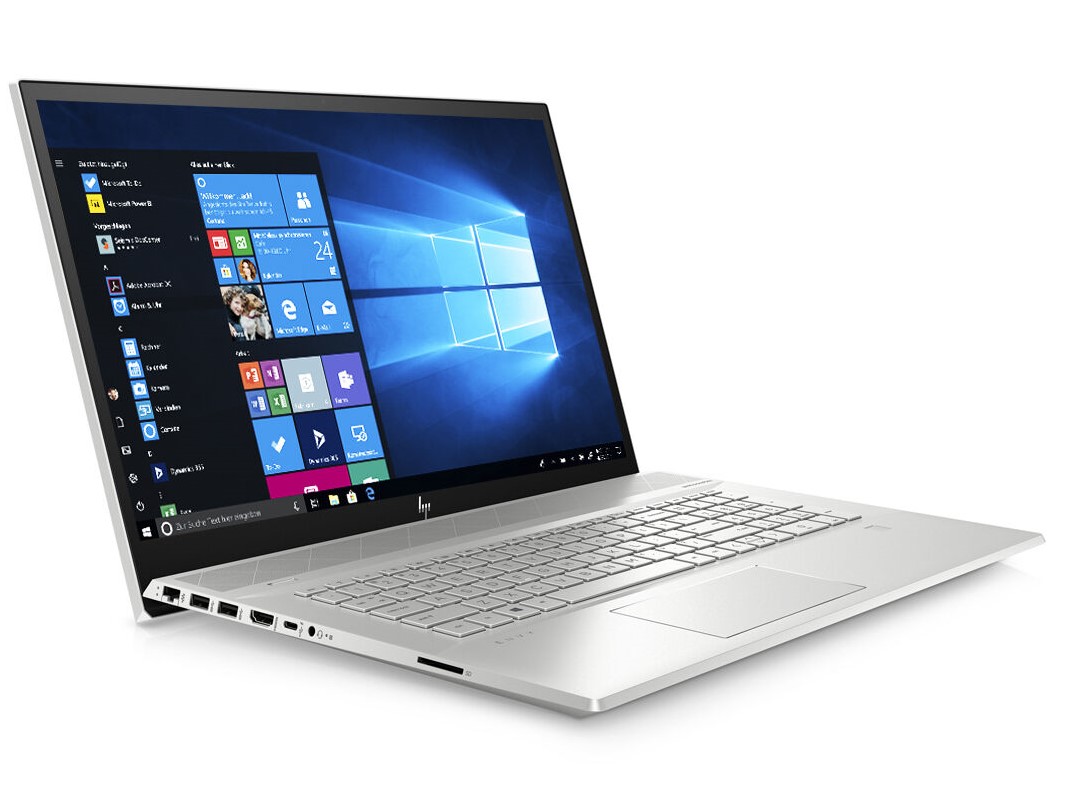
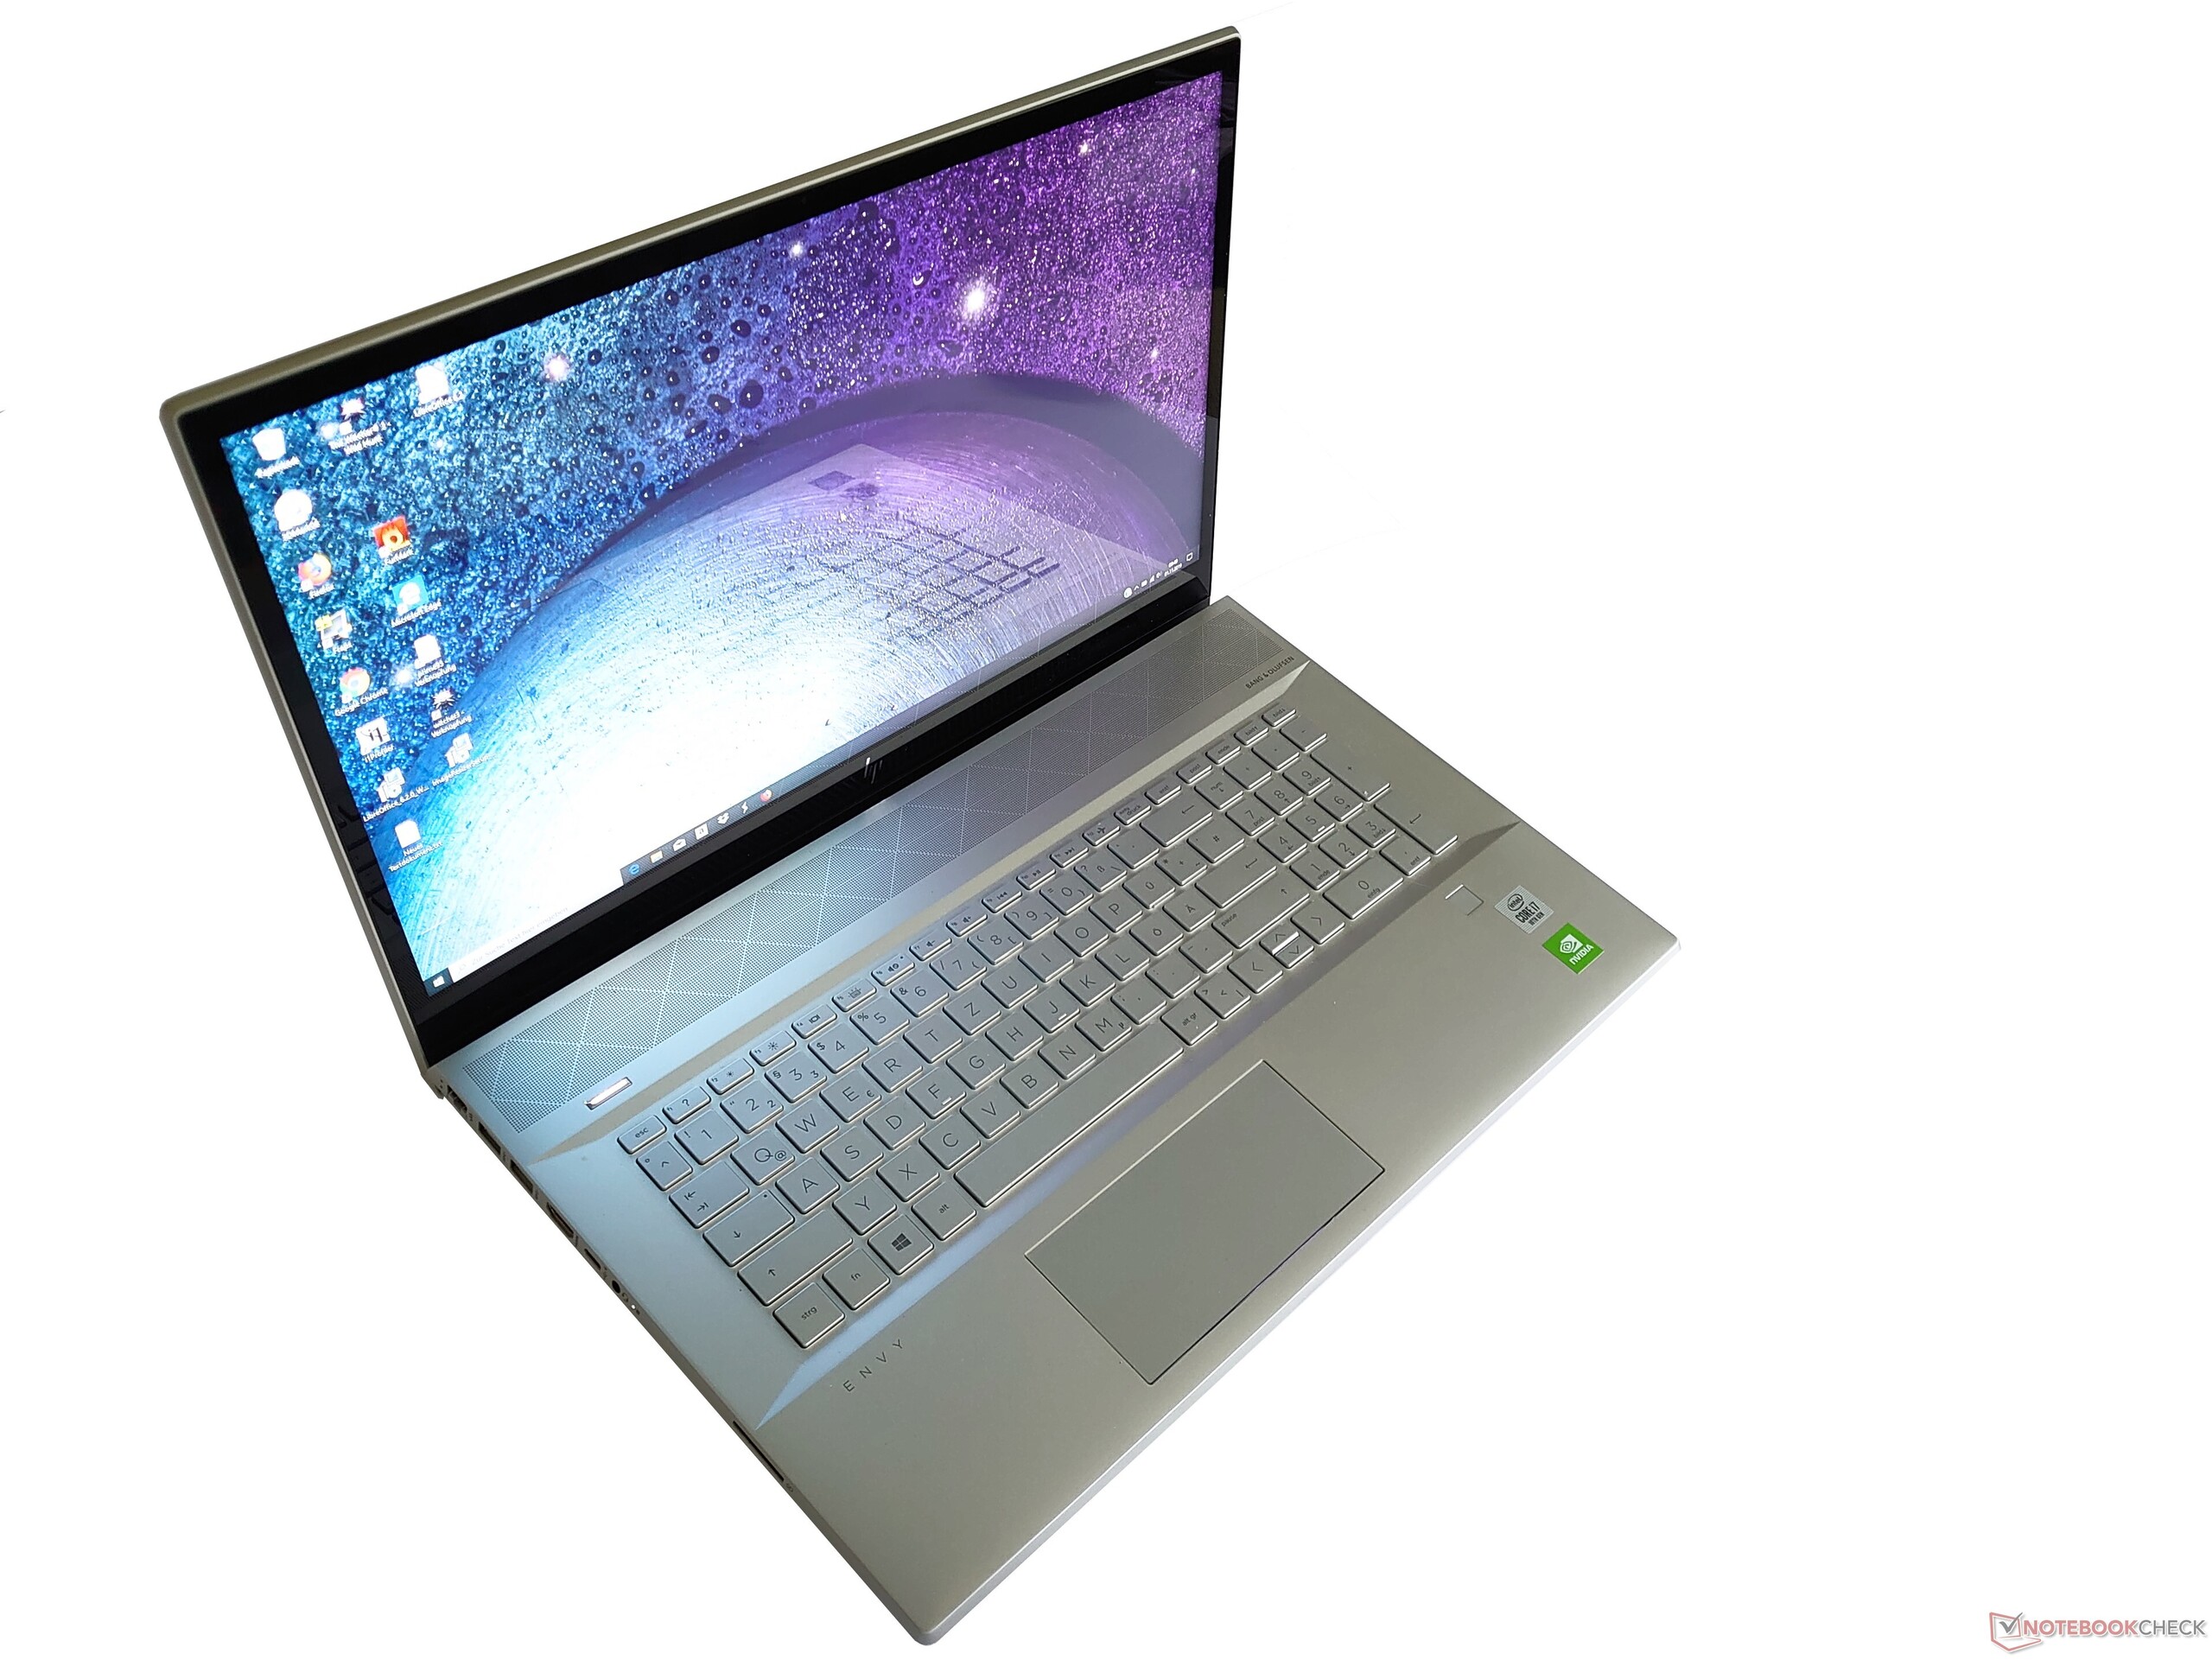
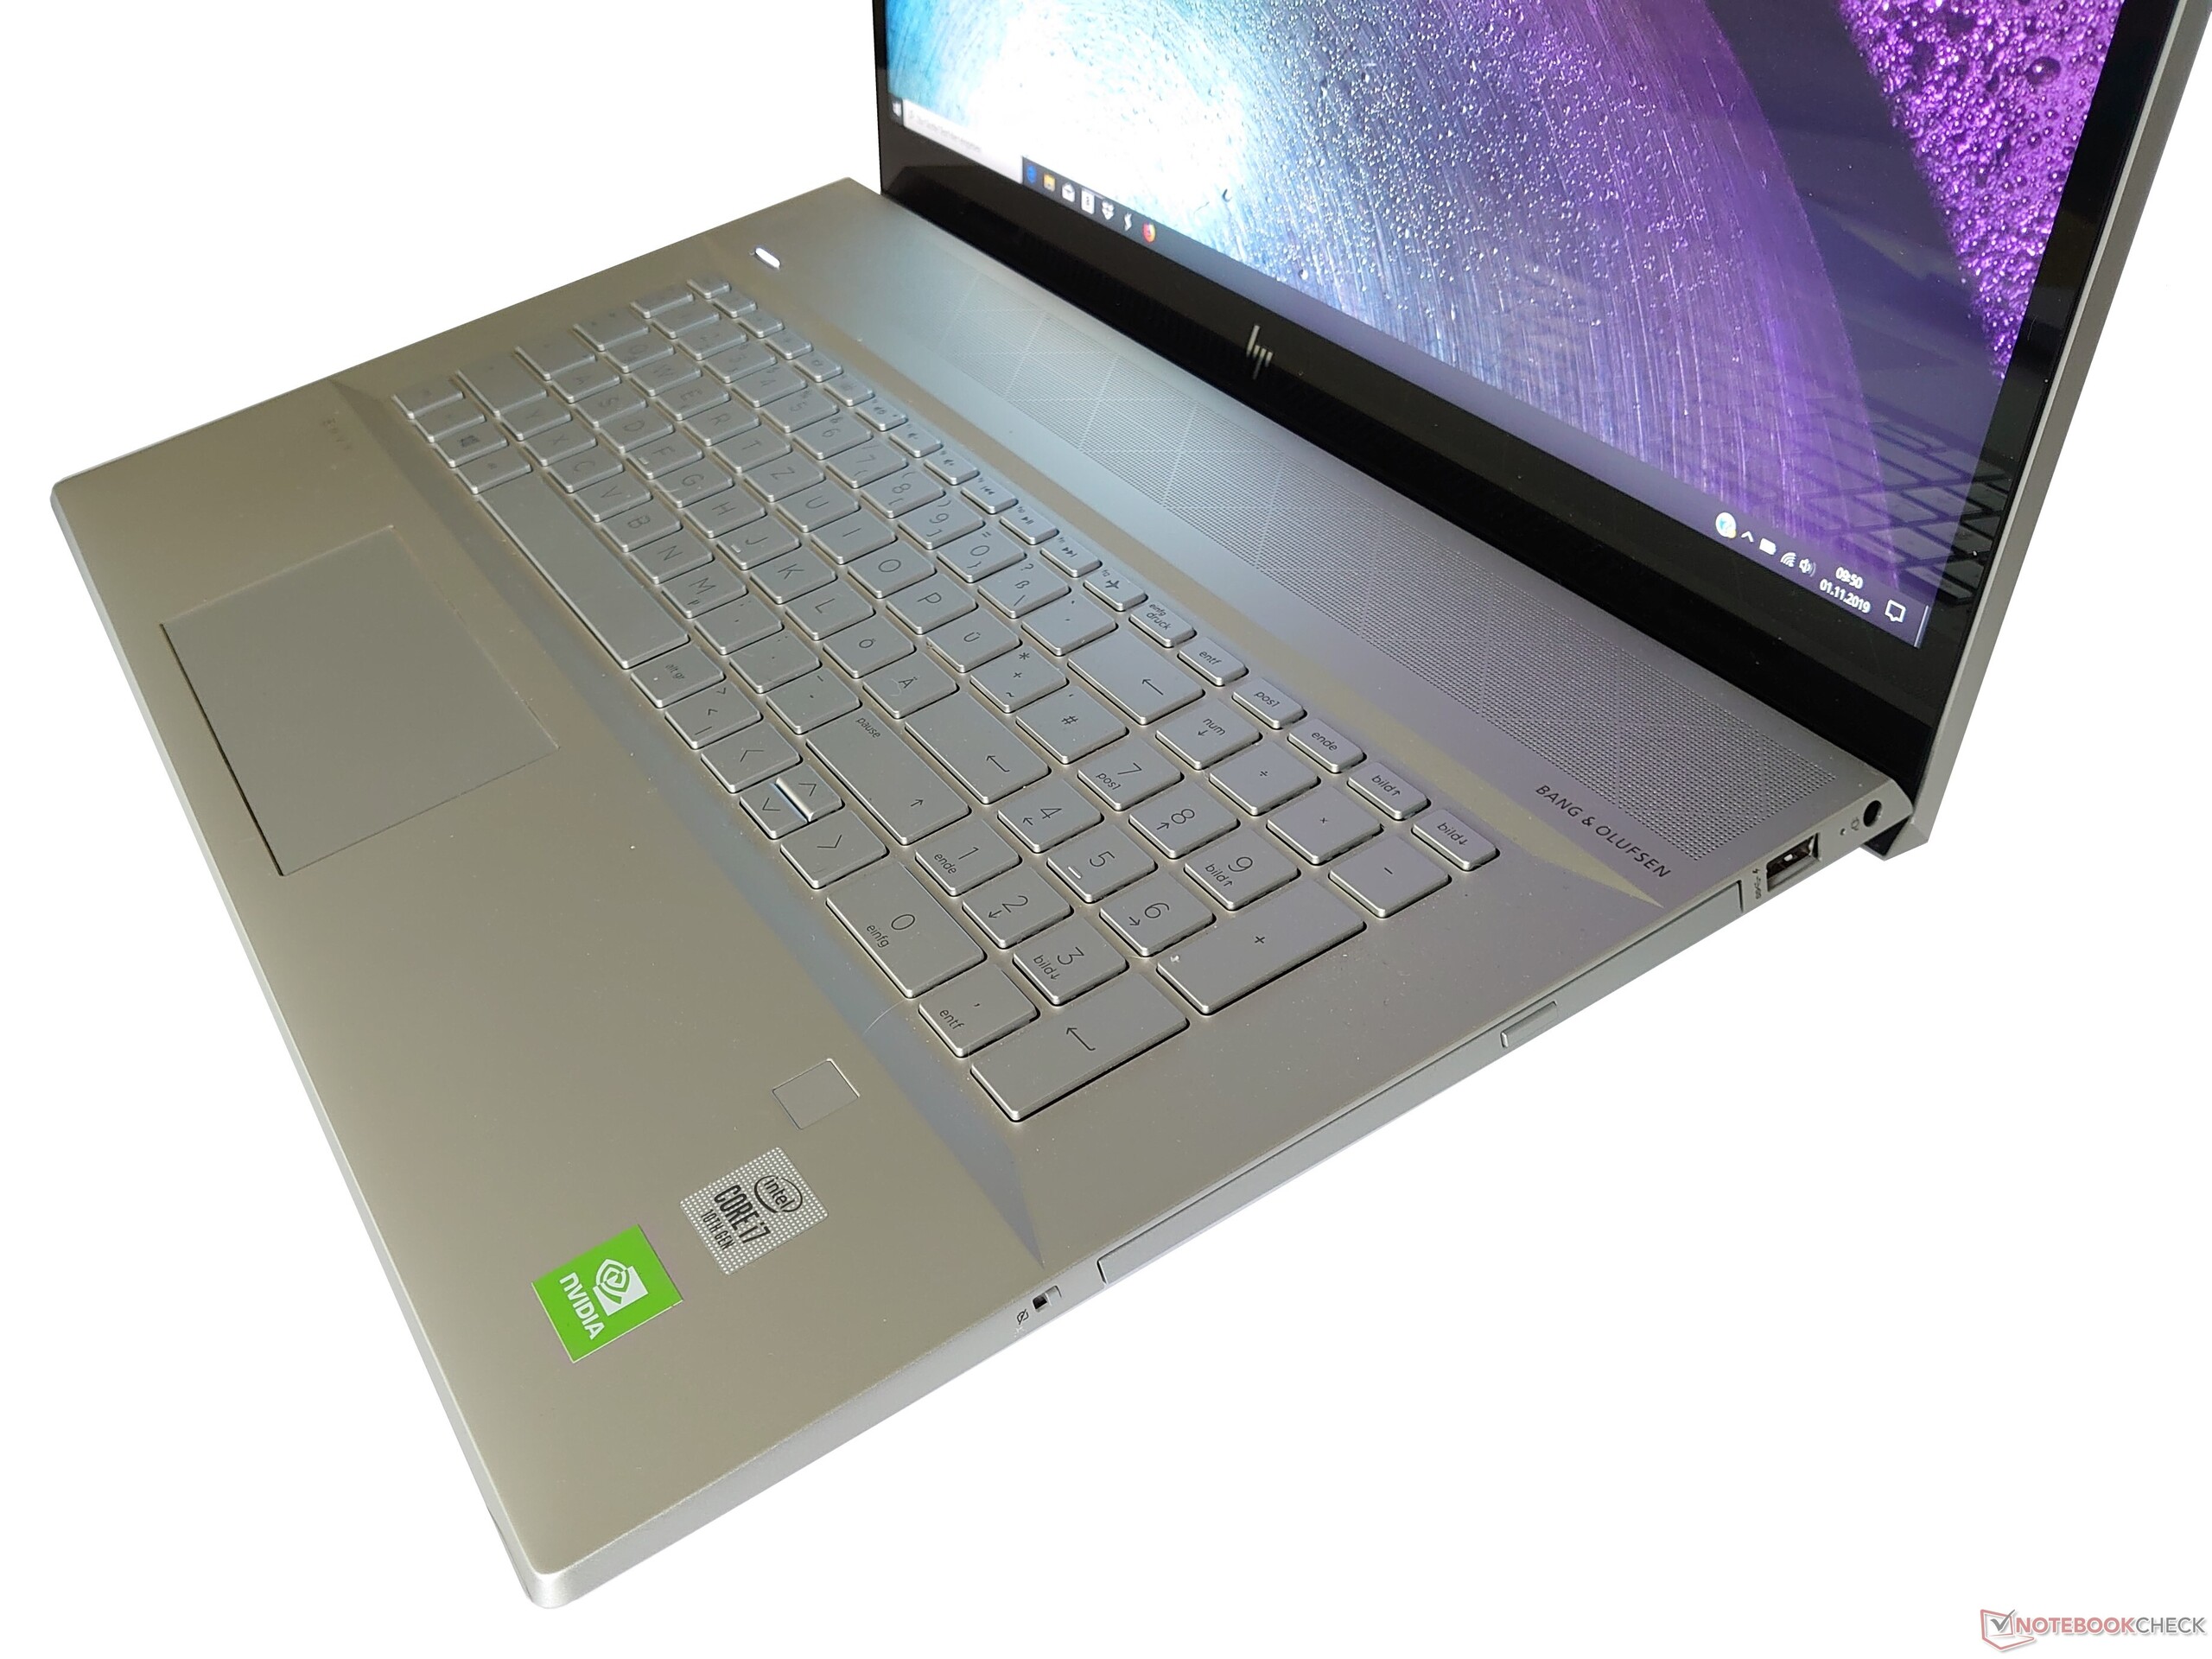
O Envy 17-ce1002ng demonstrou ser um portátil multimídia sólido durante nossos testes. O dispositivo possui um design robusto e fino em alumínio, surpreendentemente elegante para uma máquina de 17 polegadas. A HP também o equipou com dispositivos de entrada satisfatórios, enquanto o dispositivo pode fazer pleno uso de seu chip gráfico dedicado.
No entanto, o desempenho não é tão otimista. Esperávamos muito mais do Core i7-10510U aqui, pois o Envy 17 deveria ter um chassi grande o suficiente para esfriá-lo adequadamente. O processador Comet Lake-U não oferece vantagens sobre seus antecessores Whiskey Lake, o que é uma pena. Da mesma forma, enquanto somos fãs do acabamento antirreflexo que a HP aplicou na tela IPS brilhante, ela é muito escura e desbotada. Pior ainda, nossa unidade de teste sofre de um notável “bleeding" da luz de fundo.
O HP Envy 17 é um bom substituto de desktops, mas oferece apenas um desempenho insignificante melhor do que muitos portáteis de 13 polegadas.
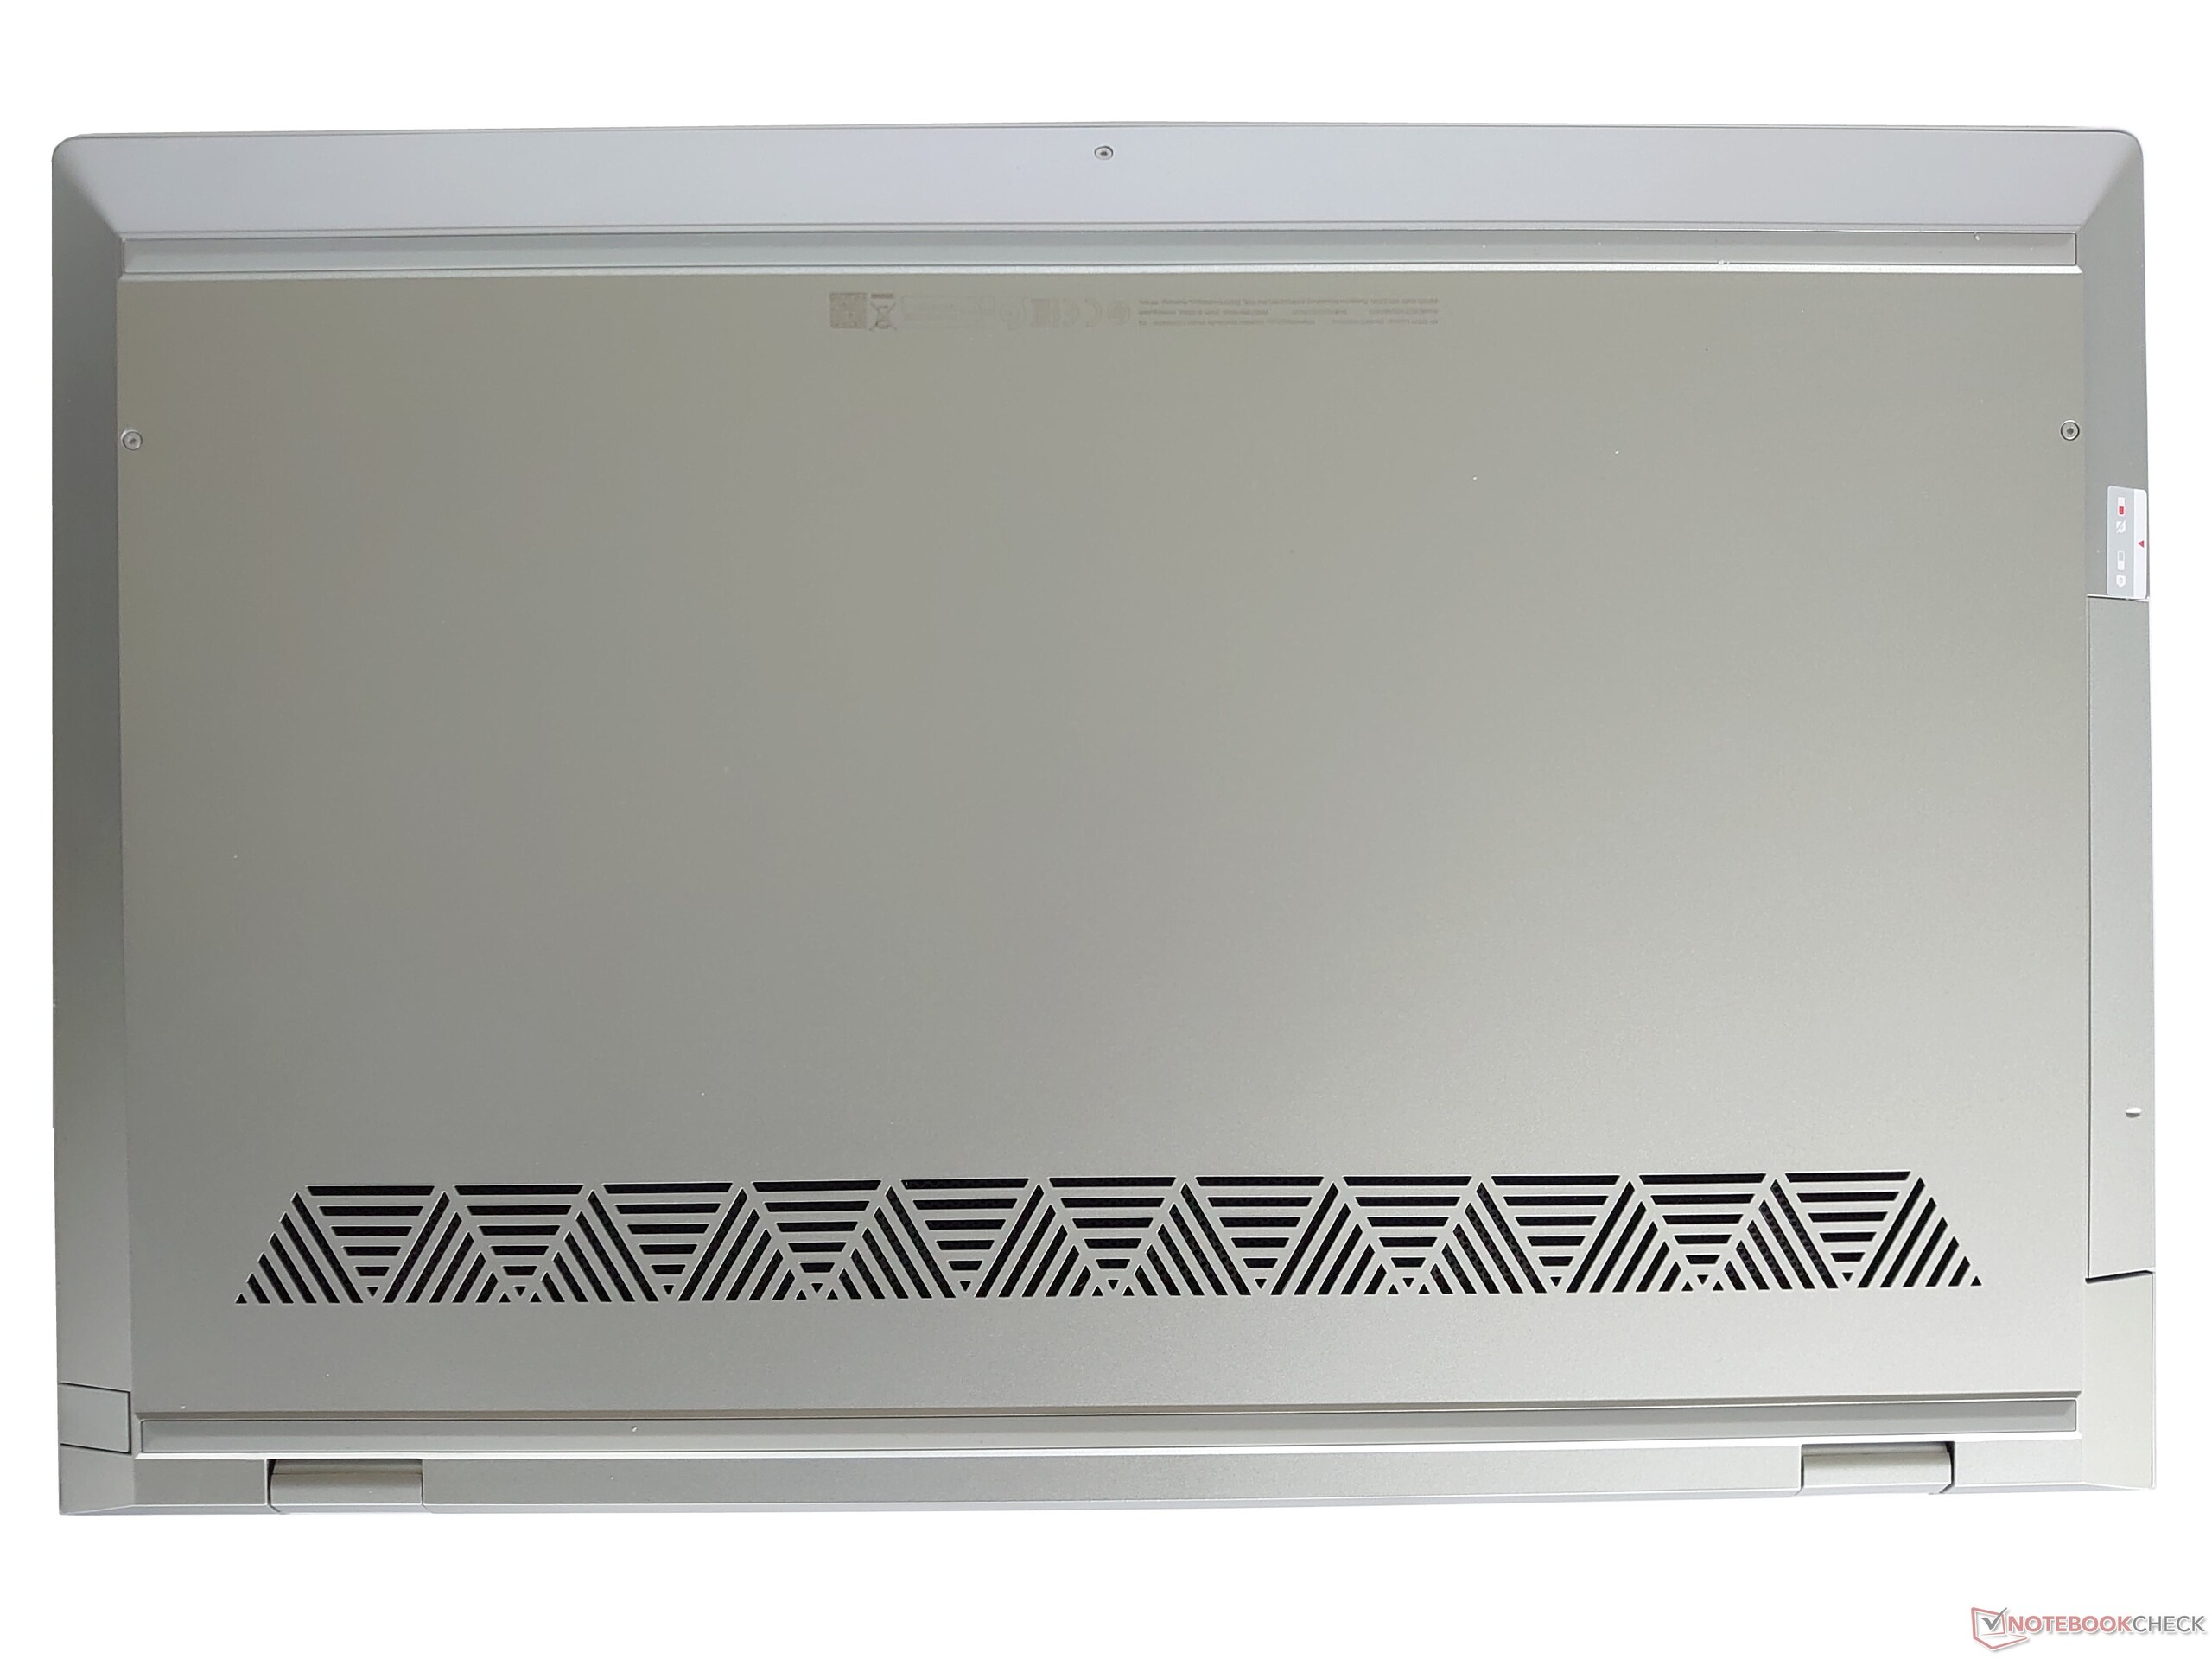
As opções limitadas de manutenção também nos decepcionaram, com a HP continuando a dificultar a remoção da tampa inferior. Quem sabe o que está fazendo não deve ter nenhum problema, mas esconder os parafusos sob uma tira de borracha fina parece excessivo. Por fim, o novo Envy 17 tem uma duração de bateria terrível, outra falha que nos deixou cambaleando. No geral, o HP Envy 17-ce1002ng é um bom candidato se você estiver procurando por um substituto de desktop, mas existem opções melhores por aí que oferecem muito mais do que o portátil HP.
HP Envy 17-ce1004ng
- 11/05/2019 v7 (old)
Mike Wobker
Price comparison
