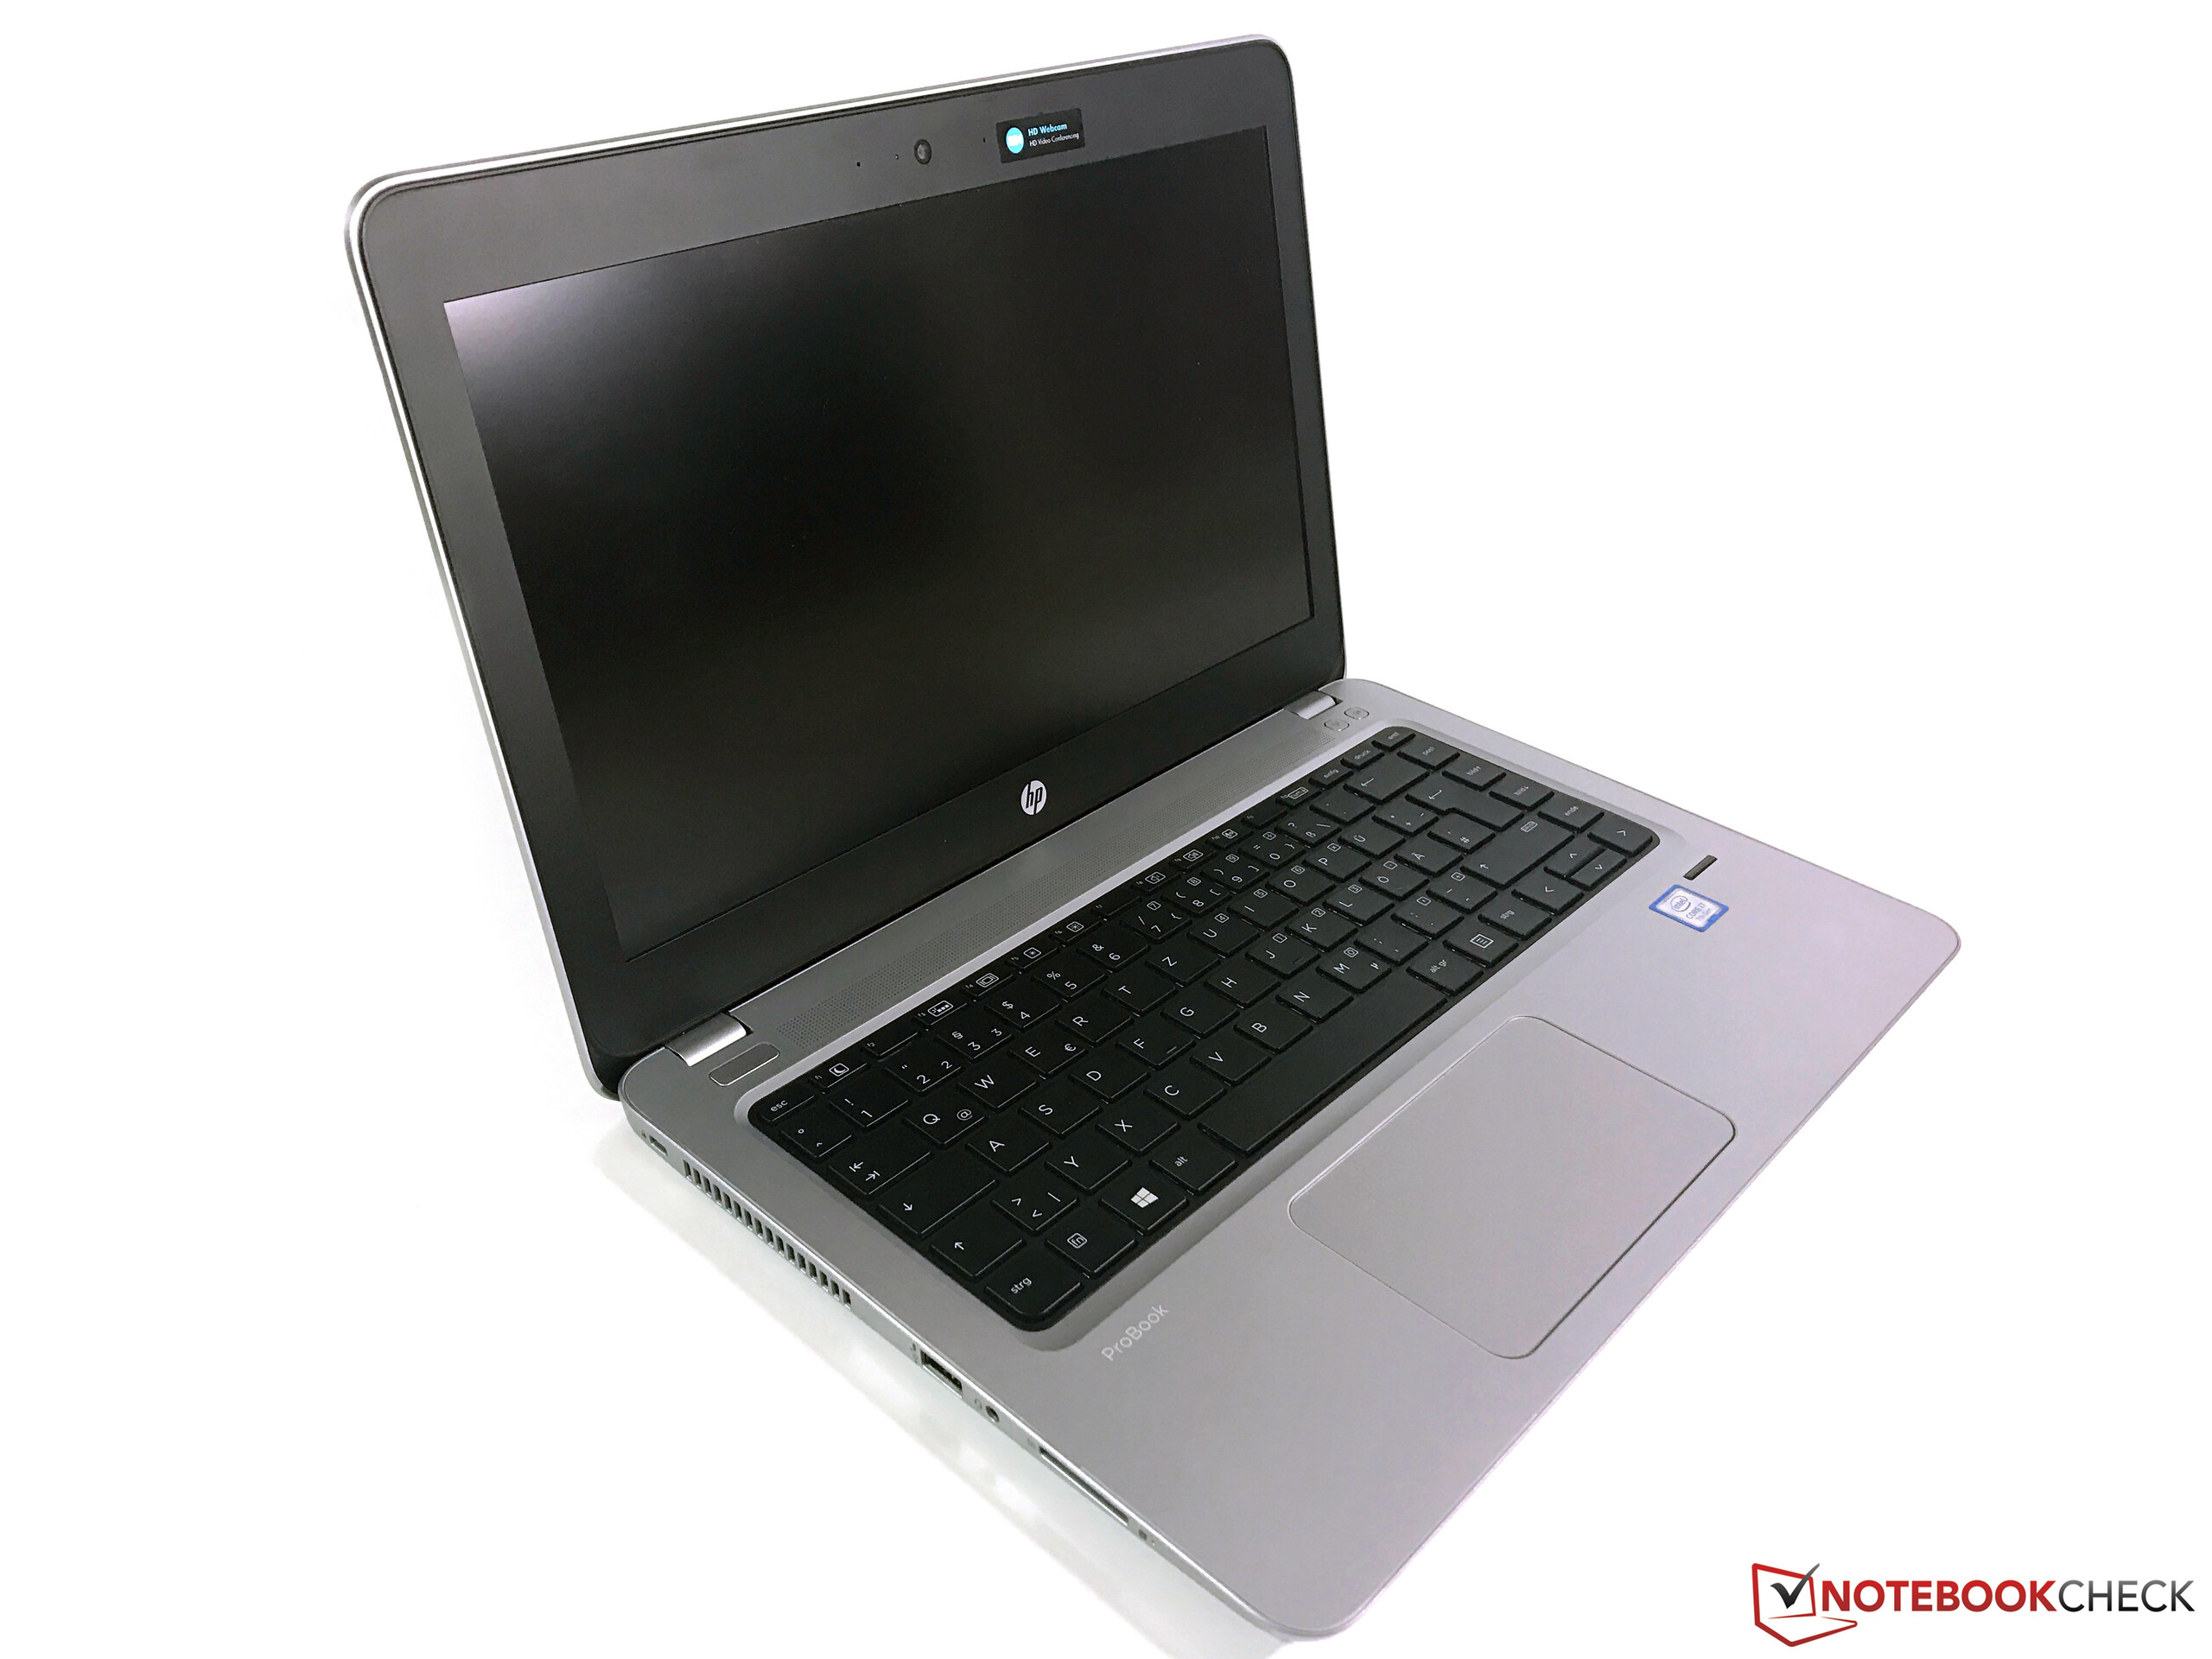
Breve Análise do Portátil HP ProBook 430 G4 (Core i7, Full HD)
| SD Card Reader | |
| average JPG Copy Test (av. of 3 runs) | |
| Dell XPS 13 9360 FHD i5 | |
| Acer Aspire S 13 S5-371-71QZ | |
| HP ProBook 430 G4-Y8B47EA | |
| Lenovo IdeaPad 710S-13ISK | |
| Lenovo ThinkPad 13-20GKS01100 | |
| maximum AS SSD Seq Read Test (1GB) | |
| Dell XPS 13 9360 FHD i5 | |
| HP ProBook 430 G4-Y8B47EA | |
| Acer Aspire S 13 S5-371-71QZ | |
| Lenovo IdeaPad 710S-13ISK | |
| Lenovo ThinkPad 13-20GKS01100 | |
| Networking | |
| iperf Server (receive) TCP 1 m | |
| HP ProBook 450 G4 Y8B60EA | |
| HP ProBook 440 G4-Y8B51EA | |
| HP ProBook 430 G4-Y8B47EA | |
| Acer Aspire S 13 S5-371-71QZ | |
| iperf Client (transmit) TCP 1 m | |
| HP ProBook 450 G4 Y8B60EA | |
| HP ProBook 440 G4-Y8B51EA | |
| HP ProBook 430 G4-Y8B47EA | |
| Acer Aspire S 13 S5-371-71QZ | |
Cintilação da tela / PWM (modulação por largura de pulso)
| Tela tremeluzindo / PWM não detectado | ||
[pwm_comparison] Em comparação: 52 % de todos os dispositivos testados não usam PWM para escurecer a tela. Se PWM foi detectado, uma média de 7748 (mínimo: 5 - máximo: 343500) Hz foi medida. | ||
| |||||||||||||||||||||||||
iluminação: 92 %
iluminação com acumulador: 252 cd/m²
Contraste: 791:1 (Preto: 0.32 cd/m²)
ΔE ColorChecker Calman: 5.28 | ∀{0.5-29.43 Ø4.71}
ΔE Greyscale Calman: 3.8 | ∀{0.09-98 Ø4.96}
57.6% sRGB (Argyll 1.6.3 3D)
36.7% AdobeRGB 1998 (Argyll 1.6.3 3D)
39.85% AdobeRGB 1998 (Argyll 3D)
57.8% sRGB (Argyll 3D)
38.55% Display P3 (Argyll 3D)
Gamma: 2.3
CCT: 6646 K
| HP ProBook 430 G4-Y8B47EA LGD052D, , 1920x1080, 13.3" | Acer Aspire S 13 S5-371-71QZ AUO B133HAN04.1, , 1920x1080, 13.3" | Dell XPS 13 9360 FHD i5 Sharp SHP1449 LQ133M1, , 1920x1080, 13.3" | Lenovo IdeaPad 710S-13ISK Sharp SHP 1447 / LQ133M1JW15, , 1920x1080, 13.3" | Lenovo ThinkPad 13-20GKS01100 LP133WF2-SPL1, , 1920x1080, 13.3" | HP ProBook 430 G3 P5T00ES Samsung, , 1366x768, 13.3" | |
|---|---|---|---|---|---|---|
| Display | 27% | 71% | -1% | -7% | ||
| Display P3 Coverage (%) | 38.55 | 48.94 27% | 66.4 72% | 38.35 -1% | 35.87 -7% | |
| sRGB Coverage (%) | 57.8 | 73.3 27% | 97.5 69% | 57.4 -1% | 54 -7% | |
| AdobeRGB 1998 Coverage (%) | 39.85 | 50.5 27% | 68.4 72% | 39.66 0% | 37.06 -7% | |
| Response Times | -15% | -2% | -7% | -2% | -26% | |
| Response Time Grey 50% / Grey 80% * (ms) | 42.4 ? | 50 ? -18% | 32.8 ? 23% | 52.4 ? -24% | 43.2 ? -2% | 54.4 ? -28% |
| Response Time Black / White * (ms) | 26.4 ? | 29.6 ? -12% | 33.2 ? -26% | 23.6 ? 11% | 26.8 ? -2% | 32.8 ? -24% |
| PWM Frequency (Hz) | 220 ? | 192 ? | ||||
| Screen | 24% | 22% | 18% | 3% | -68% | |
| Brightness middle (cd/m²) | 253 | 375 48% | 351.2 39% | 344 36% | 233 -8% | 212 -16% |
| Brightness (cd/m²) | 249 | 358 44% | 325 31% | 326 31% | 227 -9% | 205 -18% |
| Brightness Distribution (%) | 92 | 87 -5% | 89 -3% | 87 -5% | 86 -7% | 90 -2% |
| Black Level * (cd/m²) | 0.32 | 0.39 -22% | 0.195 39% | 0.36 -13% | 0.22 31% | 0.71 -122% |
| Contrast (:1) | 791 | 962 22% | 1801 128% | 956 21% | 1059 34% | 299 -62% |
| Colorchecker dE 2000 * | 5.28 | 4.6 13% | 7.4 -40% | 6.09 -15% | 5.41 -2% | 12.06 -128% |
| Colorchecker dE 2000 max. * | 13.66 | 8.8 36% | 9.08 34% | 10 27% | 13.61 -0% | |
| Greyscale dE 2000 * | 3.8 | 4 -5% | 6.71 -77% | 5.36 -41% | 4.15 -9% | 13.41 -253% |
| Gamma | 2.3 96% | 2.34 94% | 2.74 80% | 2.01 109% | 2.45 90% | 2.41 91% |
| CCT | 6646 98% | 7304 89% | 7222 90% | 7230 90% | 6773 96% | 15382 42% |
| Color Space (Percent of AdobeRGB 1998) (%) | 36.7 | 57.9 58% | 50.48 38% | 62.25 70% | 36.52 0% | 34.3 -7% |
| Color Space (Percent of sRGB) (%) | 57.6 | 88.7 54% | 73.31 27% | 97.54 69% | 57.16 -1% | 54.2 -6% |
| Média Total (Programa/Configurações) | 5% /
18% | 16% /
20% | 27% /
25% | 0% /
2% | -34% /
-49% |
* ... menor é melhor
Exibir tempos de resposta
| ↔ Tempo de resposta preto para branco | ||
|---|---|---|
| 26.4 ms ... ascensão ↗ e queda ↘ combinadas | ↗ 6.4 ms ascensão | 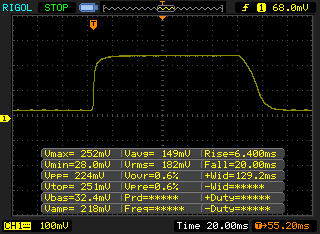 |
| ↘ 20 ms queda | ||
| A tela mostra taxas de resposta relativamente lentas em nossos testes e pode ser muito lenta para os jogadores. Em comparação, todos os dispositivos testados variam de 0.1 (mínimo) a 240 (máximo) ms. » 66 % de todos os dispositivos são melhores. Isso significa que o tempo de resposta medido é pior que a média de todos os dispositivos testados (19.8 ms). | ||
| ↔ Tempo de resposta 50% cinza a 80% cinza | ||
| 42.4 ms ... ascensão ↗ e queda ↘ combinadas | ↗ 15.6 ms ascensão | 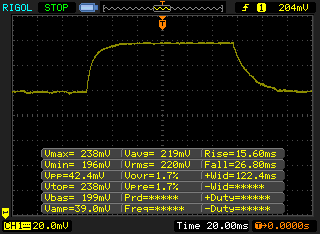 |
| ↘ 26.8 ms queda | ||
| A tela mostra taxas de resposta lentas em nossos testes e será insatisfatória para os jogadores. Em comparação, todos os dispositivos testados variam de 0.165 (mínimo) a 636 (máximo) ms. » 70 % de todos os dispositivos são melhores. Isso significa que o tempo de resposta medido é pior que a média de todos os dispositivos testados (30.9 ms). | ||
| HP ProBook 430 G4-Y8B47EA SanDisk SD8SNAT256G1002 | Acer Aspire S 13 S5-371-71QZ LiteOn CV1-8B512 | Dell XPS 13 9360 FHD i5 Toshiba NVMe THNSN5256GPUK | Lenovo IdeaPad 710S-13ISK Samsung PM951 NVMe MZVLV256 | Lenovo ThinkPad 13-20GKS01100 Samsung SSD PM871 MZNLN256HCHP | |
|---|---|---|---|---|---|
| CrystalDiskMark 3.0 | 27% | 109% | 92% | 26% | |
| Read Seq (MB/s) | 505 | 502 -1% | 1233 144% | 1193 136% | 461.7 -9% |
| Write Seq (MB/s) | 328.9 | 418.9 27% | 733 123% | 309.6 -6% | 297.8 -9% |
| Read 512 (MB/s) | 313.6 | 341.3 9% | 1036 230% | 613 95% | 351.6 12% |
| Write 512 (MB/s) | 301 | 389.7 29% | 439.9 46% | 311 3% | 298.4 -1% |
| Read 4k (MB/s) | 21.69 | 29.69 37% | 29.31 35% | 42.43 96% | 31.85 47% |
| Write 4k (MB/s) | 80.4 | 86.8 8% | 116.9 45% | 144.9 80% | 68.5 -15% |
| Read 4k QD32 (MB/s) | 132.2 | 301.3 128% | 479.2 262% | 549 315% | 360.9 173% |
| Write 4k QD32 (MB/s) | 258.8 | 211.2 -18% | 218.3 -16% | 311.3 20% | 276.2 7% |

| PCMark 7 Score | 5333 pontos | |
| PCMark 8 Home Score Accelerated v2 | 3554 pontos | |
| PCMark 8 Creative Score Accelerated v2 | 4588 pontos | |
| PCMark 8 Work Score Accelerated v2 | 4717 pontos | |
Ajuda | ||
| 3DMark 11 - 1280x720 Performance GPU | |
| HP ProBook 440 G4-Y8B51EA | |
| Lenovo IdeaPad 710S-13ISK | |
| Lenovo Ideapad 310-15ISK | |
| Dell XPS 13 9360 FHD i5 | |
| HP ProBook 430 G4-Y8B47EA | |
| Acer Aspire S 13 S5-371-71QZ | |
| Lenovo ThinkPad 13-20GKS01100 | |
| 3DMark | |
| 1280x720 Cloud Gate Standard Graphics | |
| Lenovo IdeaPad 710S-13ISK | |
| HP ProBook 440 G4-Y8B51EA | |
| Dell XPS 13 9360 FHD i5 | |
| HP ProBook 430 G4-Y8B47EA | |
| Lenovo ThinkPad 13-20GKS01100 | |
| 1920x1080 Fire Strike Graphics | |
| HP ProBook 440 G4-Y8B51EA | |
| Dell XPS 13 9360 FHD i5 | |
| Acer Aspire S 13 S5-371-71QZ | |
| HP ProBook 430 G4-Y8B47EA | |
| Lenovo ThinkPad 13-20GKS01100 | |
| 3DMark 11 Performance | 1569 pontos | |
| 3DMark Cloud Gate Standard Score | 5520 pontos | |
| 3DMark Fire Strike Score | 719 pontos | |
Ajuda | ||
| baixo | média | alto | ultra | |
|---|---|---|---|---|
| Tomb Raider (2013) | 67.6 | 34.3 | 20 | 9.8 |
| BioShock Infinite (2013) | 42.6 | 25.1 | 20.3 | 6.5 |
| The Witcher 3 (2015) | 13.3 |
Barulho
| Ocioso |
| 29.1 / 29.1 / 29.1 dB |
| HDD |
| 29.8 dB |
| Carga |
| 33.4 / 36 dB |
 | ||
30 dB silencioso 40 dB(A) audível 50 dB(A) ruidosamente alto |
||
min: | ||
(+) A temperatura máxima no lado superior é 38.7 °C / 102 F, em comparação com a média de 34.3 °C / 94 F , variando de 21.2 a 62.5 °C para a classe Office.
(+) A parte inferior aquece até um máximo de 39.4 °C / 103 F, em comparação com a média de 36.8 °C / 98 F
(+) Em uso inativo, a temperatura média para o lado superior é 27.2 °C / 81 F, em comparação com a média do dispositivo de 29.5 °C / ### class_avg_f### F.
(+) Os apoios para as mãos e o touchpad são mais frios que a temperatura da pele, com um máximo de 26.8 °C / 80.2 F e, portanto, são frios ao toque.
(±) A temperatura média da área do apoio para as mãos de dispositivos semelhantes foi 27.5 °C / 81.5 F (+0.7 °C / 1.3 F).
HP ProBook 430 G4-Y8B47EA análise de áudio
(+) | os alto-falantes podem tocar relativamente alto (###valor### dB)
Graves 100 - 315Hz
(-) | quase nenhum baixo - em média 19.7% menor que a mediana
(±) | a linearidade dos graves é média (13.1% delta para a frequência anterior)
Médios 400 - 2.000 Hz
(+) | médios equilibrados - apenas 3.8% longe da mediana
(+) | médios são lineares (6.8% delta para frequência anterior)
Altos 2 - 16 kHz
(±) | máximos mais altos - em média 5.7% maior que a mediana
(+) | os máximos são lineares (5.4% delta da frequência anterior)
Geral 100 - 16.000 Hz
(±) | a linearidade do som geral é média (18.9% diferença em relação à mediana)
Comparado com a mesma classe
» 36% de todos os dispositivos testados nesta classe foram melhores, 7% semelhantes, 57% piores
» O melhor teve um delta de 7%, a média foi 21%, o pior foi 53%
Comparado com todos os dispositivos testados
» 44% de todos os dispositivos testados foram melhores, 8% semelhantes, 48% piores
» O melhor teve um delta de 4%, a média foi 23%, o pior foi 134%
Acer Aspire S 13 S5-371-71QZ análise de áudio
(±) | o volume do alto-falante é médio, mas bom (###valor### dB)
Graves 100 - 315Hz
(±) | graves reduzidos - em média 9.8% menor que a mediana
(±) | a linearidade dos graves é média (11.9% delta para a frequência anterior)
Médios 400 - 2.000 Hz
(±) | médios mais altos - em média 6.2% maior que a mediana
(±) | a linearidade dos médios é média (7.6% delta para frequência anterior)
Altos 2 - 16 kHz
(+) | agudos equilibrados - apenas 3.1% longe da mediana
(+) | os máximos são lineares (4.6% delta da frequência anterior)
Geral 100 - 16.000 Hz
(±) | a linearidade do som geral é média (17.2% diferença em relação à mediana)
Comparado com a mesma classe
» 44% de todos os dispositivos testados nesta classe foram melhores, 9% semelhantes, 47% piores
» O melhor teve um delta de 5%, a média foi 18%, o pior foi 53%
Comparado com todos os dispositivos testados
» 32% de todos os dispositivos testados foram melhores, 8% semelhantes, 60% piores
» O melhor teve um delta de 4%, a média foi 23%, o pior foi 134%
| desligado | |
| Ocioso | |
| Carga |
|
Key:
min: | |
| HP ProBook 430 G4-Y8B47EA i7-7500U, HD Graphics 620 | Acer Aspire S 13 S5-371-71QZ 6500U, HD Graphics 520 | Dell XPS 13 9360 FHD i5 i5-7200U, HD Graphics 620 | Lenovo IdeaPad 710S-13ISK 6560U, Iris Graphics 540 | Lenovo ThinkPad 13-20GKS01100 6200U, HD Graphics 520 | |
|---|---|---|---|---|---|
| Power Consumption | 2% | 24% | -7% | 18% | |
| Idle Minimum * (Watt) | 4.2 | 4.1 2% | 4.1 2% | 3.3 21% | 3.1 26% |
| Idle Average * (Watt) | 6.5 | 6.7 -3% | 4.2 35% | 7.4 -14% | 5.5 15% |
| Idle Maximum * (Watt) | 7.2 | 7.4 -3% | 5.1 29% | 8.2 -14% | 6 17% |
| Load Average * (Watt) | 28.7 | 32.4 -13% | 22.1 23% | 36.5 -27% | 25.8 10% |
| Load Maximum * (Watt) | 43.5 | 32.4 26% | 29.4 32% | 43.7 -0% | 33.6 23% |
* ... menor é melhor
| HP ProBook 430 G4-Y8B47EA i7-7500U, HD Graphics 620, 48 Wh | Acer Aspire S 13 S5-371-71QZ 6500U, HD Graphics 520, 45 Wh | Dell XPS 13 9360 FHD i5 i5-7200U, HD Graphics 620, 60 Wh | Lenovo IdeaPad 710S-13ISK 6560U, Iris Graphics 540, 46 Wh | Lenovo ThinkPad 13-20GKS01100 6200U, HD Graphics 520, 42 Wh | HP ProBook 430 G3 P5T00ES 6200U, HD Graphics 520, 44 Wh | |
|---|---|---|---|---|---|---|
| Duração da bateria | -7% | 29% | -18% | -12% | -33% | |
| Reader / Idle (h) | 15.9 | 17.1 8% | 21.6 36% | 13.5 -15% | 15.7 -1% | 7.5 -53% |
| H.264 (h) | 8.7 | 8.1 -7% | 7.8 -10% | 5.6 -36% | ||
| WiFi v1.3 (h) | 7.2 | 7.9 10% | 11.3 57% | 7 -3% | 6.2 -14% | 6.3 -12% |
| Load (h) | 2.8 | 1.7 -39% | 2.6 -7% | 1.5 -46% | 2.2 -21% | 2 -29% |
Pro
Contra
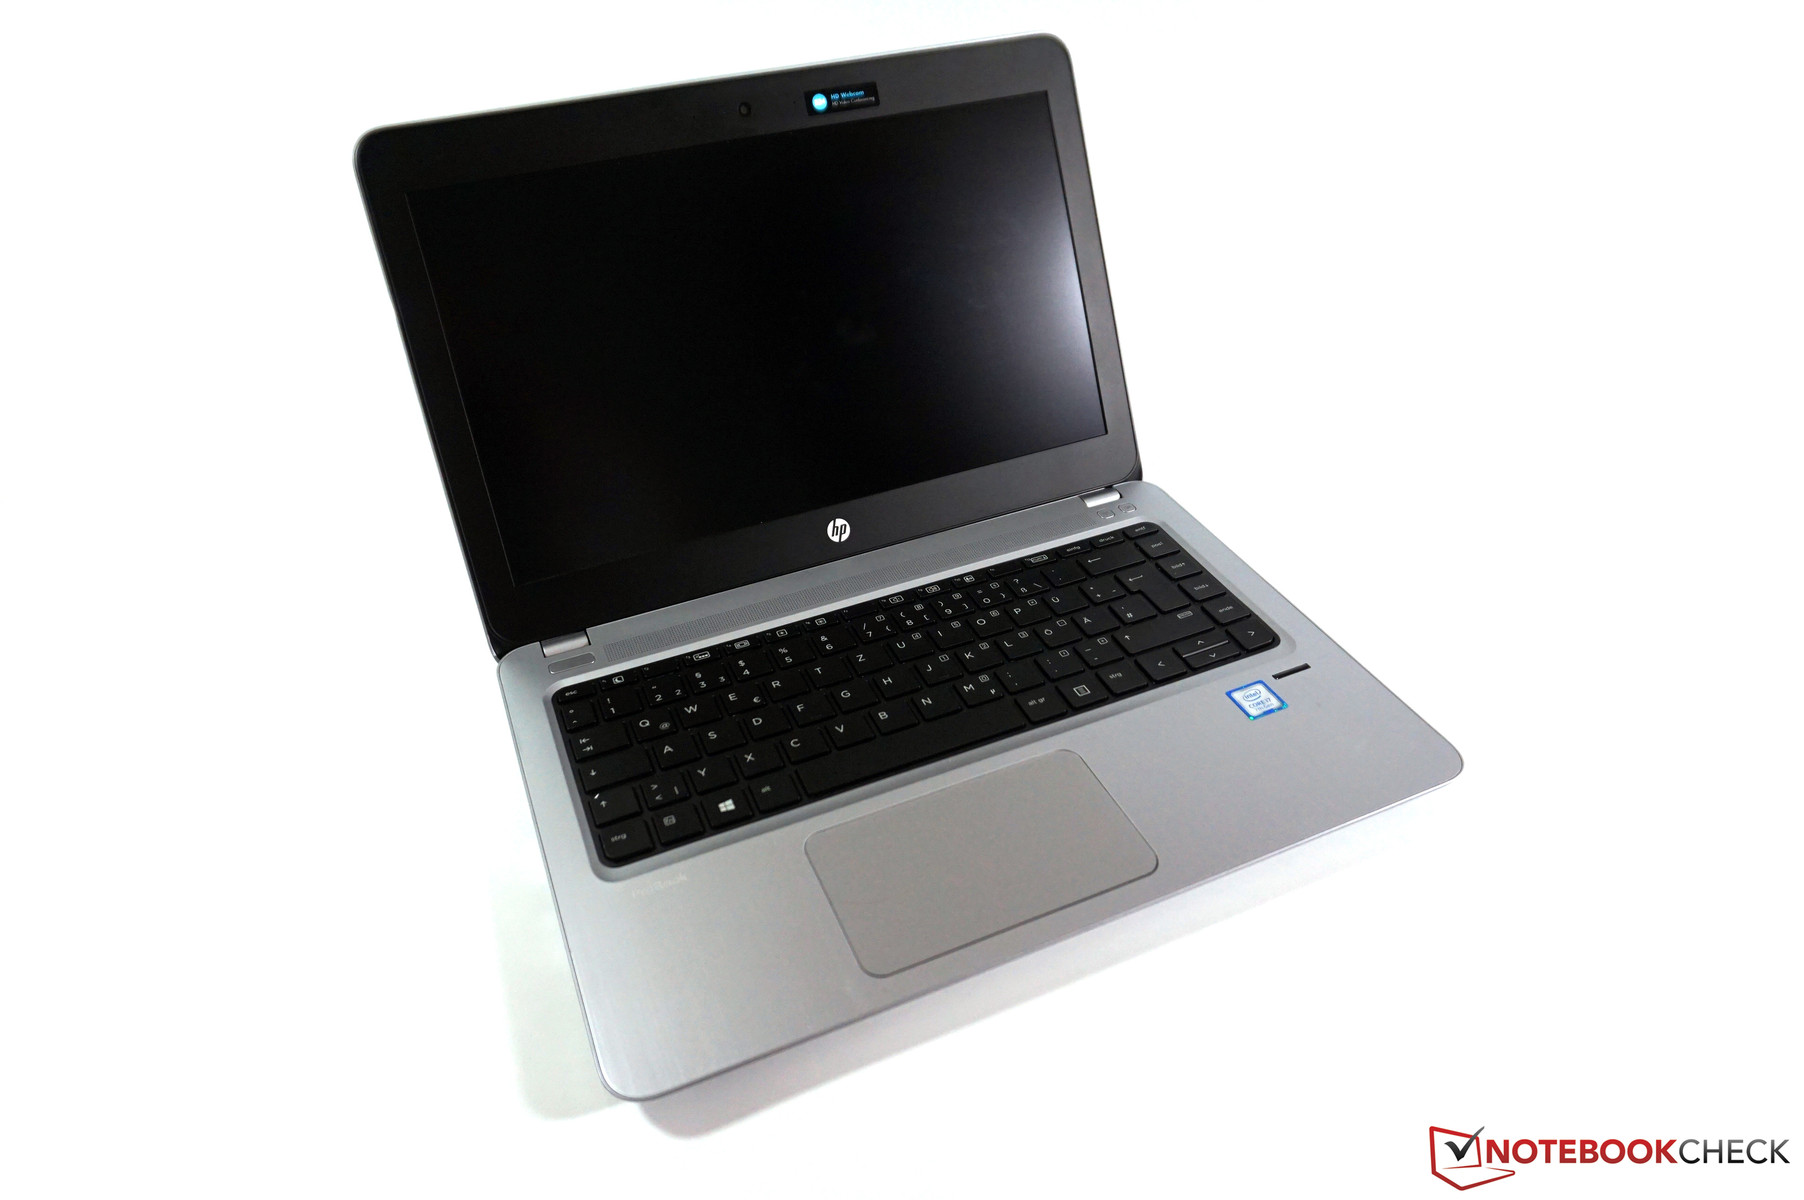
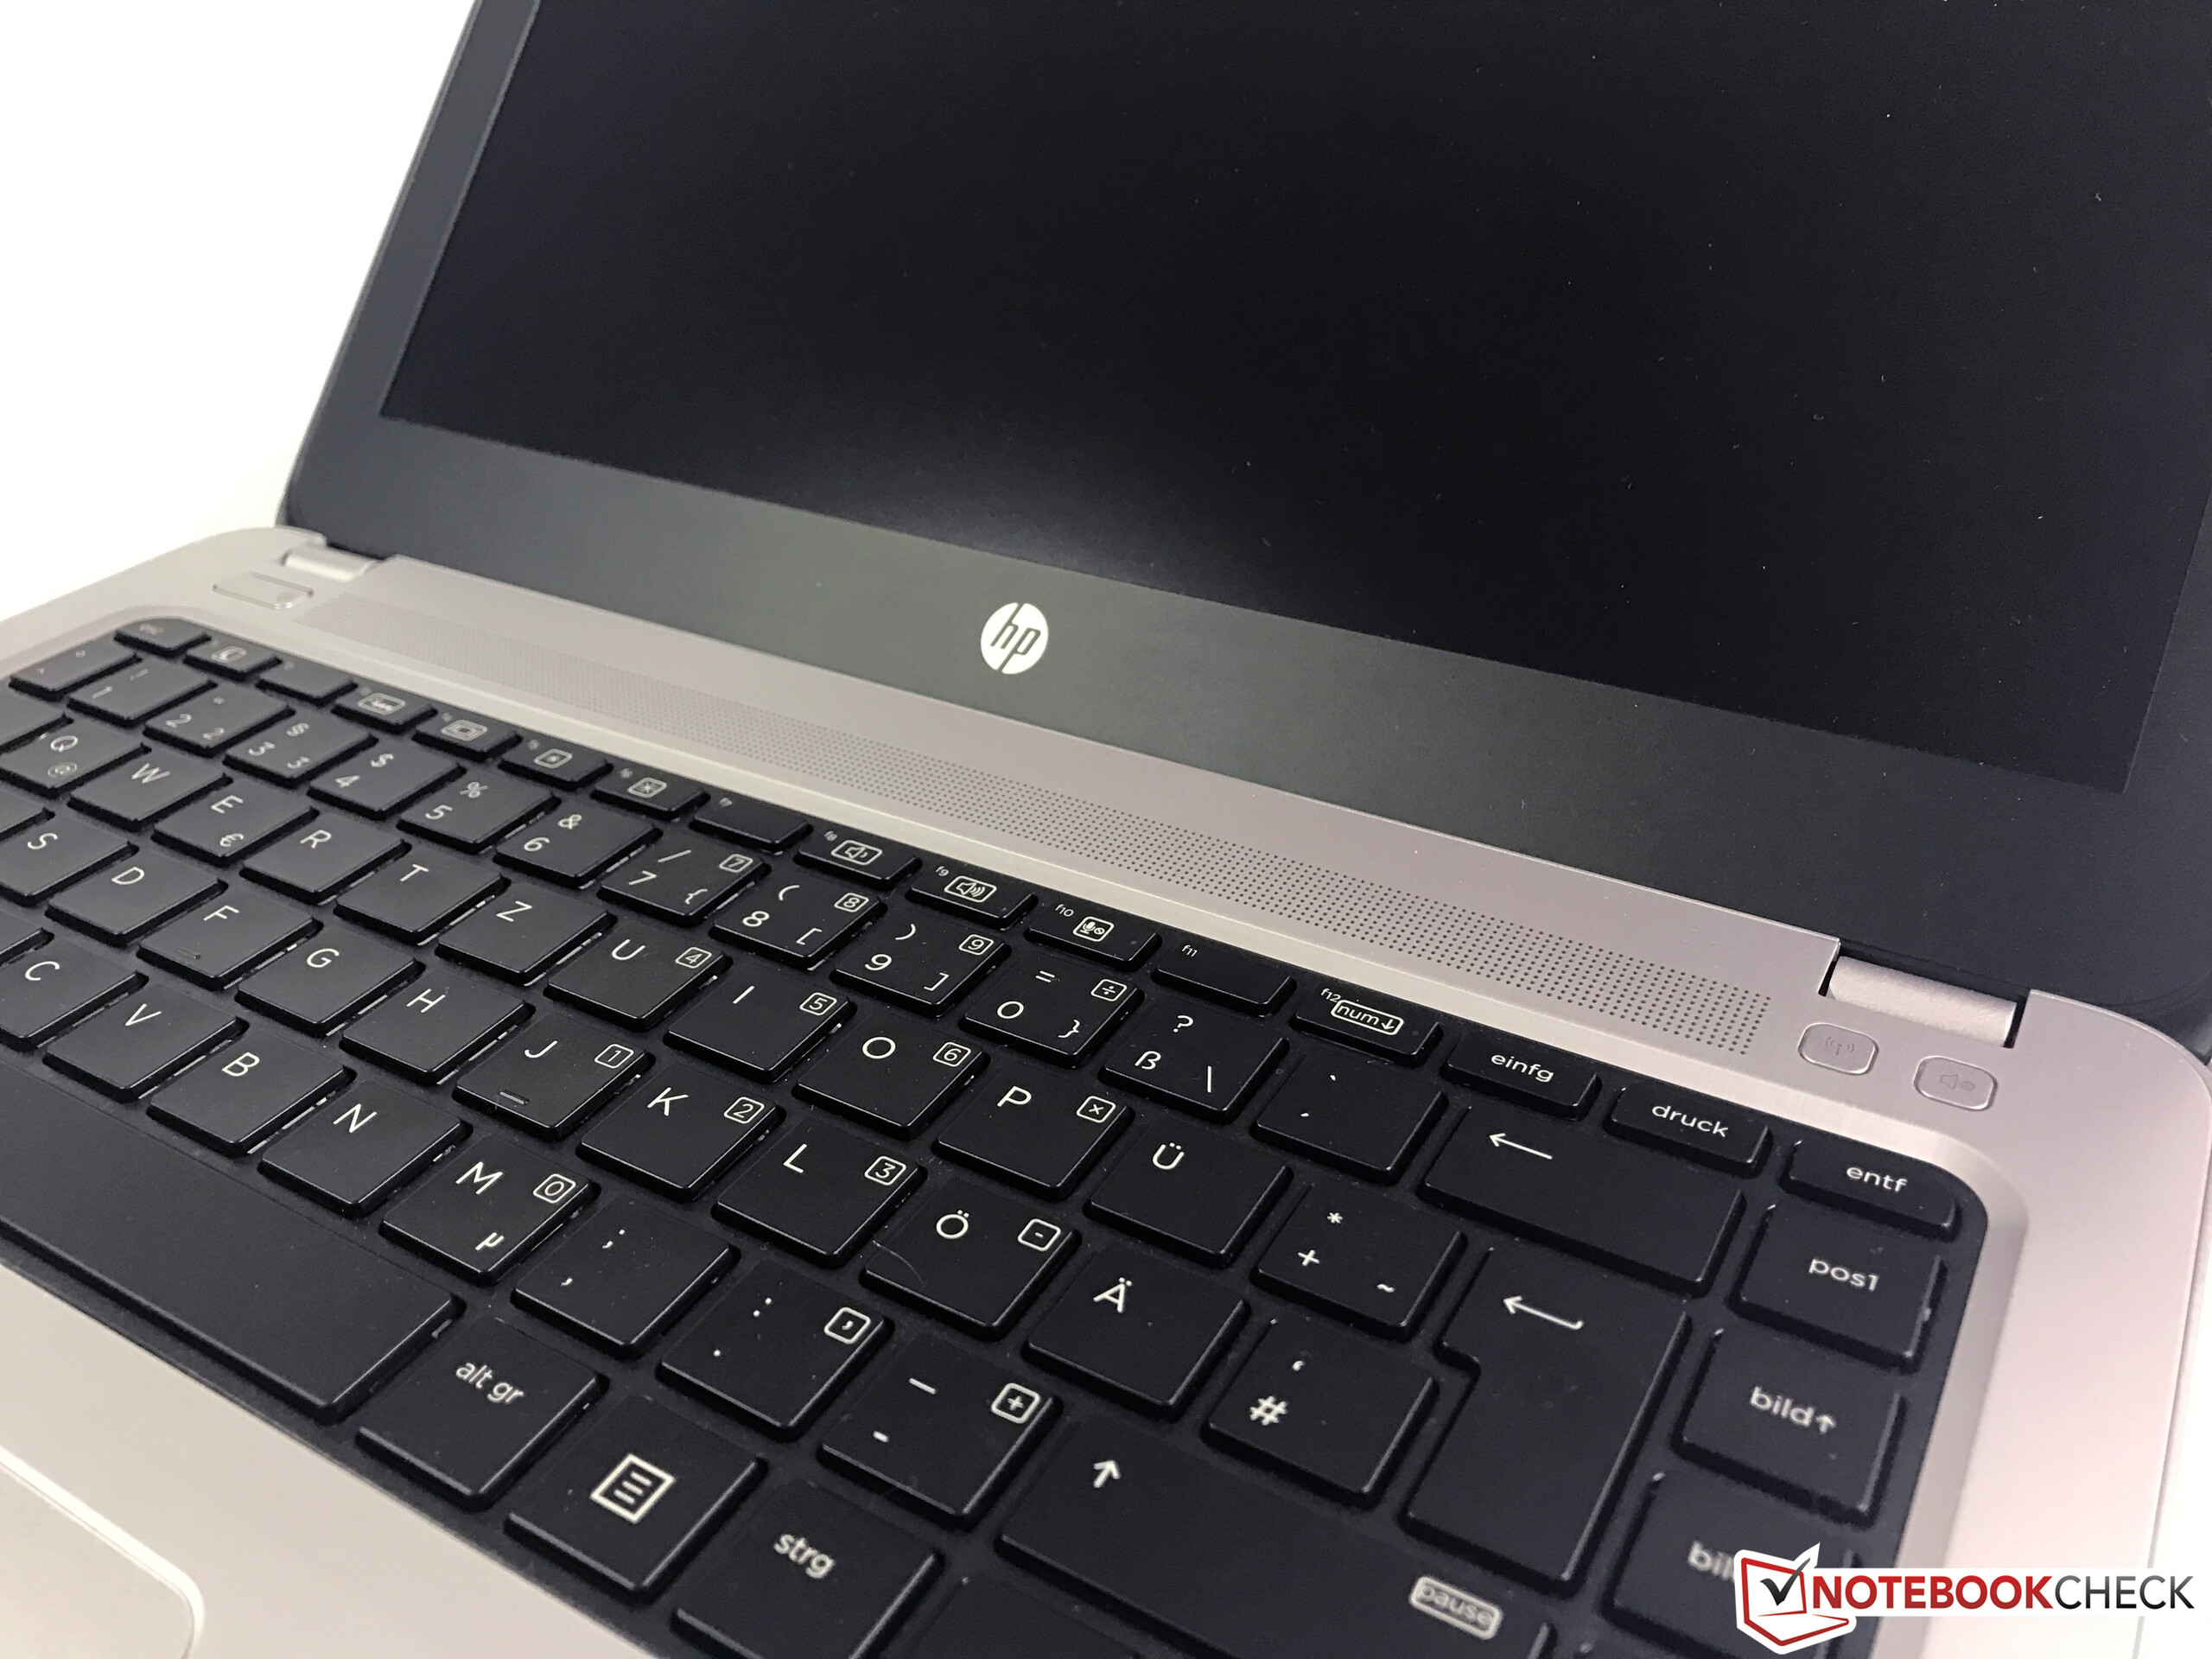
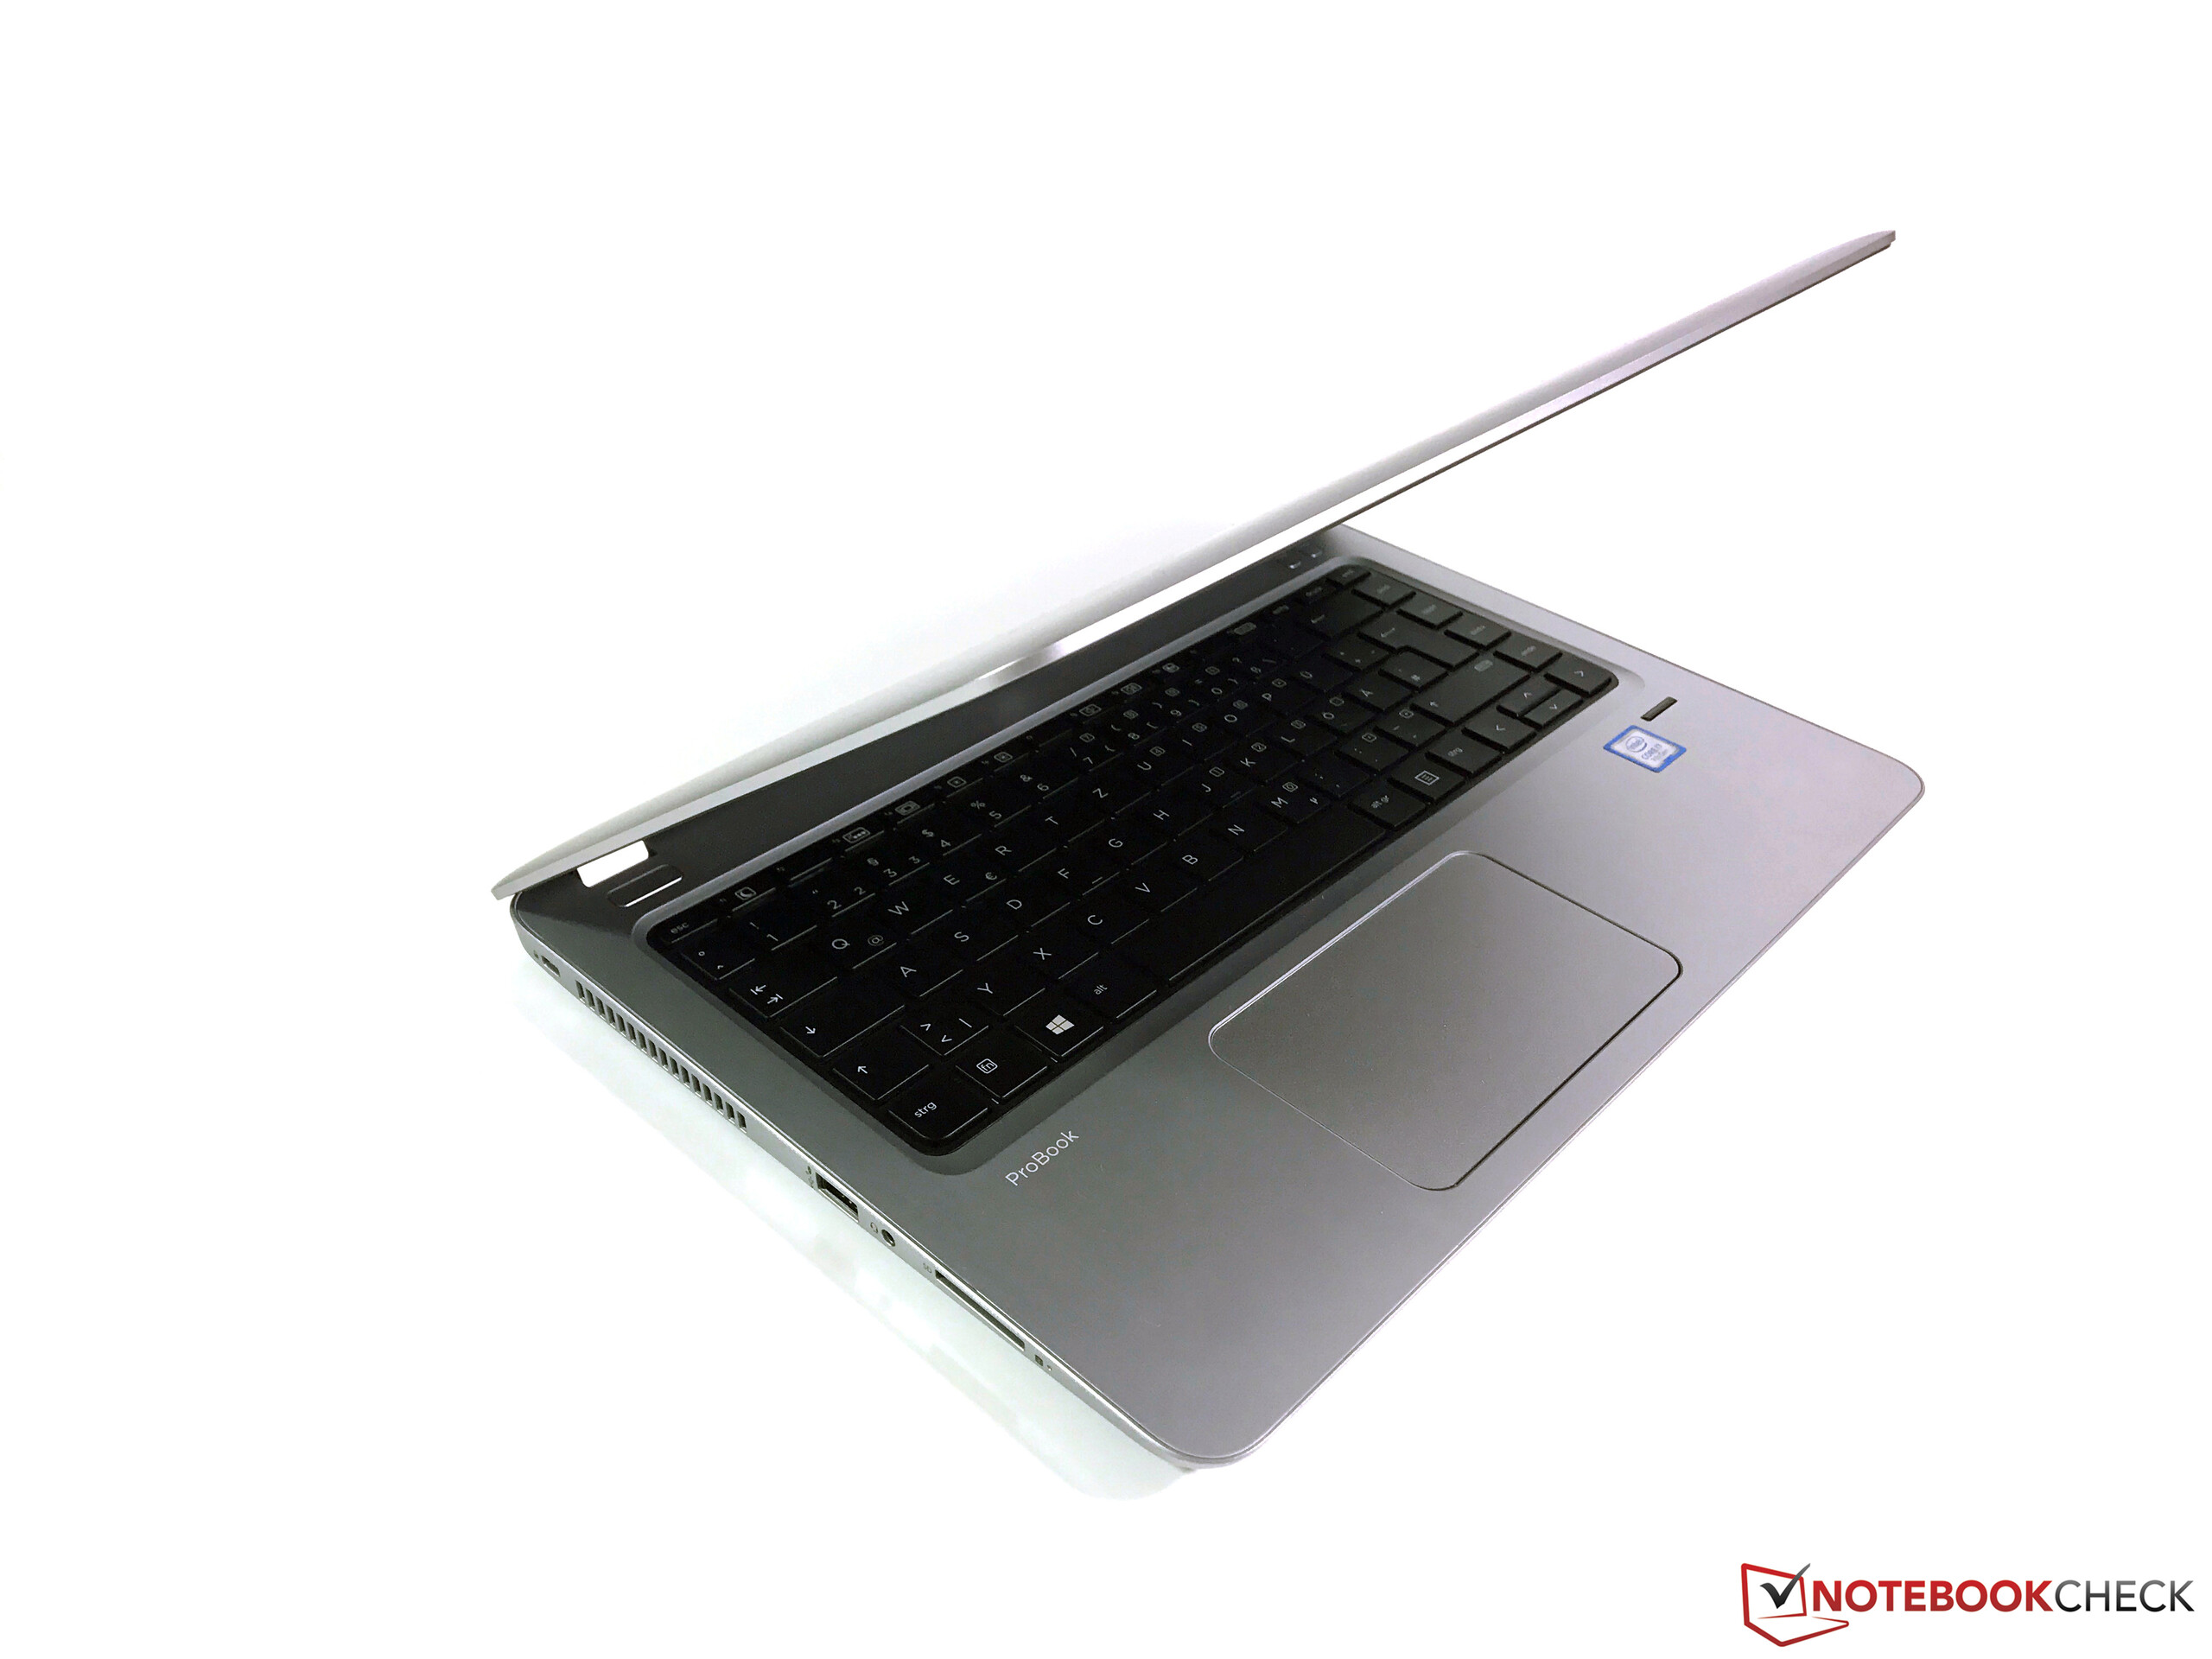
A quarta geração do ProBook 430 é uma atualização sólida mas também conservadora do portátil empresarial de 13,3 polegadas da HP. O fabricante não faz compromisso algum em termos do chassi, desempenho, durações de bateria e a tela IPS (opcional).
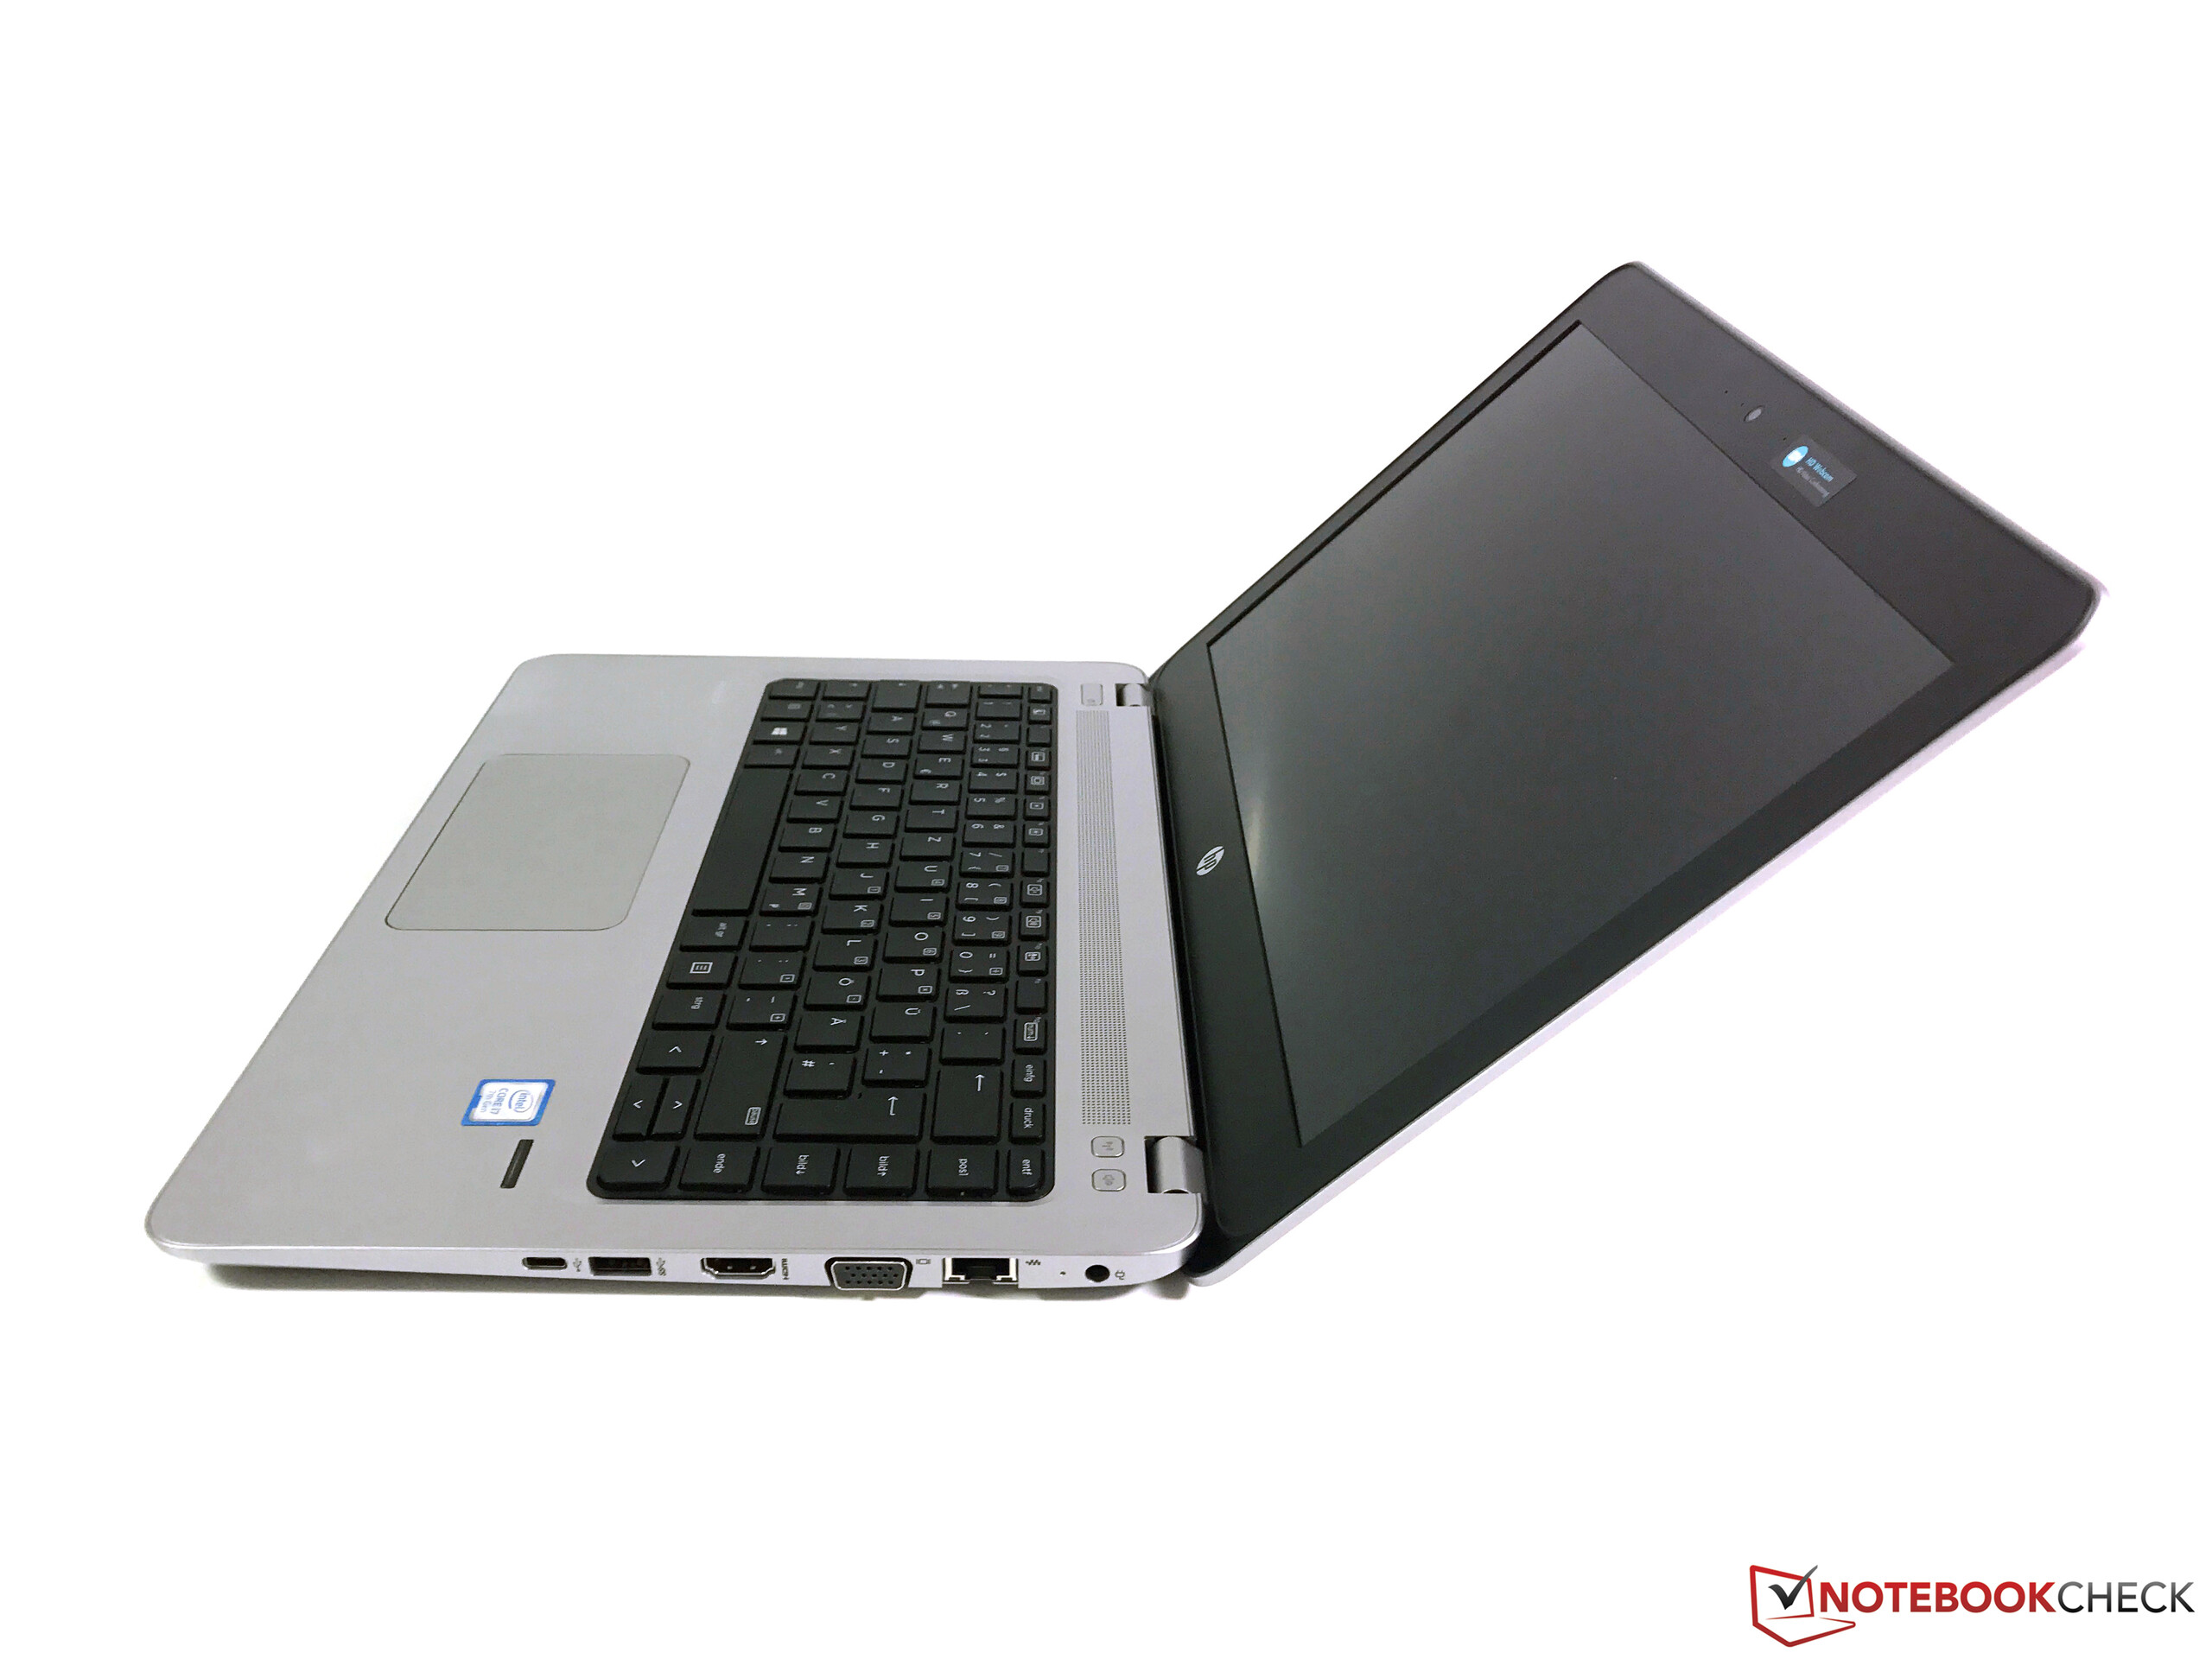
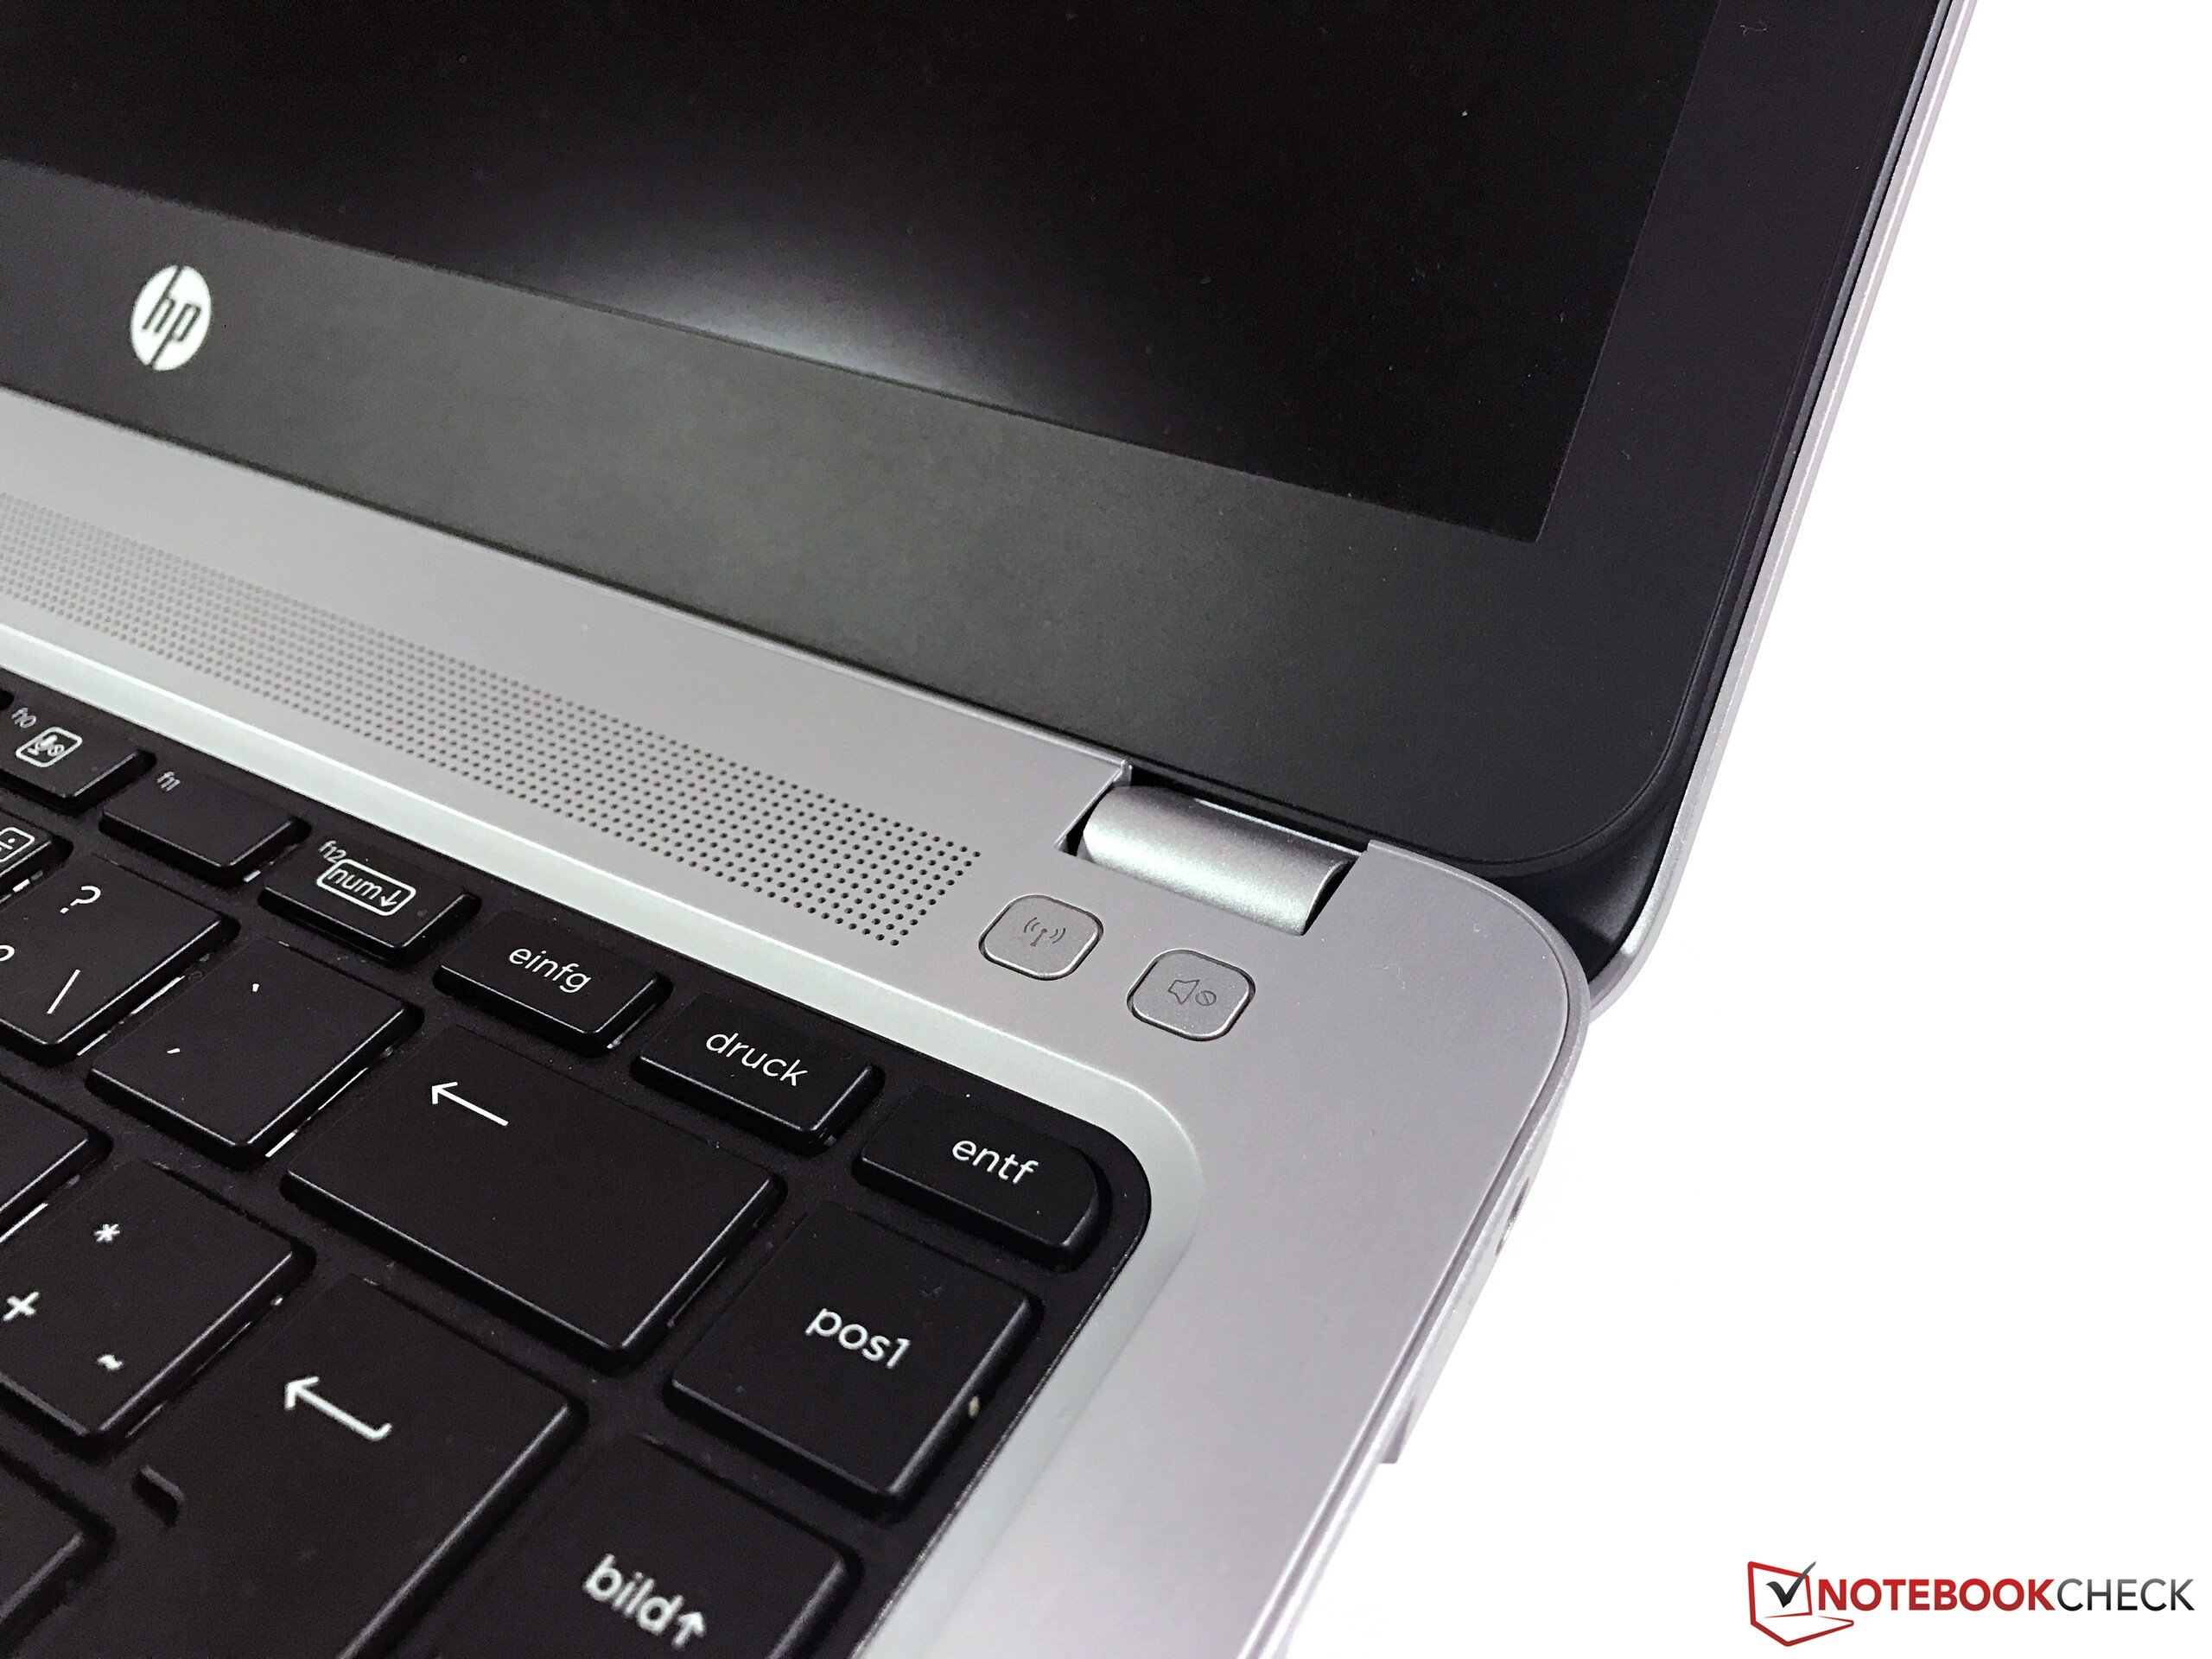
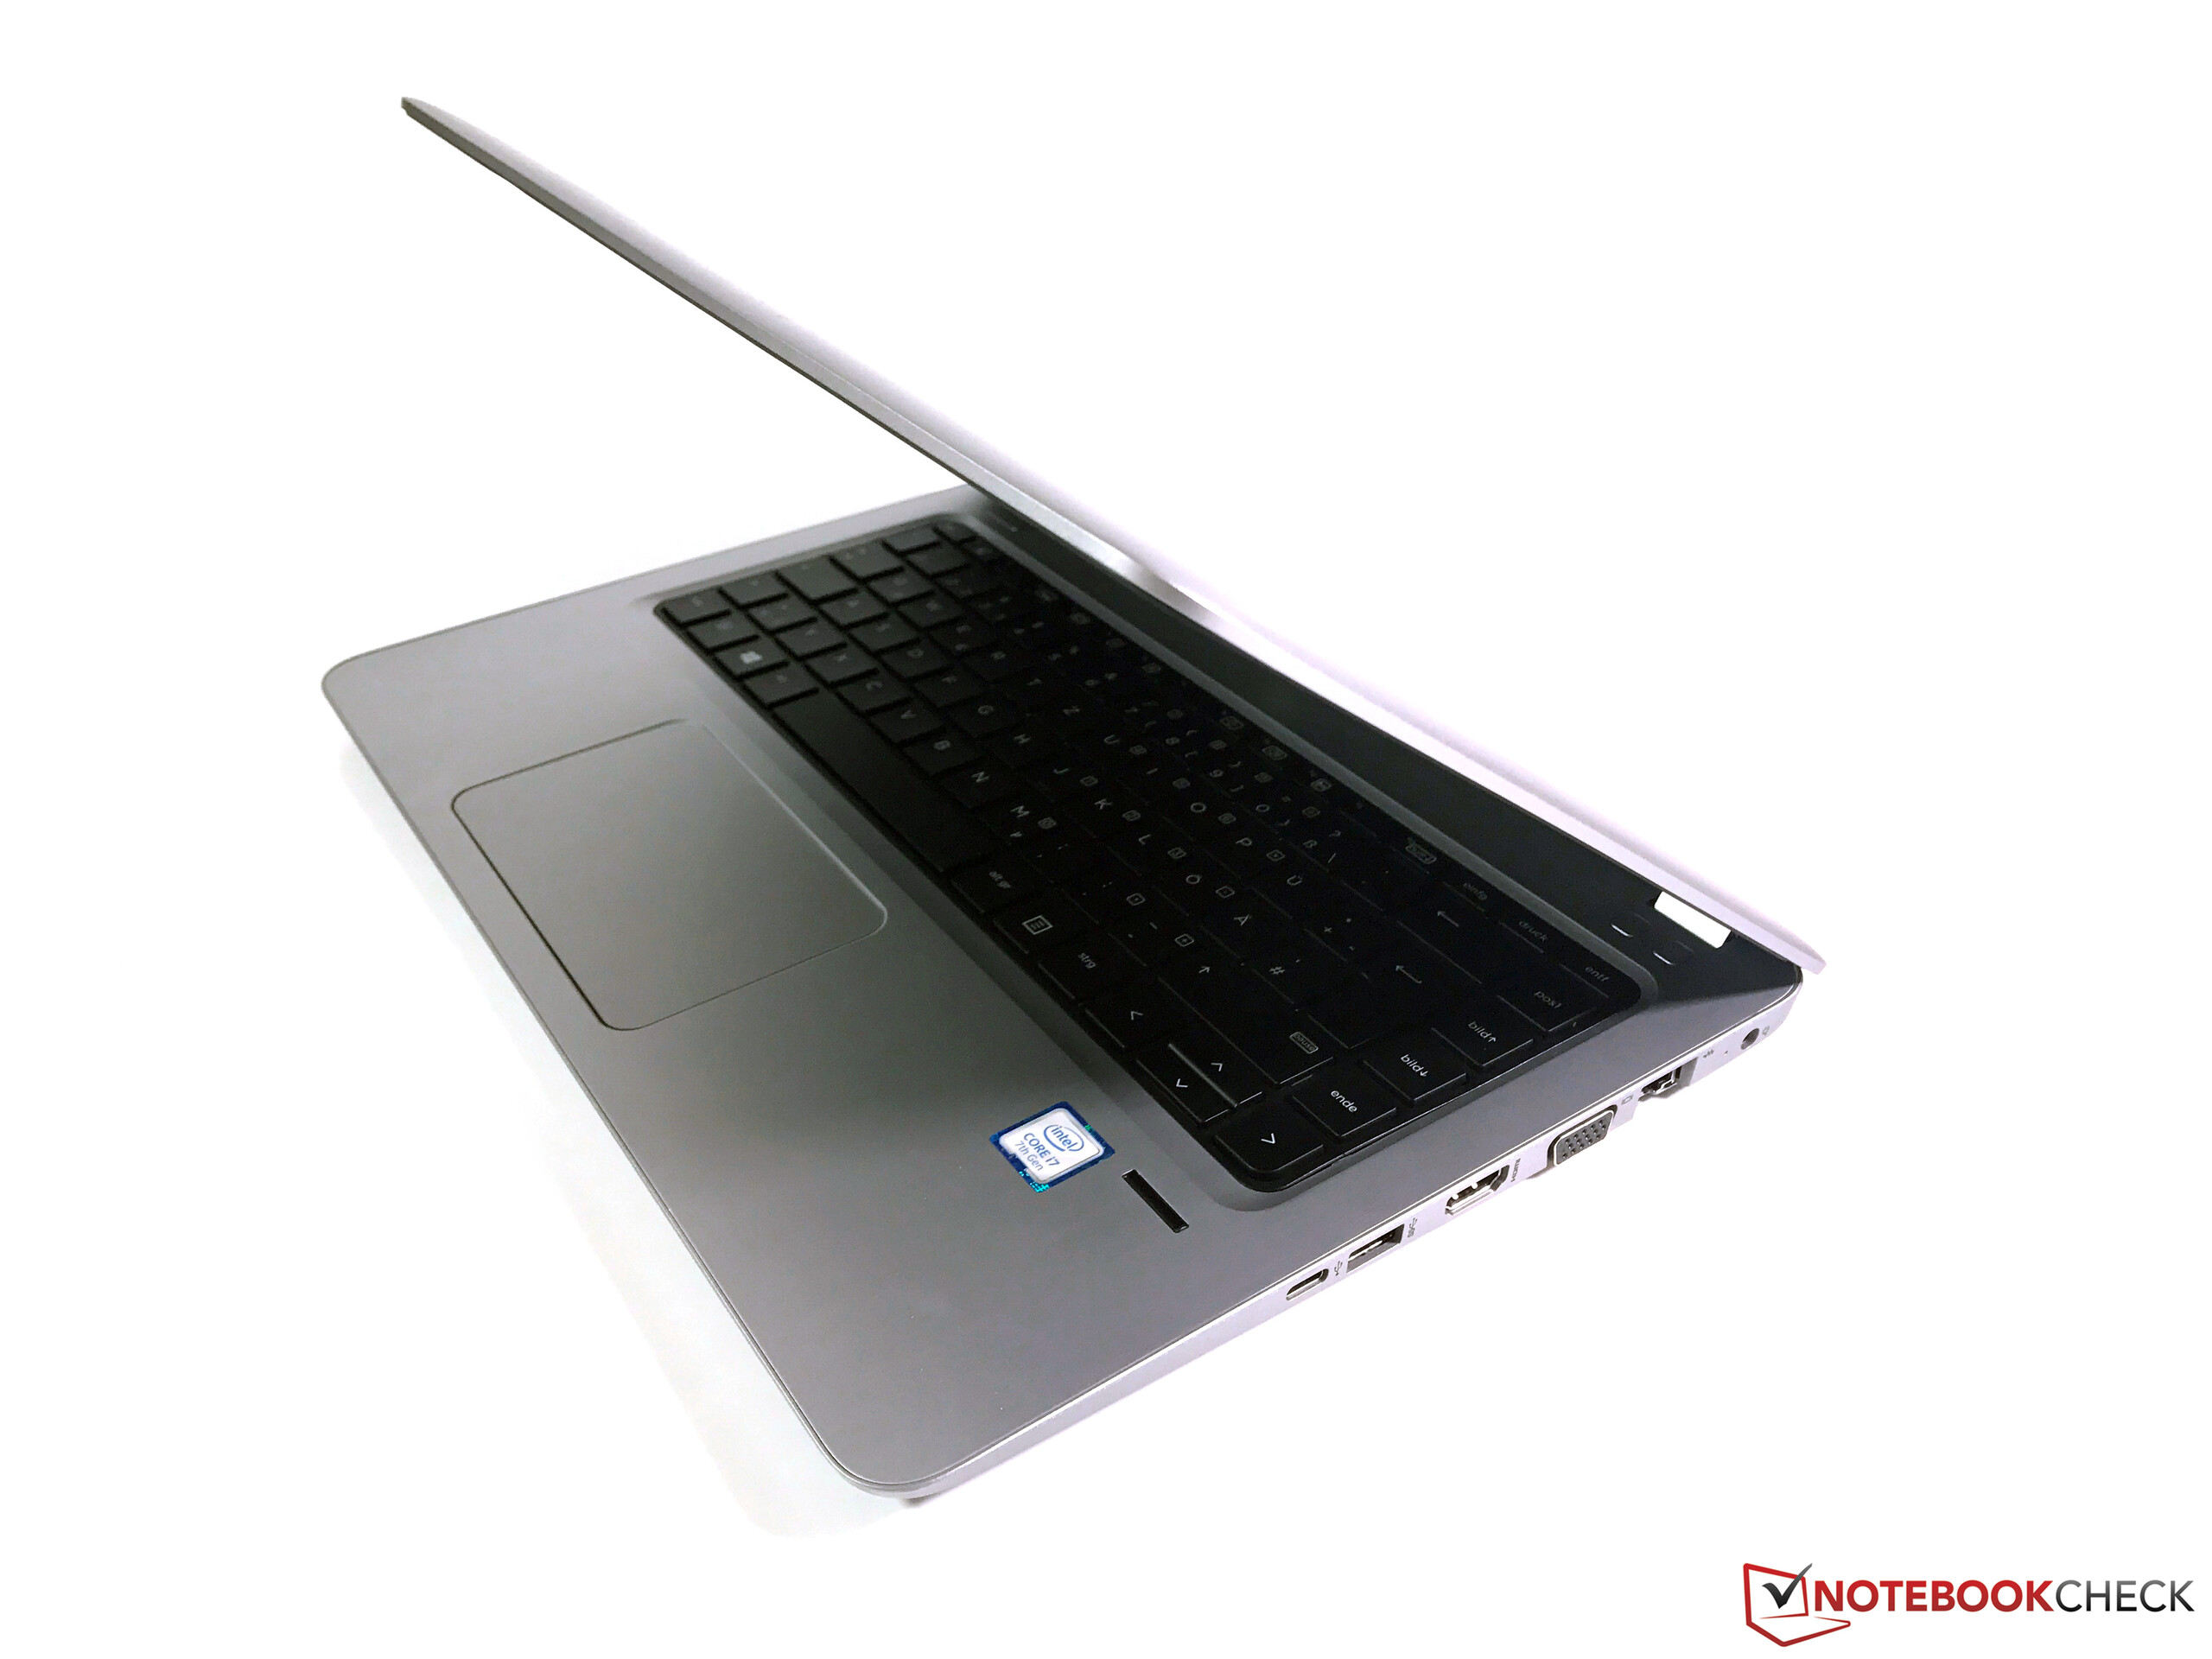
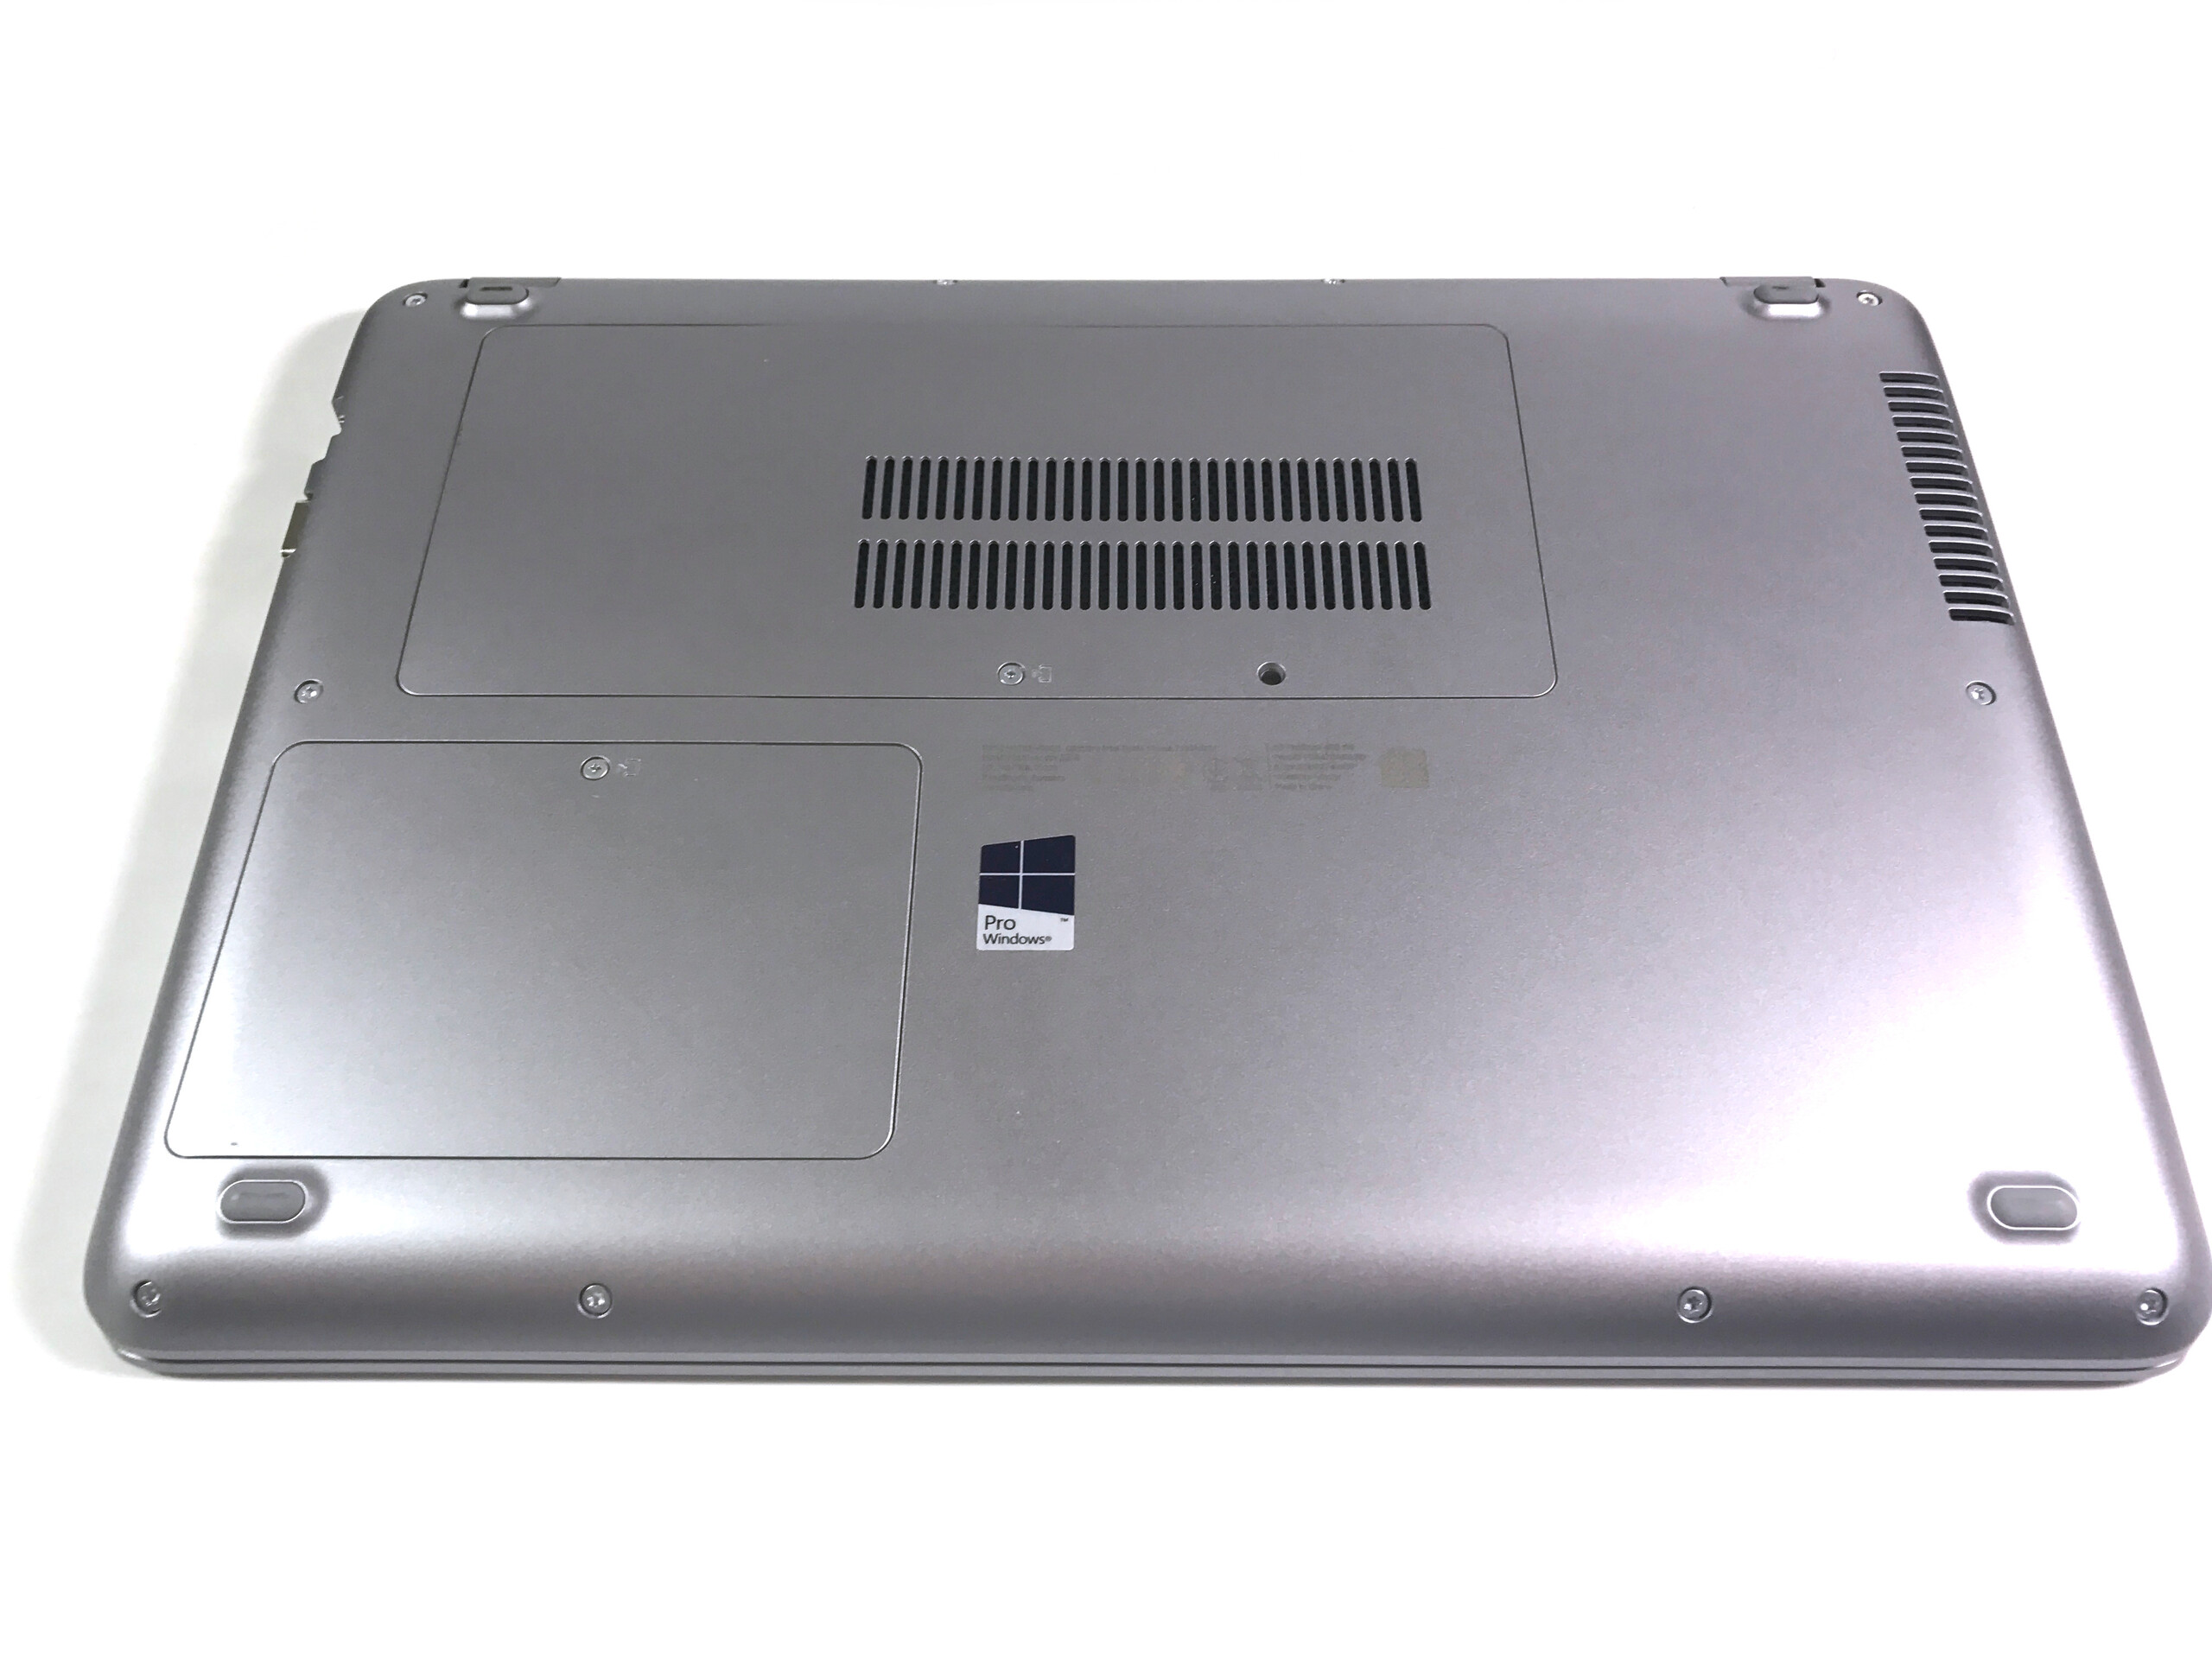
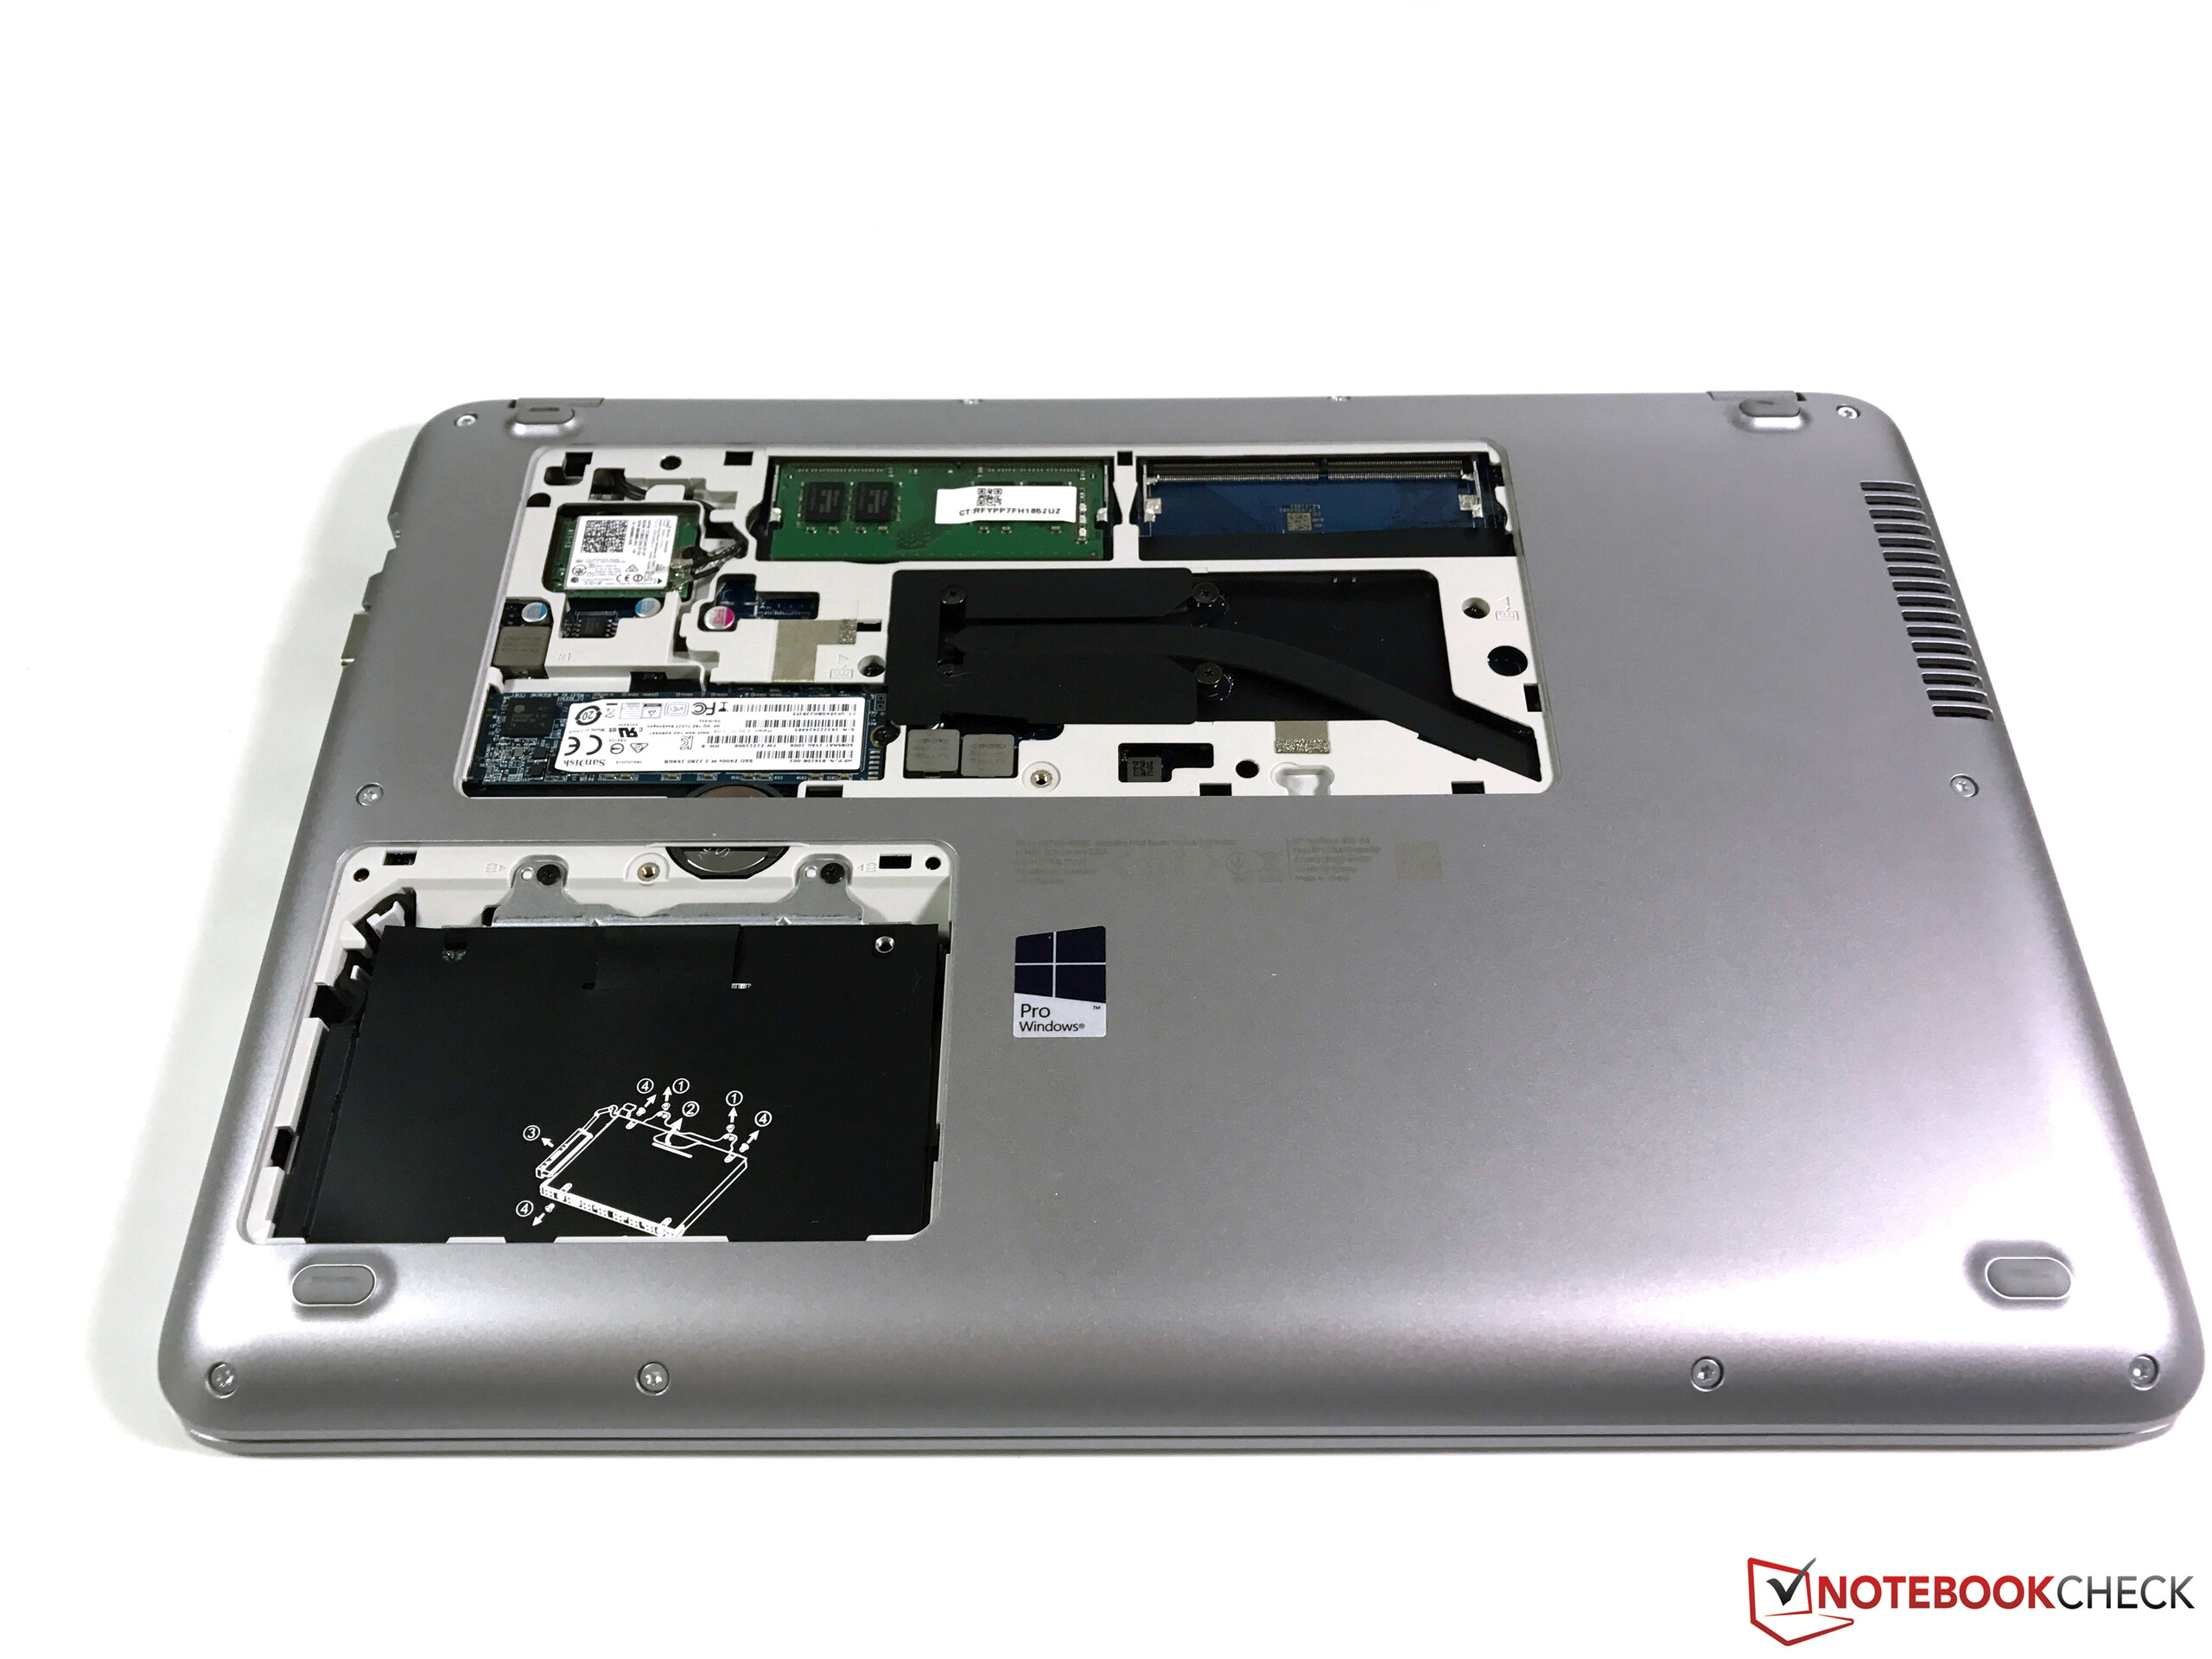
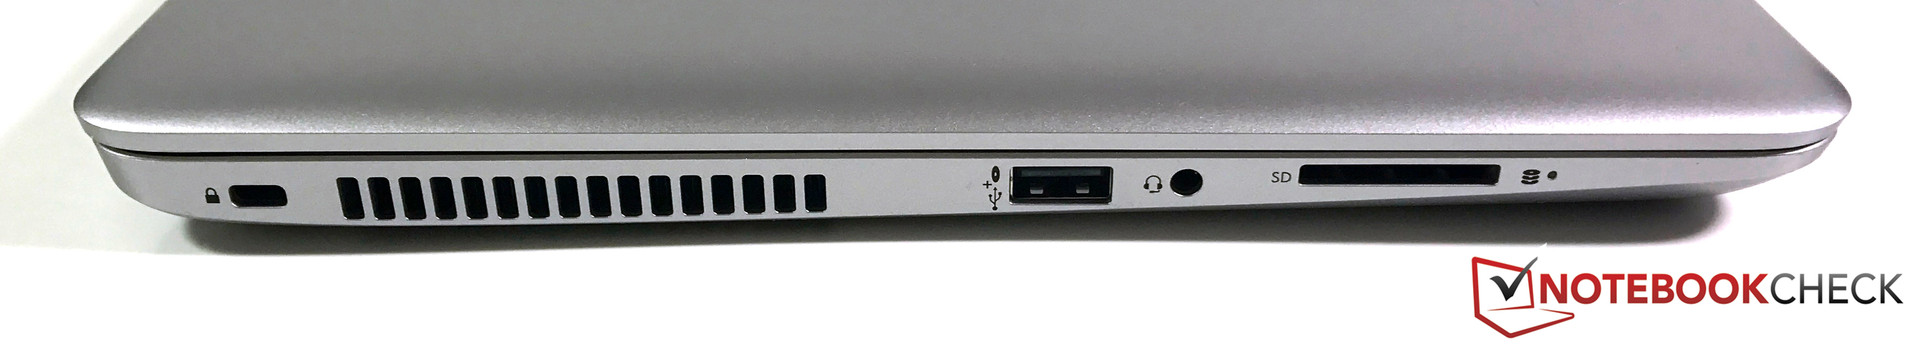
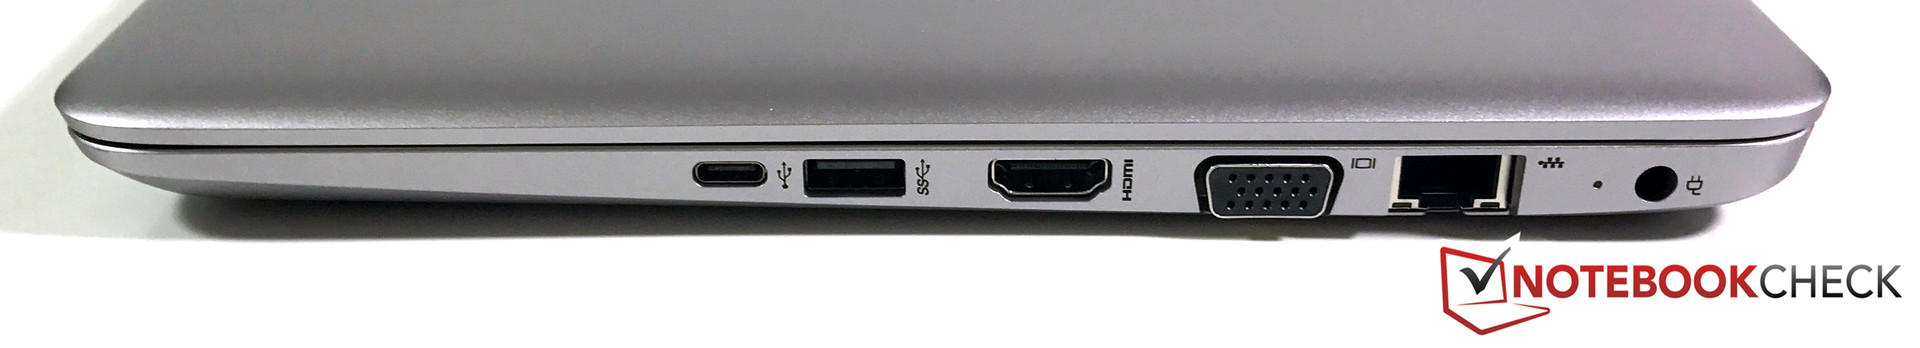
Uma olhada na seleção de portas e nos recursos de segurança, no entanto, mostra rapidamente que estamos lidando com uma máquina empresarial de nível de entrada. A HP implementa uma porta USB-C, mas baseia-se apenas no padrão 3.0. Uma porta docking também não está disponível, o qual complicaria a integração em seu ambiente de trabalho. Um leitor de SmartCard também está ausente.
A Kaby Lake, boa tela, e teclado confortável – o HP ProBook 430 G4 é uma atualização bem sucedida do subportátil de 13,3 polegadas. No entanto, existem alguns compromissos, e o nosso modelo de teste também não é uma barganha.
A concorrência ainda deve lançar suas atualizações com Kaby Lake, portanto, teremos que esperar um pouco para fazer as comparações. O nosso modelo de teste está parte superior da linha ProBook em termos de preço, pro isso tem dificuldade em competir com os sistemas de consumo. Por mais de 1.000 Euros (~$1048), você receberá Ultrabooks mais finos com portas modernas e telas melhores, mas em compensação terá que renunciar aos recursos de segurança e provavelmente ao confortável teclado.
HP ProBook 430 G4-Y8B47EA
- 12/26/2016 v6 (old)
Andreas Osthoff
Price comparison
