Breve Análise do Portátil HP ZBook 14u G6: O workstation móvel tem problemas com o desempenho
#compare_competitor
Avaliação | Data | Modelo | Peso | Altura | Size | Resolução | Preço |
|---|---|---|---|---|---|---|---|
| 81 % v7 (old) | 10/2019 | HP ZBook 14u G6 6TP71EA i7-8565U, Radeon Pro WX 3200 | 1.5 kg | 17.9 mm | 14.00" | 1920x1080 | |
| 81 % v6 (old) | 06/2018 | HP ZBook 14u G5-2ZB99EA i5-8550U, Radeon Pro WX 3100 | 1.6 kg | 18 mm | 14.00" | 1920x1080 | |
| 83 % v6 (old) | 10/2018 | Dell Precision 5530 2-in-1 i7-8706G, WX Vega M GL | 2 kg | 16 mm | 15.60" | 3840x2160 | |
| 83.2 % v6 (old) | 07/2018 | Lenovo ThinkPad P52s-20LB000HGE i5-8550U, Quadro P500 | 2.2 kg | 20.2 mm | 15.60" | 1920x1080 |
| |||||||||||||||||||||||||
iluminação: 92 %
iluminação com acumulador: 439 cd/m²
Contraste: 1410:1 (Preto: 0.31 cd/m²)
ΔE ColorChecker Calman: 2.6 | ∀{0.5-29.43 Ø4.73}
calibrated: 0.8
ΔE Greyscale Calman: 4.5 | ∀{0.09-98 Ø4.97}
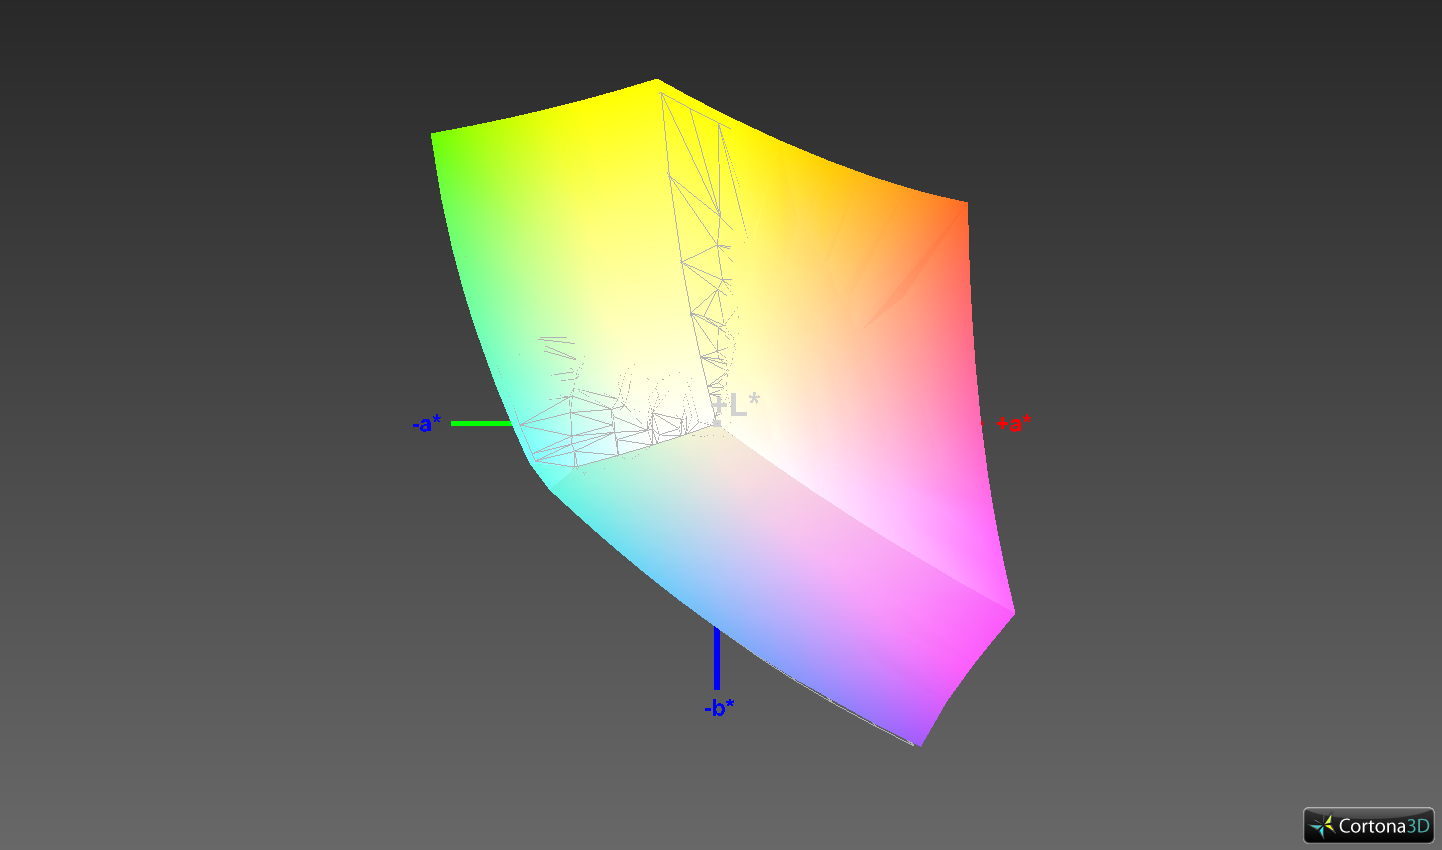
99.6% sRGB (Argyll 1.6.3 3D)
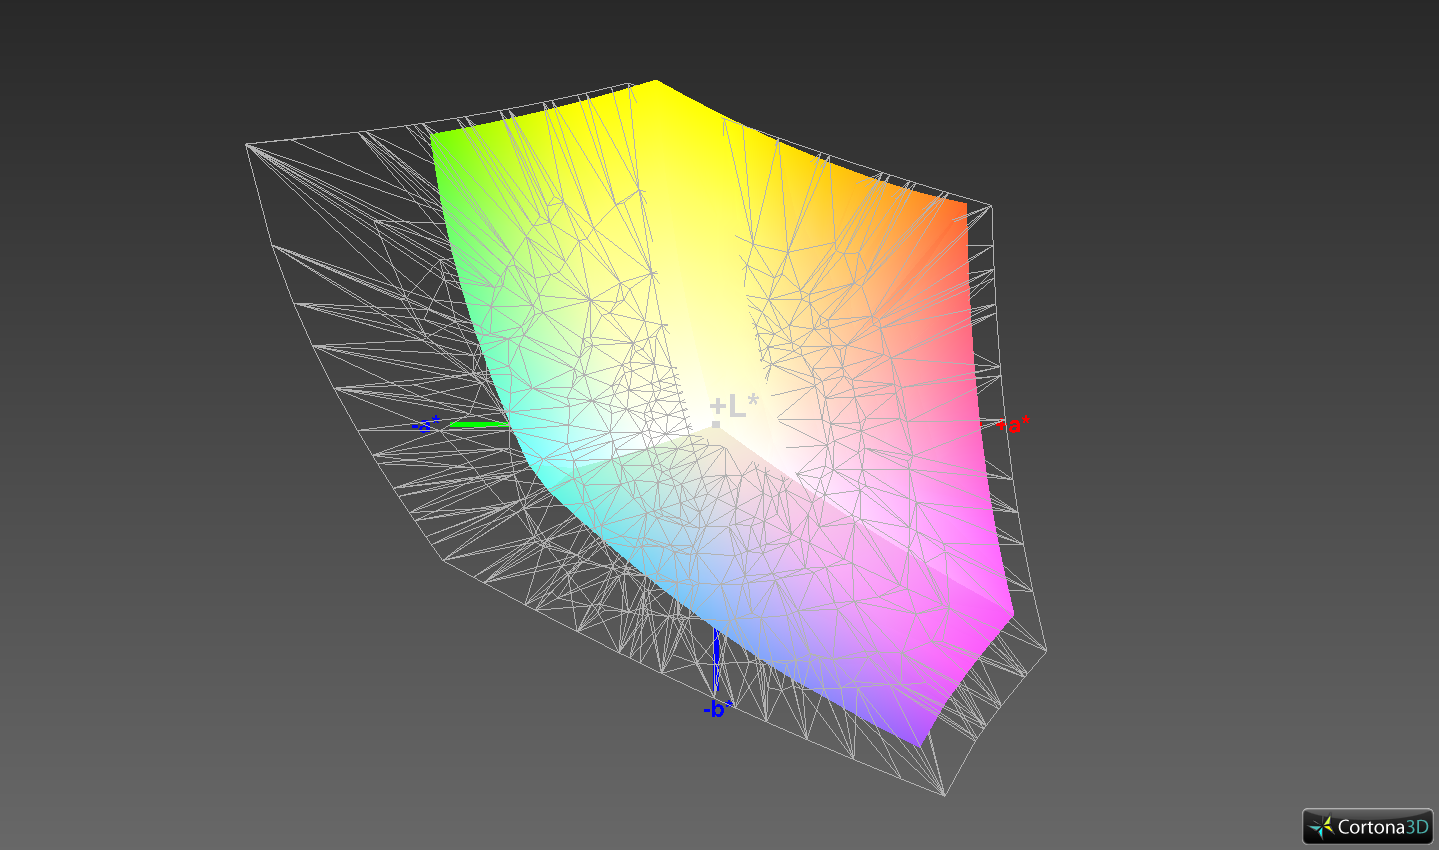
65.4% AdobeRGB 1998 (Argyll 1.6.3 3D)
71.9% AdobeRGB 1998 (Argyll 3D)
99.6% sRGB (Argyll 3D)
69.7% Display P3 (Argyll 3D)
Gamma: 2.2
CCT: 6809 K
| HP ZBook 14u G6 6TP71EA IPS, 1920x1080, 14" | HP ZBook 14u G5-2ZB99EA IPS, 1920x1080, 14" | Dell Precision 5530 2-in-1 IPS, 3840x2160, 15.6" | Lenovo ThinkPad P52s-20LB000HGE IPS LED, 1920x1080, 15.6" | |
|---|---|---|---|---|
| Display | -41% | 23% | -39% | |
| Display P3 Coverage (%) | 69.7 | 40.25 -42% | 91.2 31% | 41.83 -40% |
| sRGB Coverage (%) | 99.6 | 60.6 -39% | 99.9 0% | 62.1 -38% |
| AdobeRGB 1998 Coverage (%) | 71.9 | 41.59 -42% | 99.4 38% | 43.22 -40% |
| Response Times | -20% | -60% | -59% | |
| Response Time Grey 50% / Grey 80% * (ms) | 40.4 ? | 39.6 ? 2% | 49.6 ? -23% | 47.2 ? -17% |
| Response Time Black / White * (ms) | 19.2 ? | 27.2 ? -42% | 37.6 ? -96% | 38.4 ? -100% |
| PWM Frequency (Hz) | 990 ? | 21550 ? | ||
| Screen | -78% | -33% | -75% | |
| Brightness middle (cd/m²) | 437 | 234 -46% | 430.9 -1% | 291 -33% |
| Brightness (cd/m²) | 420 | 215 -49% | 398 -5% | 284 -32% |
| Brightness Distribution (%) | 92 | 85 -8% | 79 -14% | 91 -1% |
| Black Level * (cd/m²) | 0.31 | 0.16 48% | 0.35 -13% | 0.11 65% |
| Contrast (:1) | 1410 | 1463 4% | 1231 -13% | 2645 88% |
| Colorchecker dE 2000 * | 2.6 | 5.7 -119% | 3.29 -27% | 6.7 -158% |
| Colorchecker dE 2000 max. * | 6.5 | 18.4 -183% | 7.46 -15% | 20.2 -211% |
| Colorchecker dE 2000 calibrated * | 0.8 | 4.2 -425% | 3.58 -347% | 4.5 -463% |
| Greyscale dE 2000 * | 4.5 | 4.7 -4% | 2.6 42% | 4.5 -0% |
| Gamma | 2.2 100% | 2.38 92% | 2.19 100% | 2.28 96% |
| CCT | 6809 95% | 6730 97% | 6870 95% | 7503 87% |
| Color Space (Percent of AdobeRGB 1998) (%) | 65.4 | 38.3 -41% | 87.2 33% | 39.6 -39% |
| Color Space (Percent of sRGB) (%) | 99.6 | 60.4 -39% | 100 0% | 61.7 -38% |
| Média Total (Programa/Configurações) | -46% /
-64% | -23% /
-26% | -58% /
-66% |
* ... menor é melhor
Exibir tempos de resposta
| ↔ Tempo de resposta preto para branco | ||
|---|---|---|
| 19.2 ms ... ascensão ↗ e queda ↘ combinadas | ↗ 8.4 ms ascensão | 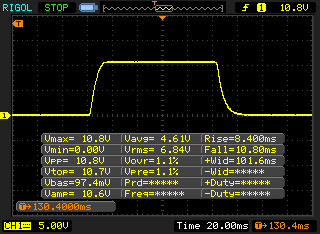 |
| ↘ 10.8 ms queda | ||
| A tela mostra boas taxas de resposta em nossos testes, mas pode ser muito lenta para jogadores competitivos. Em comparação, todos os dispositivos testados variam de 0.1 (mínimo) a 240 (máximo) ms. » 42 % de todos os dispositivos são melhores. Isso significa que o tempo de resposta medido é semelhante à média de todos os dispositivos testados (19.9 ms). | ||
| ↔ Tempo de resposta 50% cinza a 80% cinza | ||
| 40.4 ms ... ascensão ↗ e queda ↘ combinadas | ↗ 20.4 ms ascensão | 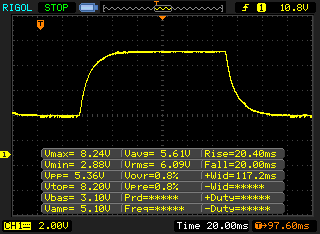 |
| ↘ 20 ms queda | ||
| A tela mostra taxas de resposta lentas em nossos testes e será insatisfatória para os jogadores. Em comparação, todos os dispositivos testados variam de 0.165 (mínimo) a 636 (máximo) ms. » 63 % de todos os dispositivos são melhores. Isso significa que o tempo de resposta medido é pior que a média de todos os dispositivos testados (31.1 ms). | ||
Cintilação da tela / PWM (modulação por largura de pulso)
| Tela tremeluzindo / PWM não detectado | ≤ 50 % configuração de brilho | 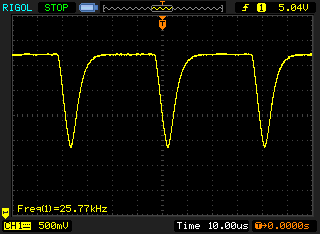 | |
[pwm_comparison] Em comparação: 52 % de todos os dispositivos testados não usam PWM para escurecer a tela. Se PWM foi detectado, uma média de 7784 (mínimo: 5 - máximo: 343500) Hz foi medida. | |||


| Geekbench 3 | |
| 32 Bit Multi-Core Score | |
| HP ZBook 14u G6 6TP71EA | |
| Média Intel Core i7-8565U (10521 - 13703, n=12) | |
| 32 Bit Single-Core Score | |
| Média Intel Core i7-8565U (3340 - 4820, n=12) | |
| HP ZBook 14u G6 6TP71EA | |
| Geekbench 4.4 | |
| 64 Bit Multi-Core Score | |
| Média da turma Workstation (n=1últimos 2 anos) | |
| Dell Precision 5530 2-in-1 | |
| HP ZBook 14u G6 6TP71EA | |
| Média Intel Core i7-8565U (8142 - 16968, n=30) | |
| 64 Bit Single-Core Score | |
| Média da turma Workstation (n=1últimos 2 anos) | |
| HP ZBook 14u G6 6TP71EA | |
| Média Intel Core i7-8565U (2357 - 5547, n=30) | |
| Dell Precision 5530 2-in-1 | |
| Geekbench 5.0 | |
| 5.0 Multi-Core | |
| Média da turma Workstation (n=1últimos 2 anos) | |
| Média Intel Core i7-8565U (2643 - 3803, n=5) | |
| HP ZBook 14u G6 6TP71EA | |
| 5.0 Single-Core | |
| Média da turma Workstation (n=1últimos 2 anos) | |
| HP ZBook 14u G6 6TP71EA | |
| Média Intel Core i7-8565U (1103 - 1229, n=5) | |
| Mozilla Kraken 1.1 - Total | |
| HP ZBook 14u G6 6TP71EA (Edge 44) | |
| Lenovo ThinkPad P52s-20LB000HGE (Edge 41.16299.402.0) | |
| Dell Precision 5530 2-in-1 (Edge 42.17134.1.0) | |
| Média Intel Core i7-8565U (730 - 2622, n=43) | |
| HP ZBook 14u G5-2ZB99EA (EDGE: 41.16299.15.0) | |
| Média da turma Workstation (411 - 538, n=25, últimos 2 anos) | |
| Octane V2 - Total Score | |
| Média da turma Workstation (92715 - 129420, n=4, últimos 2 anos) | |
| HP ZBook 14u G5-2ZB99EA (EDGE: 41.16299.15.0) | |
| Média Intel Core i7-8565U (13935 - 49795, n=42) | |
| Lenovo ThinkPad P52s-20LB000HGE (Edge 41.16299.402.0) | |
| HP ZBook 14u G6 6TP71EA (Edge 44) | |
| Dell Precision 5530 2-in-1 (Edge 42.17134.1.0) | |
| JetStream 1.1 - 1.1 Total | |
| HP ZBook 14u G5-2ZB99EA (EDGE: 41.16299.15.0) | |
| Dell Precision 5530 2-in-1 (Edge 42.17134.1.0) | |
| HP ZBook 14u G6 6TP71EA (Edge 44) | |
| Lenovo ThinkPad P52s-20LB000HGE (Edge 41.16299.402.0) | |
| Média Intel Core i7-8565U (107.6 - 277, n=37) | |
* ... menor é melhor
| PCMark 8 Home Score Accelerated v2 | 3954 pontos | |
| PCMark 8 Creative Score Accelerated v2 | 3901 pontos | |
| PCMark 8 Work Score Accelerated v2 | 4885 pontos | |
| PCMark 10 Score | 4413 pontos | |
Ajuda | ||

| HP ZBook 14u G6 6TP71EA Samsung SSD PM981 MZVLB512HAJQ | HP ZBook 14u G5-2ZB99EA Toshiba XG5 KXG50ZNV256G | Dell Precision 5530 2-in-1 SK Hynix PC401 512GB M.2 (HFS512GD9TNG) | Lenovo ThinkPad P52s-20LB000HGE Samsung PM961 MZVLW256HEHP | Média Samsung SSD PM981 MZVLB512HAJQ | |
|---|---|---|---|---|---|
| CrystalDiskMark 5.2 / 6 | -51% | -18% | -22% | 2% | |
| Write 4K (MB/s) | 173.7 | 128.9 -26% | 159.2 -8% | 126.7 ? -27% | |
| Read 4K (MB/s) | 50.6 | 45.7 -10% | 45.8 -9% | 44 ? -13% | |
| Write Seq (MB/s) | 1100 | 635 -42% | 852 -23% | 1617 ? 47% | |
| Read Seq (MB/s) | 1072 | 2065 93% | 786 -27% | 1716 ? 60% | |
| Write 4K Q32T1 (MB/s) | 555 | 359.6 -35% | 336.6 -39% | 468.6 -16% | 413 ? -26% |
| Read 4K Q32T1 (MB/s) | 625 | 271.8 -57% | 393.6 -37% | 566 -9% | 420 ? -33% |
| Write Seq Q32T1 (MB/s) | 1892 | 342 -82% | 662 -65% | 1242 -34% | 2076 ? 10% |
| Read Seq Q32T1 (MB/s) | 3233 | 2281 -29% | 2664 -18% | 1761 -46% | 3130 ? -3% |
| 3DMark 06 Standard Score | 16054 pontos | |
| 3DMark 11 Performance | 4722 pontos | |
| 3DMark Ice Storm Standard Score | 65682 pontos | |
| 3DMark Cloud Gate Standard Score | 11941 pontos | |
| 3DMark Fire Strike Score | 2920 pontos | |
| 3DMark Time Spy Score | 1079 pontos | |
Ajuda | ||
| BioShock Infinite - 1366x768 High Preset | |
| HP Pavilion Power 15t-cb2000 | |
| Dell Precision 5530 2-in-1 | |
| Lenovo ThinkPad E490-20N90004GE | |
| HP ZBook 14u G6 6TP71EA | |
| Média AMD Radeon Pro WX 3200 (81.6 - 83.1, n=2) | |
| Lenovo ThinkPad E590-20NB0012GE | |
| Lenovo ThinkPad E580-20KS001RGE | |
| HP ZBook 15u G5 2ZC05EA | |
| Lenovo ThinkPad P52s-20LB000HGE | |
| Acer Swift 3 SF315-41G-R6BR | |
| HP ZBook 14u G5-2ZB99EA | |
| The Witcher 3 - 1024x768 Low Graphics & Postprocessing | |
| Média da turma Workstation (134.6 - 393, n=3, últimos 2 anos) | |
| Dell Precision 5530 2-in-1 | |
| Lenovo ThinkPad E590-20NB0012GE | |
| Lenovo ThinkPad E490-20N90004GE | |
| HP ZBook 14u G6 6TP71EA | |
| Média AMD Radeon Pro WX 3200 (n=1) | |
| Acer Swift 3 SF315-41G-R6BR | |
| HP ZBook 15u G5 2ZC05EA | |
| Lenovo ThinkPad P52s-20LB000HGE | |
| HP ZBook 14u G5-2ZB99EA | |
| Tomb Raider - 1366x768 Normal Preset AA:FX AF:4x | |
| HP Pavilion Power 15t-cb2000 | |
| HP ZBook 14u G6 6TP71EA | |
| Média AMD Radeon Pro WX 3200 (n=1) | |
| Lenovo ThinkPad E590-20NB0012GE | |
| Acer Swift 3 SF315-41G-R6BR | |
| Dota 2 Reborn - 1920x1080 high (2/3) | |
| Média da turma Workstation (52.1 - 199.8, n=25, últimos 2 anos) | |
| Lenovo ThinkPad E590-20NB0012GE | |
| Lenovo ThinkPad E490-20N90004GE | |
| HP ZBook 14u G6 6TP71EA | |
| Lenovo ThinkPad P52s-20LB000HGE | |
| Média AMD Radeon Pro WX 3200 (48 - 49.1, n=2) | |
| Acer Swift 3 SF315-41G-R6BR | |
| baixo | média | alto | ultra | |
|---|---|---|---|---|
| Tomb Raider (2013) | 184.6 | 98.5 | 71.8 | 35 |
| BioShock Infinite (2013) | 186.6 | 90.4 | 83.1 | 30 |
| The Witcher 3 (2015) | 58.1 | 35.6 | 18 | 11.2 |
| Dota 2 Reborn (2015) | 103 | 86 | 49.1 | 24.7 |
| Final Fantasy XV Benchmark (2018) | 26.3 | 9.7 | 6.3 | |
| X-Plane 11.11 (2018) | 25 | 16.6 | 15.1 | |
| Apex Legends (2019) | 65.9 | 24.3 | 15.1 | 13.2 |
| Metro Exodus (2019) | 31.1 | 14 | 10 | 7 |
| Rage 2 (2019) | 40.9 | 16.8 | 14.1 | 10 |
| Total War: Three Kingdoms (2019) | 55.5 | 15.3 | 9.9 | 4 |
| F1 2019 (2019) | 59 | 33 | 25 | 15 |
| Control (2019) | 42.4 | 12.5 | 8.3 |
Barulho
| Ocioso |
| 29.7 / 29.7 / 30.4 dB |
| Carga |
| 32.7 / 35.9 dB |
 | ||
30 dB silencioso 40 dB(A) audível 50 dB(A) ruidosamente alto |
||
min: | ||
| HP ZBook 14u G6 6TP71EA i7-8565U, Radeon Pro WX 3200 | HP ZBook 14u G5-2ZB99EA i5-8550U, Radeon Pro WX 3100 | Dell Precision 5530 2-in-1 i7-8706G, WX Vega M GL | Lenovo ThinkPad P52s-20LB000HGE i5-8550U, Quadro P500 | Média AMD Radeon Pro WX 3200 | Média da turma Workstation | |
|---|---|---|---|---|---|---|
| Noise | -0% | -10% | 1% | 0% | 0% | |
| desligado / ambiente * (dB) | 29.7 | 29.8 -0% | 28.6 4% | 29 2% | 29.7 ? -0% | 24.1 ? 19% |
| Idle Minimum * (dB) | 29.7 | 29.8 -0% | 28.6 4% | 29 2% | 29.7 ? -0% | 24.8 ? 16% |
| Idle Average * (dB) | 29.7 | 29.8 -0% | 28.6 4% | 29 2% | 29.7 ? -0% | 25.4 ? 14% |
| Idle Maximum * (dB) | 30.4 | 29.8 2% | 29.1 4% | 31.2 -3% | 30.4 ? -0% | 26.7 ? 12% |
| Load Average * (dB) | 32.7 | 33.5 -2% | 39.8 -22% | 32.5 1% | 32.7 ? -0% | 39.2 ? -20% |
| Witcher 3 ultra * (dB) | 35.3 | 34.2 3% | 47 -33% | 32.5 8% | ||
| Load Maximum * (dB) | 35.9 | 37.3 -4% | 47 -31% | 37.5 -4% | 36 ? -0% | 50.4 ? -40% |
* ... menor é melhor
(±) A temperatura máxima no lado superior é 40.8 °C / 105 F, em comparação com a média de 38.2 °C / 101 F , variando de 22.2 a 69.8 °C para a classe Workstation.
(±) A parte inferior aquece até um máximo de 43 °C / 109 F, em comparação com a média de 41.1 °C / 106 F
(+) Em uso inativo, a temperatura média para o lado superior é 23.6 °C / 74 F, em comparação com a média do dispositivo de 32 °C / ### class_avg_f### F.
(±) Jogando The Witcher 3, a temperatura média para o lado superior é 35.1 °C / 95 F, em comparação com a média do dispositivo de 32 °C / ## #class_avg_f### F.
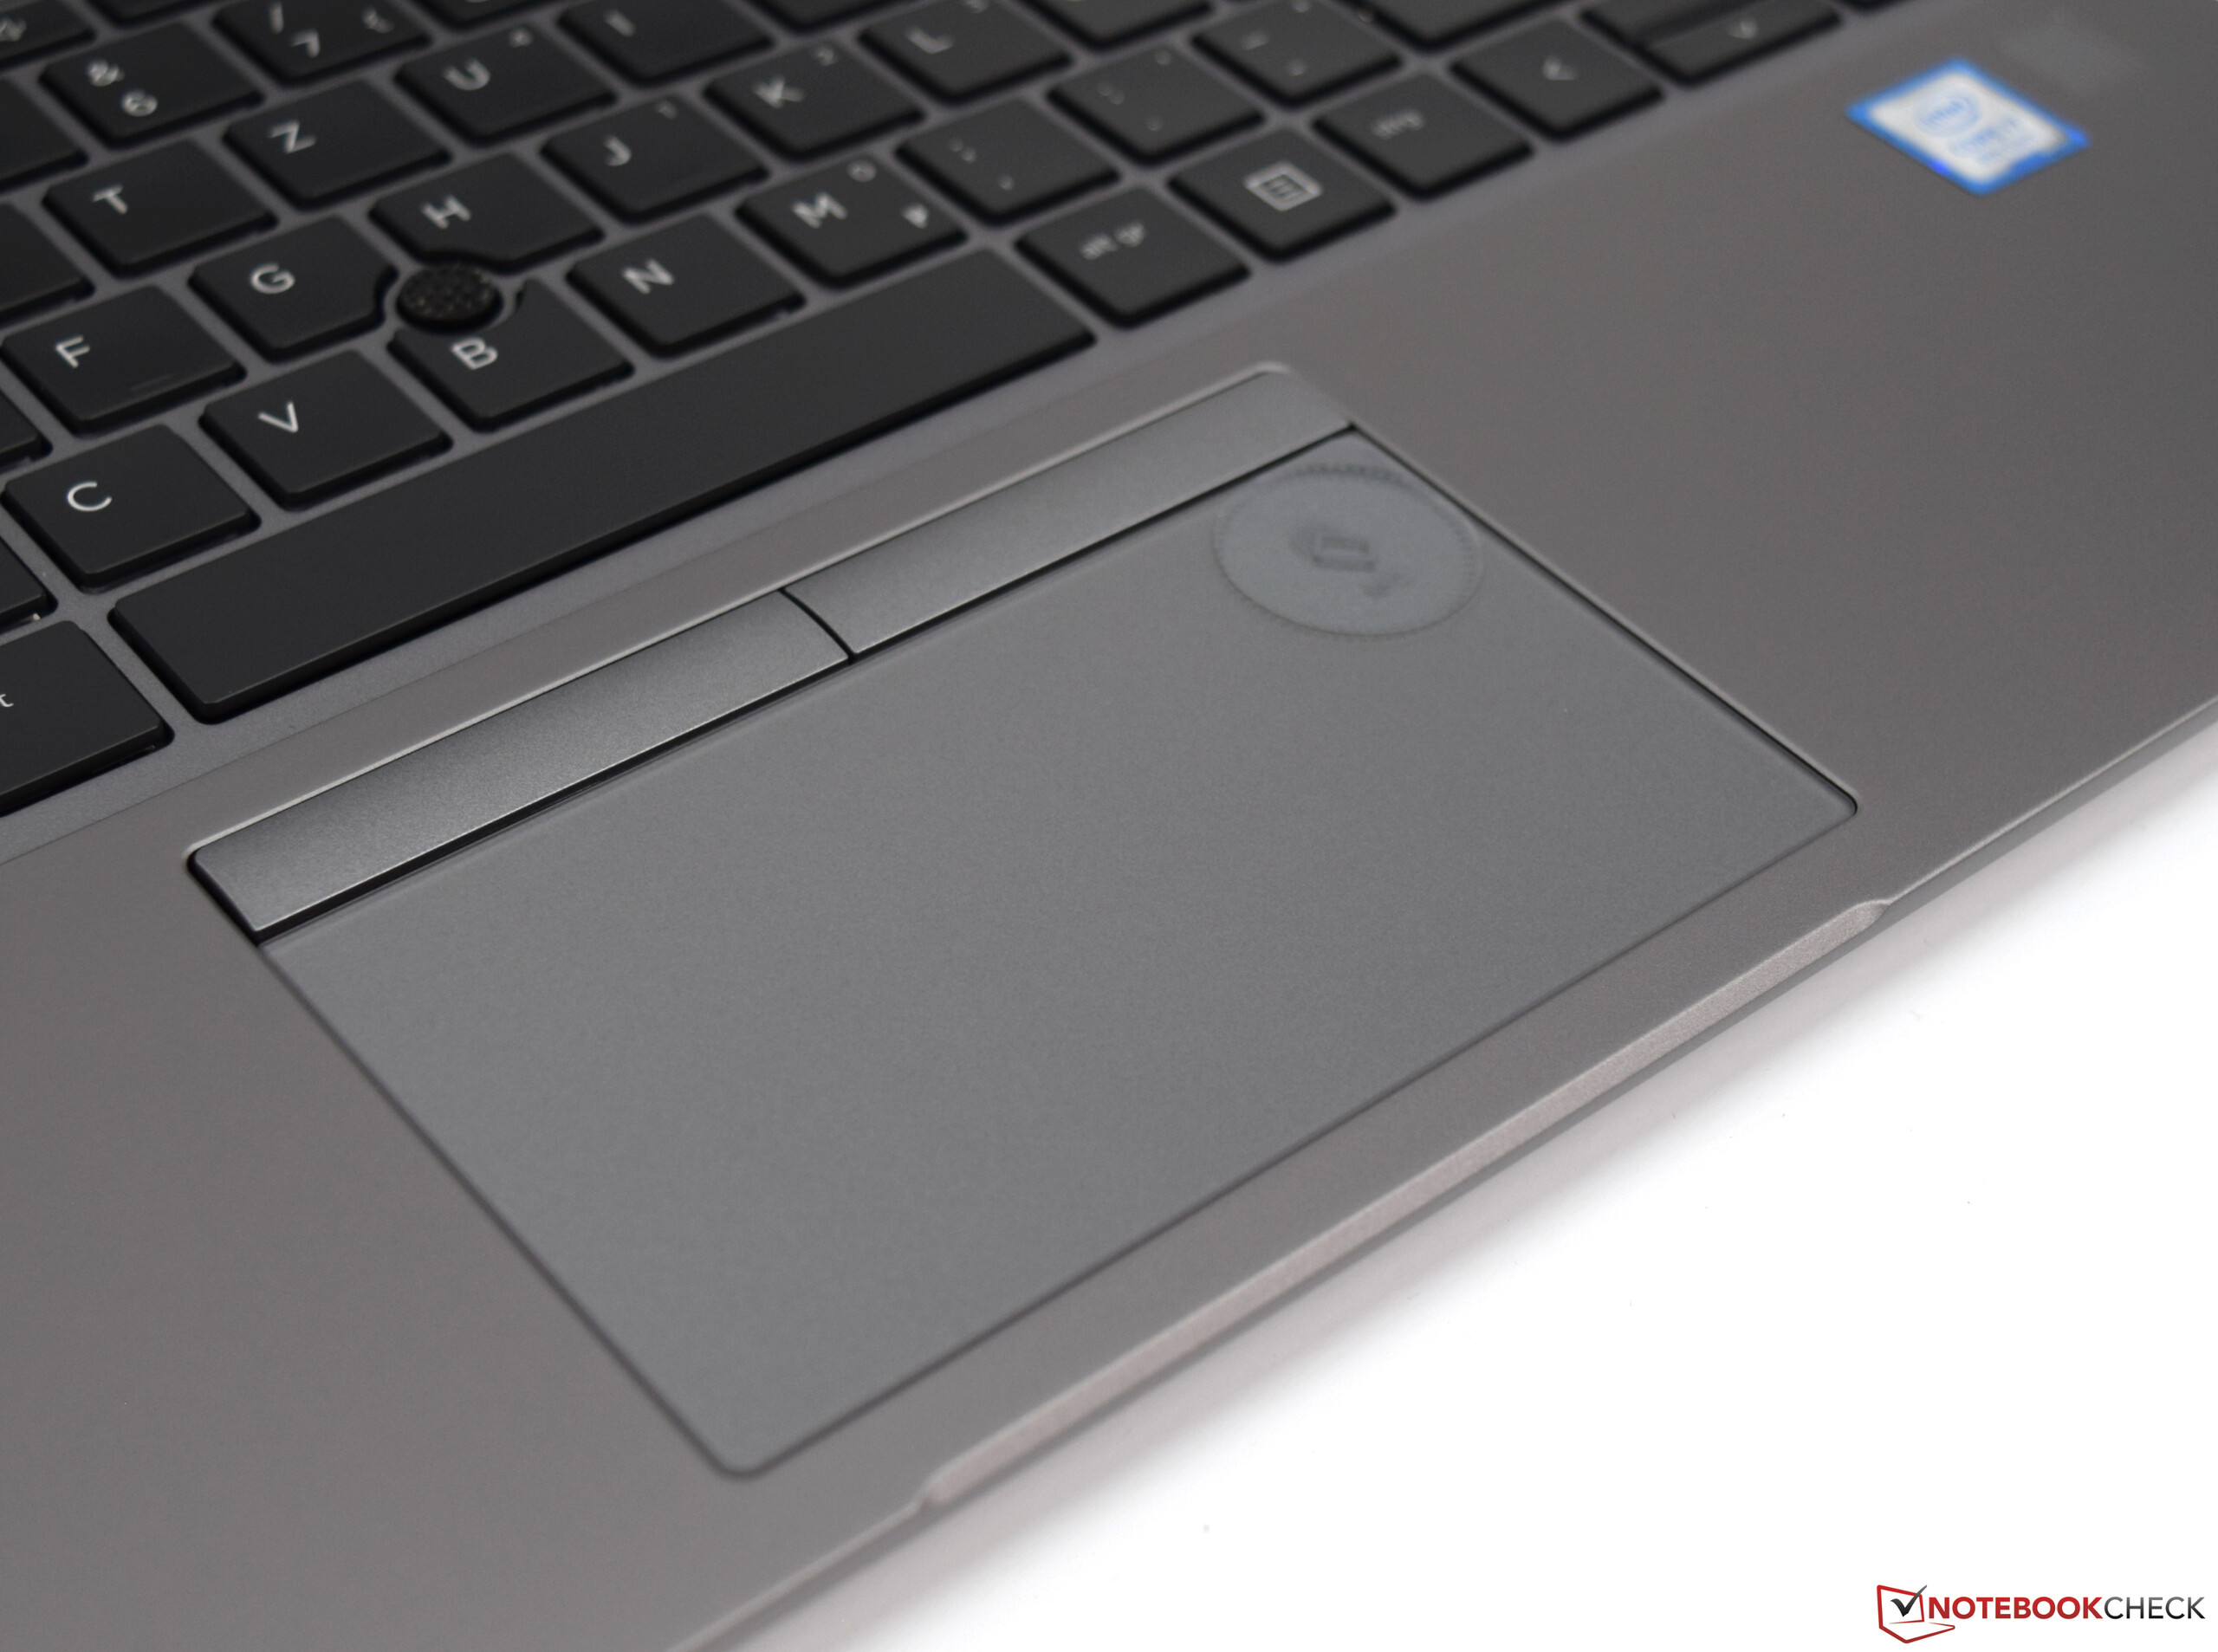
(+) Os apoios para as mãos e o touchpad são mais frios que a temperatura da pele, com um máximo de 29.9 °C / 85.8 F e, portanto, são frios ao toque.
(-) A temperatura média da área do apoio para as mãos de dispositivos semelhantes foi 27.8 °C / 82 F (-2.1 °C / -3.8 F).
| HP ZBook 14u G6 6TP71EA i7-8565U, Radeon Pro WX 3200 | HP ZBook 14u G5-2ZB99EA i5-8550U, Radeon Pro WX 3100 | Dell Precision 5530 2-in-1 i7-8706G, WX Vega M GL | Lenovo ThinkPad P52s-20LB000HGE i5-8550U, Quadro P500 | Média AMD Radeon Pro WX 3200 | Média da turma Workstation | |
|---|---|---|---|---|---|---|
| Heat | 1% | -21% | -14% | -1% | -17% | |
| Maximum Upper Side * (°C) | 40.8 | 39.7 3% | 48.6 -19% | 41.8 -2% | 40.7 ? -0% | 43.8 ? -7% |
| Maximum Bottom * (°C) | 43 | 42.7 1% | 42.2 2% | 55.9 -30% | 44 ? -2% | 45 ? -5% |
| Idle Upper Side * (°C) | 24.1 | 24.2 -0% | 31.6 -31% | 26.3 -9% | 24.3 ? -1% | 30.6 ? -27% |
| Idle Bottom * (°C) | 24.4 | 24.6 -1% | 33.2 -36% | 27.7 -14% | 24.9 ? -2% | 31.6 ? -30% |
* ... menor é melhor
HP ZBook 14u G6 6TP71EA análise de áudio
(±) | o volume do alto-falante é médio, mas bom (###valor### dB)
Graves 100 - 315Hz
(-) | quase nenhum baixo - em média 20.4% menor que a mediana
(±) | a linearidade dos graves é média (11.9% delta para a frequência anterior)
Médios 400 - 2.000 Hz
(+) | médios equilibrados - apenas 1.5% longe da mediana
(+) | médios são lineares (5.3% delta para frequência anterior)
Altos 2 - 16 kHz
(+) | agudos equilibrados - apenas 4.3% longe da mediana
(+) | os máximos são lineares (2.8% delta da frequência anterior)
Geral 100 - 16.000 Hz
(±) | a linearidade do som geral é média (18.8% diferença em relação à mediana)
Comparado com a mesma classe
» 65% de todos os dispositivos testados nesta classe foram melhores, 6% semelhantes, 29% piores
» O melhor teve um delta de 7%, a média foi 17%, o pior foi 35%
Comparado com todos os dispositivos testados
» 43% de todos os dispositivos testados foram melhores, 8% semelhantes, 49% piores
» O melhor teve um delta de 4%, a média foi 24%, o pior foi 134%
Lenovo ThinkPad P52s-20LB000HGE análise de áudio
(±) | o volume do alto-falante é médio, mas bom (###valor### dB)
Graves 100 - 315Hz
(-) | quase nenhum baixo - em média 15% menor que a mediana
(±) | a linearidade dos graves é média (11.7% delta para a frequência anterior)
Médios 400 - 2.000 Hz
(±) | médios mais altos - em média 5.6% maior que a mediana
(+) | médios são lineares (5.7% delta para frequência anterior)
Altos 2 - 16 kHz
(+) | agudos equilibrados - apenas 3.1% longe da mediana
(+) | os máximos são lineares (5.7% delta da frequência anterior)
Geral 100 - 16.000 Hz
(±) | a linearidade do som geral é média (17.8% diferença em relação à mediana)
Comparado com a mesma classe
» 55% de todos os dispositivos testados nesta classe foram melhores, 11% semelhantes, 34% piores
» O melhor teve um delta de 7%, a média foi 17%, o pior foi 35%
Comparado com todos os dispositivos testados
» 36% de todos os dispositivos testados foram melhores, 8% semelhantes, 56% piores
» O melhor teve um delta de 4%, a média foi 24%, o pior foi 134%
| desligado | |
| Ocioso | |
| Carga |
|
Key:
min: | |
| HP ZBook 14u G6 6TP71EA i7-8565U, Radeon Pro WX 3200 | HP ZBook 14u G5-2ZB99EA i5-8550U, Radeon Pro WX 3100 | Dell Precision 5530 2-in-1 i7-8706G, WX Vega M GL | Lenovo ThinkPad P52s-20LB000HGE i5-8550U, Quadro P500 | Média AMD Radeon Pro WX 3200 | Média da turma Workstation | |
|---|---|---|---|---|---|---|
| Power Consumption | 14% | -48% | 8% | -7% | -92% | |
| Idle Minimum * (Watt) | 4.2 | 3.4 19% | 7.4 -76% | 4.1 2% | 4.85 ? -15% | 8.94 ? -113% |
| Idle Average * (Watt) | 7.93 | 5.6 29% | 12.4 -56% | 7.7 3% | 8.87 ? -12% | 13.8 ? -74% |
| Idle Maximum * (Watt) | 10.9 | 8.5 22% | 13.3 -22% | 10.7 2% | 11.5 ? -6% | 17.5 ? -61% |
| Load Average * (Watt) | 59.1 | 55.2 7% | 79.2 -34% | 52 12% | 59.1 ? -0% | 95 ? -61% |
| Witcher 3 ultra * (Watt) | 50.4 | 46 9% | 82.2 -63% | 38.8 23% | ||
| Load Maximum * (Watt) | 70.5 | 71.4 -1% | 96.5 -37% | 65 8% | 70.3 ? -0% | 175.2 ? -149% |
* ... menor é melhor
| HP ZBook 14u G6 6TP71EA i7-8565U, Radeon Pro WX 3200, 50 Wh | HP ZBook 14u G5-2ZB99EA i5-8550U, Radeon Pro WX 3100, 50 Wh | Dell Precision 5530 2-in-1 i7-8706G, WX Vega M GL, 75 Wh | Lenovo ThinkPad P52s-20LB000HGE i5-8550U, Quadro P500, 104 Wh | Média da turma Workstation | |
|---|---|---|---|---|---|
| Duração da bateria | 30% | -20% | 112% | 9% | |
| Reader / Idle (h) | 17.7 | 19.2 8% | 12.3 -31% | 39.3 122% | 26.1 ? 47% |
| H.264 (h) | 11 | 8.4 -24% | 18.9 72% | 9.51 ? -14% | |
| WiFi v1.3 (h) | 8.5 | 9.6 13% | 7.3 -14% | 16.2 91% | 8.53 ? 0% |
| Load (h) | 1.4 | 3.1 121% | 1.2 -14% | 3.7 164% | 1.429 ? 2% |
Pro
Contra
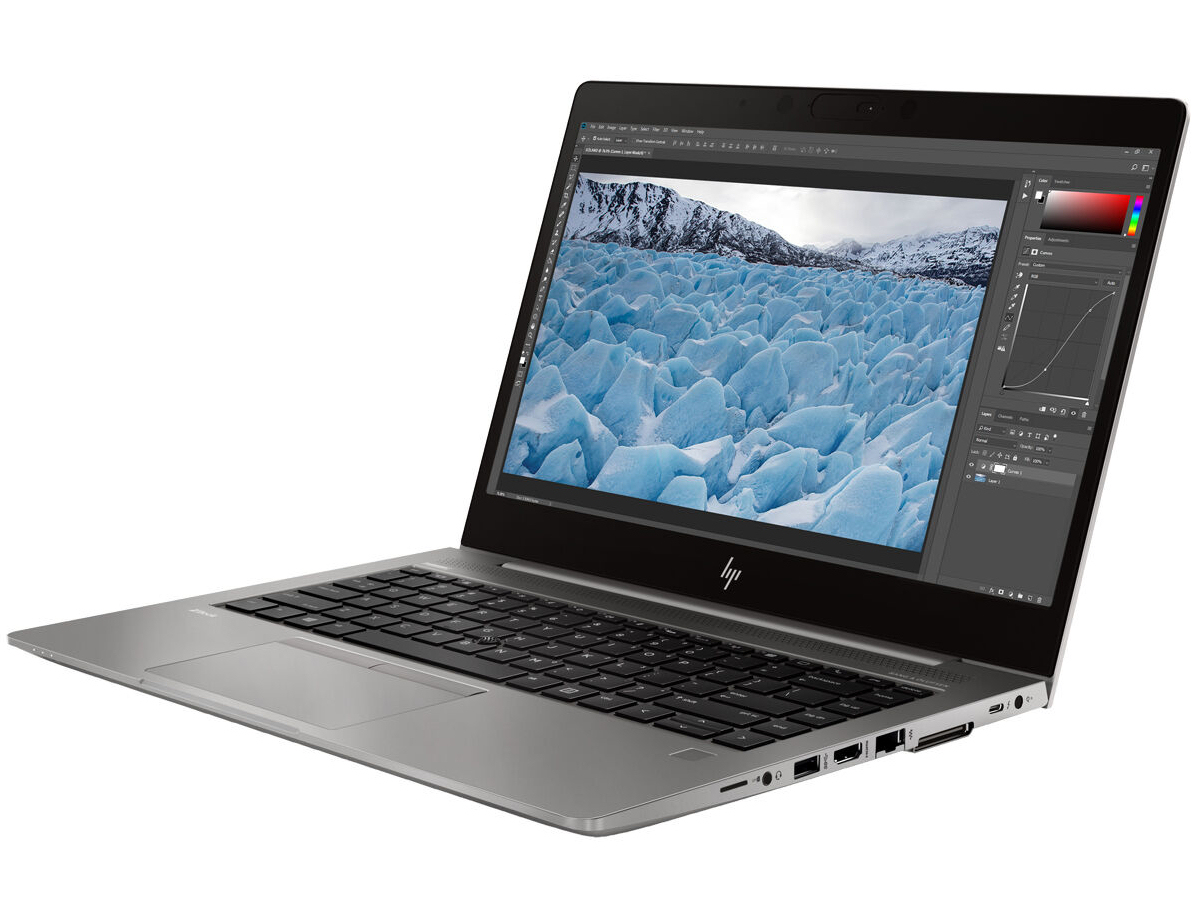
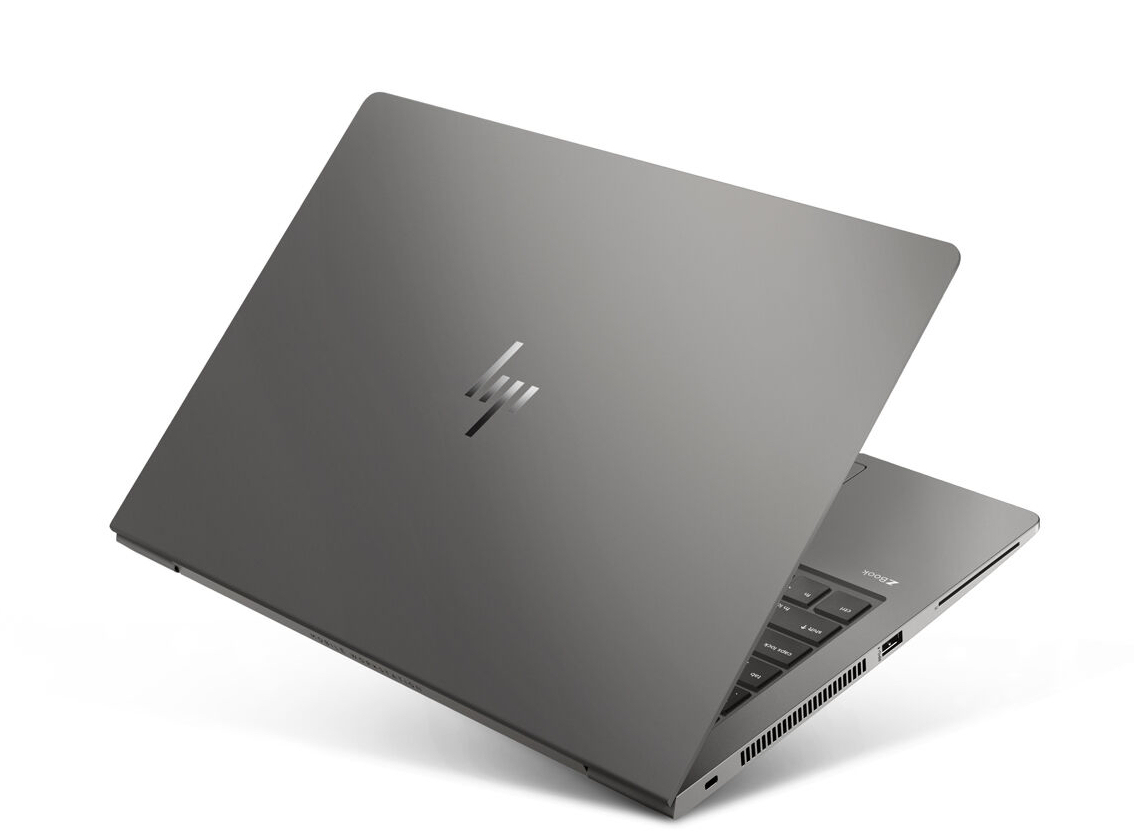
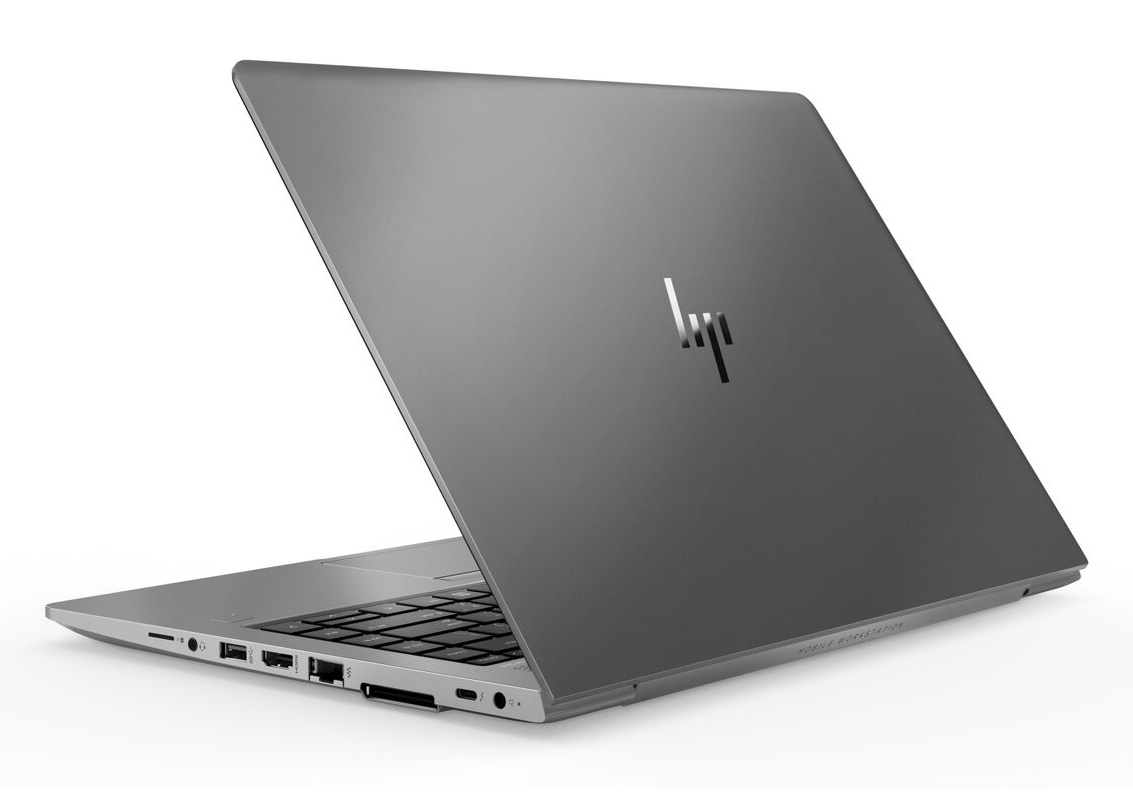
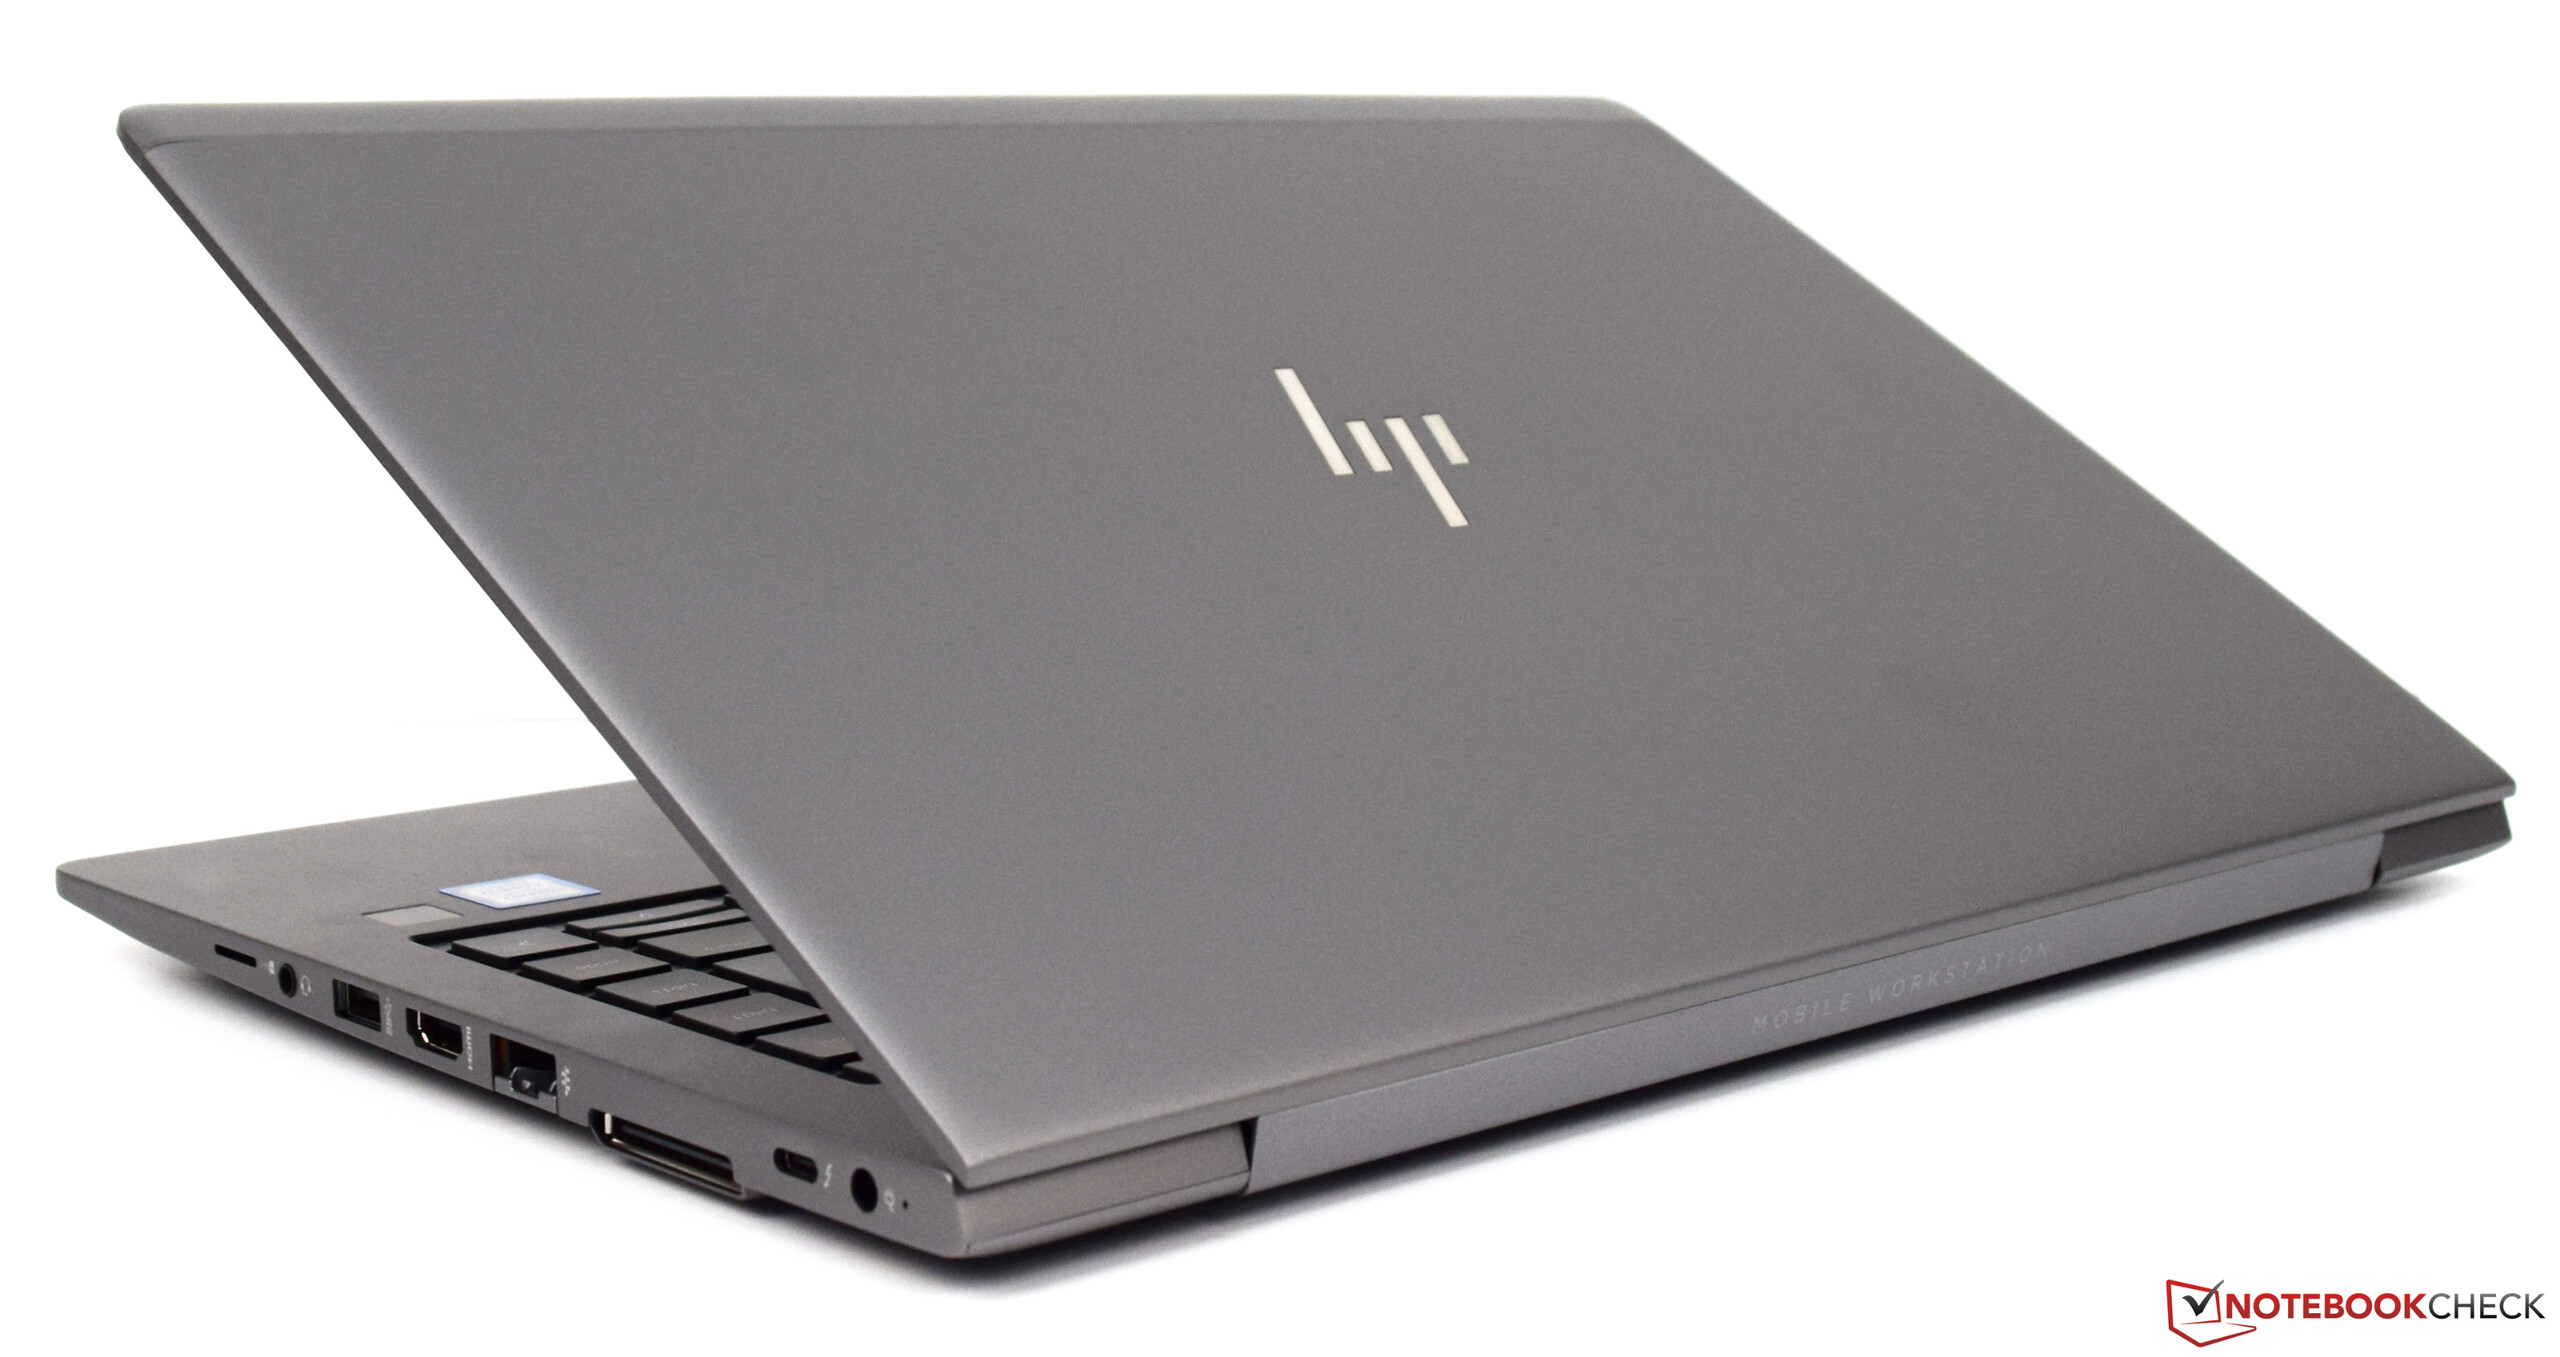
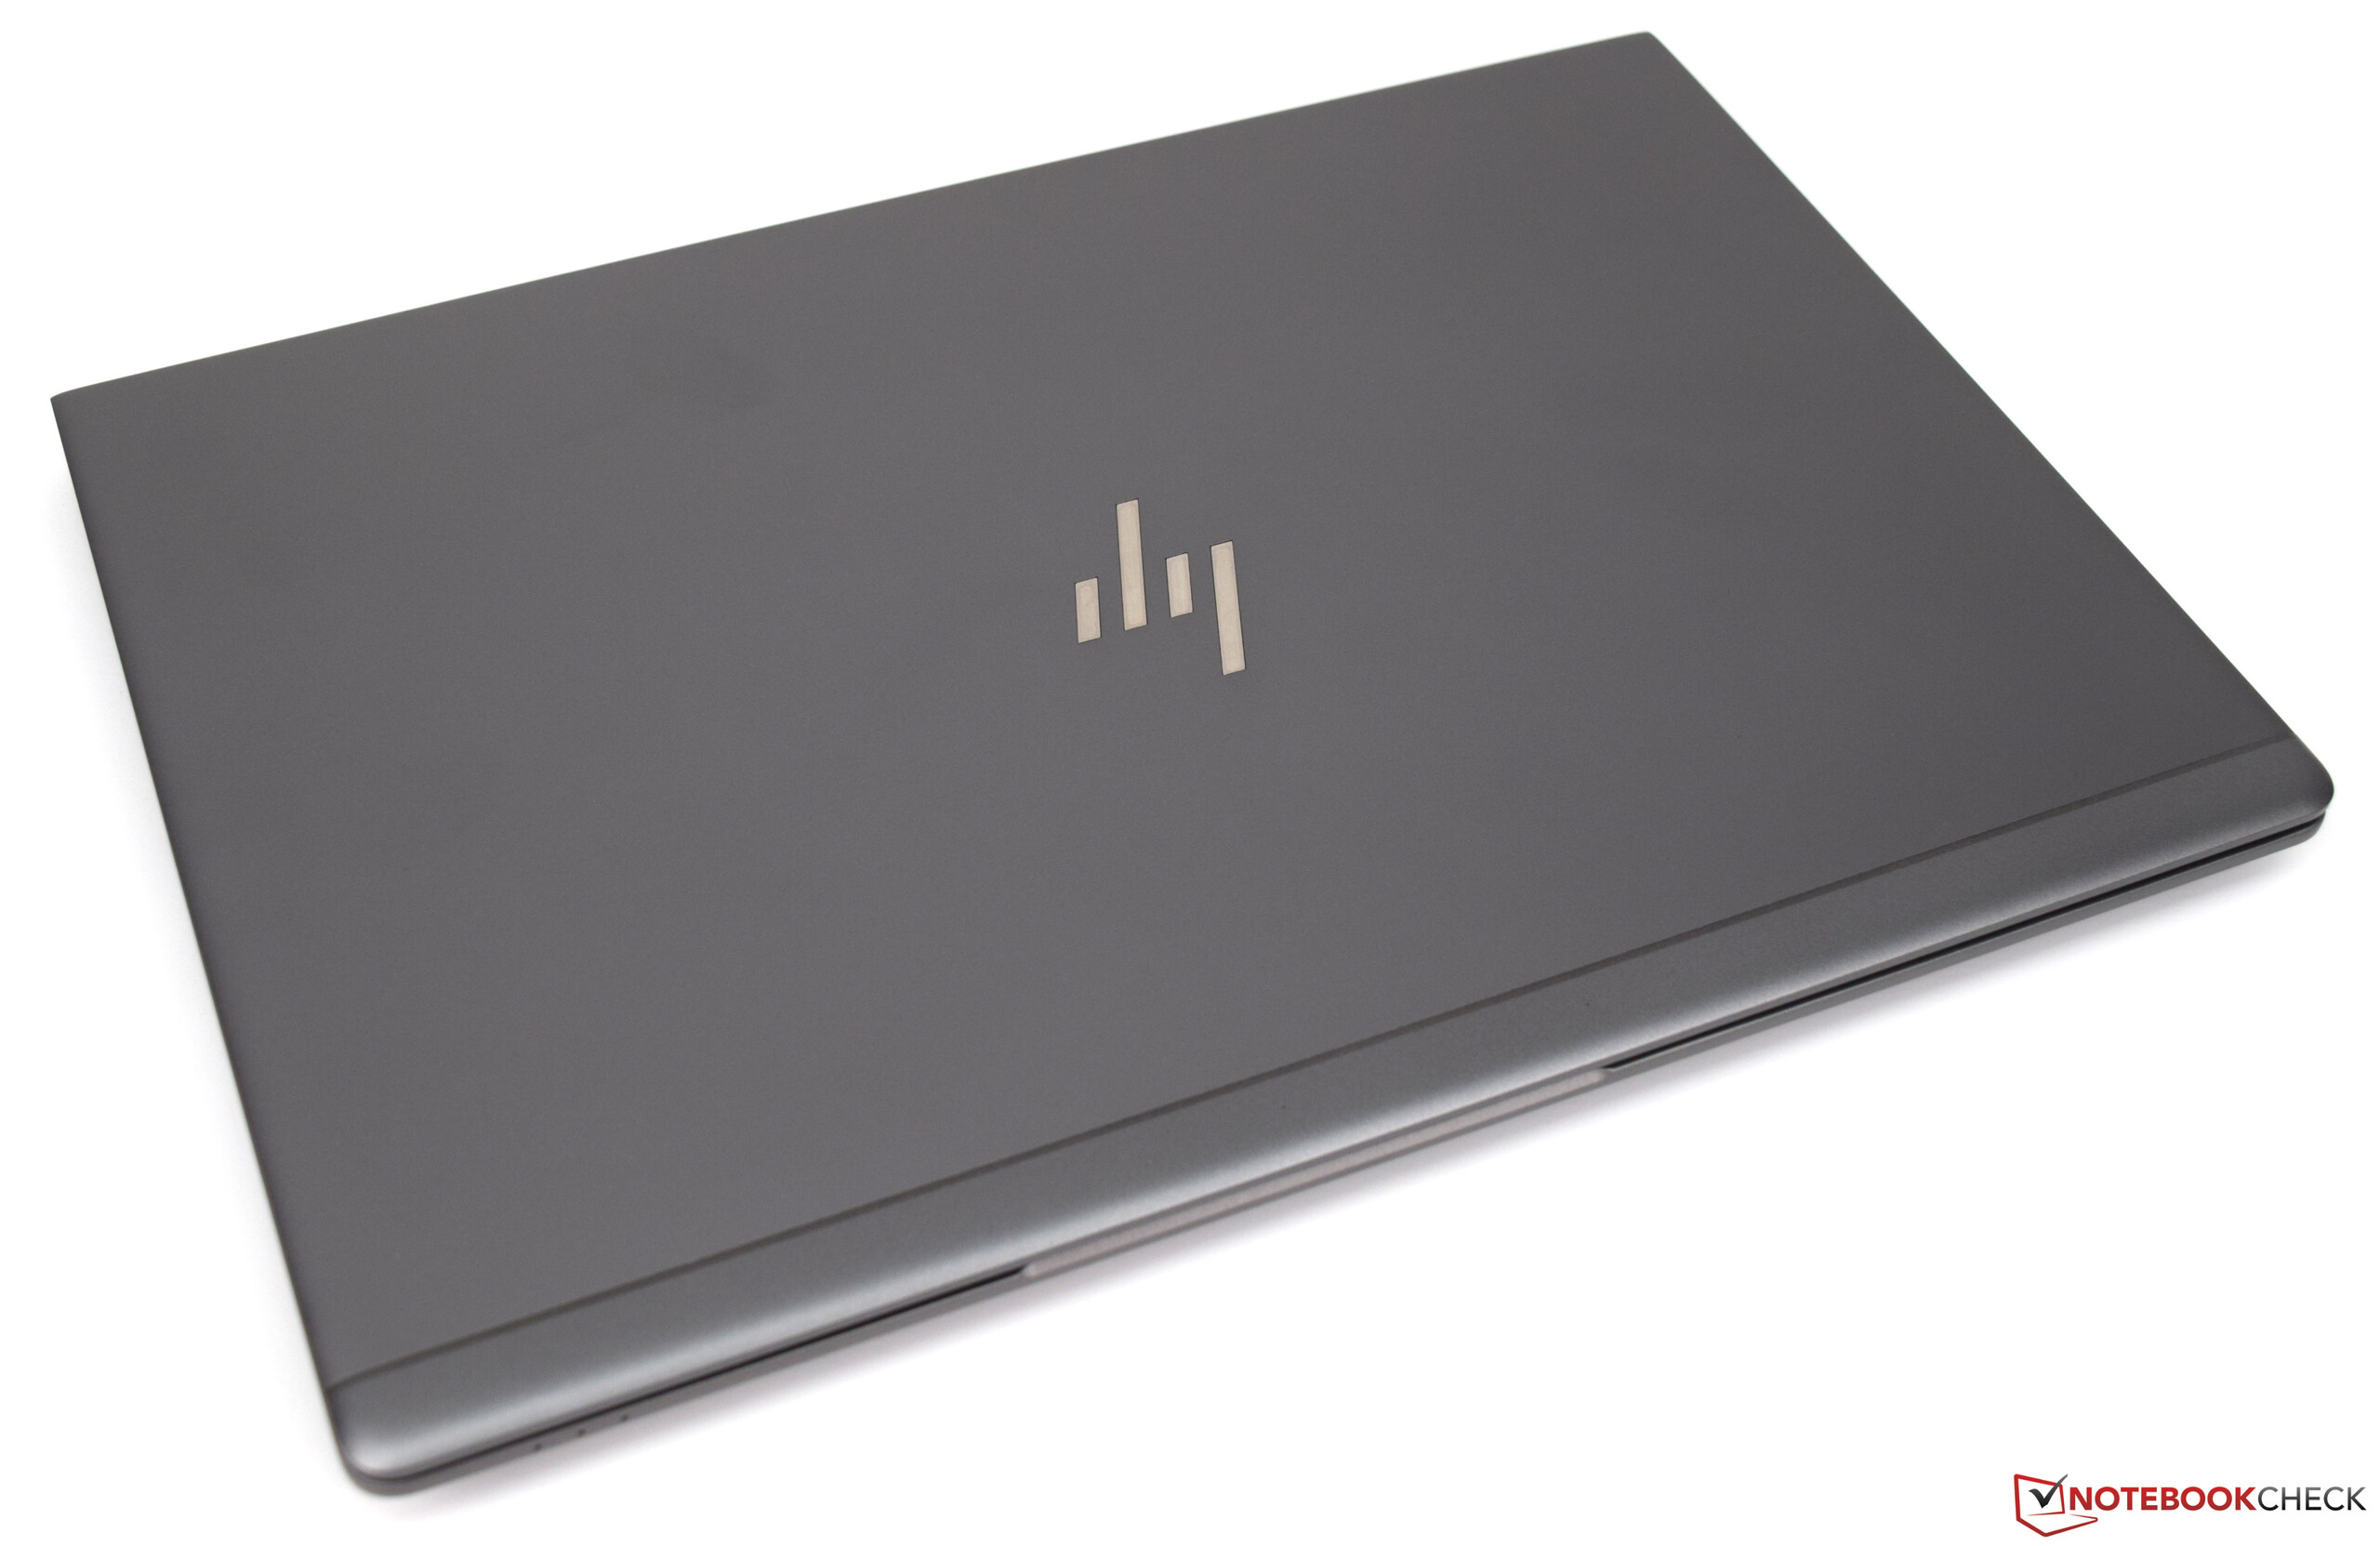
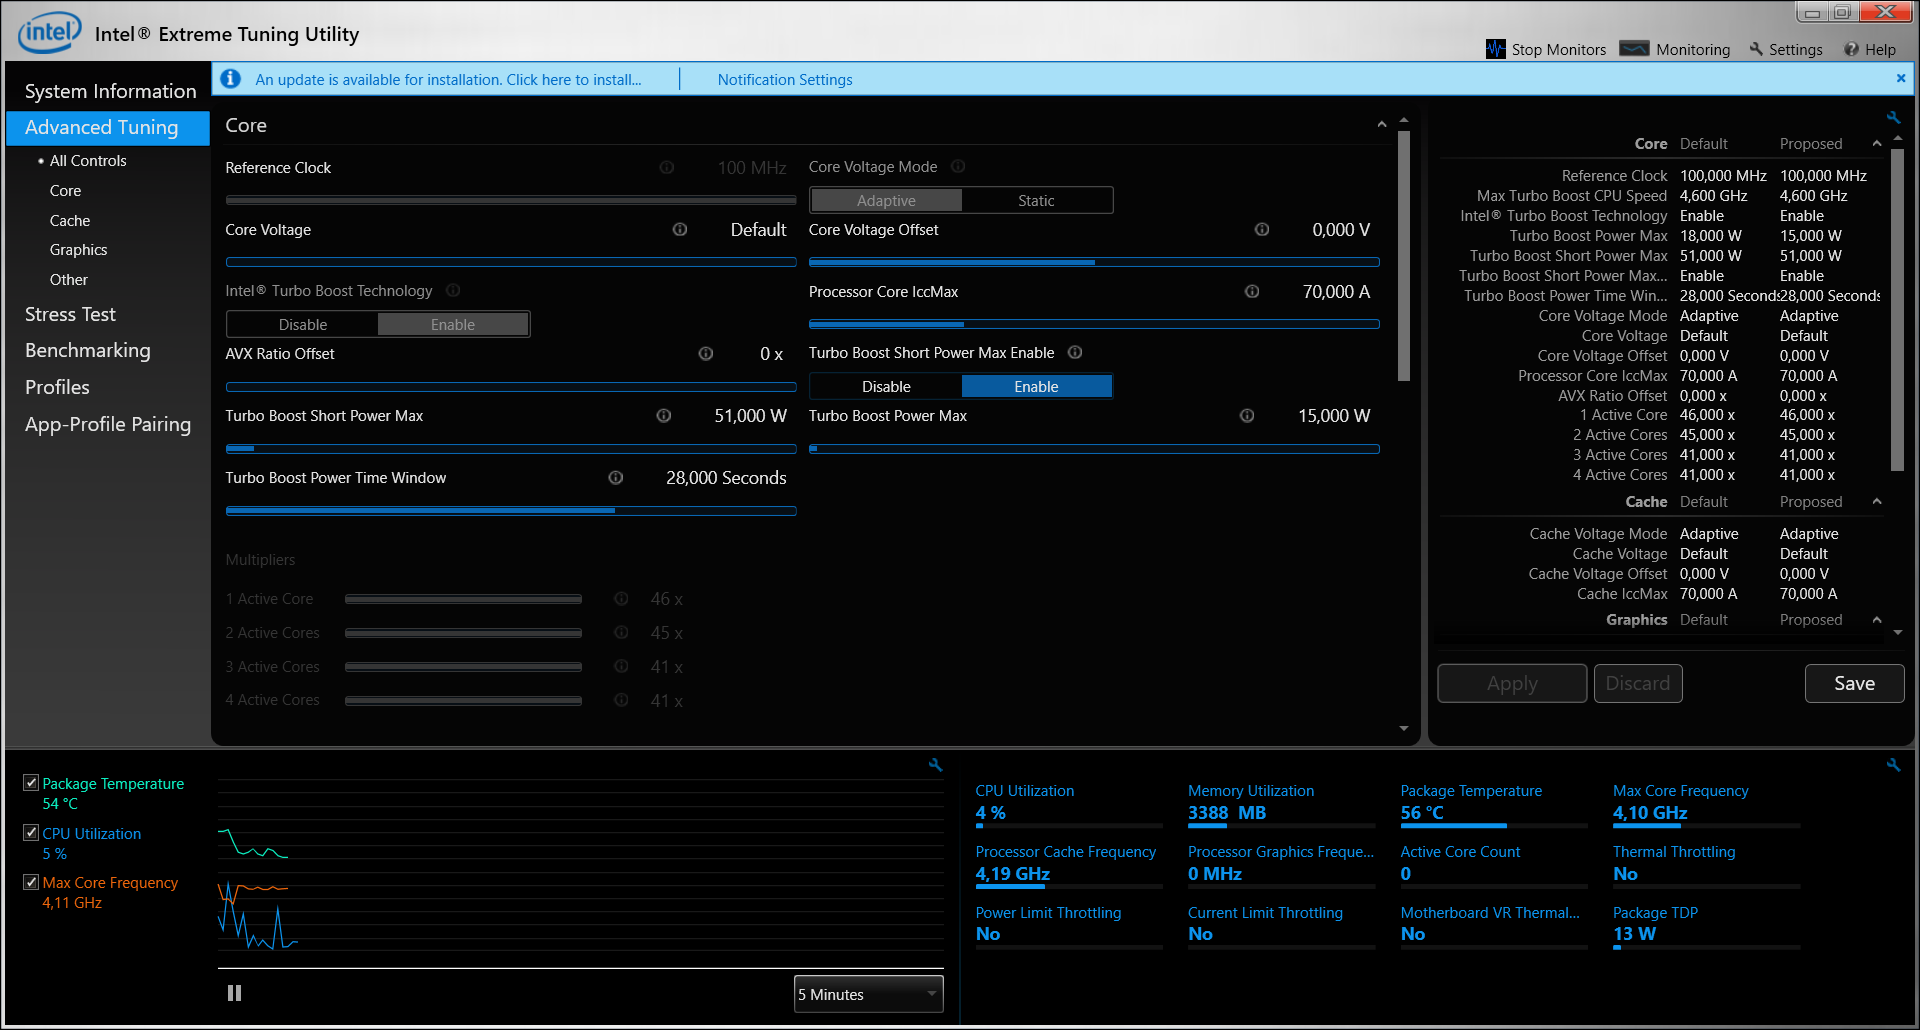
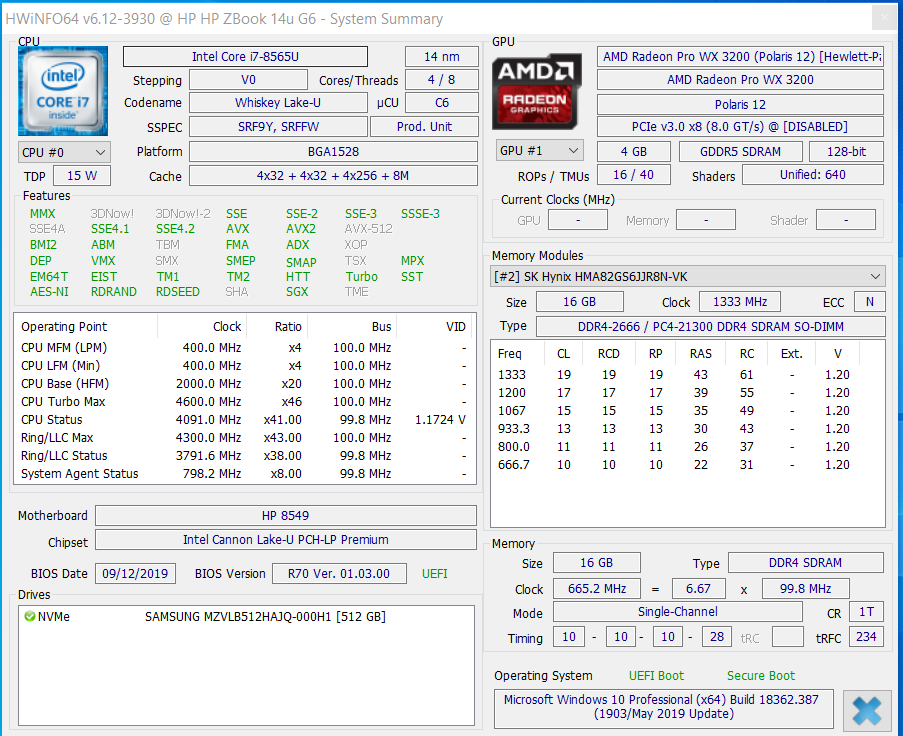
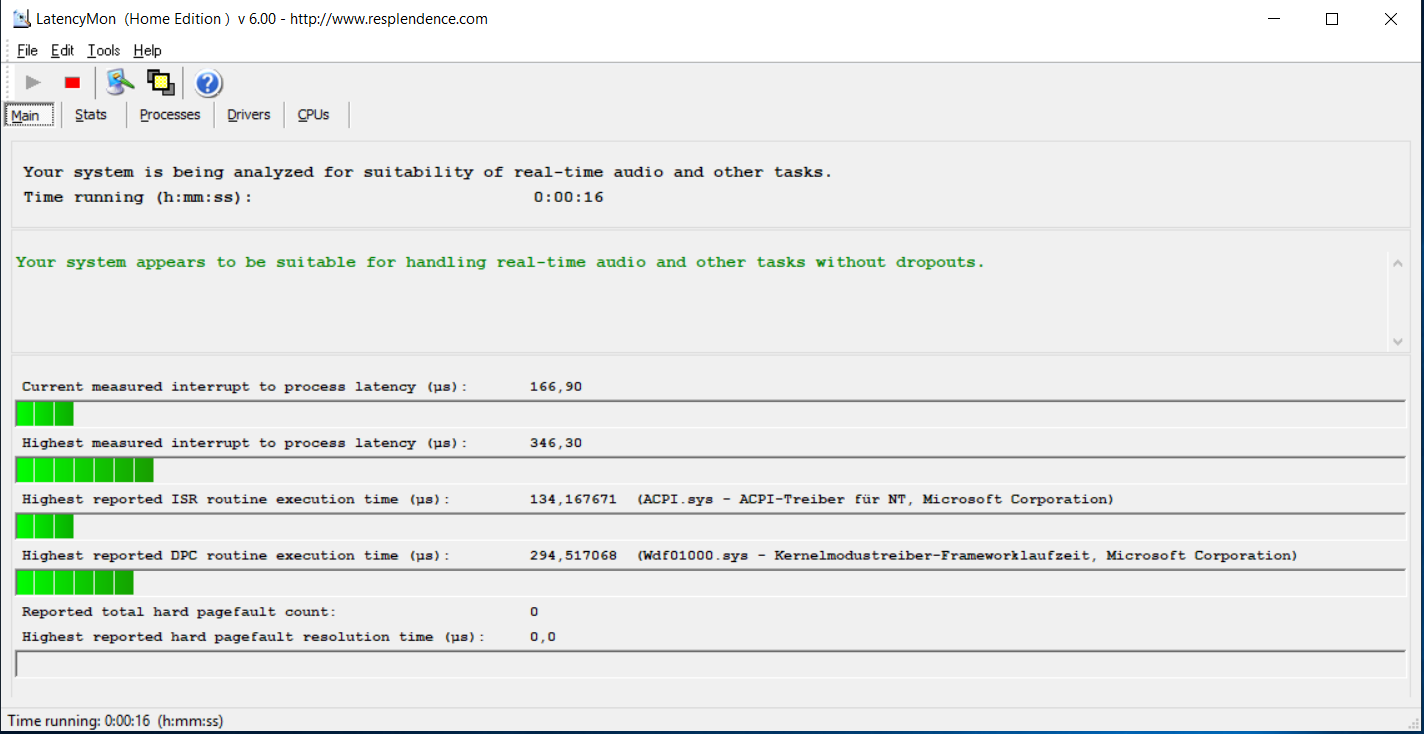
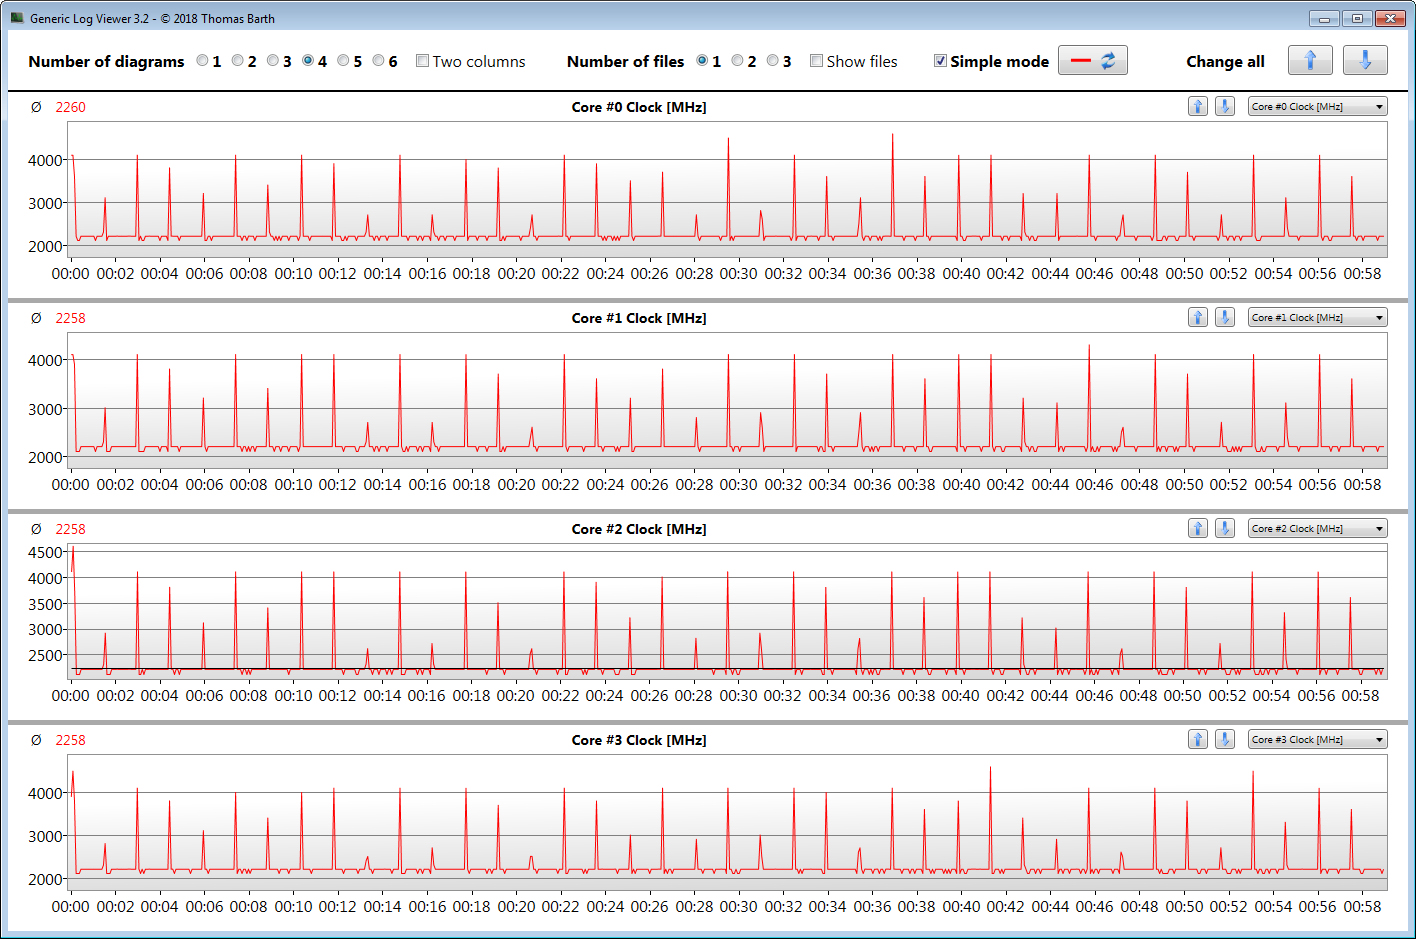
Com o ZBook 14u G6, a Hewlett Packard oferece um workstation móvel compacto de 14 polegadas. Um processador Core i7-8565U e um núcleo gráfico Radeon Pro WX 3200 fornecem a potência de cômputo necessária. No entanto, há uma fraqueza em termos de desenvolvimento de desempenho. Dessa maneira, o processador pode apenas oferecer desempenho de thread único plenamente em grande medida; o desempenho multithread permanece bem abaixo do potencial total.
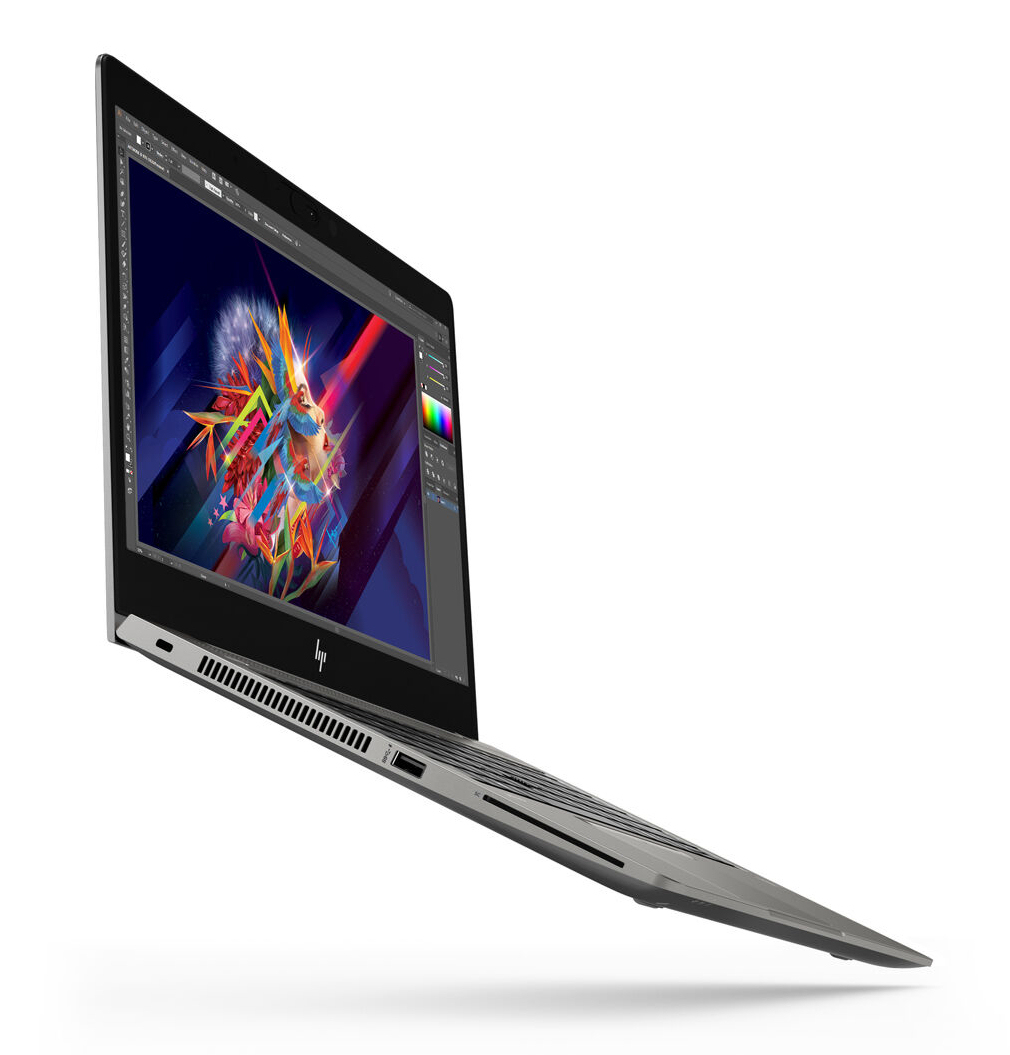
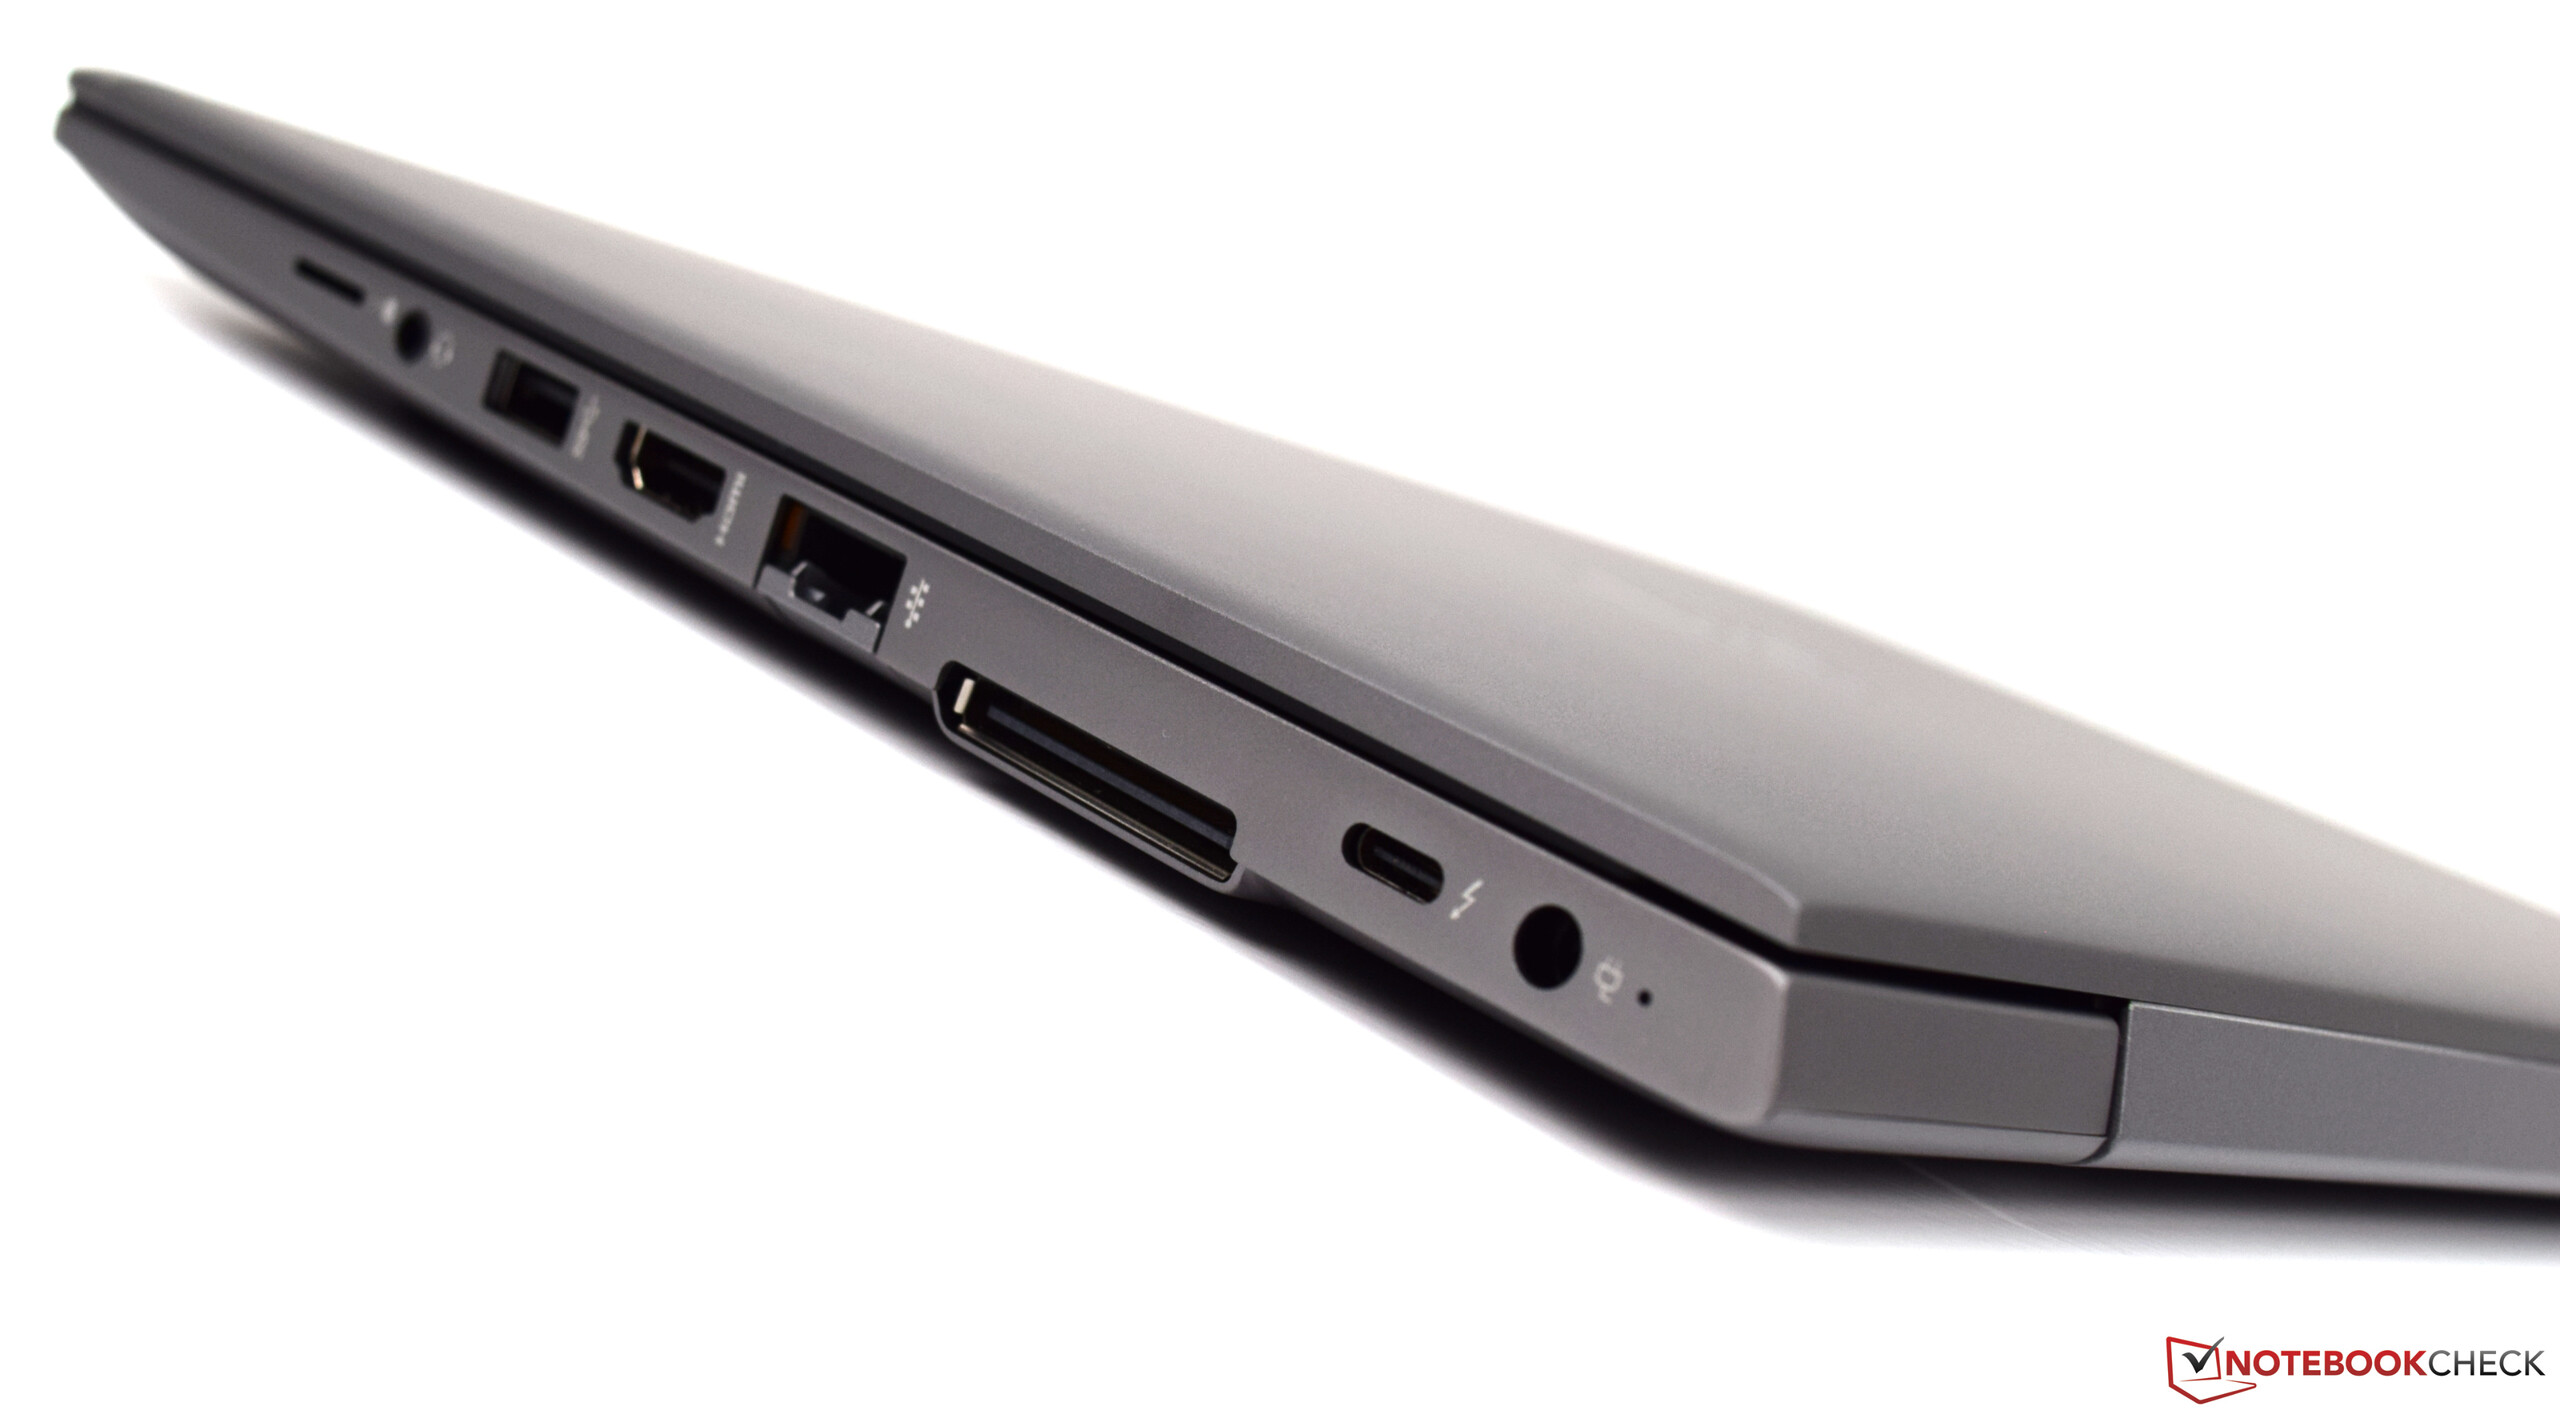
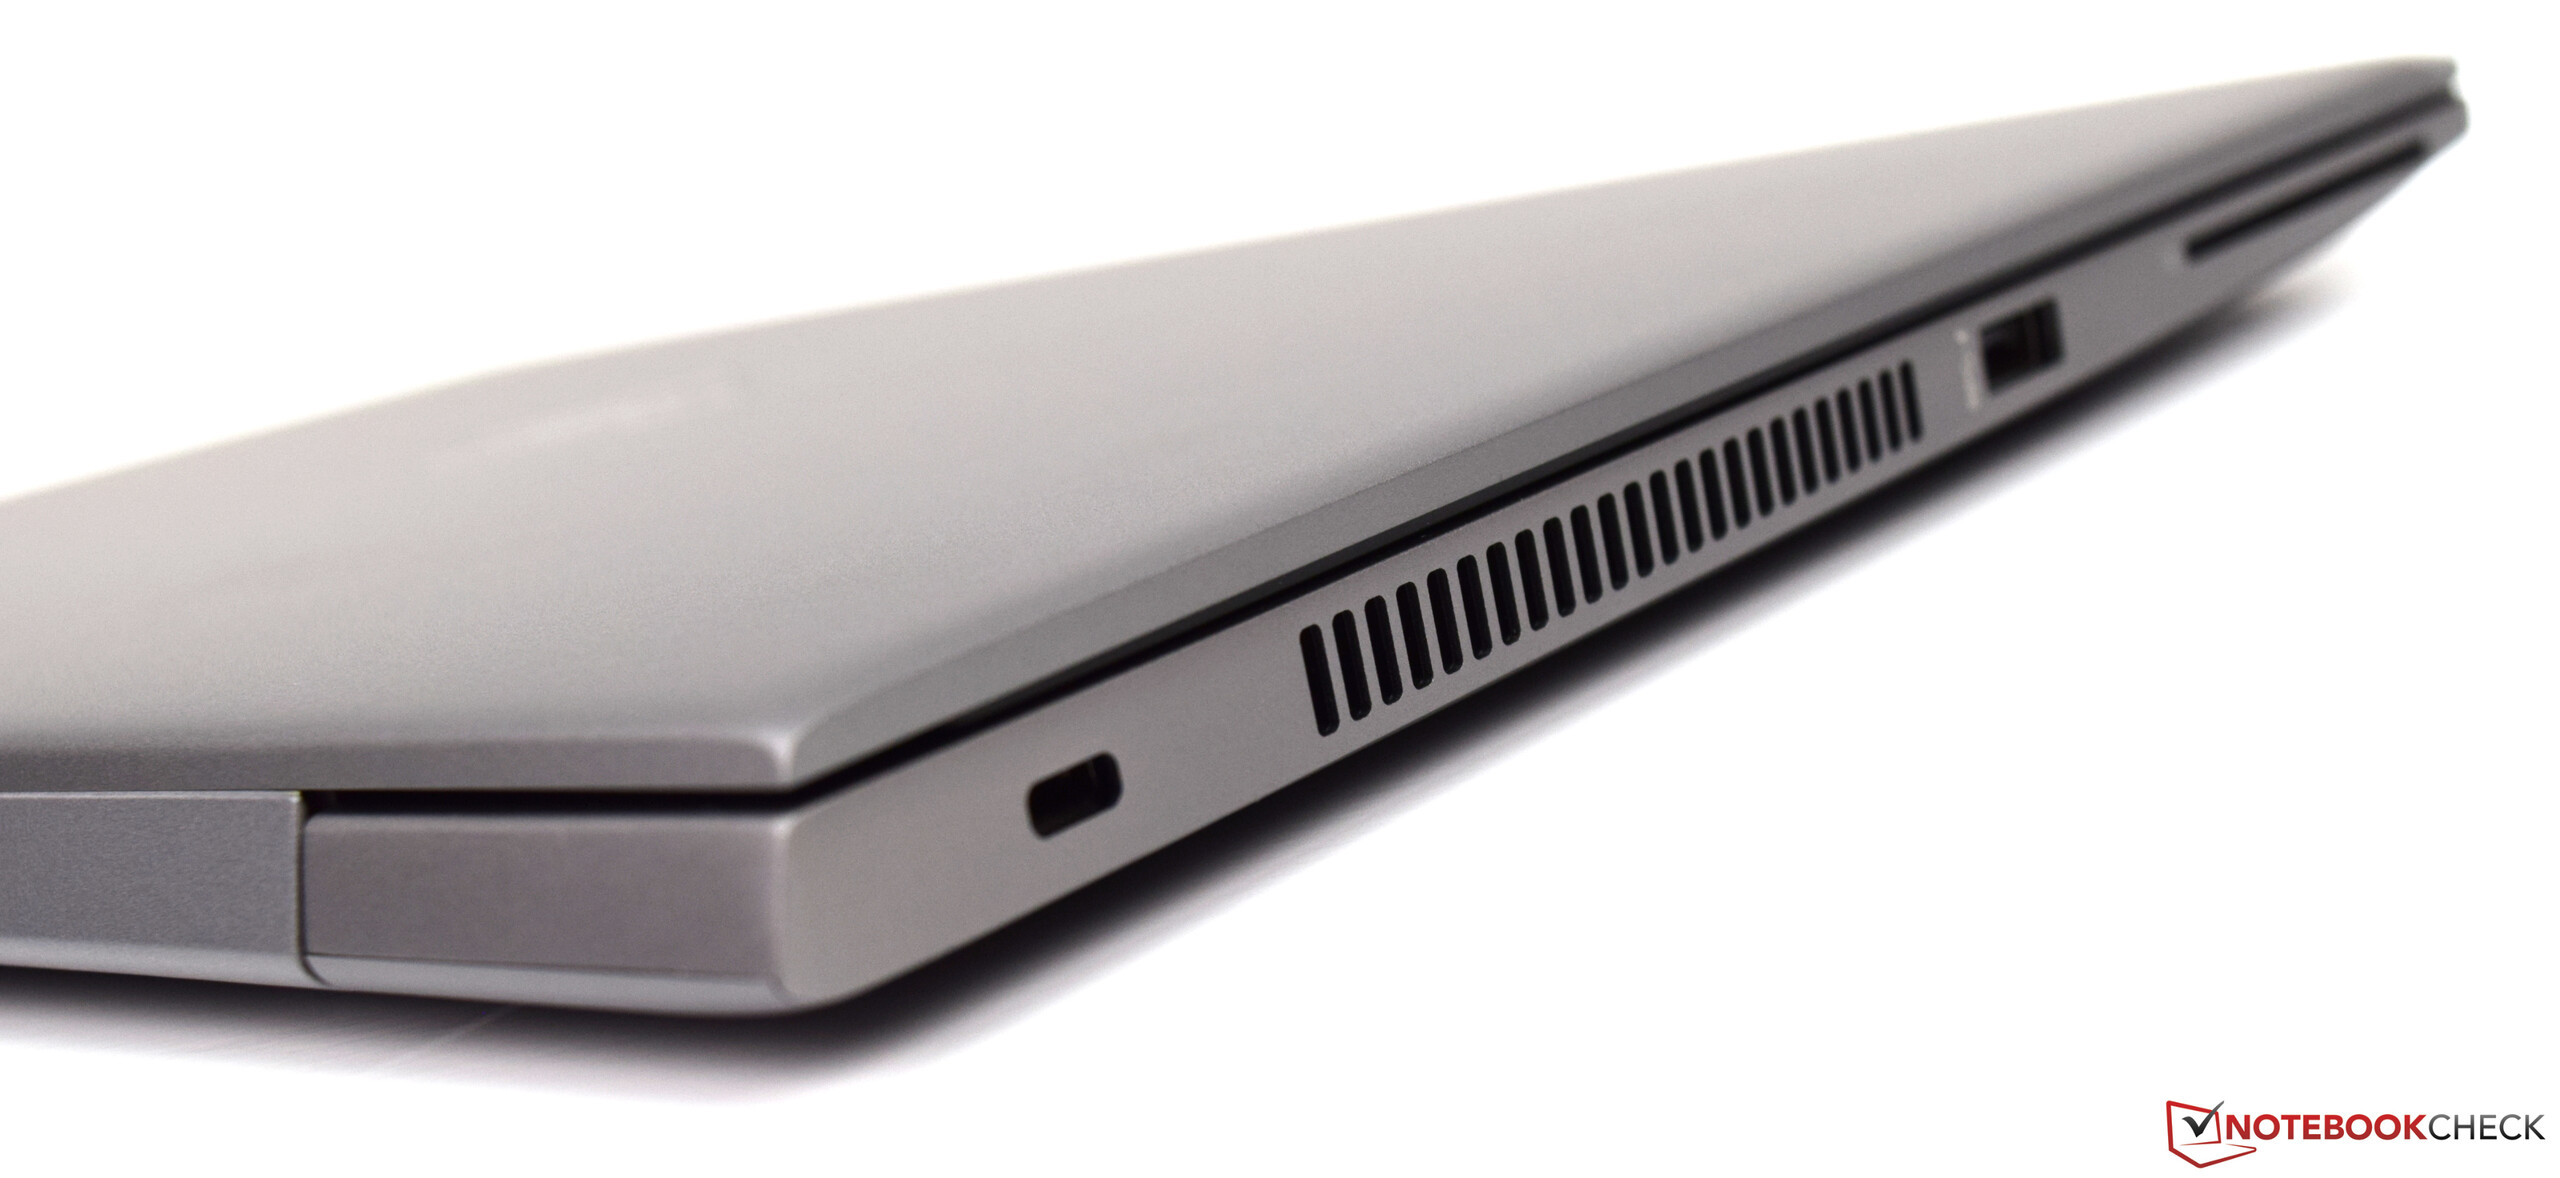
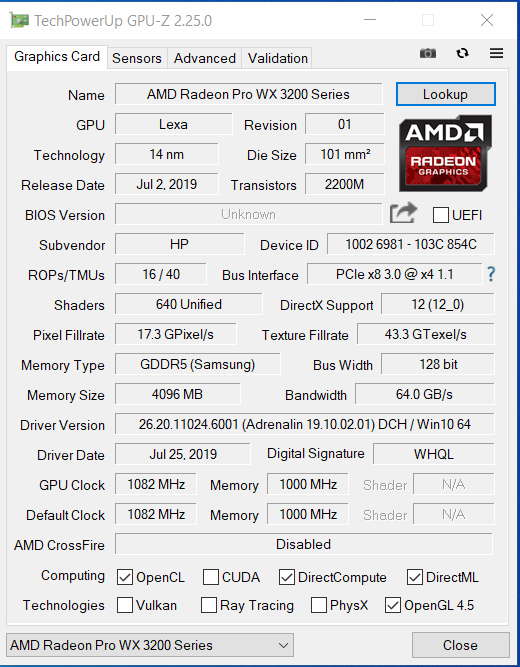
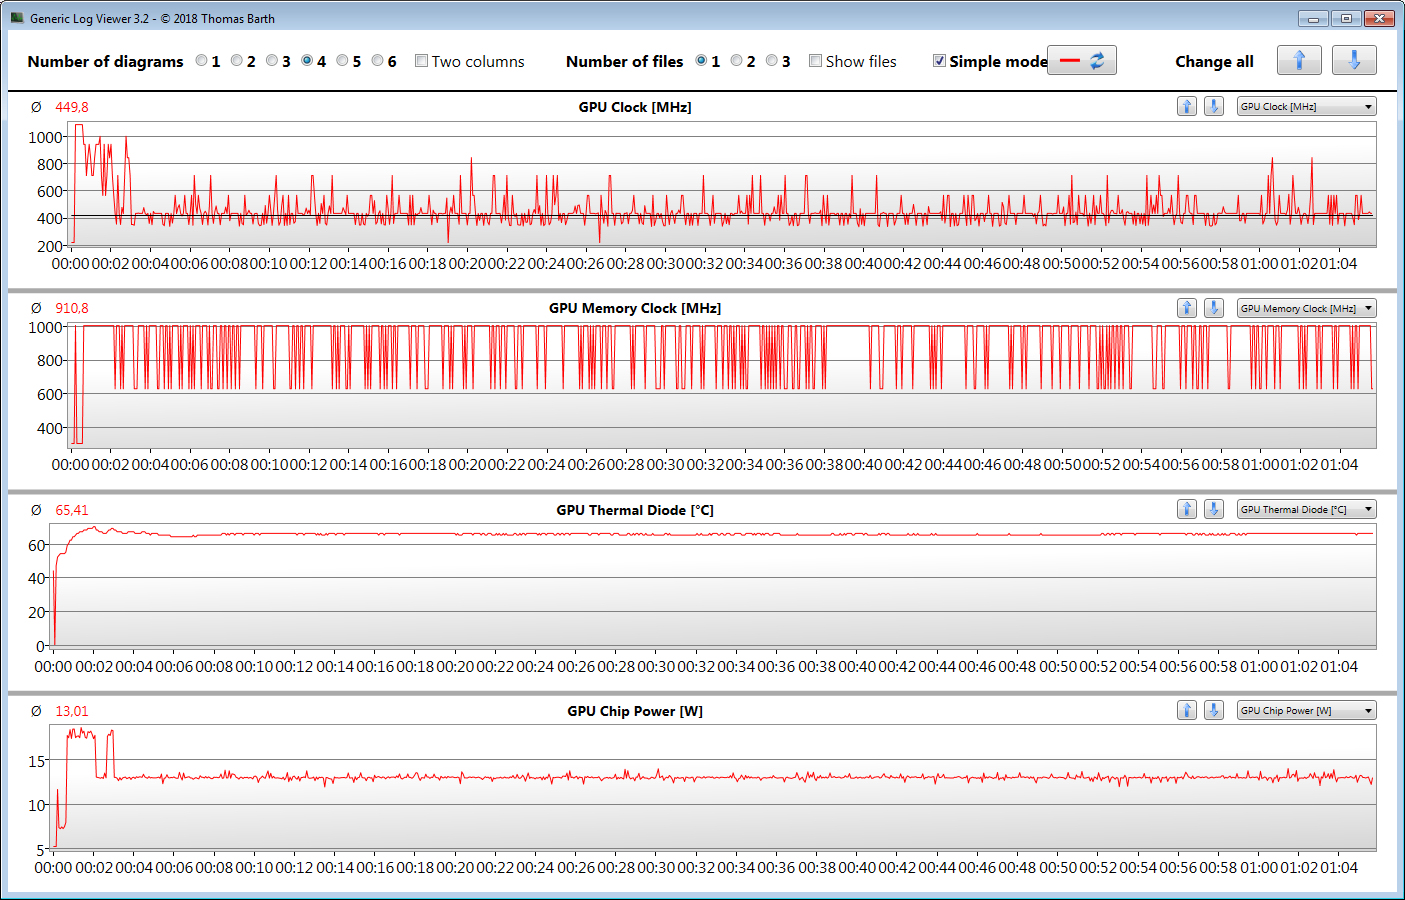
Os usuários que também desejam rodar jogos no portátil não ficarão felizes com o ZBook. O portátil está feito para aplicativos que apenas colocam uma carga leve no núcleo gráfico. Após pouco tempo, a GPU já está significativamente afogada. Se necessário, uma GPU externa mais poderosa pode ser conectada à porta Thunderbolt 3.
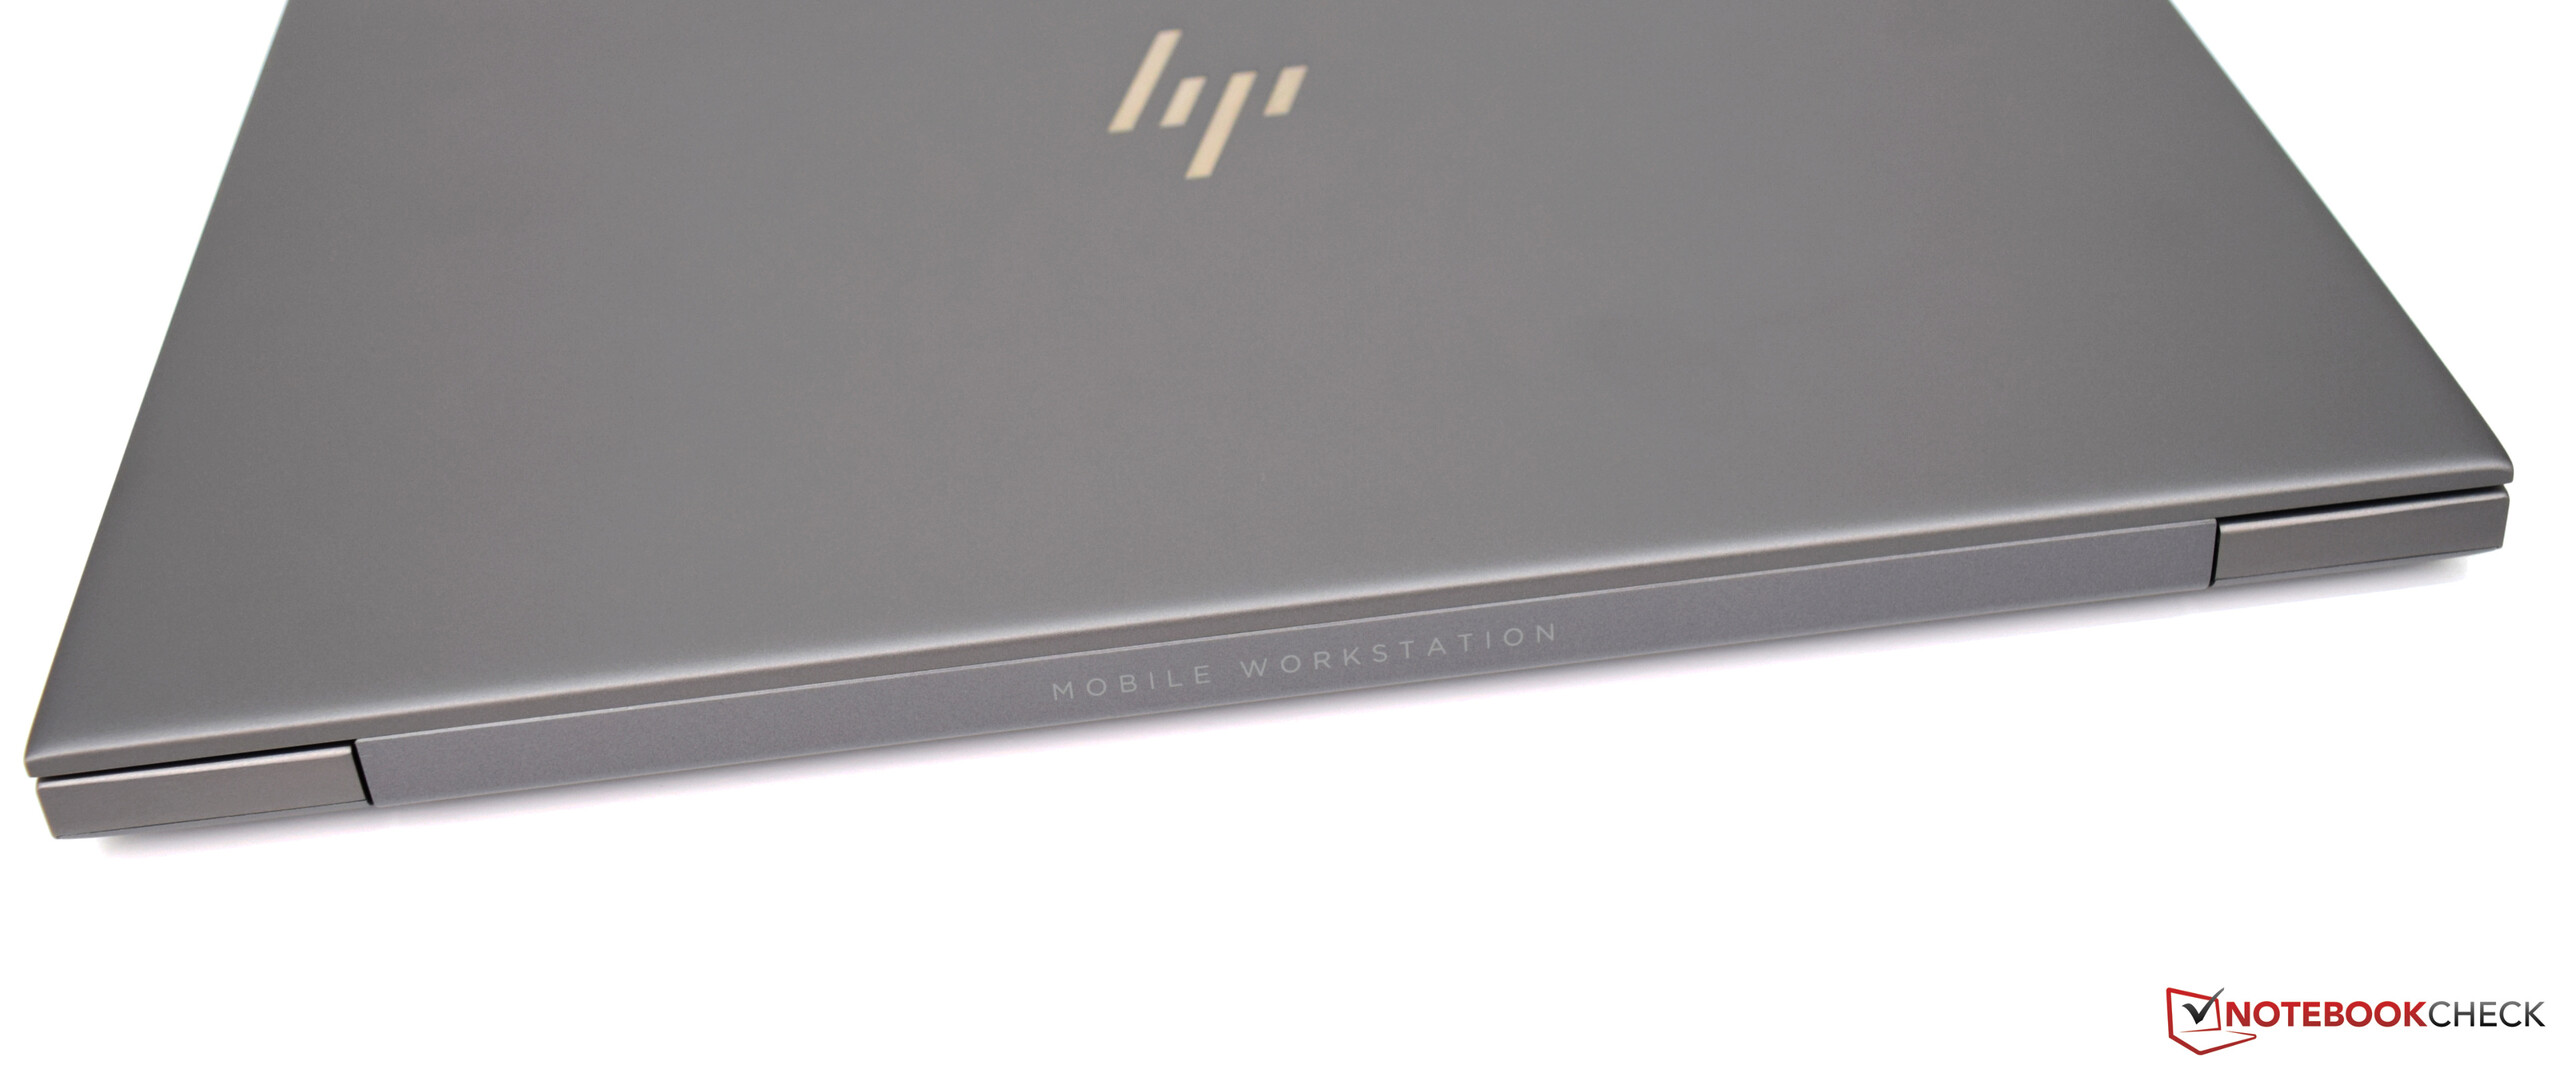
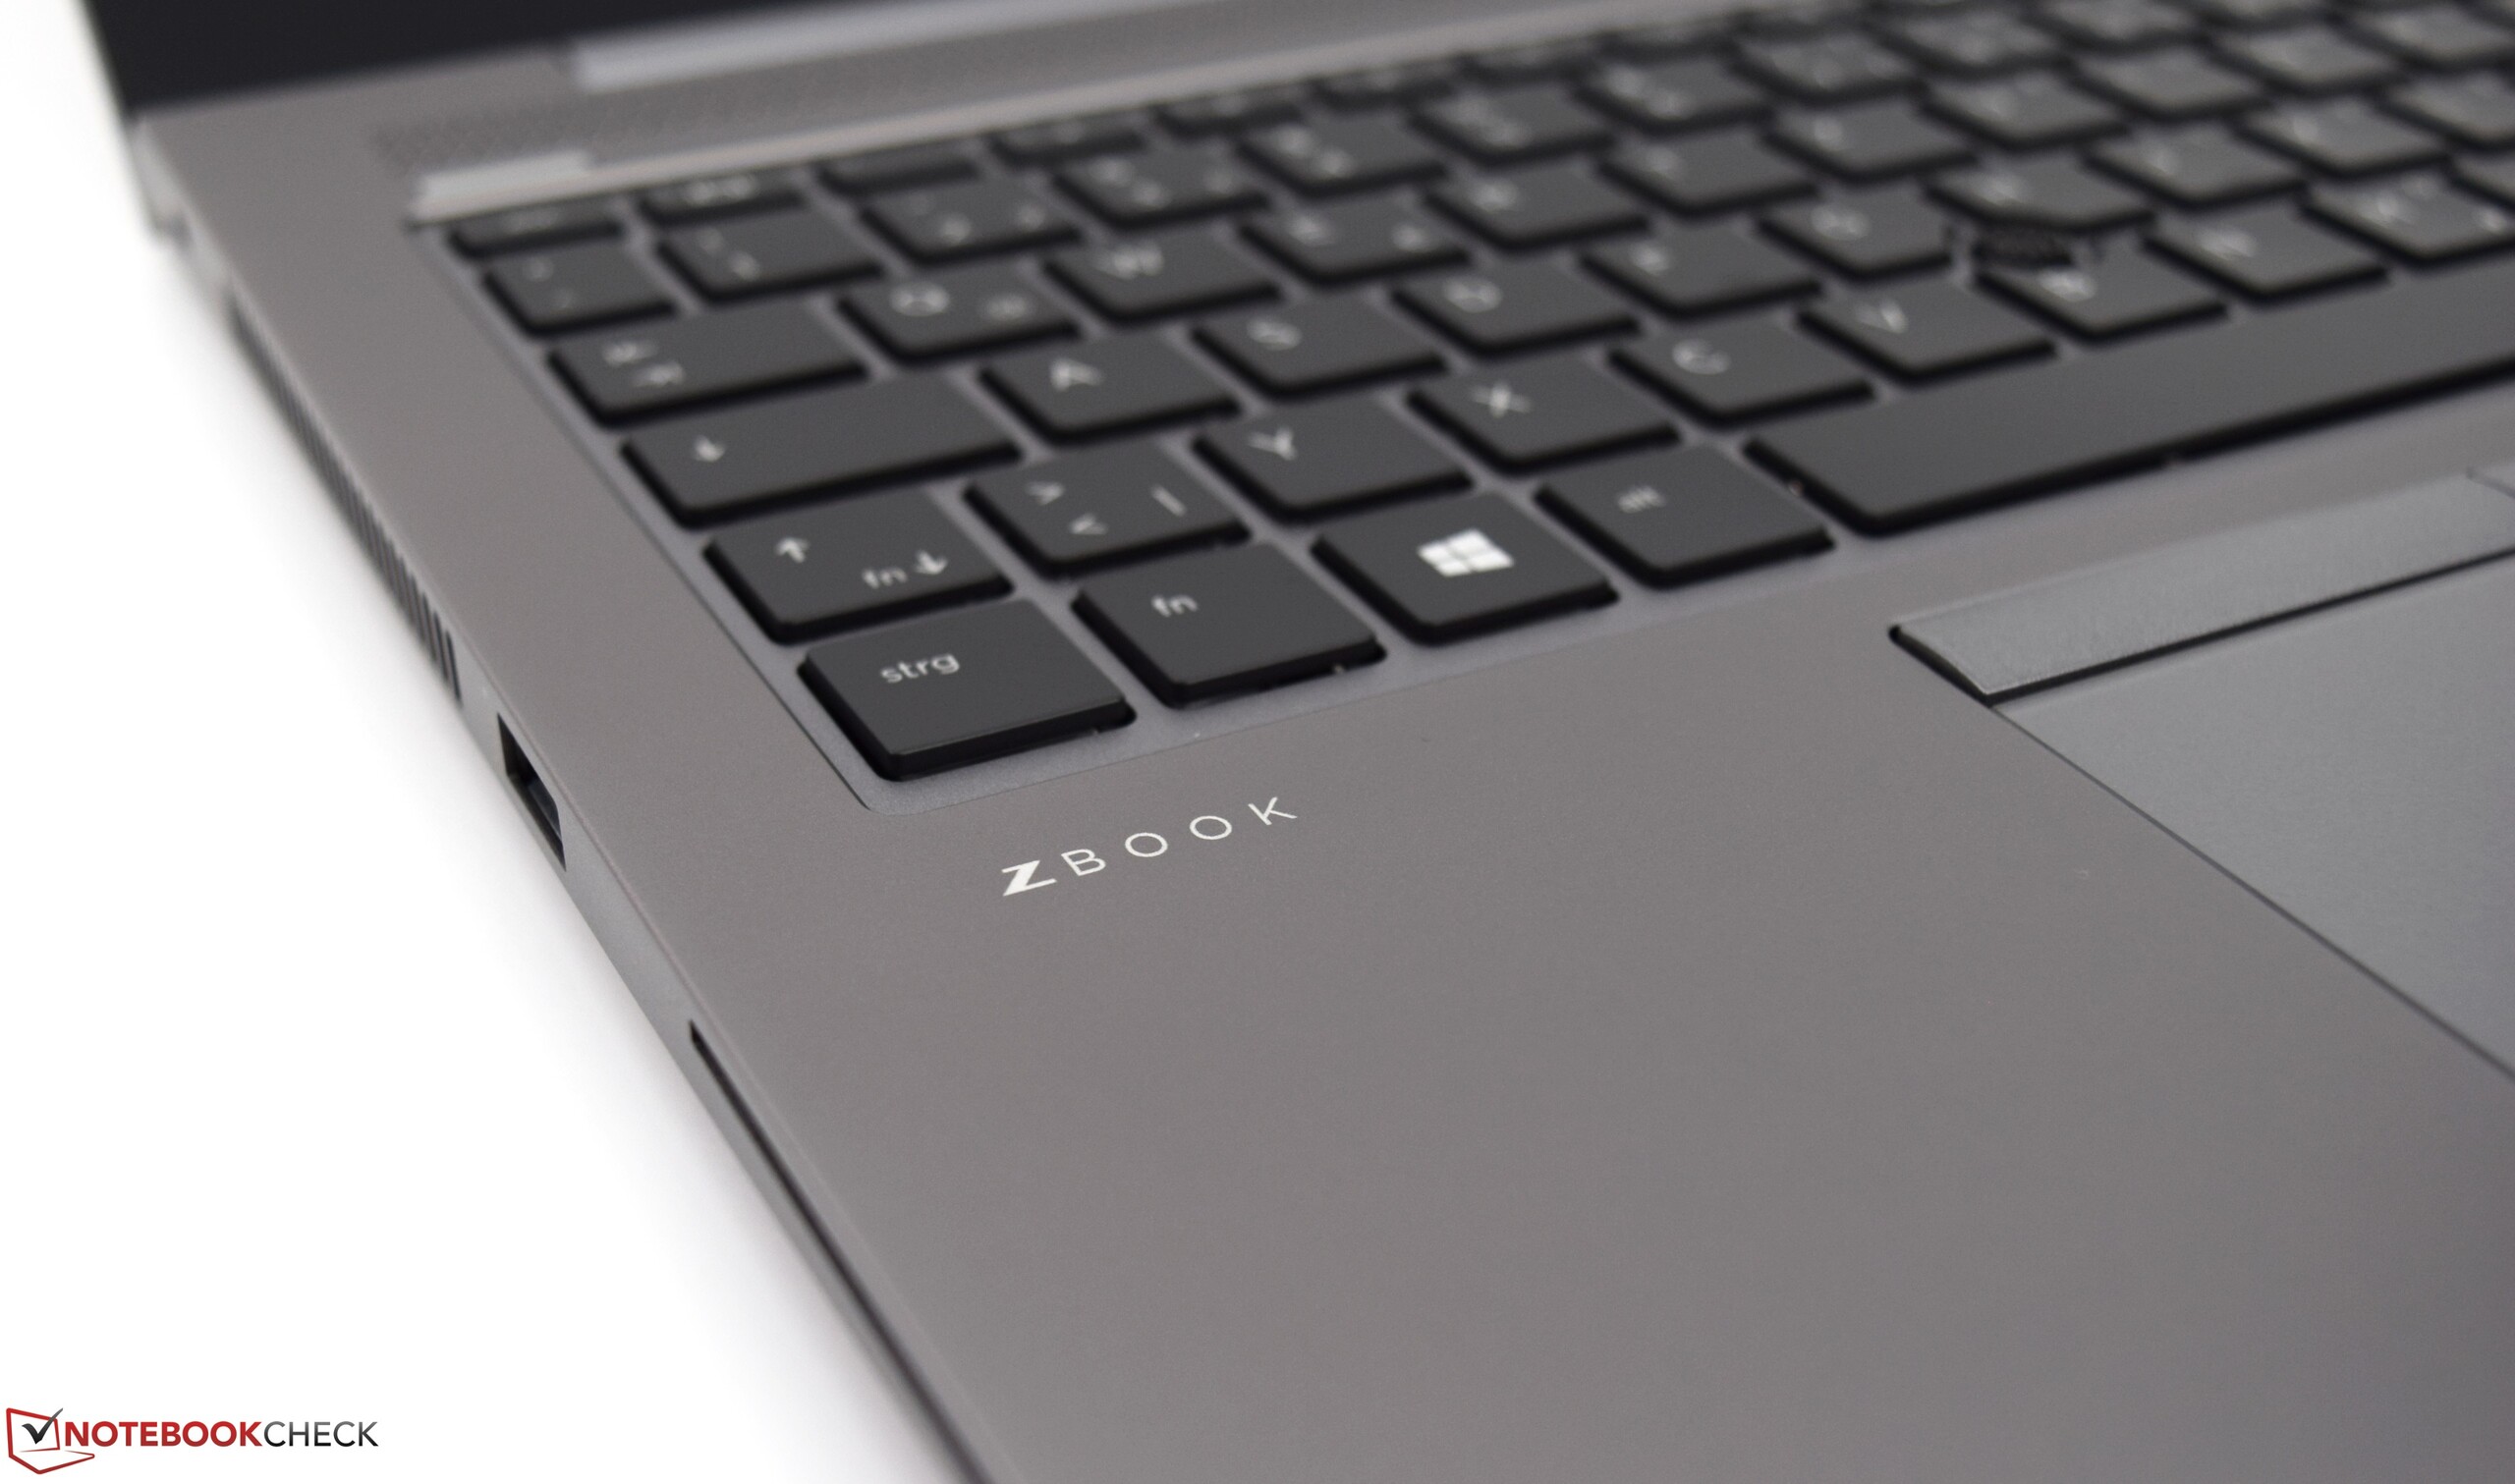
Com o ZBook 14u G6, a HP oferece um workstation móvel de alta qualidade.
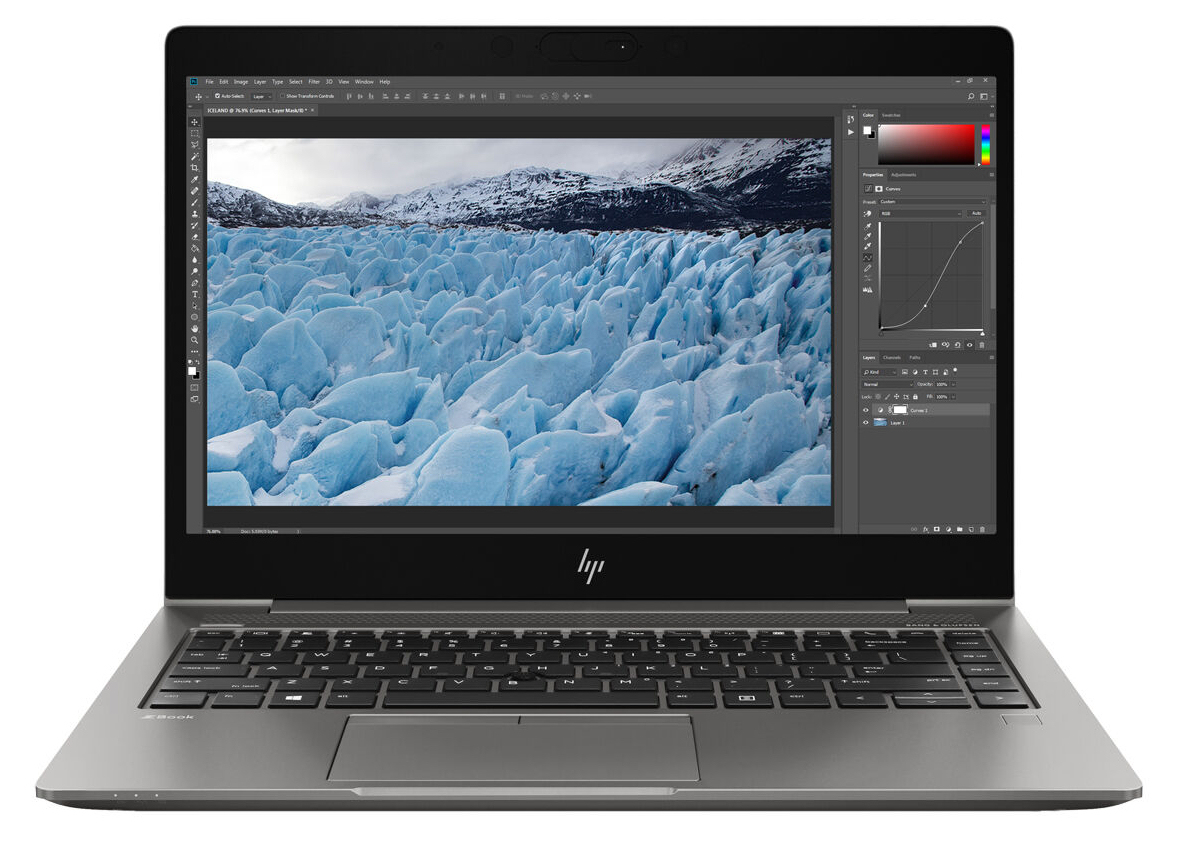
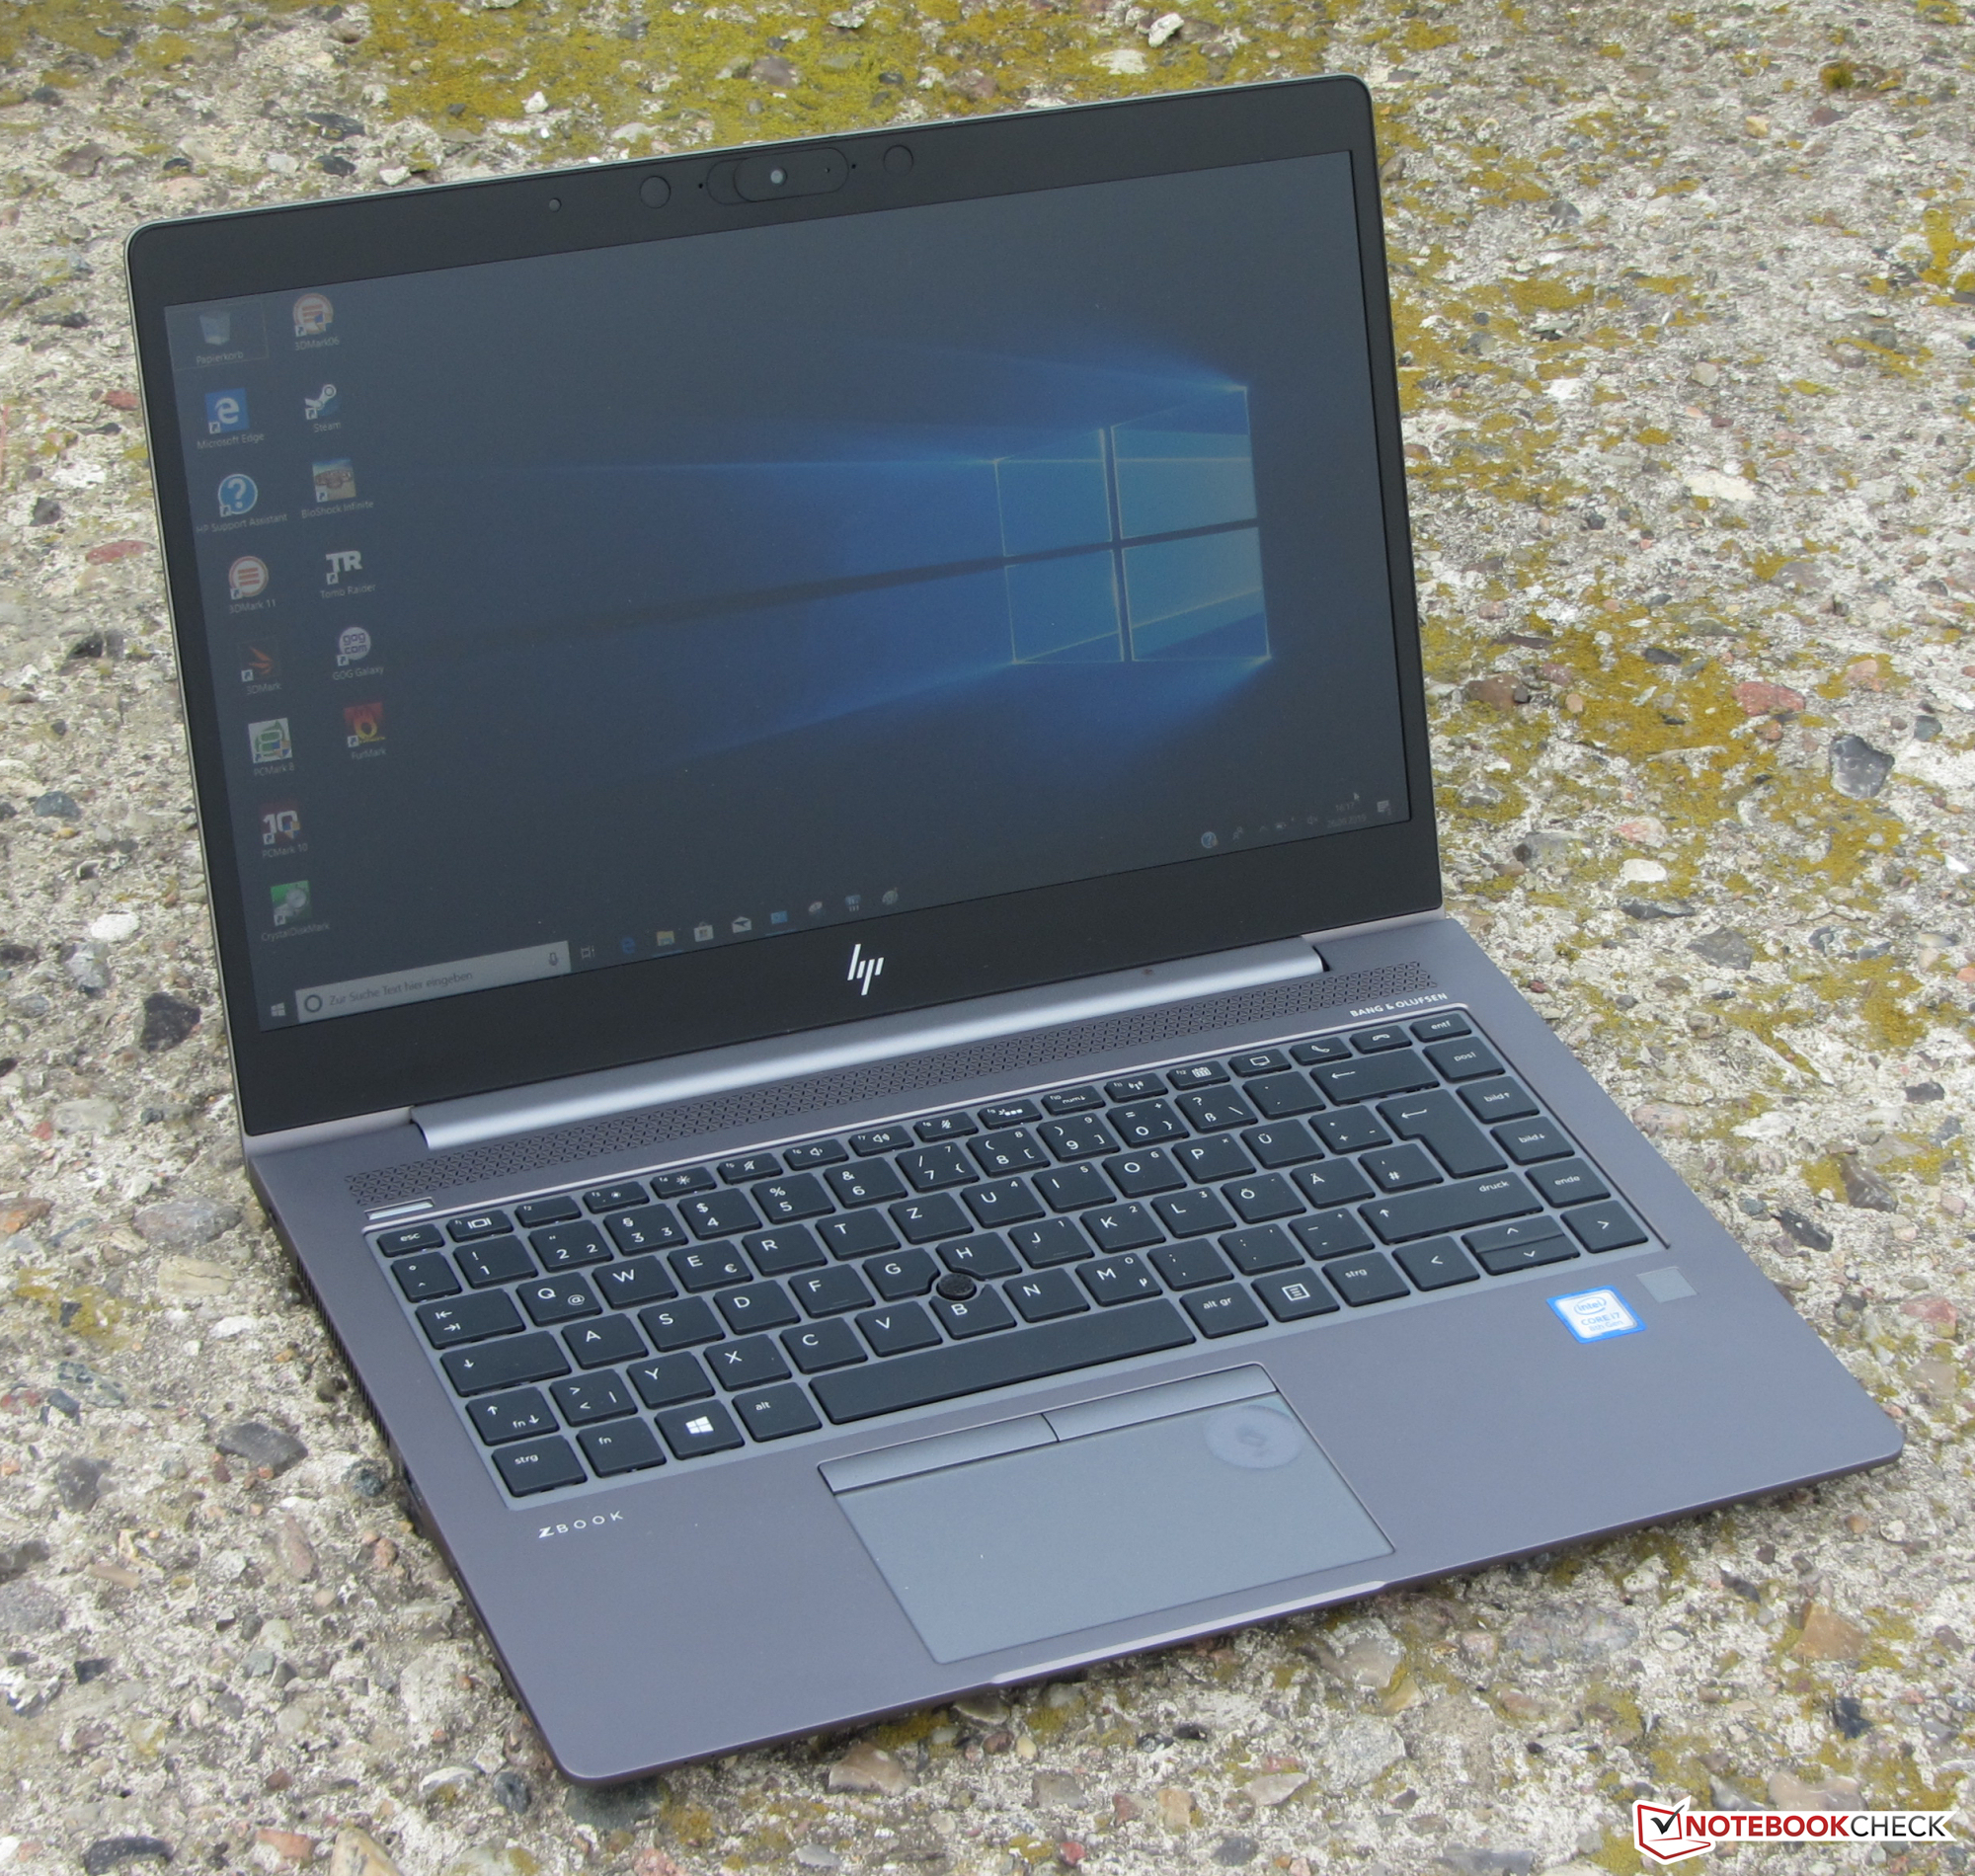
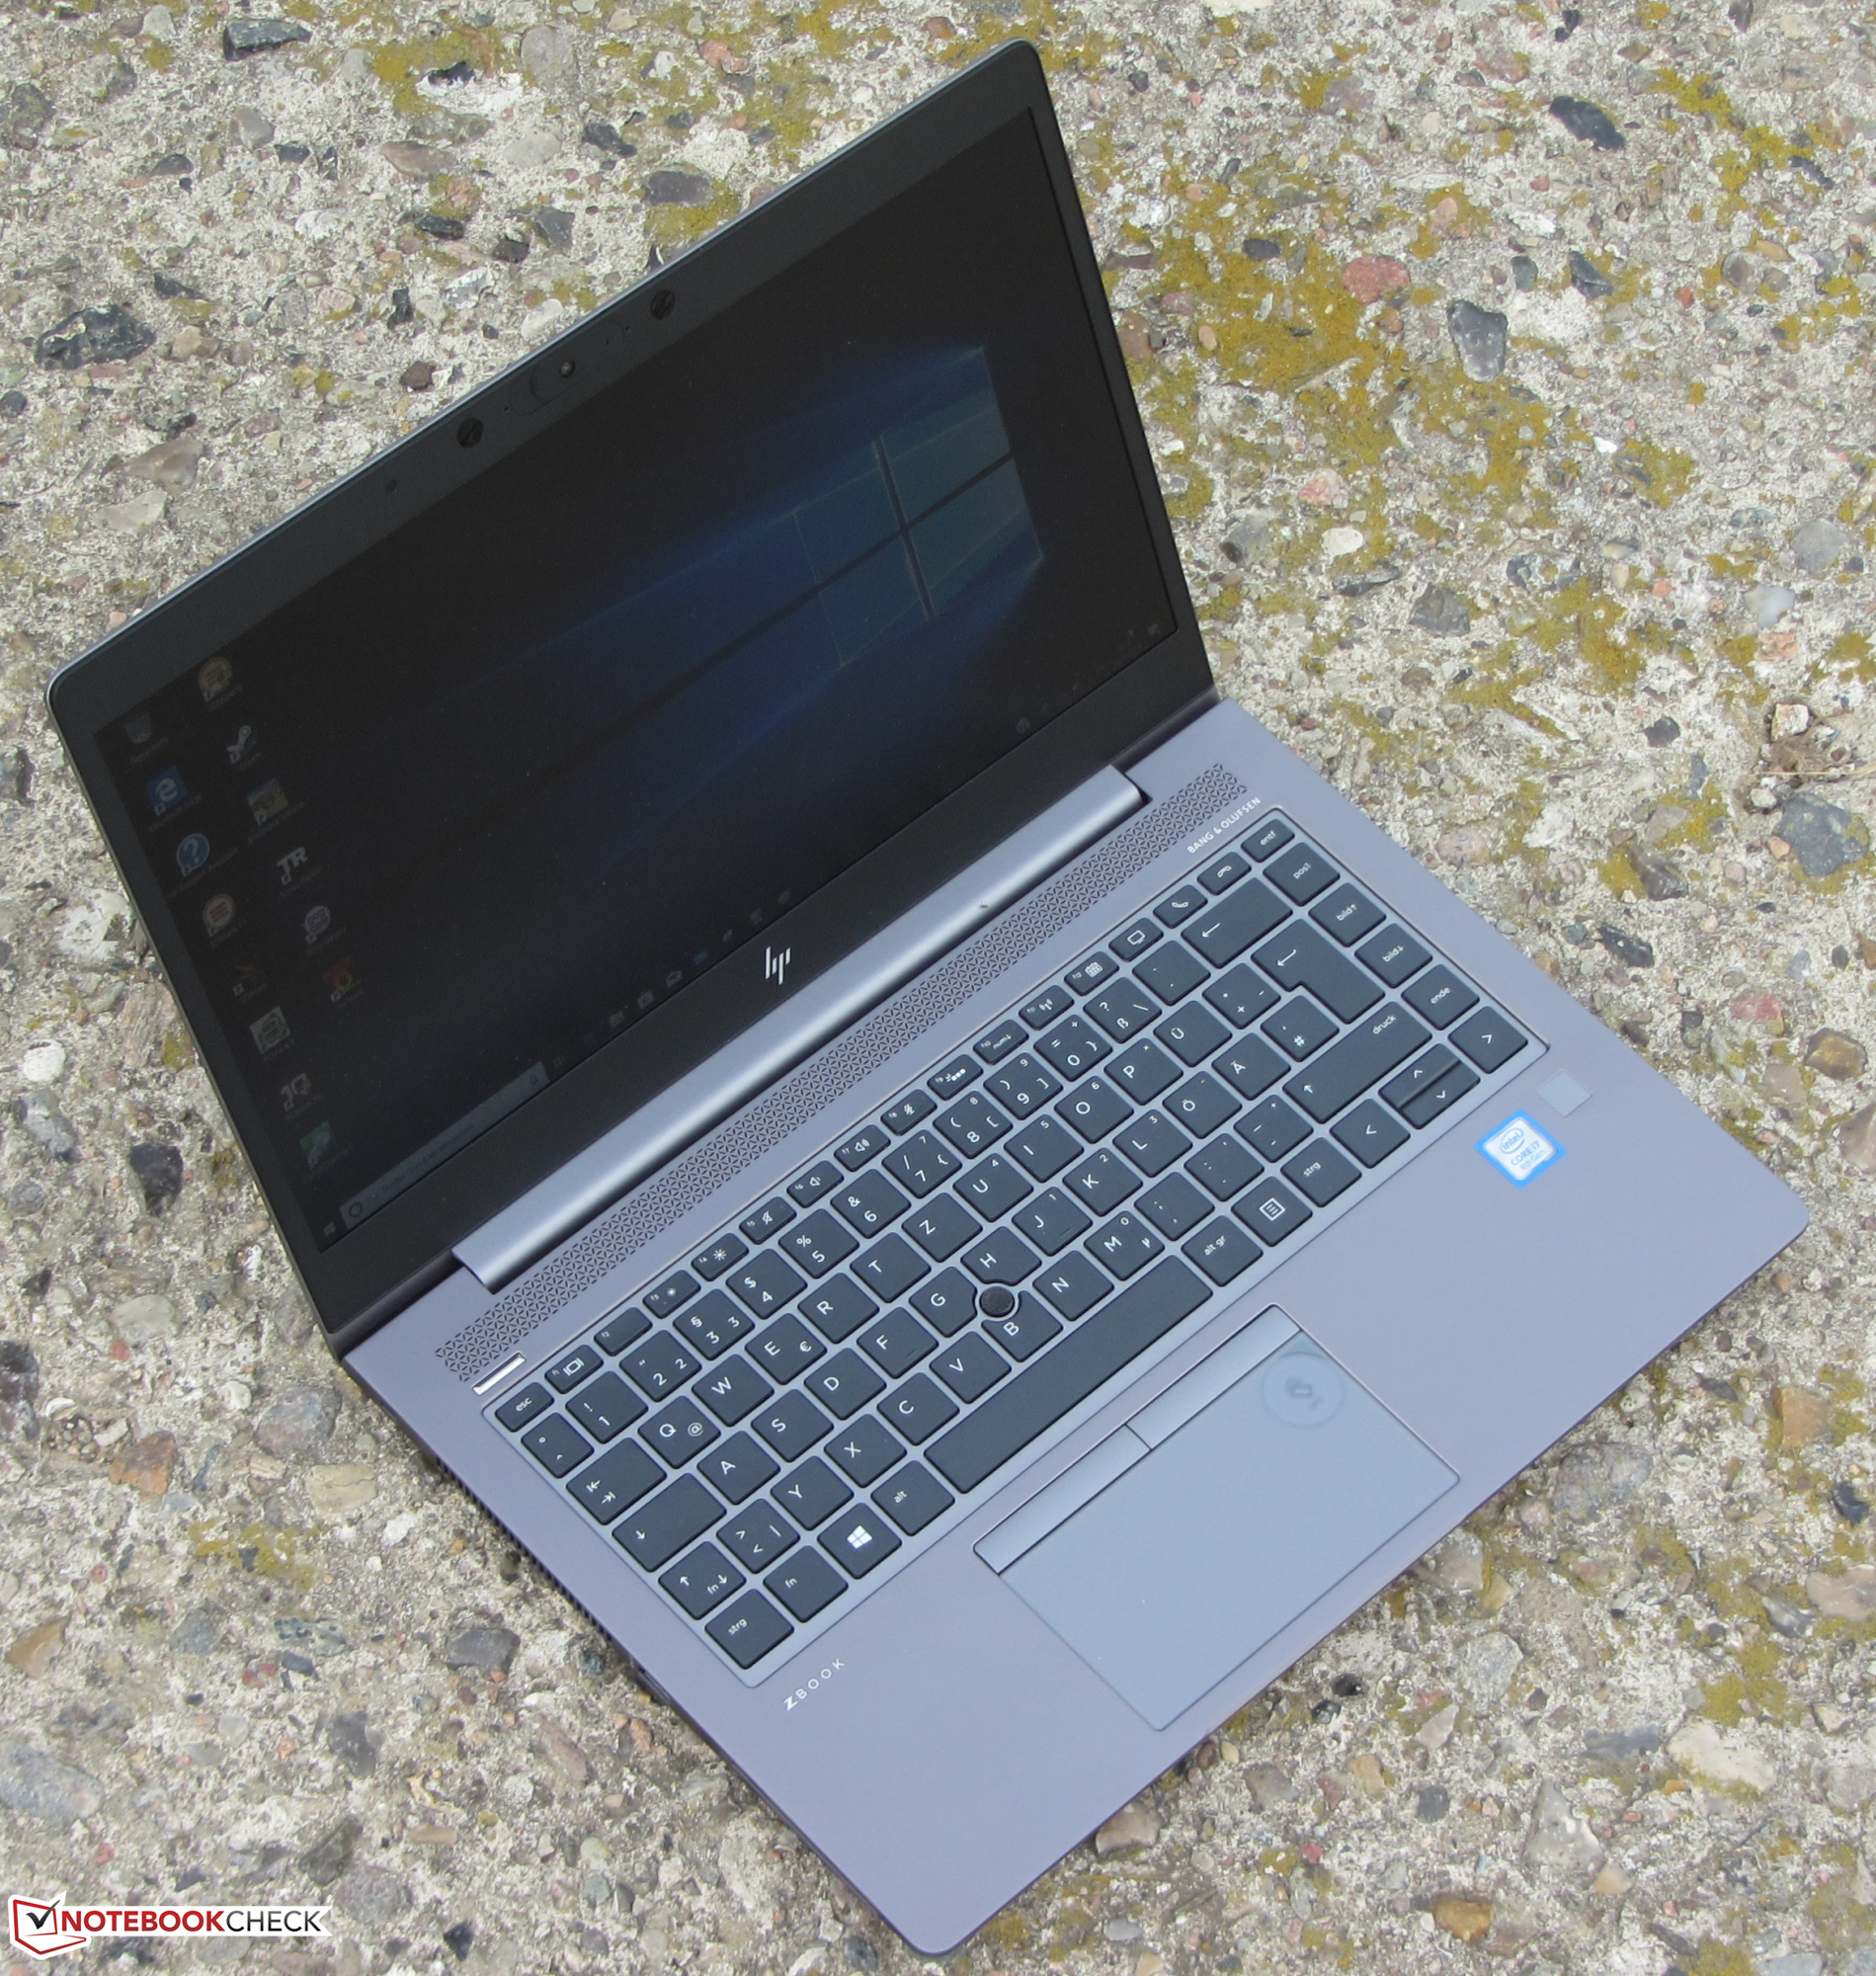
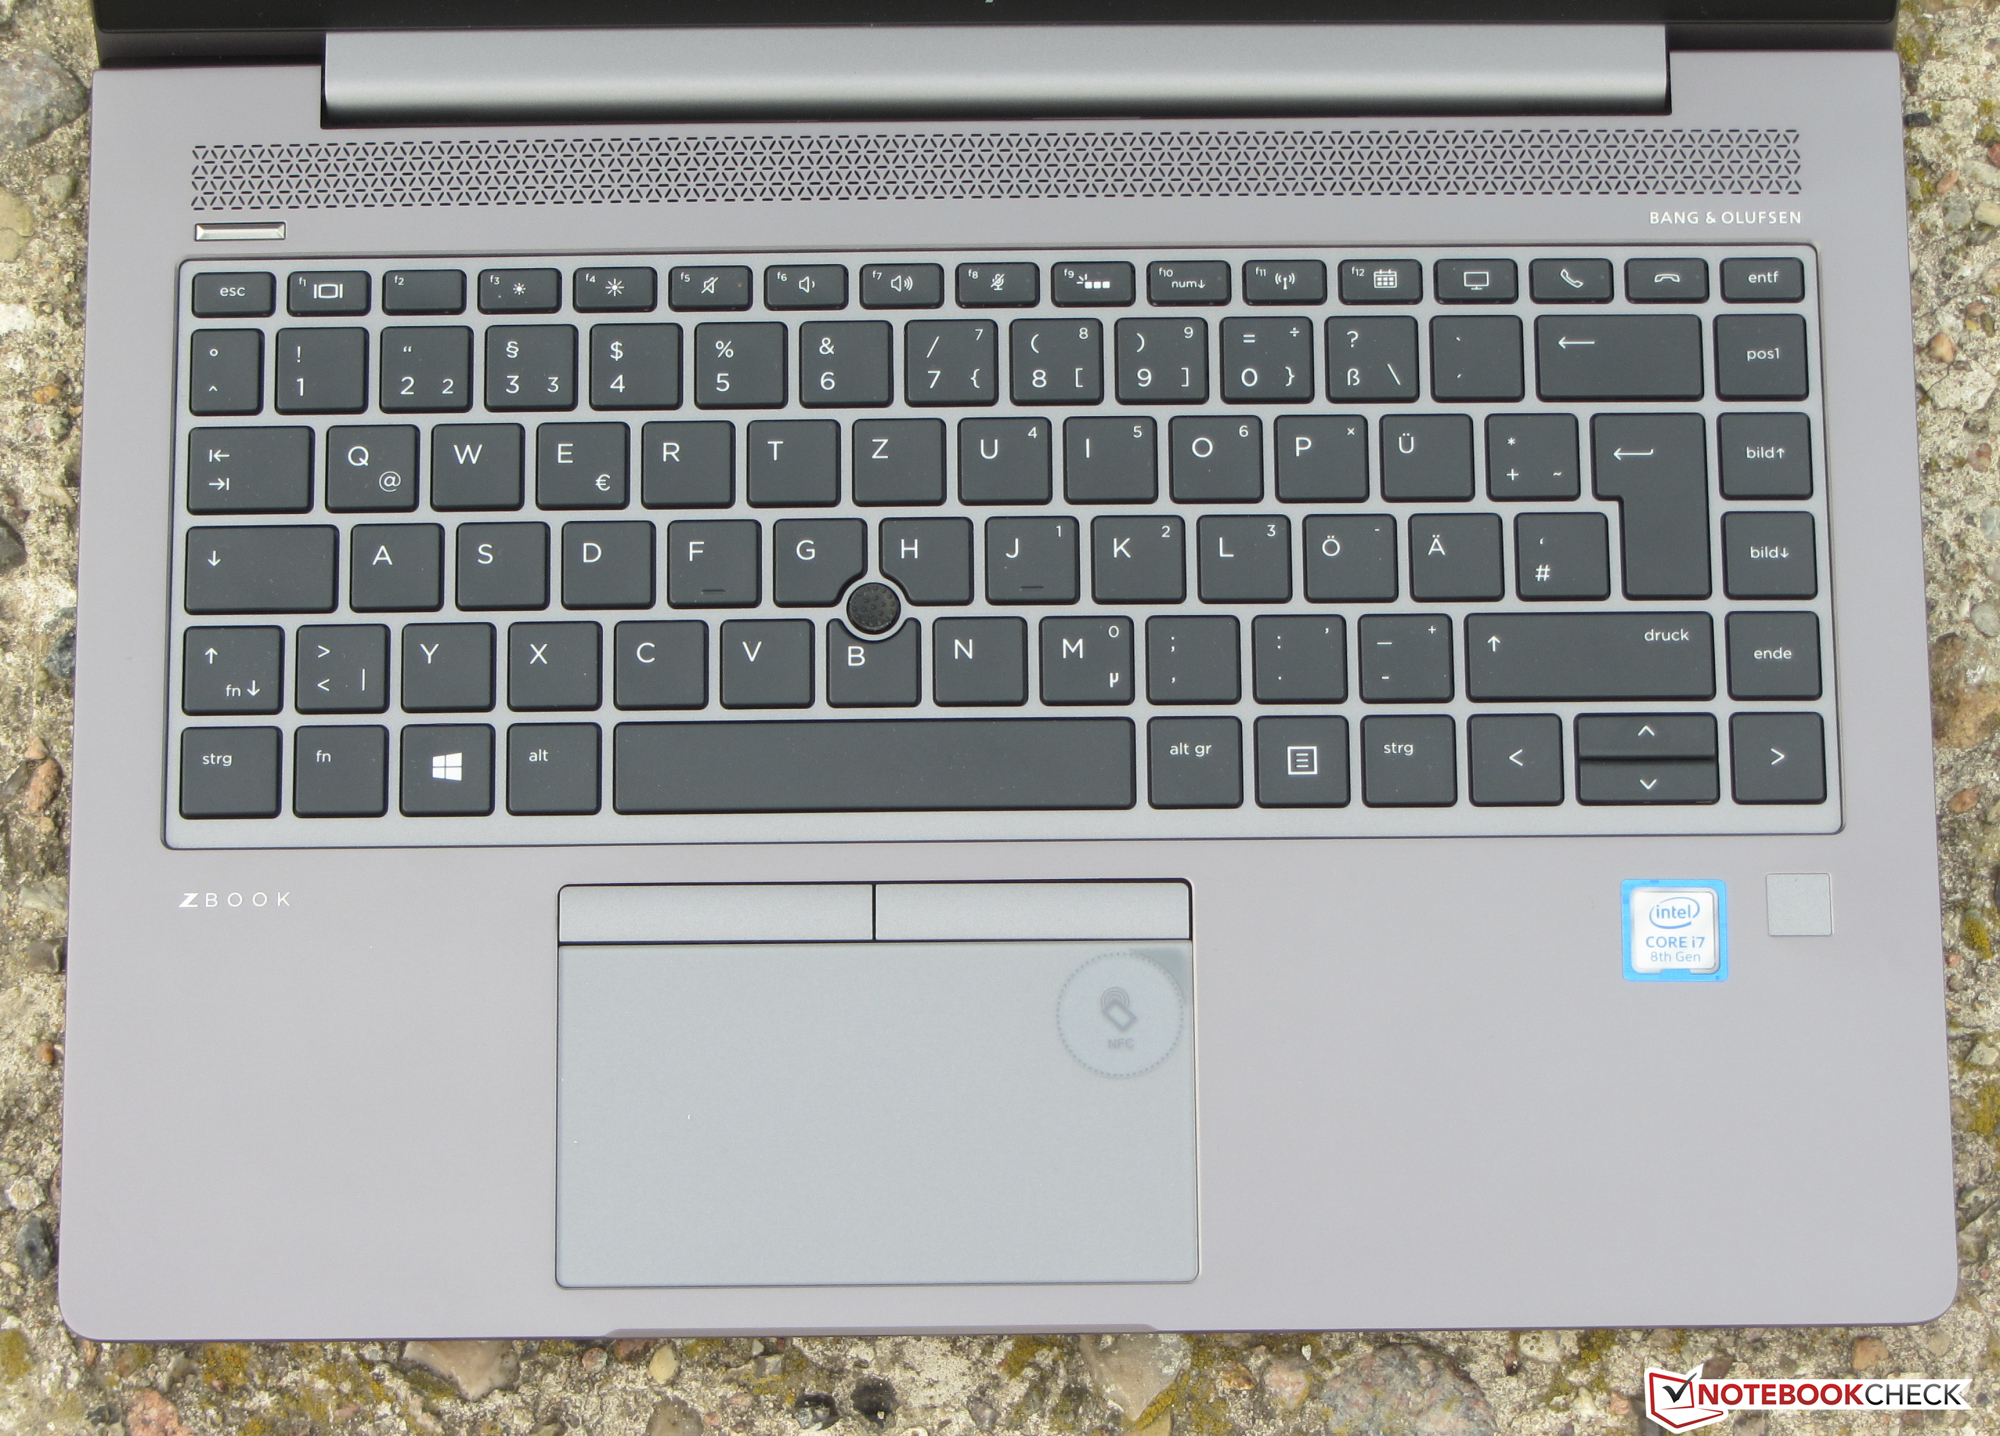
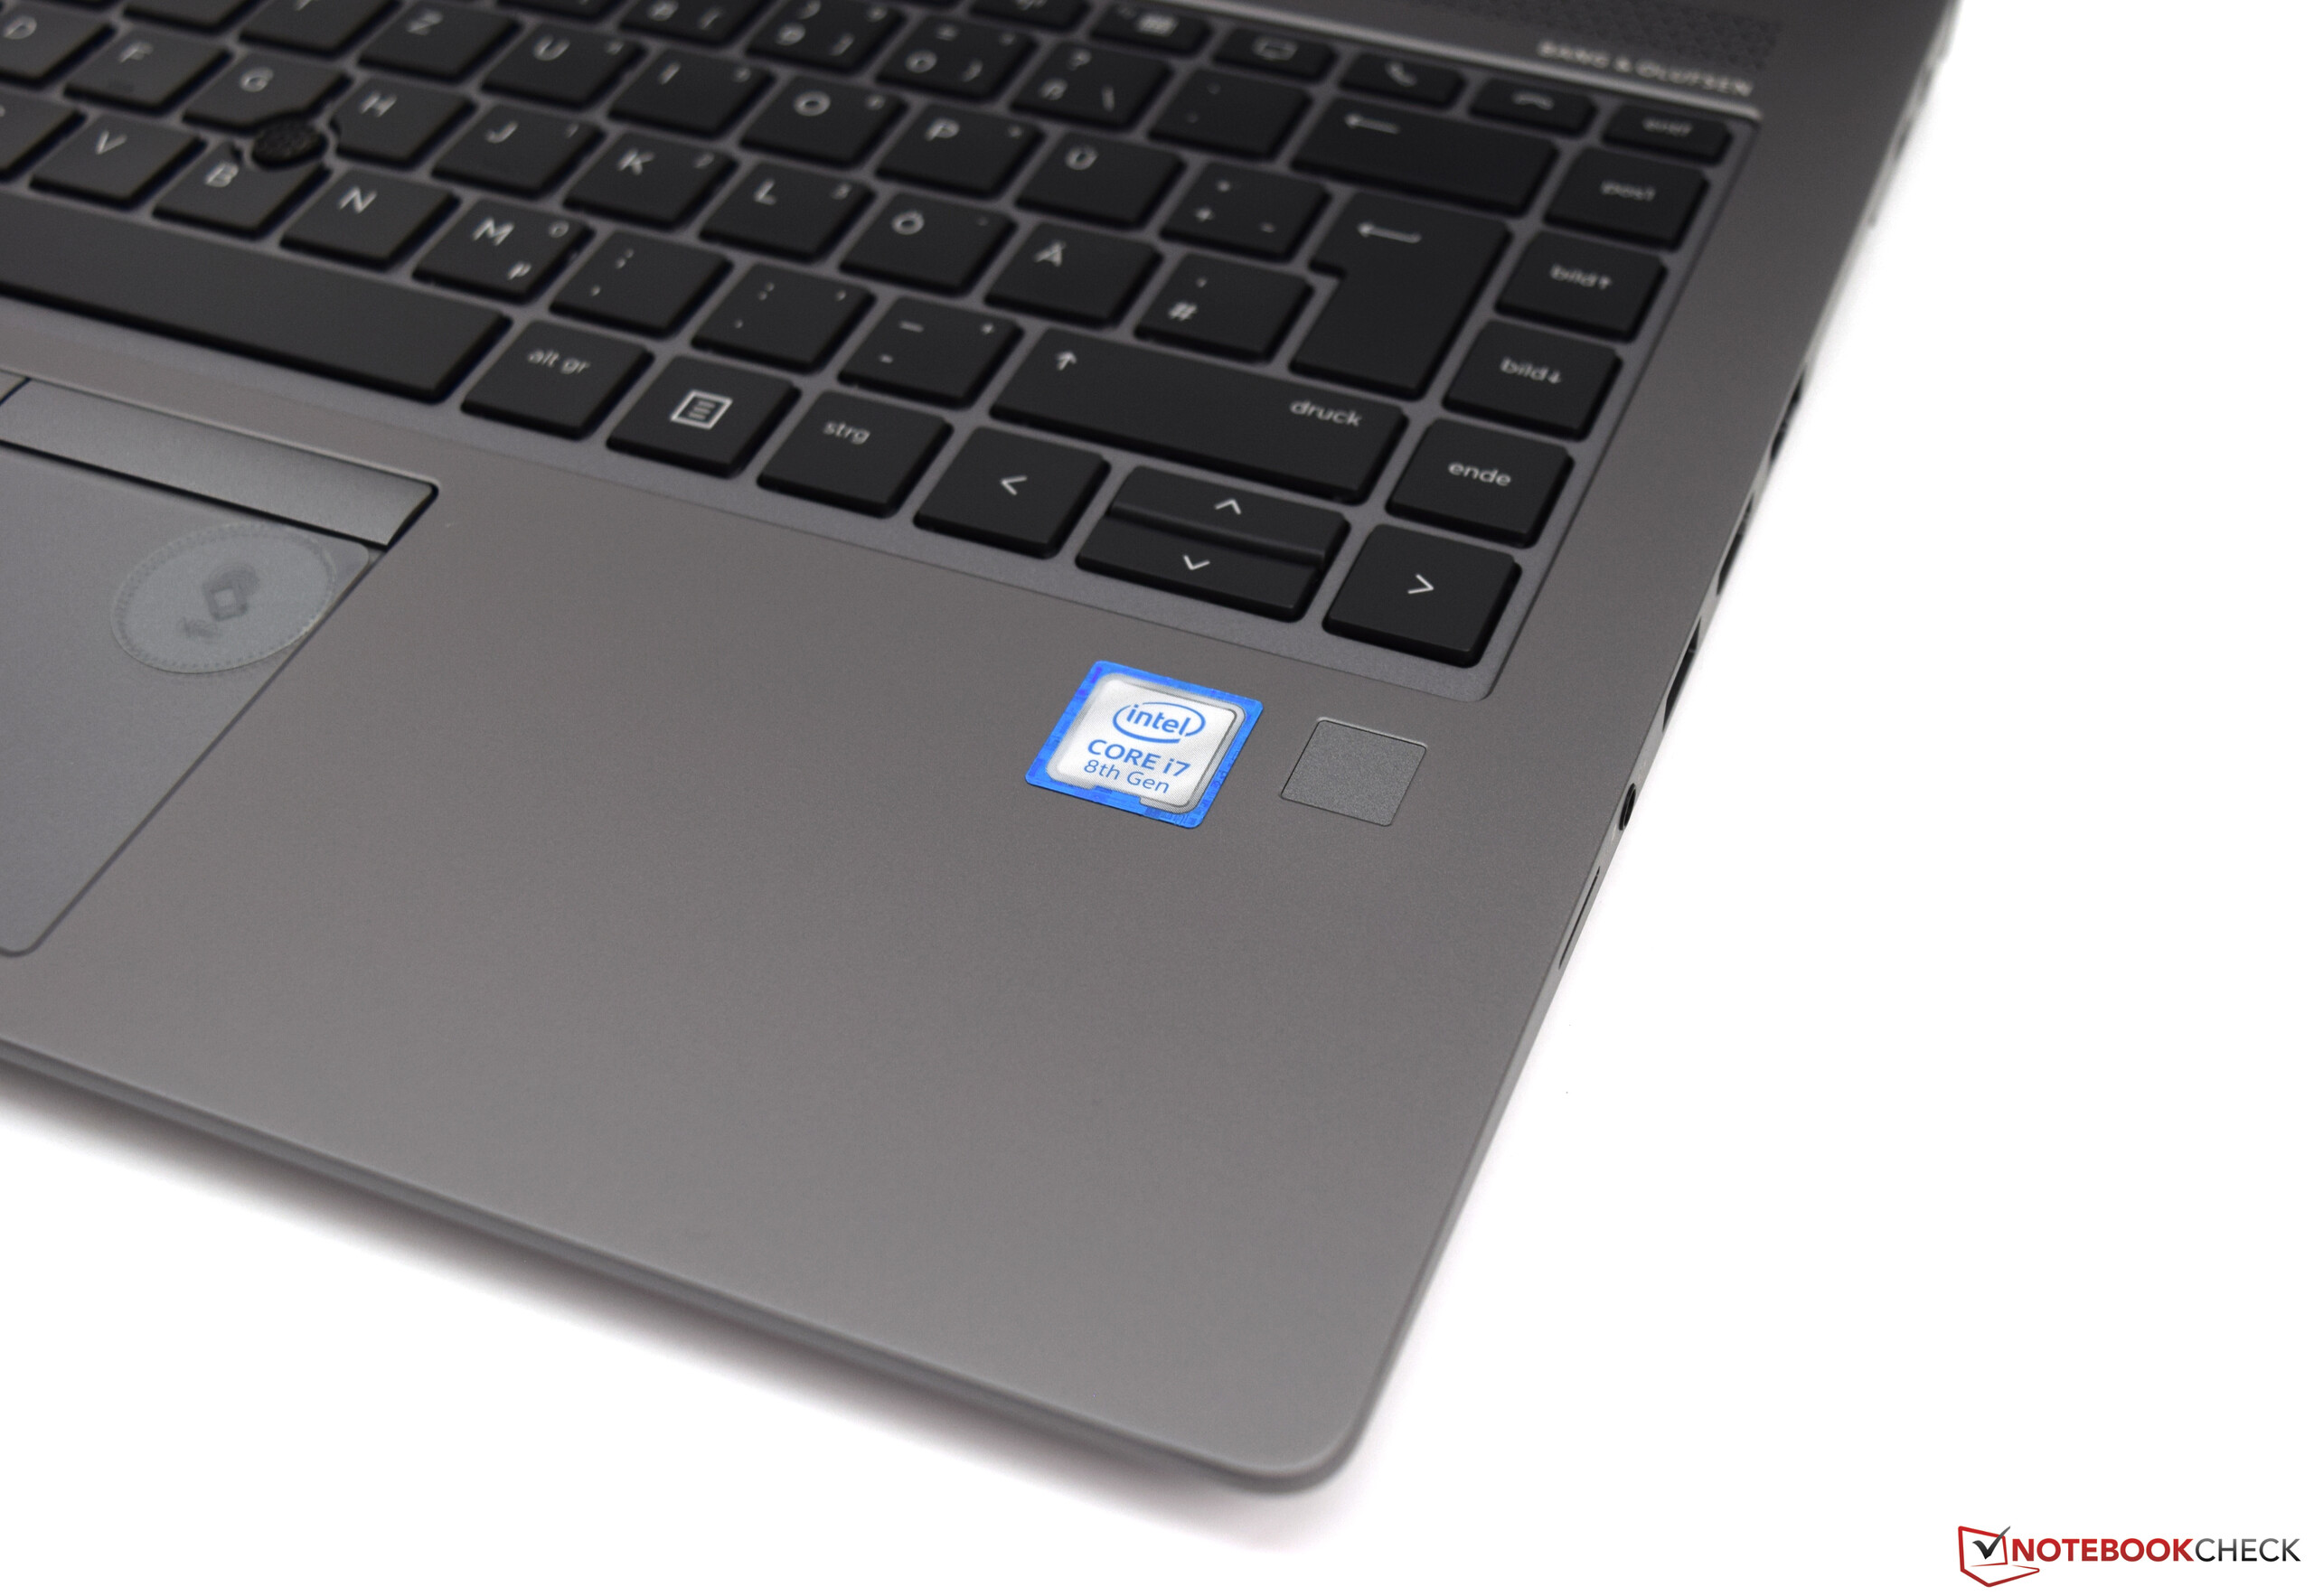
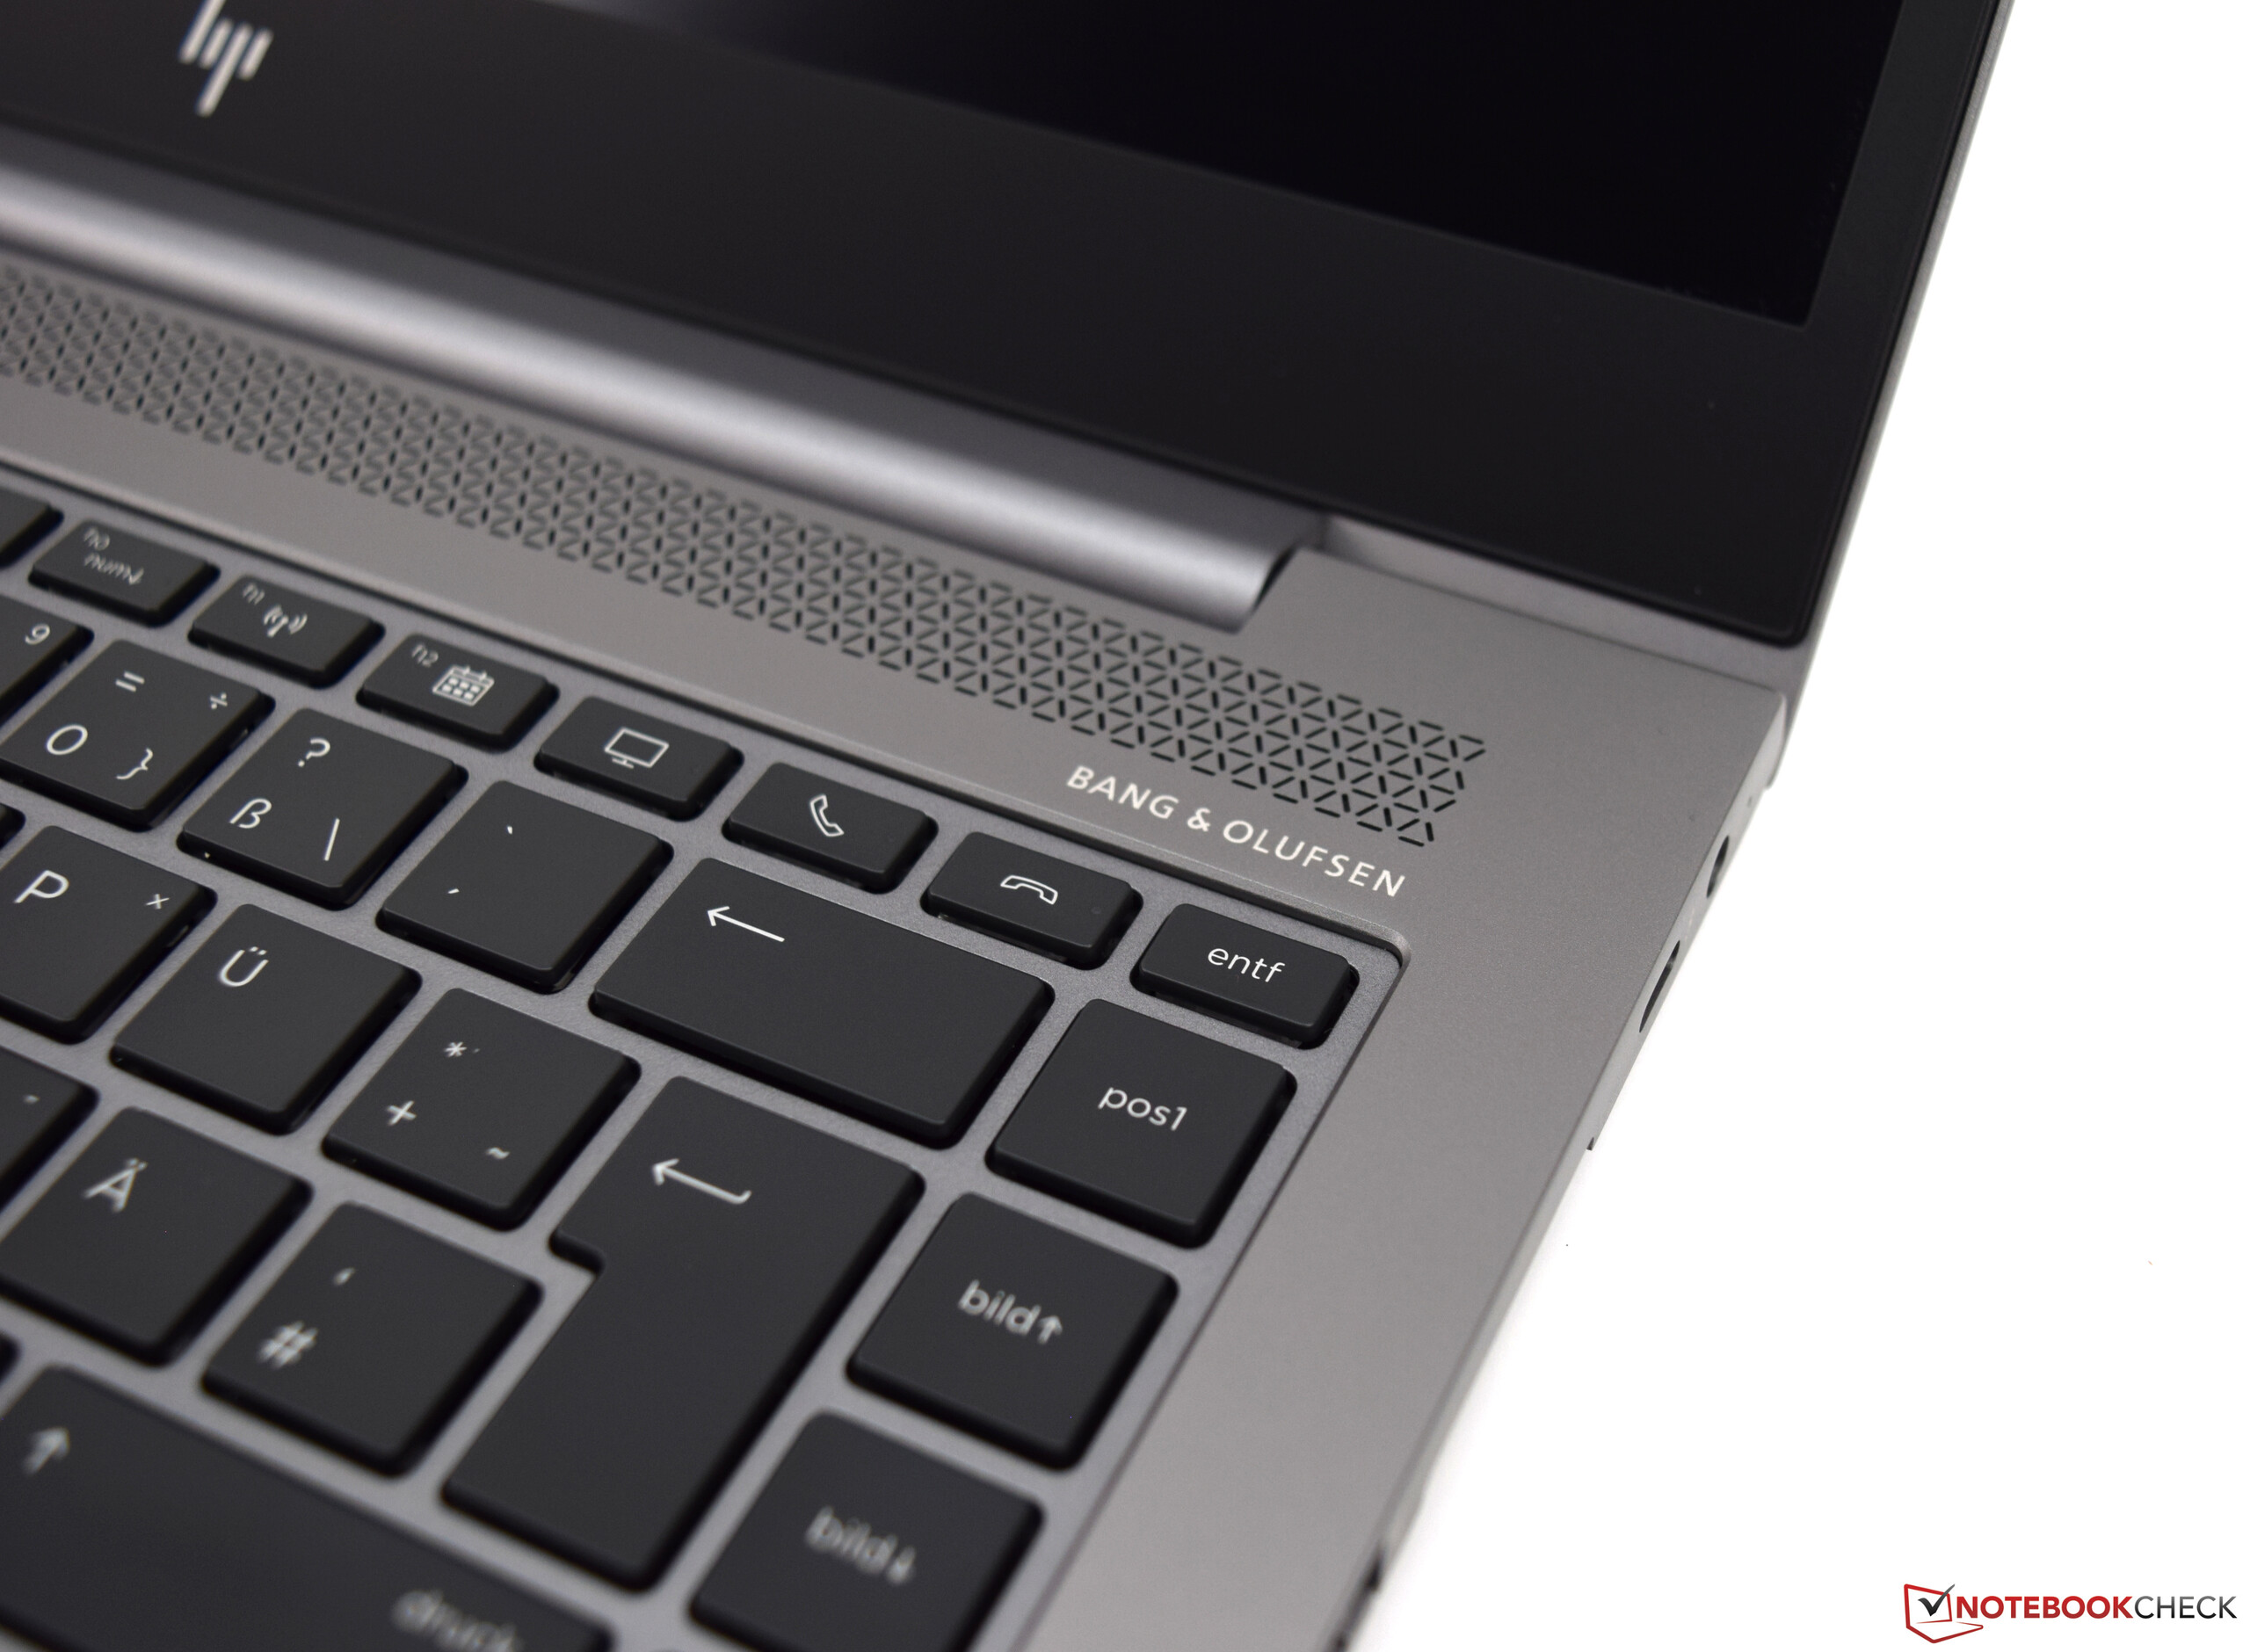
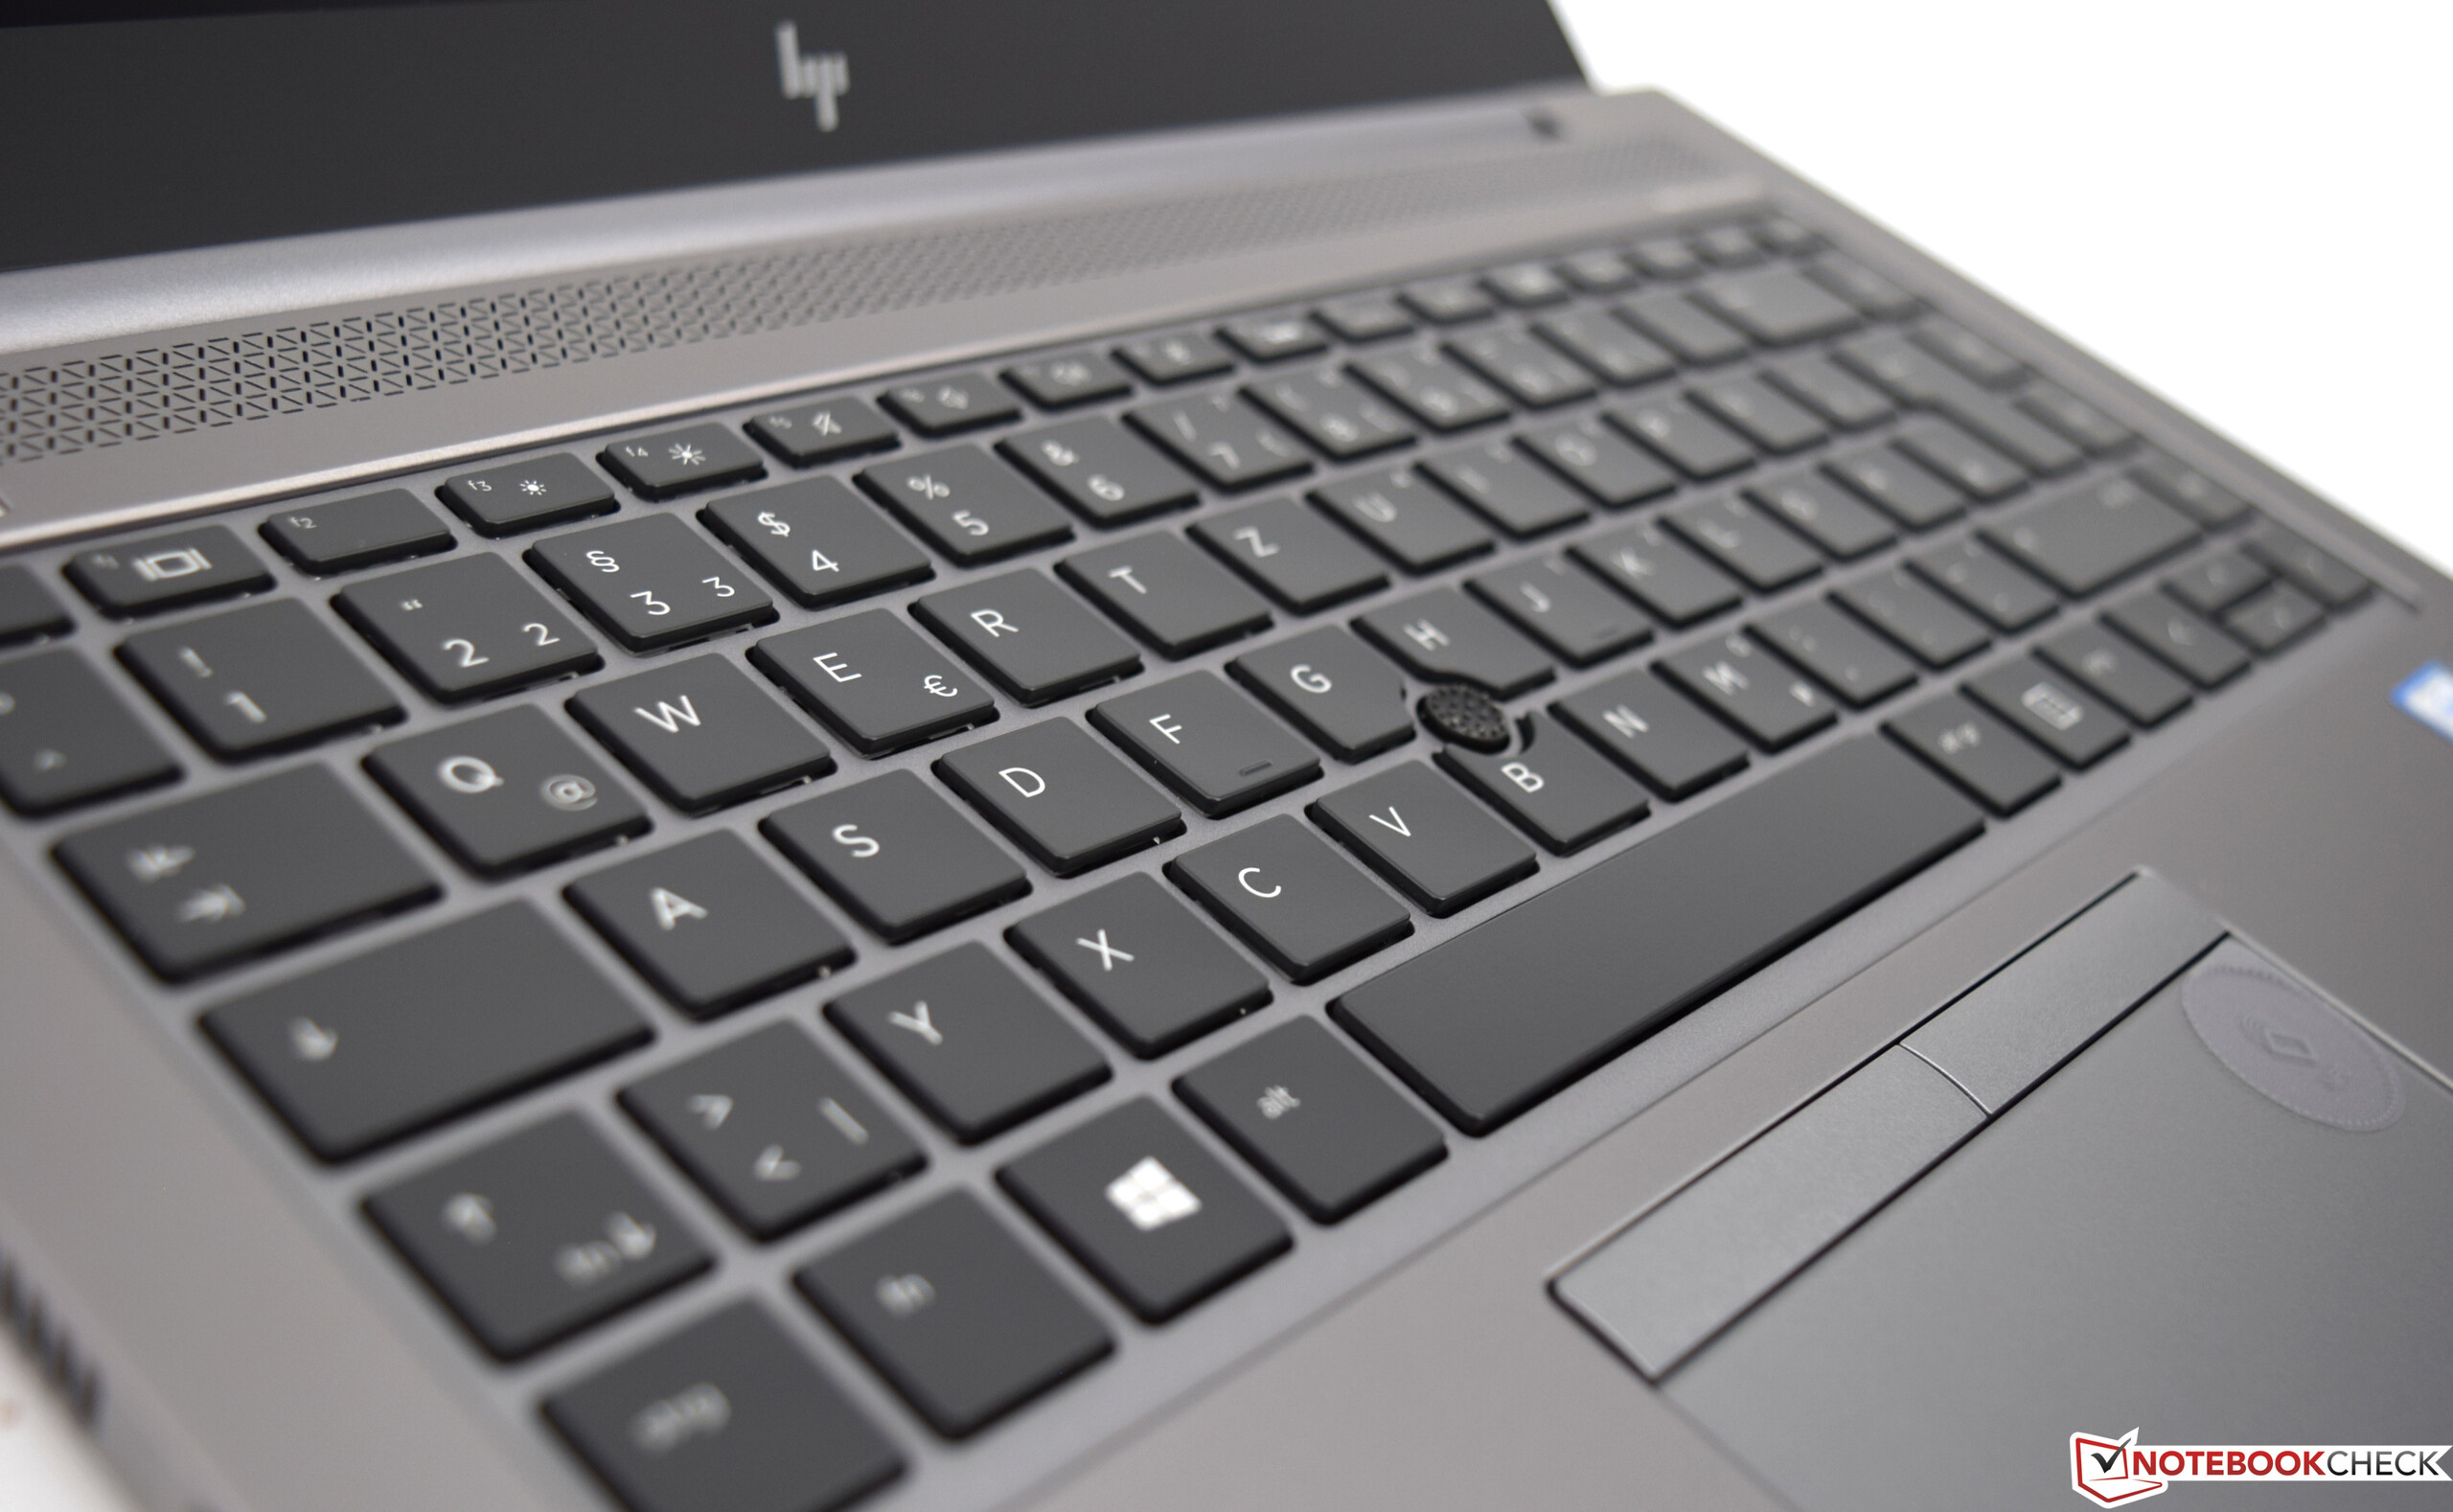
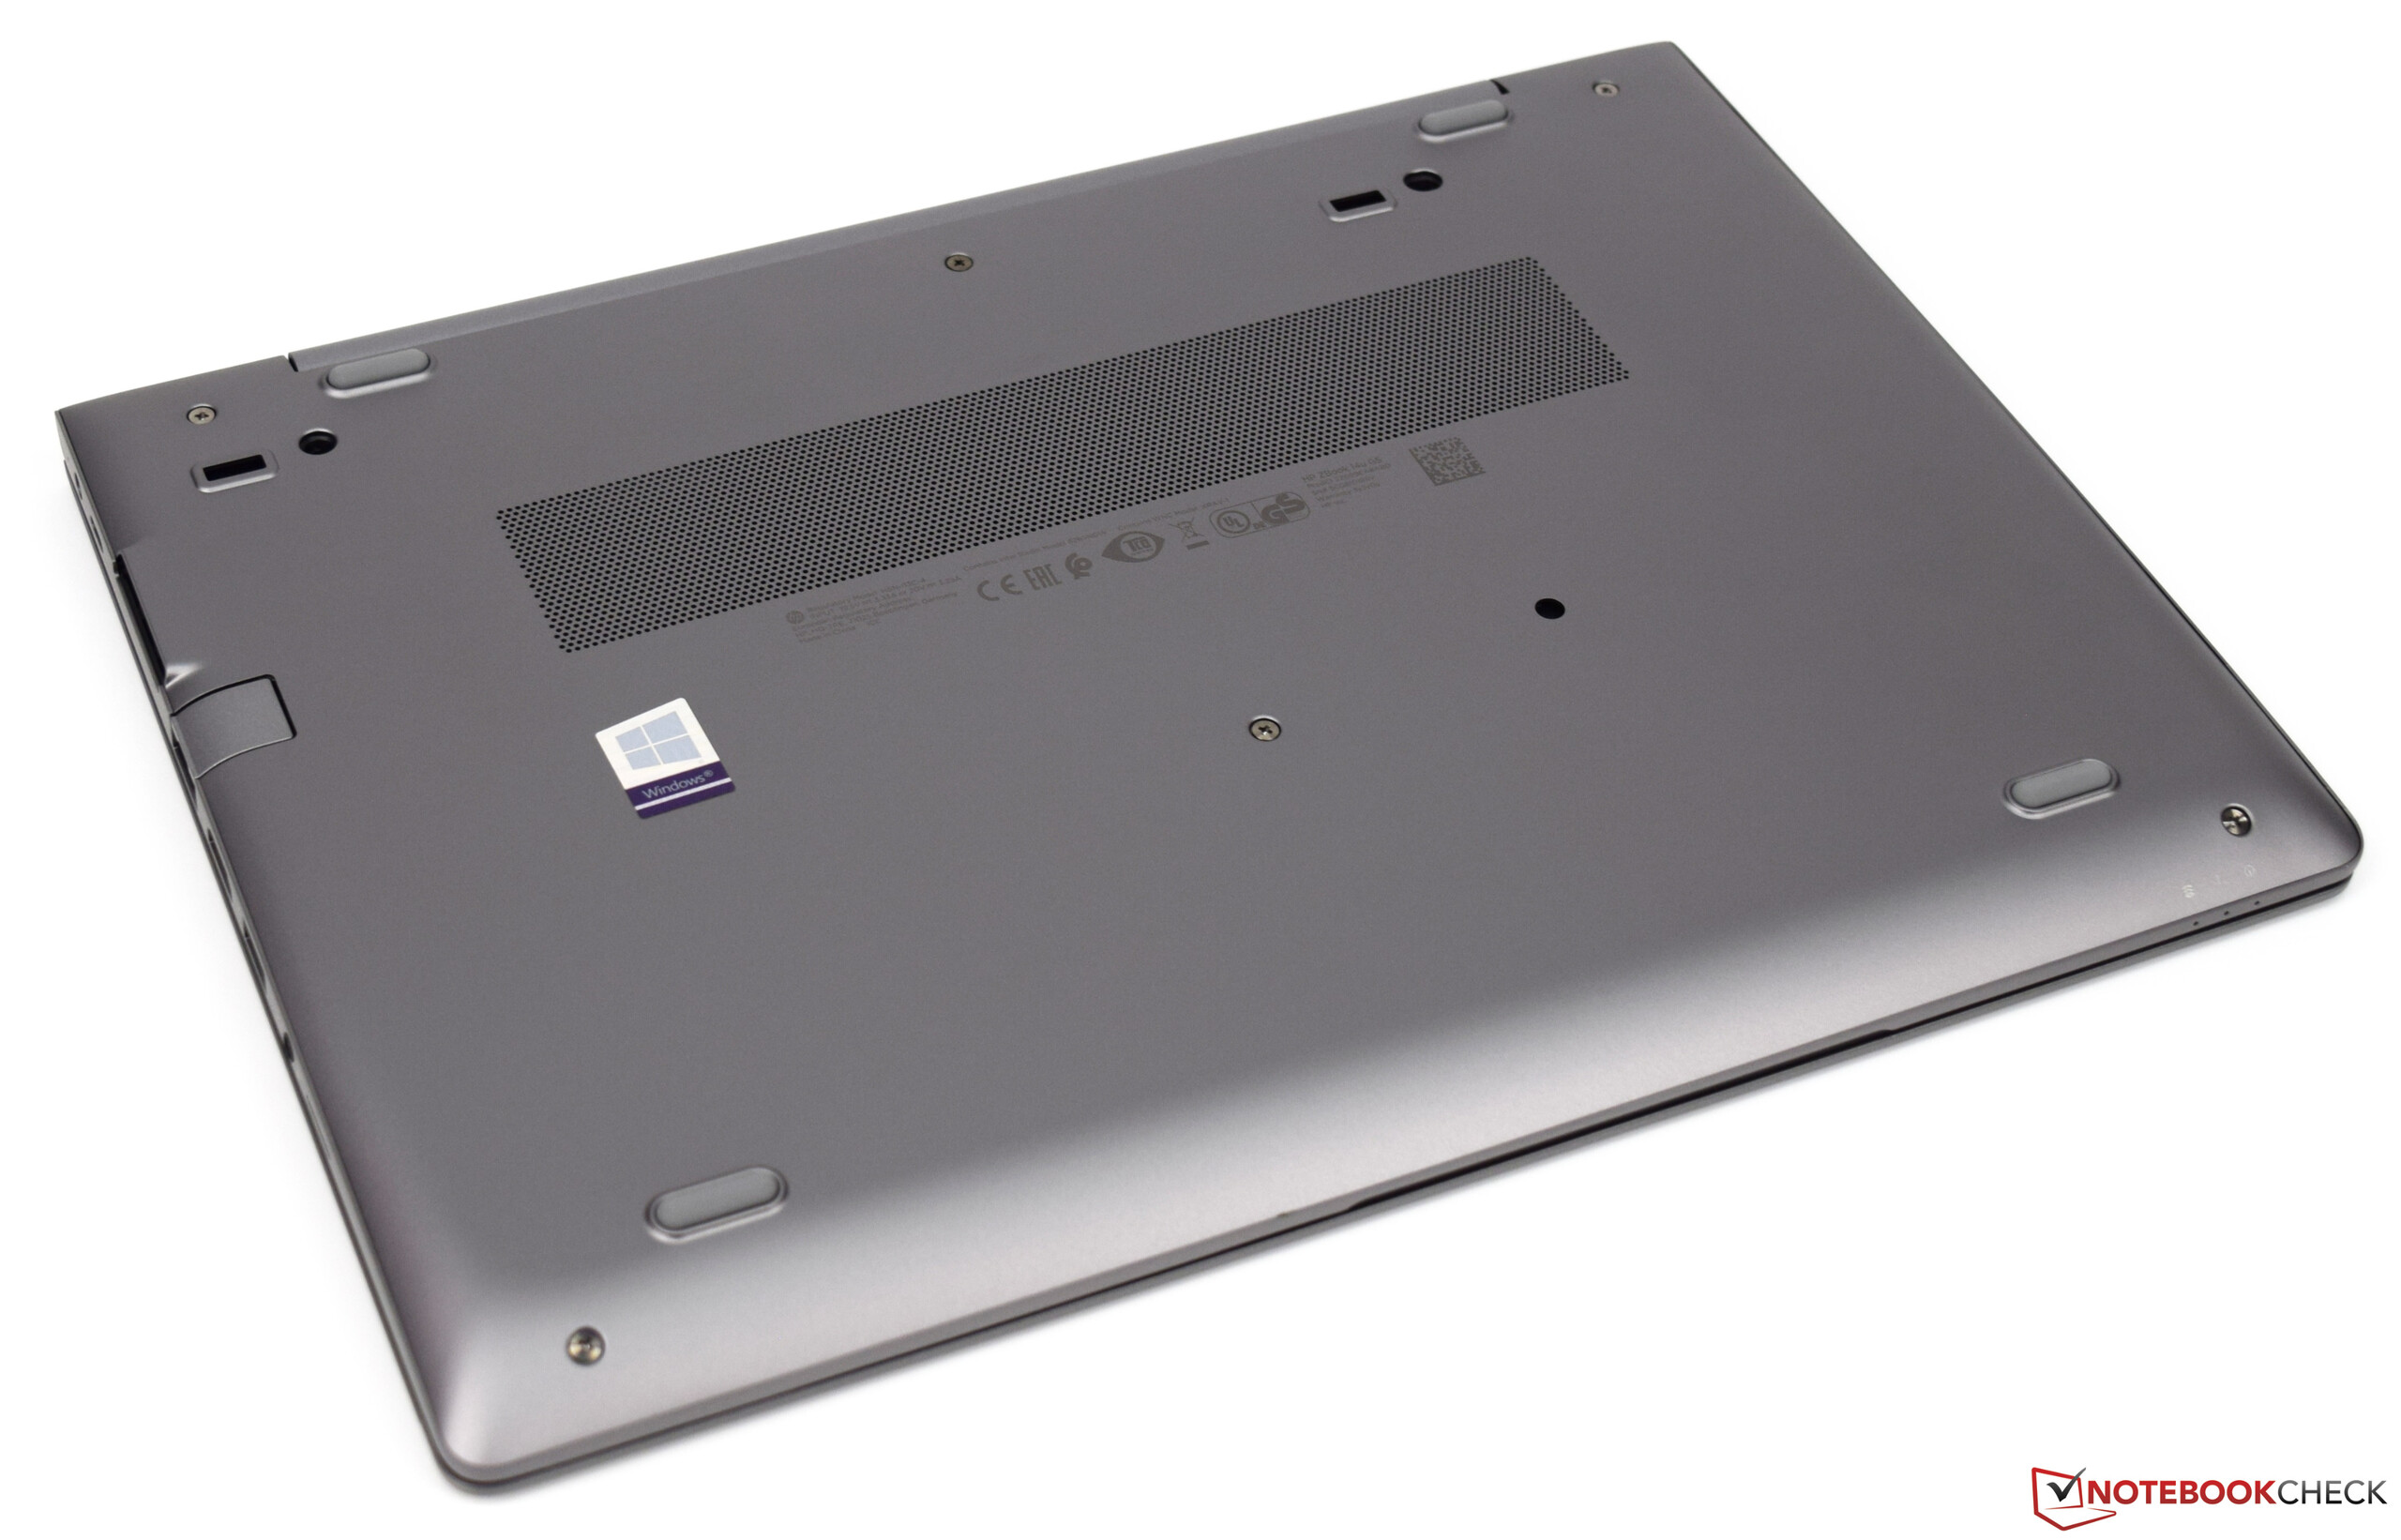
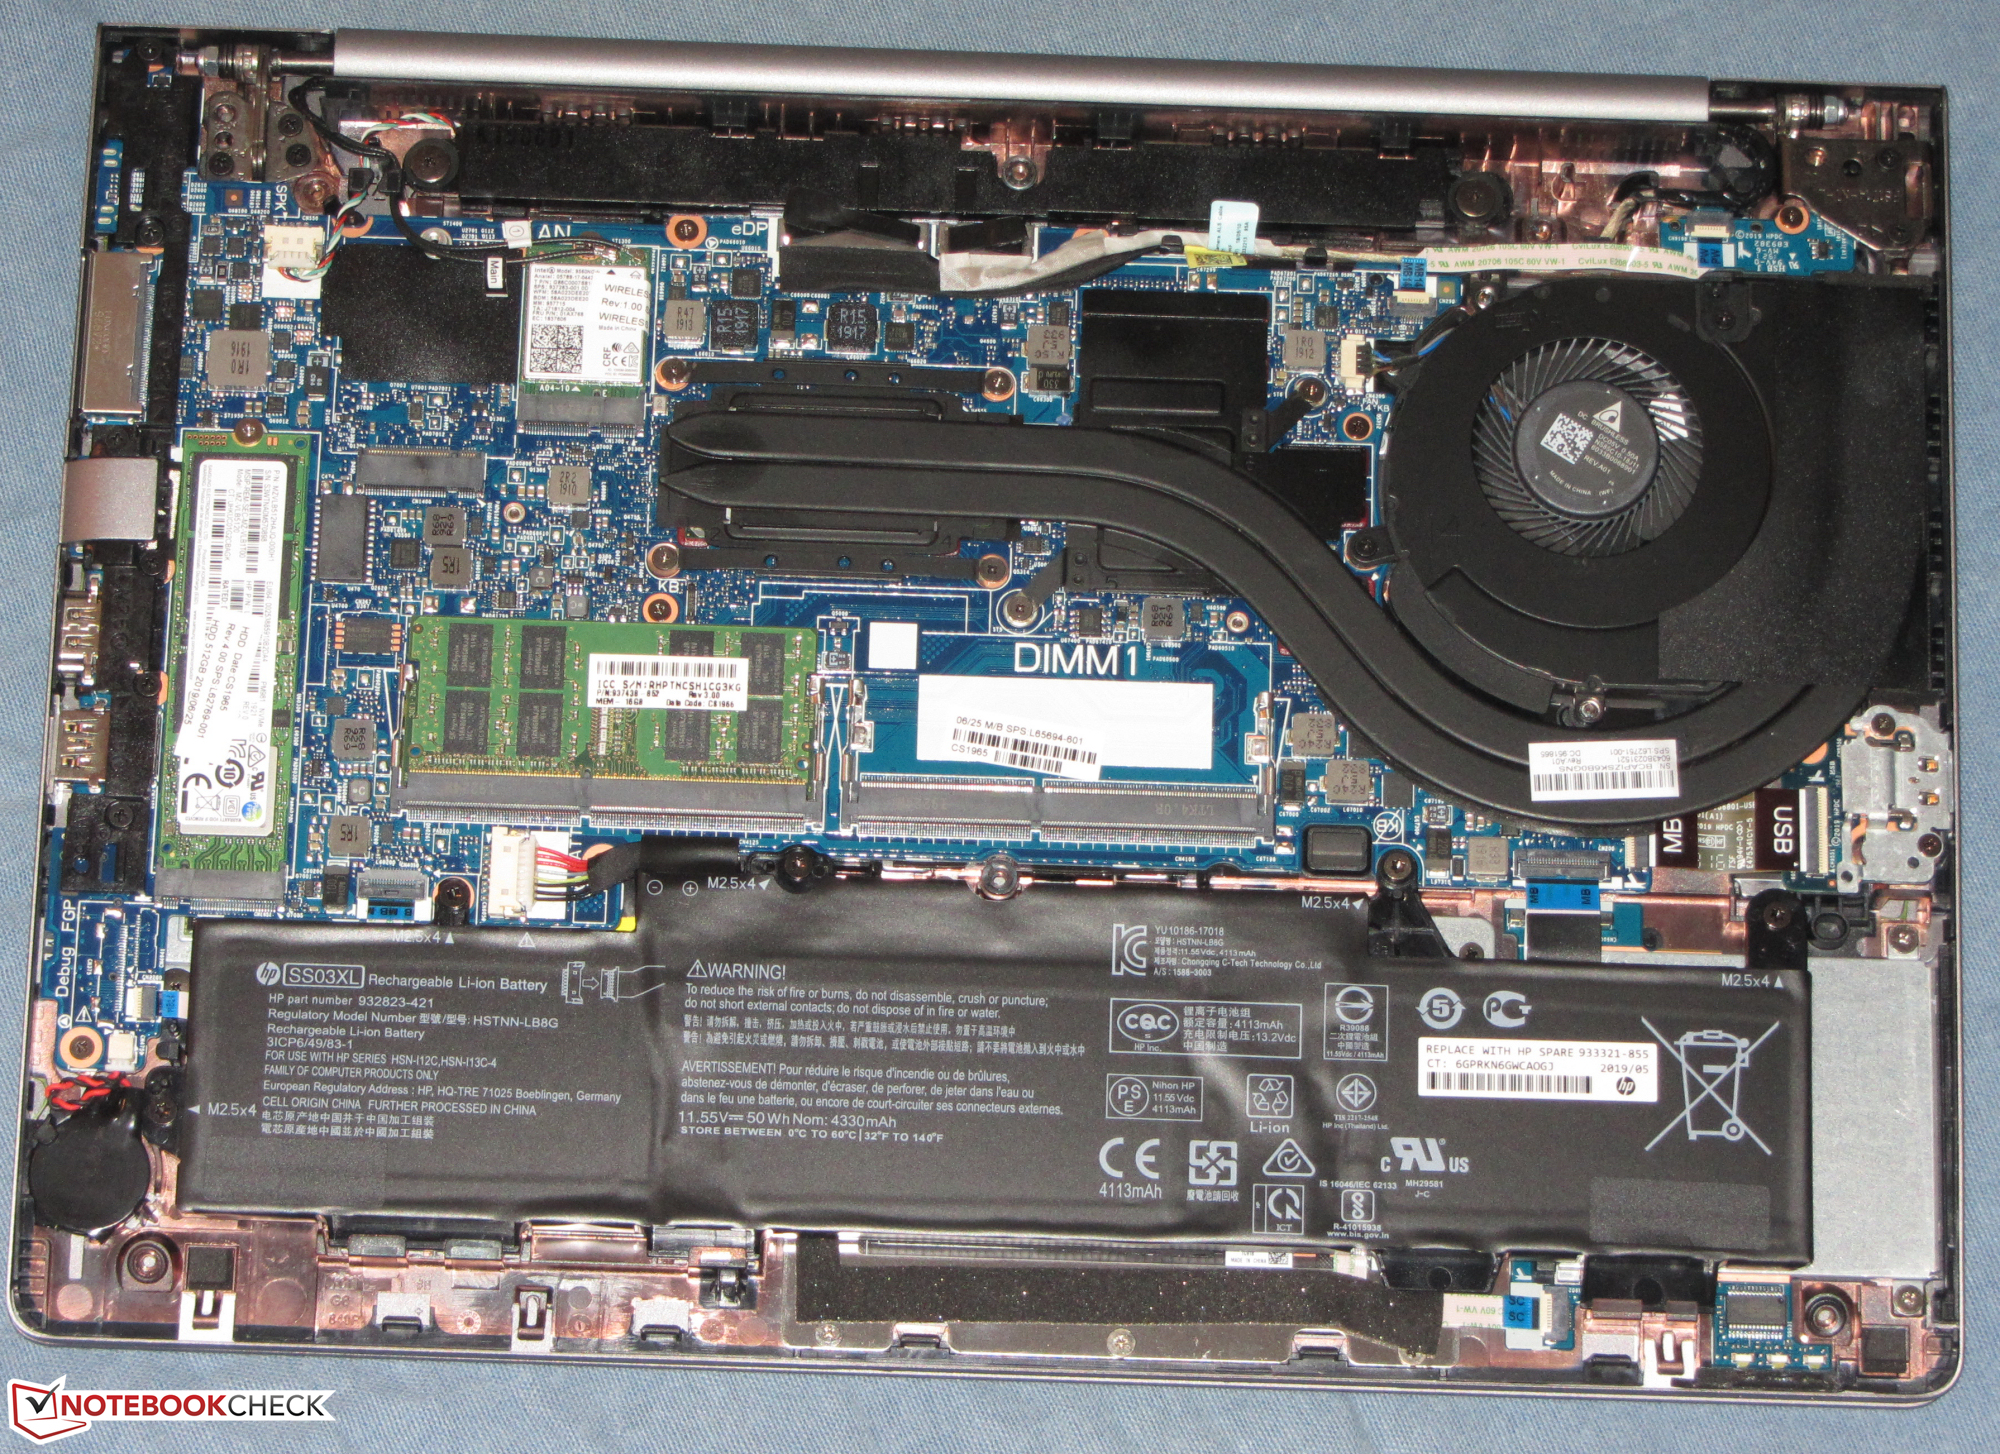
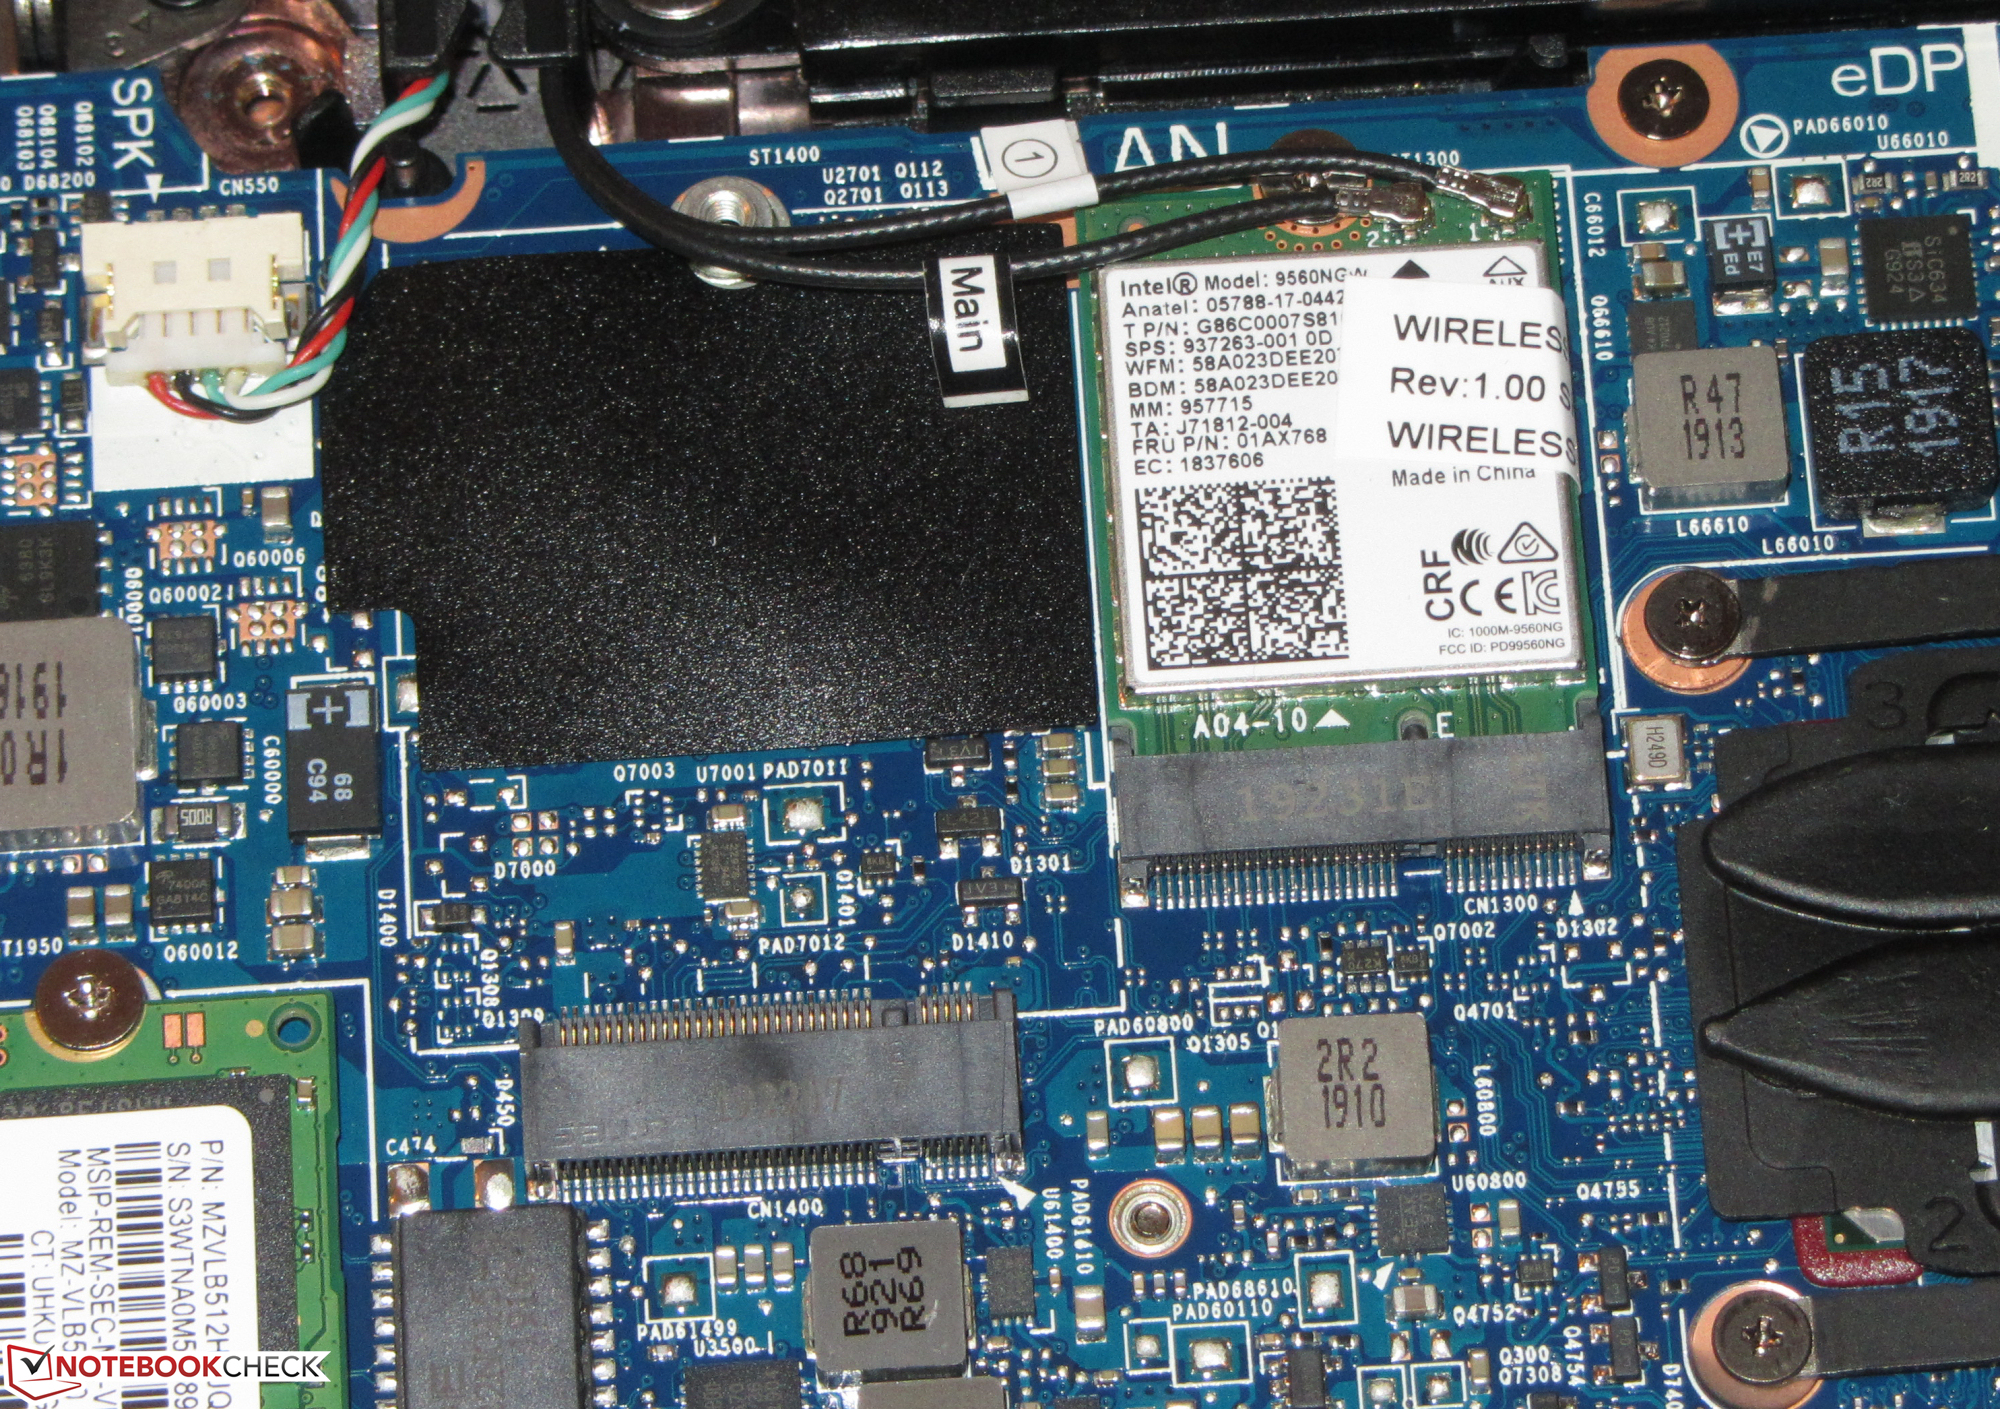
O sistema de refrigeração do portátil não produz muito ruído. Além disso, o desenvolvimento de calor do computador permanece muito dentro dos limites. Um SSD NVMe garante um sistema rápido. A troca do SSD seria possível, e isso exigiria a abertura da carcaça. O teclado (retroiluminado) deixou uma impressão muito boa e a duração da bateria é boa.
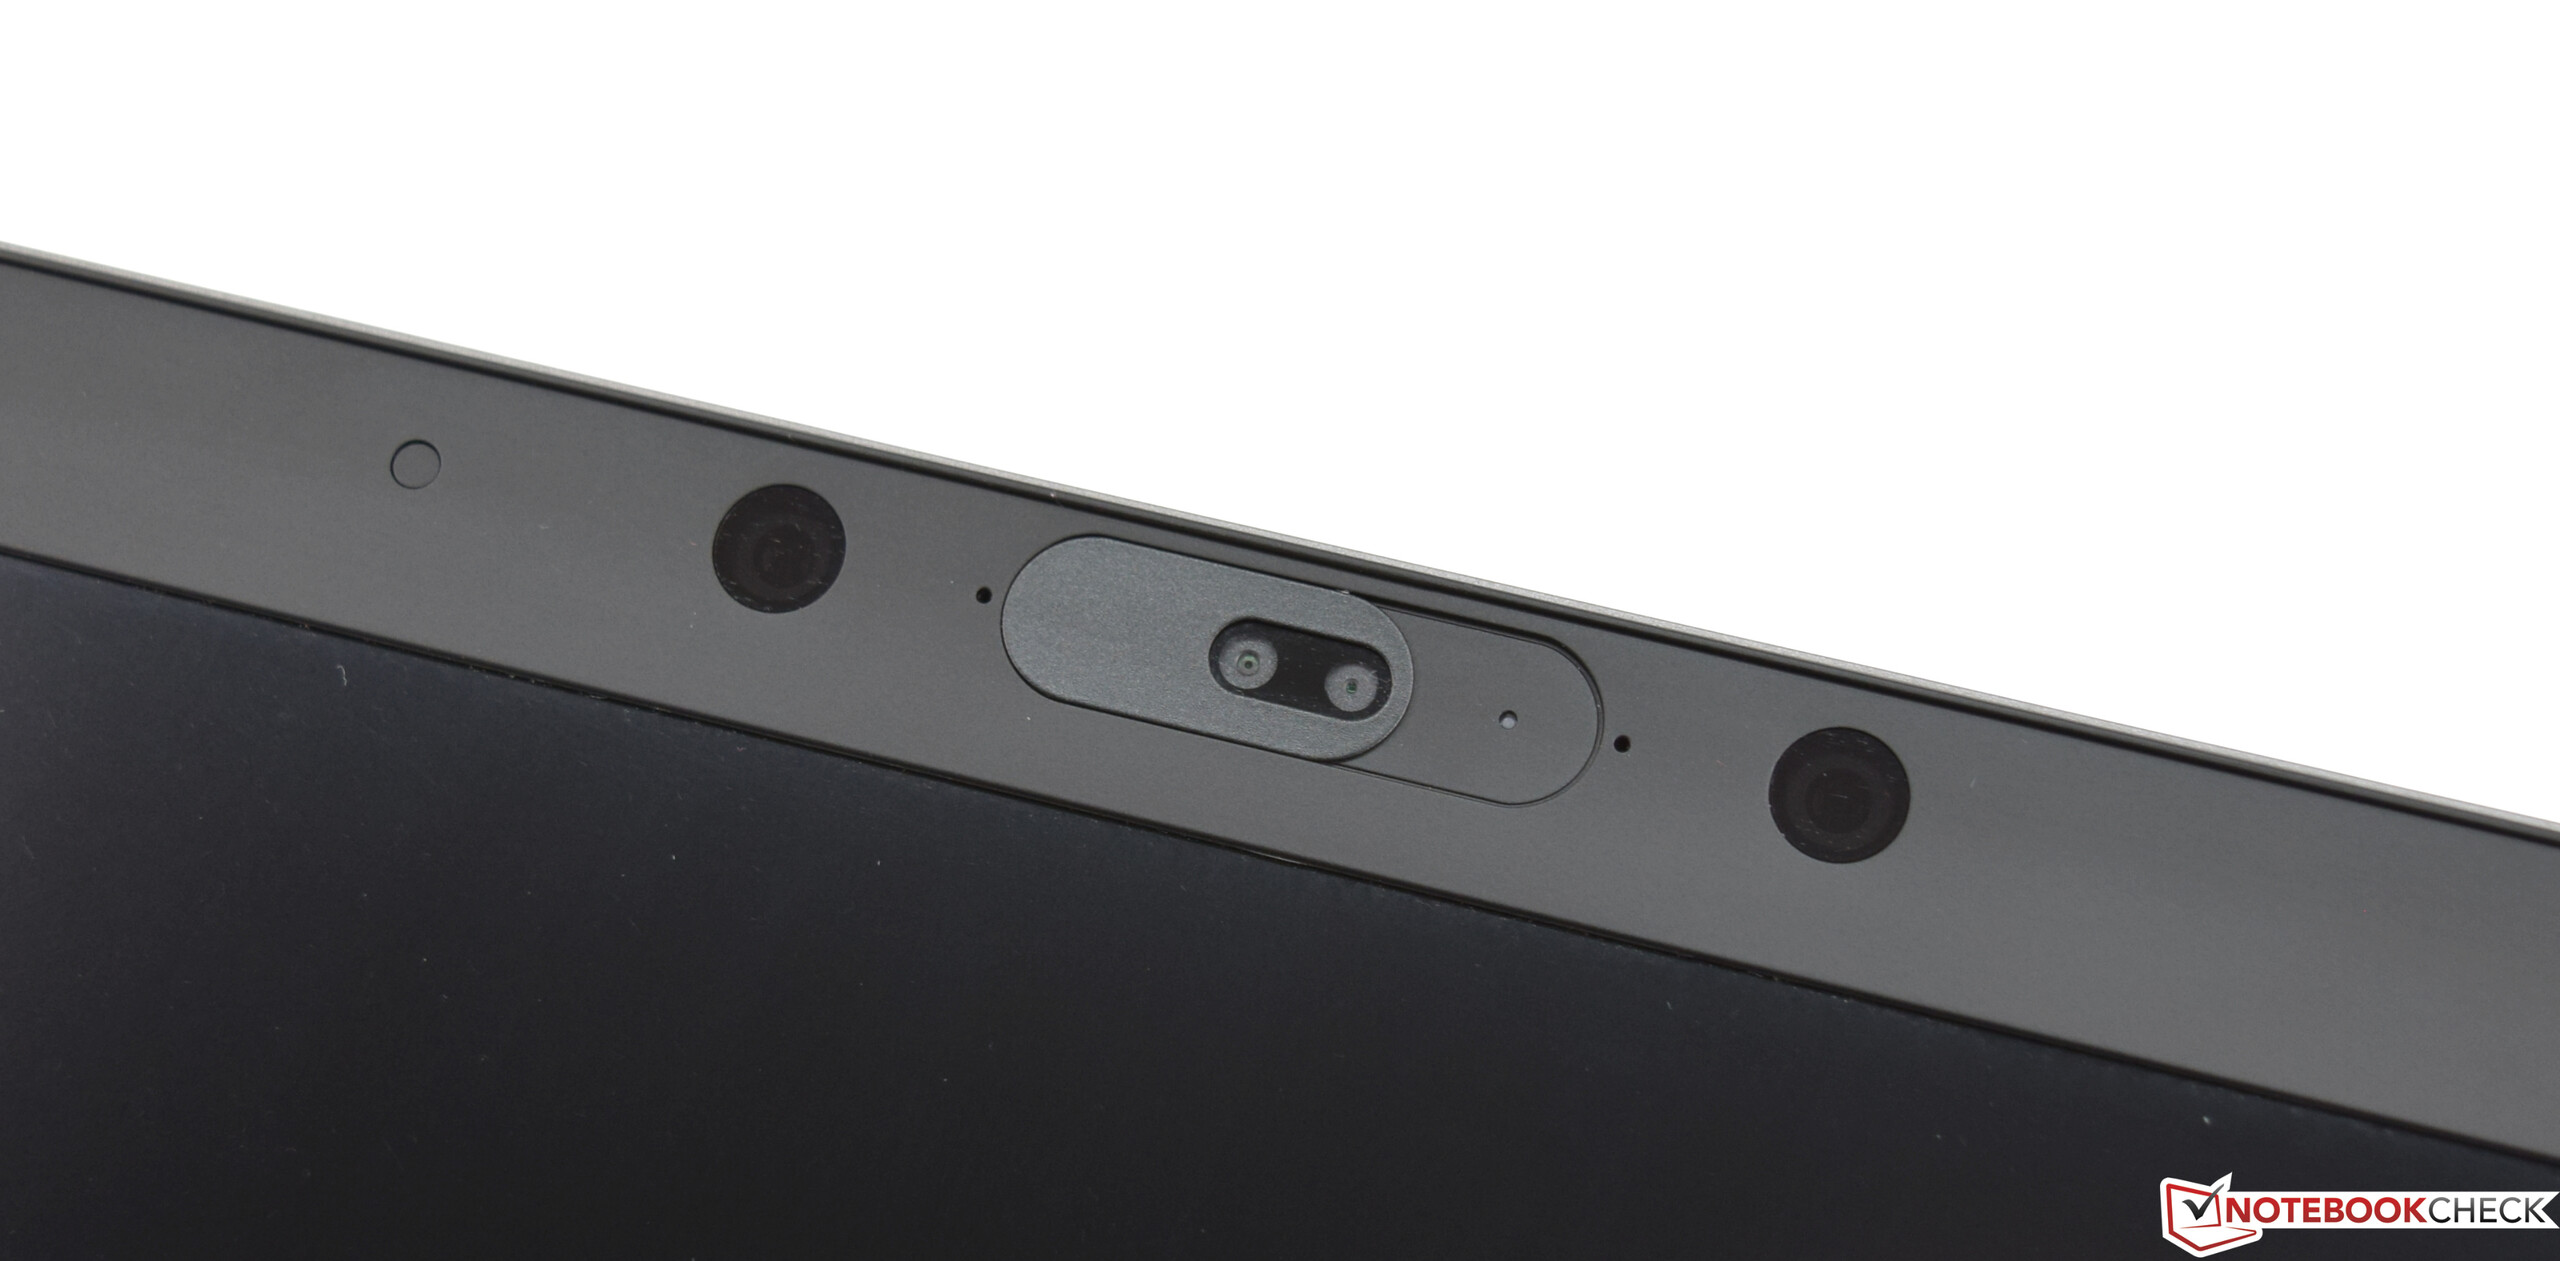
A tela IPS Full HD mate ganha pontos com alto brilho, ângulos de visão estáveis, bom contraste e excelente reprodução de cores. Além disso, o espaço de cores sRGB é coberto em quase 100%.
HP ZBook 14u G6 6TP71EA
- 10/06/2019 v7 (old)
Sascha Mölck